Introduction
Studies have been conducted in an attempt to
identify the genes causing hypertension using 2 strains of
hypertensive rats: spontaneously hypertensive rats (SHRs) and a
substrain derived from the SHRs, stroke-prone SHRs (SHRSP)
(1,2). Normotensive Wistar-Kyoto (WKY) rats
are normally used as controls in these studies (1). Since SHRs and SHRSP are not only
used as models of essential hypertension and stroke, but also as
models of attention-deficit hyperactivity disorder (ADHD), it is
expected that using these rats, it is possible identify the genes
related not only to hypertension and stroke, but also to ADHD
(3).
In our previous studies, we investigated gene
expression profiles in the adrenal glands (4), and subsequently in the brain
(5). Since the kidneys are
logical candidate organs for studying hypertension due to their
direct influence on body fluids and on the functions of the
endocrine, cardiovascular and sympathetic nervous systems, in the
present study, we aimed to investigate gene expression profiles in
the kidneys. Since the association between kidney function and
blood pressure is known to be influenced by numerous intrinsic and
extrinsic factors, such as the renin-angiotensin system and
catecholamine and aldosterone hormones (6), we compared gene expression profiles
in the kidneys of SHRs and WKY rats and also between SHRSP and
SHRs, when the rats were at 3 and 6 weeks old, a period in which
rats are considered to be in a pre-hypertensive state. We isolated
a total of 232 unique genes showing more than a 4-fold increase or
less than a 4-fold decrease in expression.
After classifying these 232 genes into 4 groups
according to their expression profiles, candidate genes were
selected as significantly enriched genes, and categorized with Gene
Ontology (GO) terms using the Database for Annotation,
Visualization and Integrated Discovery (DAVID) web tools (7,8).
Candidate genes were also selected using Ingenuity Pathway Analysis
(IPA). The IPA path explorer tool revealed that B-cell CLL/lymphoma
6 (Bcl6) (9–13) and SRY (sex determining region
Y)-box 2 (Sox2) (14,15) were possible candidate genes that
trigger hypertension in SHRs. Moreover, our findings revealed that
angiotensinogen (Agt), angiotensin II receptor-associated
protein (Agtrap) (16–18) and apolipoprotein H (Apoh)
(19) played pivotal roles among
SHRSP-specific genes.
Materials and methods
Animals, RNA extraction, microarray
design, microarray analysis and microarray data analysis, reverse
transcription-quantitative polymerase chain reaction (RT-qPCR),
DAVID and IPA
The details of these procedures have been described
in our previous studies [Yamamoto et al (4) and Yoshida et al (5)].
Animals
Three strains of rat, SHR/Izm, SHRSP/Izm and
WKY/Izm, were provided by the Disease Model Cooperative Research
Association, Kyoto, Japan. Three-week-old rats were purchased and
maintained for 2 days in our animal facility and were used as
3-week-old rats. Five-week-old rats were purchased and, after being
maintained for 1 week in our animal facility, were used as
6-week-old rats.
RNA extraction
Briefly, total RNA was purified using a miRNeasy kit
(Qiagen, Hilden, Germany) according to the manufacturer's
instructions.
Microarray design
Expression profiling was generated using a 4x44K
whole rat genome oligo microarray version 3.0 G2519F (Agilent
Technologies Inc., Santa Clara, CA, USA). Eighteen microarray
analyses as 1 color experiment were performed using the WKY rats,
SHRs, and SHRSP at 3 and 6 weeks old as biological triplicates.
Each gene expression profile was compared between the SHRs and WKY
rats and also between the SHRSP and SHRs.
Microarray analysis
Total RNA (200 ng) was reverse transcribed into
double-stranded cDNA by the AffinityScript Multiple Temperature
Reverse Transcriptase (Agilent Technologies Inc.) and amplified.
The resulting cDNA was used for in vitro transcription by
T7-polymerase and labeled with cyanine-3-labeled cytosine
triphosphate (Perkin-Elmer, Wellesley, MA, USA) using a Low Input
Quick Amp Labeling kit (Agilent Technologies Inc.). After being
labeled and fragmented, each cRNA sample was hybridized on Agilent
4×44K whole rat genome arrays (Agilent Design #028282). After
washing, the slides were scanned using an Agilent Microarray
Scanner (G2505C; Agilent Technologies Inc.). Feature Extraction
software (version 10.5.1.1) was used to convert the images into
gene expression data.
Microarray data analysis
Raw data were imported into Subio Platform version
1.12 (Subio Inc., Kagoshima, Japan) and raw intensity data were
normalized to the 75th percentile intensity of probes above
background levels (gIsWellAbove=1). SHR- and SHRSP-specific genes
were defined as those with signal ratios with more than a 4.0-fold
increase or less than a 4.0-fold decrease in expression. Raw data
have been accepted in the Gene Expression Omnibus (GEO, accession
no. GSE41453).
RT-qPCR
To validate the results obtained by the microarray
analysis, 11 enriched genes were randomly selected from 39 enriched
unique genes, and RT-qPCR was performed under 15 different
experimental conditions. Statistical comparisons between the
microarray and RT-qPCR data were performed using Spearman's rank
correlation test.
DAVID web tool analysis
Annotation enrichment analysis was performed using
the DAVID (http://david.abcc.ncifcrf.gov/) web tool (version 6.7,
2010) (7,8) with GenBank IDs bearing Entrez Gene
ID (Table I, unique genes
identified). This web-based resource provides a set of functional
annotation tools for the statistical enrichment of genes
categorized into GO terms. We used the GO FAT category, which
filtered out very broad GO terms to identify statistically enriched
functional groups. The annotated gene and protein symbols were
written in italic and regular fonts, respectively.
 | Table IComparison of the number and
classification of SHR- and SHRSP-specific probes between the 2
pairs of rat strains. |
Table I
Comparison of the number and
classification of SHR- and SHRSP-specific probes between the 2
pairs of rat strains.
| SHRs/WKY rats
| SHRSP/SHRs
| All |
|---|
| G-1 3 weeks
old | G-2 6 weeks
old | G-3 3 weeks
old | G-4 6 weeks
old |
|---|
| All probes
isolated | 87 | 156 | 57 | 53 | 353 |
| Mapped probes | 72 | 102 | 35 | 32 | 241 |
| Unmapped
probes | 15 | 54 | 22 | 21 | 112 |
| Unique genes
identified | 69 | 96 | 35 | 32 | 232 |
| Upregulated | 44 | 51 | 18 | 19 | 132 |
| Downregulated | 25 | 45 | 17 | 13 | 100 |
| Enriched GO
terms | 3 | 4 | 2 | 2 | 11 |
| Enriched
genes | 26 | 24 | 6 | 5a | 61 |
IPA
IPA software (IPA®; Qiagen Redwood City,
CA, USA, http://www.qiagen.com/ingenuity) was applied to
microarray analyses that were conducted to provide functionality
for the interpretation of the gene expression data. IPA was
performed with Agilent probe IDs bearing Entrez Gene ID as an input
for data (Table I, mapped
probes). This web tool was used to overlay functions and diseases,
and to categorize SHR- and SHRSP-specific genes according to
disease-related or functional annotations. It identified the
biological functions and/or diseases in the Ingenuity Knowledge
Base (Spring 2014 version) that were the most significant to each
of the category sets. The probability of the assignment was
expressed by a P-value calculated using the right-tailed Fisher's
exact test. The path explorer tool was also used to identify
relevant interactions among SHR- and SHRSP-specific genes and to
identify the shortest literature-supported paths between genes.
IPA was performed using the IPA database (Spring
2014 release of IPA) and the probe IDs of each gene. The data
obtained with DAVID were based on the database (version 6.7, 2010)
and GenBank IDs of each gene. Since the renewal dates of these two
databases were different, small differences were observed between
these two annotation results.
Results
Isolation and classification of SHR- and
SHRSP-specific genes
We compared gene expression profiles between the
SHRs and WKY rats and also between the SHRSP and SHRs, at 3 and 6
weeks of age, and isolated SHR- and SHRSP-specific genes using
genome-wide microarray technology. Since we expected the expression
of candidate genes to be regulated before elevations in blood
pressure (BP), i.e., in the pre-hypertensive period, we examined
the expression profiles of each probe using RNA samples prepared
from the kidneys, and isolated a total of 353 SHR- and
SHRSP-specific probes showing more than a 4-fold increase or less
than a 4-fold decrease in expression (Table I).
We classified the 353 probes into 4 groups, from G-1
to G-4 (Table I). G-1 probes were
isolated from the rats at 3 weeks of age and contained 87
SHR-specific probes. Their expression profiles were displayed as a
heatmap using the Subio Platform (Fig. 1). These 87 probes corresponded to
69 unique genes, 44 of which showed more than a 4-fold increase and
25 showed less than a 4-fold decrease in expression (Table I). G-2 contained 96 SHR-specific
genes isolated from the rats at 6 weeks of age, G-3 contained 35
SHRSP-specific genes isolated from the rats at 3 weeks of age, and
G-4 contained 32 SHRSP-specific genes isolated from the rats at 6
weeks of age (Table I).
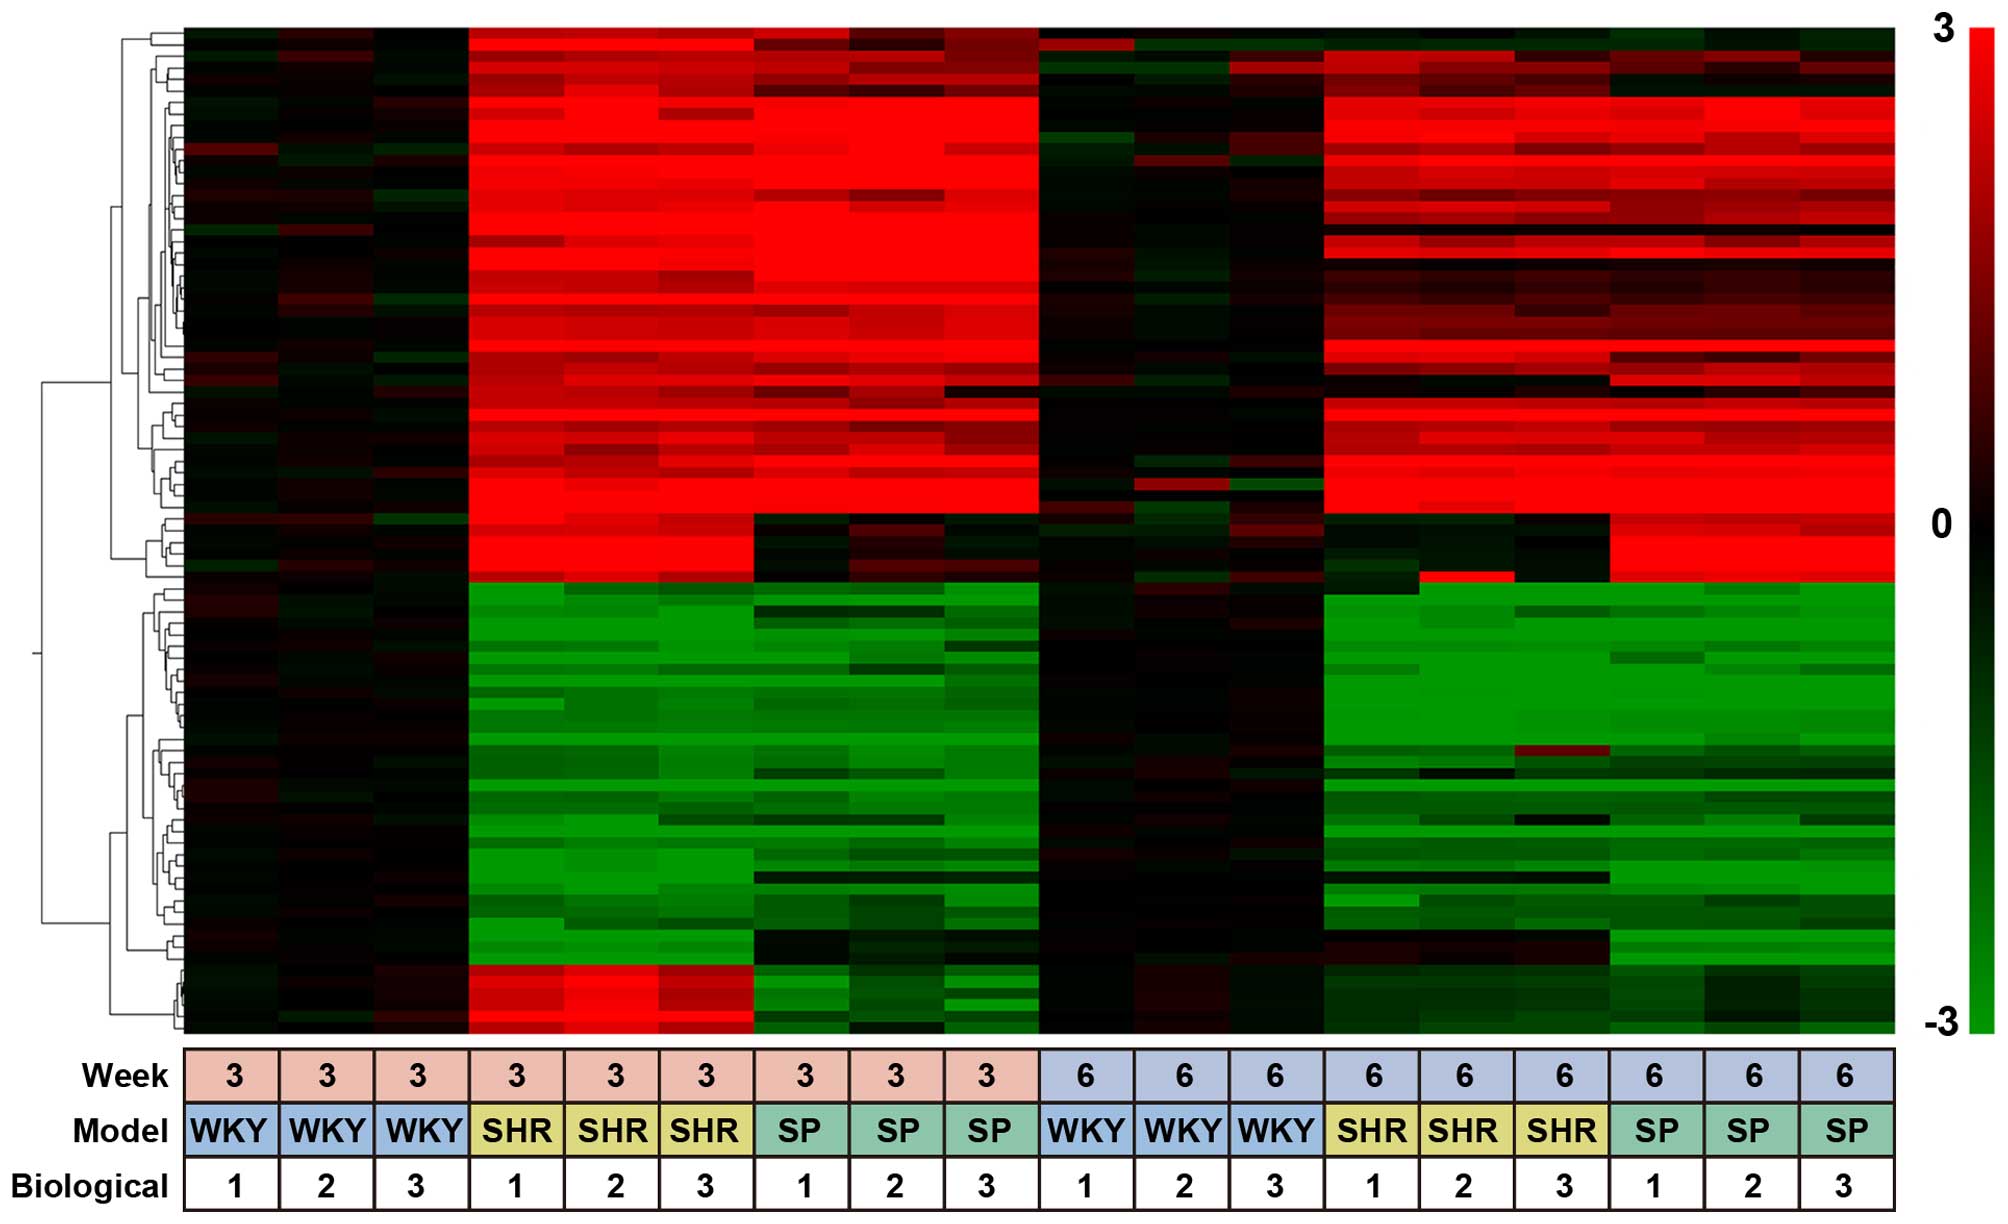 | Figure 1Heatmap of SHR- and SHRSP-specific
probes. A heat map of SHR- and SHRSP-specific probes isolated from
the kidneys of 3- and 6-week-old rats. Data were obtained with 353
probes for 3 rat strains, WKY rats, SHRs and SHRSP, under 18
different experimental conditions (3 different rat strains, 2
different rat ages, and triplicate experiments). The data obtained
with G-1 probes, i.e., 87 out of 353 probes (Table I), were clustered based on their
biological function and expression profiles using a hierarchical
clustering program and Spearman's rank correlation. The values used
for clustering were obtained by microarray experiments as described
in the Materials and methods. The color bar at the right side of
the panel indicates the log2 ratio for SHRs and SHRSP at 3 or 6
weeks of age vs. WKY rats at 3 or 6 weeks of age. The bottom panel
(small boxes) indicates the experimental conditions, i.e., examined
at 3 or 6 weeks of age, 3 different rat strains, and triplicate
experiments. SHRs, spontaneously hypertensive rats; SHRSP,
stroke-prone SHRs; WKY rats, Wistar-Kyoto rats. |
Categorization and enrichment of SHR- and
SHRSP-specific genes
Using the DAVID web tools, the candidate genes
causing hypertension, stroke and ADHD were selected from each group
as significantly enriched genes. We isolated a total of 61 enriched
genes consisting of 39 unique genes (Table II).
| Table IIClassification and enrichment of SHR-
and SHRSP-specific genes. |
Table II
Classification and enrichment of SHR-
and SHRSP-specific genes.
| Group | GO accession | GO term | P-value | Gene symbol | Genes (n) |
|---|
| G-1 | GO:0005576 | Extracellular
region | 2.21E-03 | Apoh, Ctgf,
Fibin, Gc, Gdnf, Hsd17b13, LOC360919, Nxph1, Serpina3m, Spink3,
Spock2, Ucma, Vegfb | 13 |
| GO:0008289 | Lipid binding | 3.41E-03 | Acox2, Apoh,
Cyp4a2, Gc, Rxrg, Snap91 | 6 |
| GO:0055114 | Oxidation
reduction | 8.72E-03 | Acox2,
Akr1c12l1, Cyp4a2, Dhrs7, Hsd17b13, Oxnad1, Rdh16 | 7 |
| G-2 | GO:0003013 | Circulatory system
process | 4.50E-05 | Ace, Agtrap,
Cftr, Ephx2, Glp1r, Kng2, Mylpf | 7 |
| GO:0055114 | Oxidation
reduction | 3.81E-03 | Acox2, Cyp24a1,
Cyp2c11, Dio2, Fmo2, Hsd17b13, Oxnad1, Rdh16, Rdh7 | 9 |
| GO:0010817 | Regulation of
hormone levels | 4.26E-03 | Ace, Dio2,
Glp1r, Rdh16, Smpd3 | 5 |
| GO:0006775 | Fat-soluble vitamin
metabolic process | 1.00E-02 | Cyp24a1, Gc,
Rdh16 | 3 |
| G-3 | GO:0003013 | Circulatory system
process | 1.46E-03 | Agt, Agtrap,
Ephx2, Kng2 | 4 |
| GO:0051918 | Negative regulation
of fibrinolysis | 5.94E-03 | Apoh,
Hrg | 2 |
| G-4 | GO:0051918 | Negative regulation
of fibrinolysis | 5.61E-03 | Apoh,
Hrg | 2 |
| GO:0030097 | Hemopoiesis | 3.93E-02 | Ccr1, Lilrb3l,
Zbtb16 | 3 |
In order to verify the results obtained from
microarray analysis, we randomly selected 11 out of the 39 genes
(Table III-A), performed 15
real-time RT-qPCR experiments (Table III-B), and compared the results
obtained with those of the micro-array experiments by applying
Spearman's rank correlation test. The results supported a
correlation between the reults of these two different experiments
as rs=0.814 with a two-tailed P-value <0.001.
| Table IIIValidation of microarray data with
RT-qPCR data. |
Table III
Validation of microarray data with
RT-qPCR data.
A, Primers used for
RT-qPCR experiments
|
|---|
| Gene symbol | Forward primer
(5′→3′) | Reverse primer
(5′→3′) |
|---|
| Acox2 |
AGGATGCCATCTTGTTAACCGAT |
GCCCACTCAAACAGGCGTTC |
| Apoh |
CCGGAATCTTAGAAAATGGAGTTGTACGCTA |
ACAAGCAAAGCCAATGGTGT |
| Cftr |
AGCACACTGAACATCACCGAAG |
CACCGTGGGGATCTTTACCAT |
| Cyp4a2 |
CTCCAGCCTGCTTACCCAT |
ATTCATGATGCCGATTGTCCCA |
| Gc |
CAAGAAATGTGTGCAGATTATTCCGAGA |
TCCTCAGTCGTTCCGCCAA |
| Gdnf |
AGTGACTCCAATATGCCCGAAG |
CCGCCGCTTGTTTATCTGGT |
|
Hsd17b13 |
CTGAACGTGTCTTAAAAGCTATAAACCGTA |
CACACGTCTCTGCACGCAAG |
|
LOC360919 |
TATTAGAGGAATATCTGCAAGGCATCGTCA |
ATCAATTCTACCGCGCTTGCT |
| Oxnad1 |
ACGTTACAAAACAGACGACCCAA |
AGTCTCTGCCGAAATGTGCTC |
| Rxrg |
CTGTCCCCAAAATGTGATGCTTG |
AGATCTCAGCCCCTTAAGTAGCAA |
| Ucma |
ACAACCGCCAAAACATATGACC |
TGCTTCTCTTCCCCAGTTGCT |
B, Data used for
Spearman's correlation test
|
|---|
| Group | GenBank ID | Gene symbol | FC (RT-qPCR) | FC
(microarray) |
|---|
| G-1 | NM_001009626 | Apoh | −10.236 | −61.982 |
| G-1 | NM_001044770 | Cyp4a2 | 4.808 | 12.786 |
| G-1 | NM_012564 | Gc | 2.438 | 7.929 |
| G-1 | NM_019139 | Gdnf | −1.036 | −5.658 |
| G-1 | NM_001009684 |
Hsd17b13 | −2.432 | −9.747 |
| G-1 | NM_001108356 |
LOC360919 | −1.252 | −5.247 |
| G-1 | NM_031765 | Rxrg | −3.023 | −10.778 |
| G-1 | NM_001106121 | Ucma | 2.370 | 7.026 |
| G-2 | NM_145770 | Acox2 | 2.908 | 7.567 |
| G-2 | NM_031506 | Cftr | 5.125 | 6.202 |
| G-2 | NM_012564 | Gc | 3.866 | 7.719 |
| G-2 | NM_001009684 |
Hsd17b13 | −2.097 | −11.823 |
| G-2 | NM_001107295 | Oxnad1 | −1.199 | 23.616 |
| G-3 | NM_001009626 | Apoh | 9.843 | 51.420 |
| G-4 | NM_001009626 | Apoh | −8.046 | −69.883 |
A total of 69 G-1 genes included 26 enriched genes
categorized with 3 GO terms: i) GO:0005576 (extracellular region);
ii) GO:0008289 (lipid binding); and iii) GO:0055114 (oxidation
reduction) (Table II, G-1). A
total of 96 G-2 genes included 24 enriched genes categorized with 4
GO terms: i) GO:0003013 (circulatory system process); ii)
GO:0055114 (oxidation reduction); iii) GO:0010817 (regulation of
hormone levels); and iv) GO:0006775 (fat-soluble vitamin metabolic
process) (Table II, G-2).
A total of 35 G-3 genes included 6 enriched genes
categorized with 2 GO terms: i) GO:0003013 (circulatory system
process); and ii) GO:0051918 (negative regulation of fibrinolysis)
(Table II, G-3). A total of 32
G-4 genes included 5 enriched genes categorized with 2 GO terms: i)
GO:0051918 (negative regulation of fibrinolysis) and ii) GO:0030097
(hemopoiesis) (Table II,
G-4).
Although 26 enriched G-1 genes and 5 G-4 genes did
not include genes categorized with circulatory system process, 24
enriched G-2 genes included 7 genes, and 6 enriched G-3 genes
included 4 genes categorized with circulatory system process,
respectively (Table II).
Functions and disease-related annotations
of SHR- and SHRSP-specific genes
As described above, the SHR- and SHRSP-specific
genes were classified into 4 groups (Table I), and then categorized based on
disease-related or functional annotations using IPA. The results
obtained are summarized in Table
IV, and identified among other significantly enriched
functional categories, such as ‘endocrine system disorders',
‘cardiovascular disease', ‘cardiovascular system development and
function' and ‘hereditary disorder' (Table IV).
| Table IVSHR- and SHRSP-specific genes
classified based on disease-related or functional annotations. |
Table IV
SHR- and SHRSP-specific genes
classified based on disease-related or functional annotations.
| Group | Category | Diseases or
functions annotation | P-value | Gene symbol | Genes (n) |
|---|
| G-1 | Endocrine system
disorders | Idiopathic
pancreatitis | 3.57E-06 | Cftr,
Spink3 | 2 |
| Digestive system
development and function | Abnormal morphology
of duodenum | 5.23E-06 | Cftr, Gdnf,
Spink3 | 3 |
| Cell cycle | Arrest in cell
cycle progression of pheochromocytoma cell lines | 7.44E-05 | Galr2,
Tp73 | 2 |
| Cellular growth and
proliferation | Cytostasis of bone
cancer cell lines | 9.91E-05 | Bcl6,
Tp73 | 2 |
| Cellular growth and
proliferation | Stimulation of
connective tissue cells | 1.51E-04 | Gdnf, Il9,
Sox2 | 3 |
| Lipid
metabolism | Abnormal quantity
of lipids | 2.60E-04 | Cftr, Cyp8b1,
Gc, Rdh16 | 4 |
| G-2 | Vitamin and mineral
metabolism | Metabolism of
vitamin | 8.05E-06 | Cyp24a1,
Cyp2c11, Gc, Rdh16, Rdh7 | 5 |
| Lipid
metabolism | Abnormal quantity
of lipid | 4.99E-05 | Cftr, Cyp24a1,
Cyp8b1, Gc, Rdh16 | 5 |
| Lipid
metabolism | Metabolism of
14,15-epoxyeicosatrienoic acid | 8.86E-05 | Cyp2c11,
Ephx2 | 2 |
| Reproductive system
disease |
Asthenozoospermia | 1.27E-04 | Cftr, Ros1,
Tekt3, Zbtb16 | 4 |
| Cardiovascular
disease | Hypertension | 7.27E-03 | Ace, Acox2,
Dio2, Fibin, Fmo2, Inmt, Myo16, Zbtb16 | 8 |
| G-3 | Lipid
metabolism | Quantity of
12-hydroxyeicosatetraenoic acid | 7.98E-07 | Agt, Cyp1a1,
Ephx2 | 3 |
| Cellular
movement | Infiltration by
dendritic cells | 1.56E-04 | Agt,
Hrg | 2 |
| Molecular
transport | Uptake of
norepinephrine | 2.67E-04 | Agt,
Agtrap | 2 |
| Cardiovascular
system development and function | Development of
cardiovascular system | 1.46E-03 | Agt, Apoh,
Ephx2, Hrg, Ryr1, Vegfb | 6 |
| G-4 | Hereditary
disorder | Huntington's
disease | 2.71E-05 | Banp, Ephx2,
Rbfox1, Rxrg, Ryr1, Zbtb16 | 6 |
| Skeletal and
muscular disorders | Skeletal muscle
spasticity | 3.70E-04 | Gabrr1,
Ryr1 | 2 |
| Carbohydrate
metabolism | Binding of
1,2-dioleoylphosphatidylserine | 7.70E-04 | Apoh | 1 |
| Cancer | Hypoxia of
malignant tumor | 7.70E-04 | Hrg | 1 |
| Cancer | Uterine serous
papillary cancer | 1.09E-03 | Micb, Nfe2l3,
Zbtb16 | 3 |
G-1 genes included 2 genes, cystic fibrosis
transmembrane conductance regulator (Cftr) and serine
peptidase inhibitor, Kazal type 3 (Spink3) categorized as
‘endocrine system disorders (idiopathic pancreatitis)' (Table IV, G-1) (20,21). G-2 genes included 8 genes:
angiotensin I converting enzyme (Ace), deiodinase,
iodothyronine, type II (Dio2), acyl-Coenzyme A oxidase 2
(Acox2), fin bud initiation factor homolog (Fibin),
flavin-containing monooxygenase 2 (Fmo2), indolethylamine
N-methyltransferase (Inmt), myosin XVI (Myo16) and
zinc finger and BTB domain containing 16 (Zbtb16)
categorized as ‘cardiovascular disease (hypertension)' (Table IV, G-2) (22–24). G-3 genes included 6 genes:
Agt, Apoh, epoxide hydrolase 2 (Ephx2),
histidine-rich glycoprotein (Hrg), ryanodine receptor 1
(Ryr1) and vascular endothelial growth factor B
(Vegfb) categorized as ‘cardiovascular system development
and function (development of cardiovascular system)' (Table IV, G-3) (25–30). G-4 genes included 6 genes: Btg3
associated nuclear protein (Banp), Ephx2, retinoid X
receptor gamma (Rxrg), Ryr1, RNA-binding protein
fox-1 homolog 1 (Rbfox1) and Zbtb16 categorized as
‘hereditary disorder (Huntington's disease)' (Table IV, G-4) (31–33).
Interactions among SHR-specific G-1 and
G-2 genes
Since our working hypothesis is that G-1 genes
include genes that regulate the expression of G-2 genes, we
examined the interactions between 69 G-1 and 96 G-2 genes using
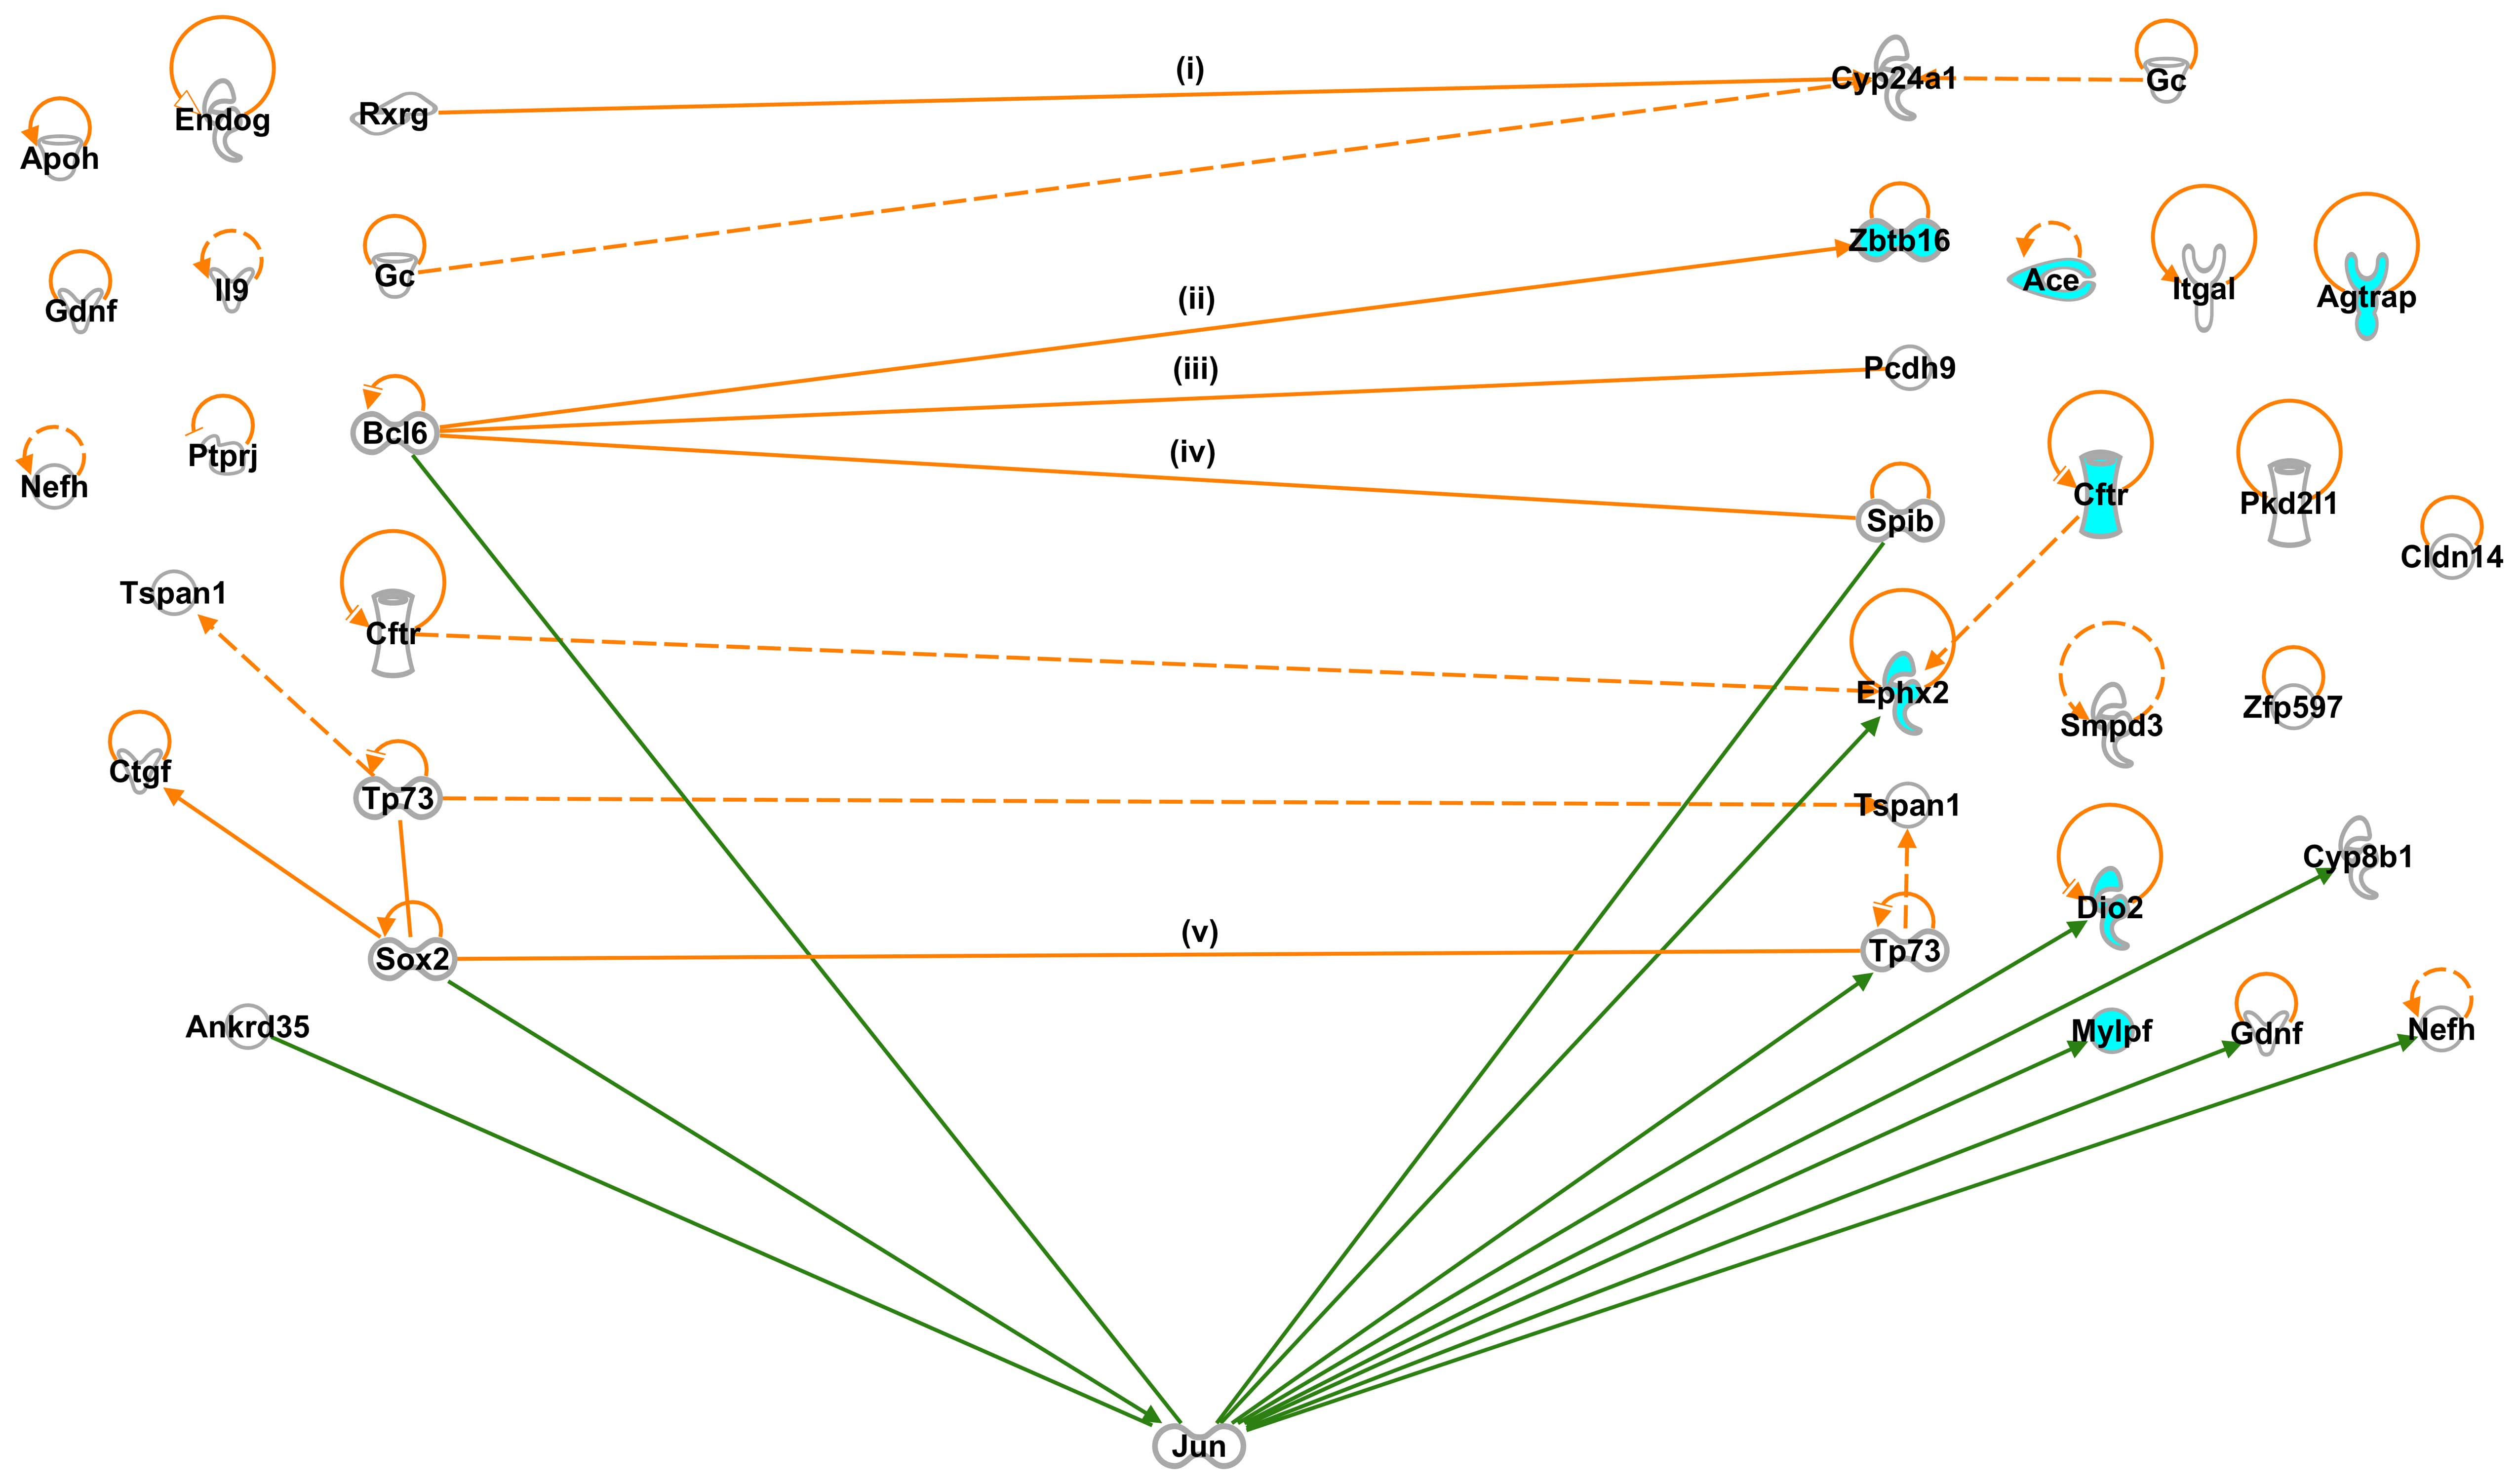
IPA, and found 5 direct and 3 indirect interactions (Table I and Fig. 2): Rxrg and group-specific
component (Gc) interacted with cytochrome P450 subfamily 24
(Cyp24a1) (34,35); Bcl6 interacted with the
following 3 genes: Zbtb16 (9,10),
protocadherin 9 (Pcdh9) (11) and Spi-B transcription factor
(Spib) (12); Cftr
interacted with Ephx2 (36); tumor protein p73 (Tp73) interacted
with tetraspanin 1 (Tspan1) (37); and Sox2 interacted with
Tp73 (14).
Other than the 8 interactions between the G-1 and
G-2 genes, we identified 3 interactions among the G-1 genes:
Tp73 interacted with Tspan1; Sox2 interacted
with Tp73; Sox2 interacted with connective tissue
growth factor (Ctgf) (38); and among the G-2 genes: Gc
interacted with Cyp24a1; Cftr interacted with
Ephx2; Tp73 interacted with Tspan1,
respectively. We also found 12 and 16 self-control genes among the
SHR-specific G-1 and G-2 genes, respectively (Fig. 2).
However, we did not detect any interactions between
the G-1 genes and the majority of BP-controlling G-2 genes, such as
Ace, Agtrap, Cftr, glucagon-like peptide 1
receptor (Glp1r), kininogen 2 (Kng2), myosin light
chain, phosphorylatable, fast skeletal muscle (Mylpf),
Acox2, Dio2, Fibin, Fmo2, Inmt
and Myo16 (Table II, G-2;
GO:0003013, circulatory system process and Table IV, G-2; cardiovascular disease:
hypertension).
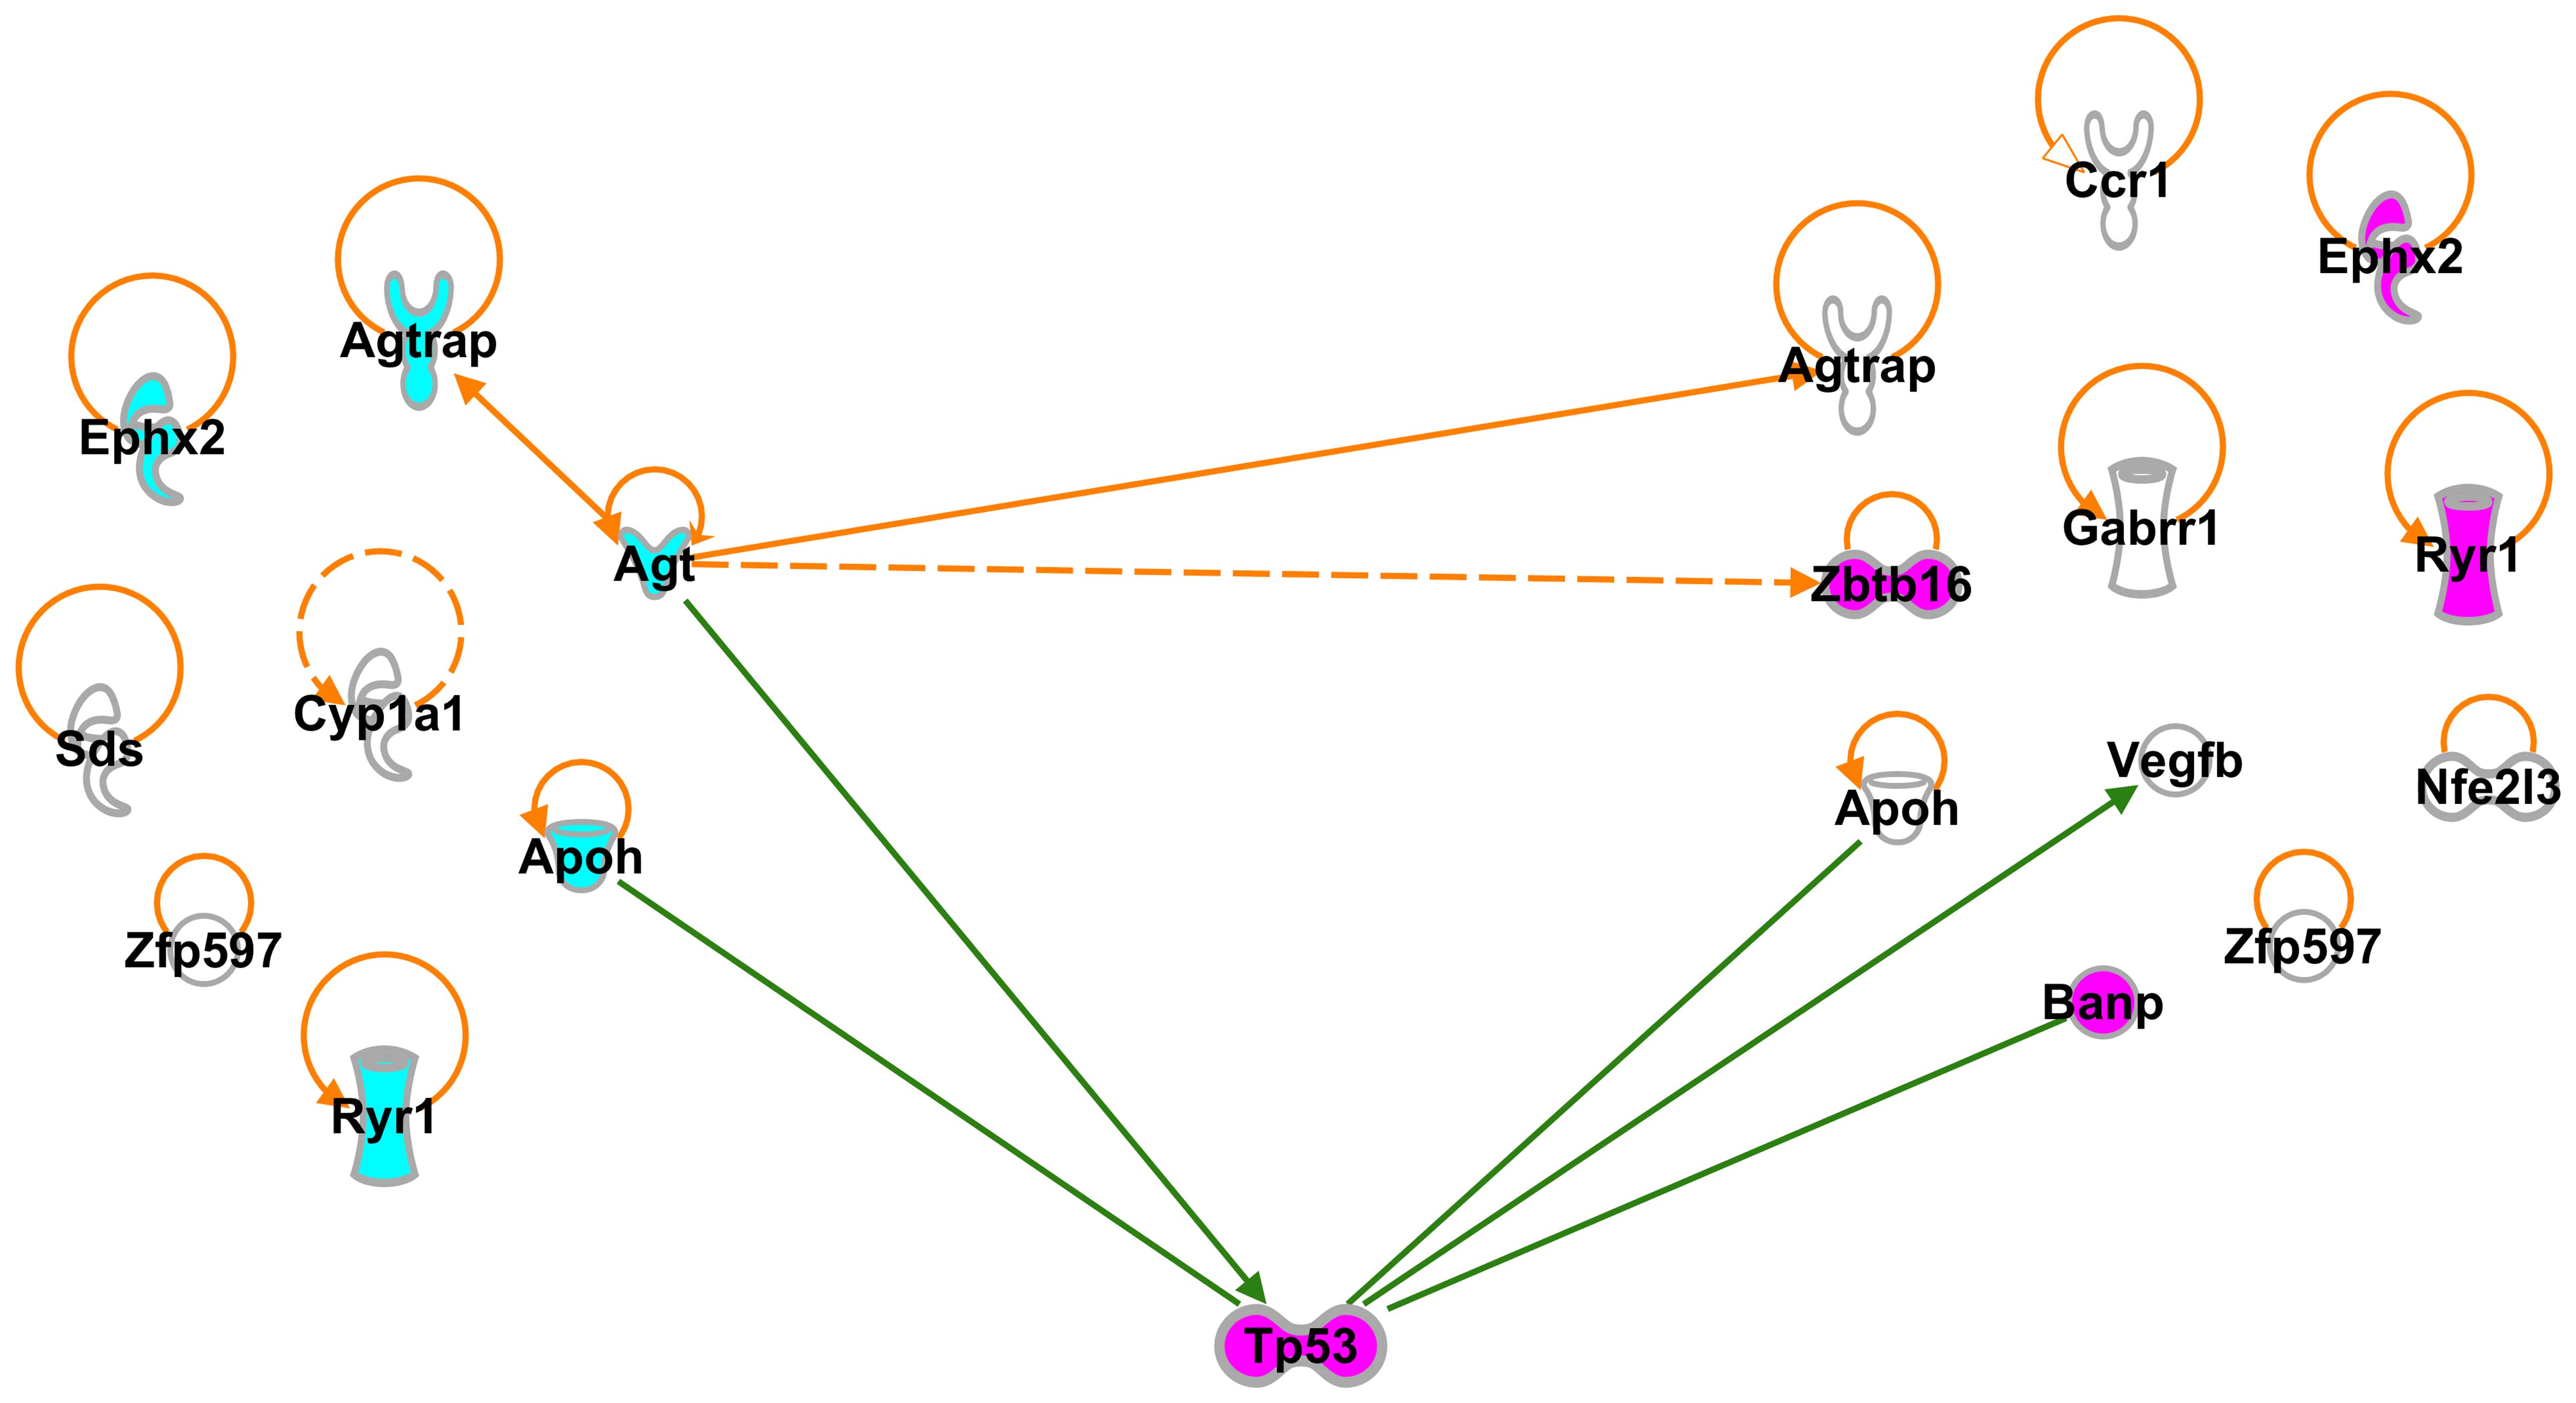
Interactions among SHRSP-specific G-3 and
G-4 genes
Since the enriched G-3 genes were expected to
regulate the expression of the G-4 genes, we examined the
interactions between 35 G-3 and 32 G-4 genes using IPA, and found
that Agt interacted not only with Agtrap (16,17) expressed in the rats at 3 and 6
weeks of age, but also indirectly interacted with Zbtb16
(39) expressed in the rats at 6
weeks of age (Fig. 3). In
addiiton, a total of 5 self-control genes, such as Agtrap,
Ephx2, Apoh, Ryr1 and zinc finger protein 597
(Zfp597) were found to be expressed in the SHRSP at 3 and 6
weeks of age (Fig. 3).
The description and reference of each gene are
summarized in Table V.
| Table VList of SHR- and SHRSP-specific
genes. |
Table V
List of SHR- and SHRSP-specific
genes.
| Group | GS | Description | GenBank ID | FC | P-value | (Refs.) |
|---|
| G-1 | Acox2 | Acyl-CoA oxidase 2,
branched chain | NM_145770 | 8.194 | 1.05E-06 | |
|
Akr1c12l1 | Aldo-keto reductase
family 1, member C12-like 1 | NM_001135744 | 4.772 | 1.11E-04 | |
| Ankrd35 | Ankyrin repeat
domain 35 | XM_001063190 | −4.364 | 9.02E-03 | (42) |
| Apoh | Apolipoprotein H
(β-2-glycoprotein I) | NM_001009626 | −61.982 | 2.15E-04 | |
| Bcl6 | B-cell CLL/lymphoma
6 | NM_001107084 | 4.010 | 4.99E-03 | (9–13) |
| Cftr | Cystic fibrosis
transmembrane conductance regulator | NM_031506 | 6.434 | 4.16E-03 | (20,36) |
| Ctgf | Connective tissue
growth factor | NM_022266 | 4.746 | 7.61E-04 | (38,40) |
| Cyp4a2 | Cytochrome P450,
family 4, subfamily a, polypeptide 2 | NM_001044770 | 12.786 | 6.75E-04 | |
| Cyp8b1 | Cytochrome P450,
family 8, subfamily b, polypeptide 1 | NM_031241 | 4.822 | 6.02E-04 | |
| Dhrs7 |
Dehydrogenase/reductase (SDR family)
member 7 | NM_001013098 | 14.138 | 1.16E-03 | |
| Endog | Endonuclease G | NM_001034938 | −4.151 | 2.54E-05 | |
| Fibin | Fin bud initiation
factor homolog (zebrafish) | NM_001025042 | 4.089 | 5.41E-03 | |
| Galr2 | Galanin receptor
2 | NM_019172 | −5.289 | 7.51E-03 | |
| Gc | Group-specific
component | NM_012564 | 7.929 | 2.12E-05 | (35) |
| Gdnf | Glial cell derived
neurotrophic factor | NM_019139 | −5.658 | 4.27E-04 | |
|
Hsd17b13 | Hydroxysteroid
(17-β) dehydrogenase 13 | NM_001009684 | −9.747 | 4.47E-05 | |
| Il9 | Interleukin 9 | NM_001105747 | −4.291 | 7.71E-04 | |
|
LOC360919 | Similar to
α-fetoprotein | NM_001108356 | −5.247 | 8.04E-06 | |
| Nefh | Neurofilament,
heavy polypeptide | NM_012607 | 4.214 | 8.78E-04 | |
| Nxph1 | Neurexophilin
1 | NM_012994 | 4.709 | 9.34E-03 | |
| Oxnad1 | Oxidoreductase
NAD-binding domain containing 1 | NM_001107295 | 27.732 | 3.78E-05 | |
| Ptprj | Protein tyrosine
phosphatase, receptor type, J | NM_017269 | −4.285 | 8.21E-05 | |
| Rdh16 | Retinol
dehydrogenase 16 (all-trans) | NM_199208 | 5.014 | 1.25E-03 | |
| Rxrg | Retinoid X receptor
gamma | NM_031765 | −10.778 | 1.92E-04 | (34) |
|
Serpina3m | Serine (or
cysteine) proteinase inhibitor, clade A, member 3M | XM_001067511 | 21.327 | 1.09E-05 | |
| Snap91 |
Synaptosomal-associated protein 91kDa | NM_031728 | 4.424 | 2.23E-04 | |
| Sox2 | SRY (sex
determining region Y)-box 2 | NM_001109181 | −7.694 | 1.17E-05 | (14,15,38) |
| Spink3 | Serine peptidase
inhibitor, Kazal type 3 | NM_012674 | 4.448 | 1.33E-03 | (21) |
| Spock2 | Sparc/osteonectin,
cwcv, and Kazal-like domains proteoglycan (testican) 2 | NM_001108533 | 7.515 | 5.69E-06 | |
| Tp73 | Tumor protein
p73 | NM_001108696 | 10.360 | 2.34E-05 | (14,37) |
| Tspan1 | Tetraspanin 1 | NM_001004236 | −6.728 | 4.26E-05 | (37) |
| Ucma | Upper zone of
growth plate and cartilage matrix associated | NM_001106121 | 7.026 | 1.06E-05 | |
| Vegfb | Vascular
endothelial growth factor B | NM_053549 | −340.226 | 2.71E-06 | |
| G-2 | Ace | Angiotensin I
converting enzyme | NM_012544 | −4.207 | 1.12E-05 | (22) |
| Acox2 | Acyl-CoA oxidase 2,
branched chain | NM_145770 | 7.567 | 1.56E-06 | (24) |
| Agtrap | Angiotensin II
receptor-associated protein | NM_001007654 | −23.157 | 2.68E-06 | |
| Cftr | Cystic fibrosis
transmembrane conductance regulator | NM_031506 | 6.202 | 1.03E-03 | (36) |
| Cldn14 | Claudin 14 | NM_001013429 | −6.099 | 7.47E-03 | |
| Cyp24a1 | Cytochrome P450,
family 24, subfamily a, polypeptide 1 | BC100059 | 4.799 | 1.60E-04 | (34,35) |
| Cyp2c11 | Cytochrome P450,
subfamily 2, polypeptide 11 | NM_019184 | 9.295 | 8.44E-03 | |
| Cyp8b1 | Cytochrome P450,
family 8, subfamily b, polypeptide 1 | NM_031241 | 38.029 | 2.17E-04 | (47) |
| Dio2 | Deiodinase,
iodothyronine, type II | NM_031720 | 5.290 | 1.47E-03 | (23,46) |
| Ephx2 | Epoxide hydrolase
2, cytoplasmic | NM_022936 | −10.816 | 1.56E-05 | (36,44) |
| Fibin | Fin bud initiation
factor homolog (zebrafish) | NM_001025042 | 6.062 | 7.32E-05 | (24) |
| Fmo2 | Flavin-containing
monooxygenase 2 | NM_144737 | 5.407 | 5.45E-05 | (24) |
| Gc | Group-specific
component | NM_012564 | 7.719 | 6.18E-03 | (35) |
| Gdnf | Glial cell derived
neurotrophic factor | NM_019139 | −6.710 | 2.03E-08 | (49) |
| Glp1r | Glucagon-like
peptide 1 receptor | NM_012728 | −4.181 | 1.03E-03 | |
|
Hsd17b13 | Hydroxysteroid
(17-β) dehydrogenase 13 | NM_001009684 | −11.823 | 8.23E-07 | |
| Inmt | Indolethylamine
N-methyltransferase | NM_001109022 | 5.467 | 3.43E-06 | (24) |
| Itgal | Integrin αL | NM_001033998 | 5.943 | 6.94E-05 | |
| Kng2 | Kininogen 2 | NM_012741 | 8.966 | 3.27E-03 | |
| Mylpf | Myosin light chain,
phosphorylatable, fast skeletal muscle | NM_012605 | 6.139 | 7.29E-05 | (48) |
| Myo16 | Myosin XVI | NM_138893 | −19.184 | 9.42E-05 | (24) |
| Nefh | Neurofilament,
heavy polypeptide | NM_012607 | 4.107 | 3.37E-06 | (50) |
| Oxnad1 | Oxidoreductase
NAD-binding domain containing 1 | NM_001107295 | 23.616 | 1.91E-06 | |
| Pcdh9 | Protocadherin
9 | NM_001191688 | −6.438 | 2.96E-03 | (11) |
| Pkd2l1 | Polycystic kidney
disease 2-like 1 | NM_001106352 | −6.185 | 4.40E-05 | |
| Rdh16 | Retinol
dehydrogenase 16 (all-trans) | NM_199208 | 6.886 | 1.48E-05 | |
| Rdh7 | Retinol
dehydrogenase 7 | NM_133543 | 5.287 | 3.08E-04 | |
| Ros1 | ROS proto-oncogene
1, receptor tyrosine kinase | NM_012874 | −10.407 | 4.25E-05 | |
| Smpd3 | Sphingomyelin
phosphodiesterase 3, neutral membrane | NM_053605 | 7.269 | 5.09E-04 | |
| Spib | Spi-B transcription
factor (Spi-1/PU.1 related) | NM_001024286 | −4.252 | 3.10E-04 | (12,43) |
| Tekt3 | Tektin 3 | NM_001024739 | 4.718 | 9.84E-03 | |
| Tp73 | Tumor protein
p73 | NM_001108696 | 7.167 | 9.02E-03 | (14,37,45) |
| Tspan1 | Tetraspanin 1 | NM_001004236 | −5.135 | 1.29E-07 | (37) |
| Zbtb16 | Zinc finger and BTB
domain containing 16 | NM_001013181 | 12.123 | 2.98E-03 | (9,10,24) |
| Zfp597 | Zinc finger protein
597 | NM_153732 | 6.367 | 2.49E-06 | |
| G-3 | Agt | Angiotensinogen
(serpin peptidase inhibitor, clade A, member 8) | NM_134432 | 4.423 | 3.71E-04 | (16–18, 25,39) |
| Agtrap | Angiotensin II
receptor-associated protein | NM_001007654 | −37.832 | 2.17E-05 | (16,17) |
| Apoh | Apolipoprotein H
(β-2-glycoprotein I) | NM_001009626 | 51.420 | 2.89E-04 | (19,26) |
| Cyp1a1 | Cytochrome P450,
family 1, subfamily a, polypeptide 1 | NM_012540 | 6.820 | 6.72E-04 | |
| Ephx2 | Epoxide hydrolase
2, cytoplasmic | NM_022936 | −12.769 | 2.99E-05 | (27) |
| Hrg | Histidine-rich
glycoprotein | NM_133428 | 4.578 | 2.22E-05 | (28) |
| Kng2 | Kininogen 2 | NM_012741 | 4.436 | 4.58E-04 | |
| Ryr1 | Ryanodine receptor
1 (skeletal) | XM_008759293 | -4.021 | 1.77E-03 | (29) |
| Sds | Serine
dehydratase | NM_053962 | 6.414 | 5.51E-06 | |
| Vegfb | Vascular
endothelial growth factor B | NM_053549 | 273.620 | 2.85E-06 | (30) |
| Zfp597 | Zinc finger protein
597 | NM_153732 | 5.870 | 1.51E-04 | |
| G-4 | Agtrap | Angiotensin II
receptor-associated protein | NM_001007654 | 30.146 | 5.83E-07 | (16,17) |
| Apoh | Apolipoprotein H
(β-2-glycoprotein I) | NM_001009626 | −69.883 | 7.70E-04 | (19) |
| Banp | Btg3 associated
nuclear protein | NM_001106191 | −5.011 | 9.76E-06 | (31,51) |
| Ccr1 | Chemokine (C-C
motif) receptor 1 | NM_020542 | −4.607 | 6.91E-03 | |
| Ephx2 | Epoxide hydrolase
2, cytoplasmic | NM_022936 | 13.574 | 4.56E-06 | (31) |
| Gabrr1 | Gamma-aminobutyric
acid (GABA) A receptor, rho 1 | NM_017291 | 4.618 | 9.48E-03 | |
| Hrg | Histidine-rich
glycoprotein | NM_133428 | −5.193 | 4.95E-05 | |
| Lilrb3l | Leukocyte
immunoglobulin-like receptor, subfamily B (with TM and ITIM
domains), member 3-like | NM_001037357 | 6.280 | 3.48E-04 | |
| Micb | MHC class I
polypeptide-related sequence B | NM_001017468 | 5.071 | 2.74E-03 | |
| Nfe2l3 | Nuclear factor,
erythroid 2-like 3 | XM_231763 | −4.386 | 1.95E-04 | |
| Rbfox1 | RNA binding
protein, fox 1 homolog (C. elegans) 1 | NM_001106974 | 4.016 | 8.02E-04 | (32) |
| Rxrg | Retinoid X receptor
gamma | NM_031765 | −23.771 | 2.66E-06 | (31,33) |
| Ryr1 | Ryanodine receptor
1 (skeletal) | XM_008759293 | 6.837 | 1.84E-04 | (31) |
| Vegfb | Vascular
endothelial growth factor B | NM_053549 | −263.762 | 4.74E-07 | (52) |
| Zbtb16 | Zinc finger and BTB
domain containing 16 | NM_001013181 | −6.754 | 3.92E-04 | (32,39) |
| Zfp597 | Zinc finger protein
597 | NM_153732 | −6.243 | 3.99E-06 | |
Discussion
General considerations
The first aim of the present study was to identify
candidate genes that triggered hypertension in SHRs, the second was
to identify genes related to stroke-prone symptoms, and the third
was to identify genes related to ADHD. We compared gene expression
profiles between SHRs and WKY rats and also between SHRSP and SHRs
at 3 and 6 weeks of age, and isolated a total of 232 unique genes
showing more than a 4-fold increase or less than a 4-fold decrease
in expression as SHR- or SHRSP-specific genes (Table I). We expected a number of these
genes to be related to hypertension, susceptibility to stroke and
ADHD.
Interactions among SHR-specific G-1 and
G-2 genes
The IPA path explorer tool suggested the presence of
5 direct interactions between 69 G-1 and 96 G-2 genes (Fig. 2): i) Rxrg interacted with
Cyp24a1 (34); Bcl6
interacted with the following 3 genes: ii) Zbtb16 (9,10),
iii) Pcdh9 (11) and iv)
Spib (12); and v)
Sox2 interacted with Tp73 (14).
Rxrg and Cyp24a1: Rxrg encodes
a member of the retinoid X receptor (Rxr) family of nuclear
receptors, which are involved in mediating the antiproliferative
effects of retinoic acid. This receptor forms dimers with retinoic
acid, thyroid hormone and vitamin D receptors, increasing both DNA
binding and transcriptional function on their respective response
elements. Cyp24a1 encodes a member of the cytochrome P450
superfamily of enzymes. Cytochrome P450 proteins are monooxygenases
that catalyze a number of reactions involved in drug metabolism and
the synthesis of cholesterol, steroids and other lipids. By
regulating vitamin D3 levels, this enzyme plays a role in calcium
homeostasis and the vitamin D endocrine system.
Bcl6 and Zbtb16: Bcl6 encodes a
zinc finger transcription factor and contains an N-terminal POZ
domain. This protein acts as a sequence-specific repressor of
transcription, and has been shown to modulate the transcription of
START-dependent IL-4 responses in B cells. This protein can
interact with various POZ-containing proteins that function as
transcription corepressors. Zbtb16 is a member of the
Kruppel C2H2-type zinc-finger protein family and encodes a zinc
finger transcription factor that contains nine Kruppel-type zinc
finger domains at the carboxyl terminus. This protein is located in
the nucleus, is involved in cell cycle progression, and interacts
with a histone deacetylase.
Bcl6 and Pcdh9: Pcdh9 encodes a
member of the protocadherin family, and of transmembrane proteins
containing cadherin domains. These proteins mediate cell adhesion
in neural tissues in the presence of calcium. The encoded protein
may be involved in signaling at neuronal synaptic junctions.
Bcl6 and Spib: Spib encodes a
transcriptional activator that binds to the PU-box (5′-GAGGAA-3′)
and acts as a lymphoid-specific enhancer.
Sox2 and Tp73: Sox2 encodes a
member of the SRY-related HMG-box (SOX) family of transcription
factors involved in the regulation of embryonic development and in
the determination of cell fate. The product of this gene is
required for stem-cell maintenance in the central nervous system,
and also regulates gene expression in the stomach. Tp73
encodes tumor protein p53, which responds to diverse cellular
stresses to regulate the target genes that induce cell cycle
arrest, apoptosis, senescence, DNA repair, and changes in
metabolism. The p53 protein is expressed at low levels in normal
cells and at high levels in various transformed cell lines, in
which it has been suggested to contribute to transformation and
malignancy. p53 is a DNA-binding protein that contains
transcription activation, DNA-binding and oligomerization domains.
It has been postulated to bind to a p53-binding site and activate
the expression of downstream genes that inhibit growth and/or
invasion, thereby functioning as a tumor suppressor.
Other than these 5 direct interactions between G-1
and G-2 genes, we identified one direct interaction between G-1
genes; Sox2 interacted with Ctgf (38), which encodes a mitogen that is
secreted by vascular endothelial cells. This encoded protein plays
a role in chondrocyte proliferation and differentiation, cell
adhesion in many cell types, and is related to platelet-derived
growth factor. Ctgf has been linked to the development and
progression of diabetic vascular and renal disease. Low-density
lipoproteins (LDL) have previously been shown to induce the
expression of Ctgf in aortic endothelial cells (40) (Fig.
2).
SHR-specific G-1 and G-2 genes related to
hypertension
Even based on the interactions, described above, we
were unable to pinpoint the candidate gene(s) causing hypertension.
Although these predicted interactions included the
hypertension-related G-2 genes, Ephx2 and Zbtb16,
they did not include other hypertension-related genes, such as
Ace, Agtrap, Cftr, Glp1r, Kng2,
Mylpf, Acox2, Dio2, Fibin, Fmo2,
Inmt and Myo16 (Table
II, G-2; GO:0003013, circulatory system process and Table IV, G-2; cardiovascular disease:
hypertension). In order to identify further interactions between
SHR-specific G-1 and G-2 genes, we applied the IPA path explorer
tool, suggested the presence of one gene that assisted in these
interactions, and found such a condition when we proposed the
Jun proto-oncogene (Jun) (41), which interacts directly with
specific target DNA sequences to regulate gene expression. The
presence of Jun has been shown to facilitate interactions
between 3 G-1 genes: Bcl6 (13), Sox2 (15) and ankyrin repeat domain 35
(Ankrd35) (42), and 8 G-2
genes: Spib (43),
Ephx2 (44), Tp73
(45), Dio2 (46), cytochrome P450, family 8,
subfamily b, polypeptide 1 (Cyp8b1) (47), Mylpf (48), glial cell derived neurotrophic
factor (Gdnf) (49) and
neurofilament, heavy polypeptide (Nefh) (50) (Fig.
2).
These findings suggested that Bcl6 and
Sox2 were the candidate genes responsible for causing
hypertension in SHRs.
Interactions among SHRSP-specific G-3 and
G-4 genes
Since the candidate gene(s) found to cause stroke
in SHRSP were expected to be included in the G-3 genes, we focused
on the interaction between G-3 and G-4 genes (Fig. 3). Our results revealed that G-3
genes included 3 typical blood pressure-related genes,
Ephx2, Kng2 and Agtrap (Table II, G-3; GO:0003013, circulatory
system process). These 3 genes isolated from the SHRSP at 3 weeks
of age were not isolated from the SHRs at 3 weeks of age, but were
isolated from the SHRs at 6 weeks of age (Table II). These results indicated that
the expression of genes related to BP control proceeds more rapidly
in SHRSP than in SHRs during their development.
The IPA path explorer tool revealed one interaction
among G-3 genes and 8 self-controlling genes (Fig. 3). One of the G-3 genes,
Agt, interacted with another G-3 gene, Agtrap, and
Agt also interacted with 2 G-4 genes, Agtrap and
Zbtb16 (Fig. 3). These
results suggest that Agt, Agtrap and Zbtb16
play pivotal roles in causing stroke-prone symptoms. Moreover, G-4
genes including 9 self-controlling genes (Fig. 3), and self-control genes, such as
Agtrap, Ephx2, Apoh, Ryr1 and
Zfp597, were expressed in the 3- and 6-week-old SHRSP.
In order to detect further interactions between
SHRSP-specific G-3 and G-4 genes, we applied the IPA path explorer
tool, suggested the presence of one gene that assisted these
interactions, and found such a condition when we proposed tumor
protein p53 (Tp53) (51),
which interacts directly with specific target DNA sequences to
regulate gene expression. The presence of Tp53 facilitated
interactions between 2 G-3 genes, Agt (18) and Apoh (19), and 3 G-4 genes, Apoh,
Vegfb (52) and
Banp (51) (Fig. 3).
SHRSP-specific G-3 and G-4 genes related
to stroke
Four enriched G-3 genes were categorized as
GO:0003013 (circulatory system process). These genes were expected
to participate in blood pressure control and the pathogenesis of
stroke. Moreover, 2 enriched G-3 genes, Apoh and Hrg,
were categorized as GO:0051918 (negative regulation of
fibrinolysis) (Table II, G-3).
Since Apoh has been implicated in various physiological
pathways, including lipoprotein metabolism, coagulation and the
production of antiphospholipid autoantibodies, we hypothesized that
it may participate in the genesis of atherosclerosis and stroke.
Hrg possesses antimicrobial activity, and the incorporation
of Hrg into fibrin clots facilitates bacterial entrapment
and killing and promotes inflammation. Since vascular inflammation
is known to trigger atherosclerosis, Hrg influences
atherosclerosis and susceptibility to strokes.
Two out of the 5 enriched G-4 genes, Apoh
and Hrg were categorized as GO:0051918 (negative regulation
of fibrinolysis), while the remaining 3 genes, chemokine (C-C
motif) receptor 1 (Ccr1), leukocyte immunoglobulin-like
receptor B-3-like (Lilrb3l) and Zbtb16 were
categorized as GO:0030097 (hemopoiesis) (Table II, G-4): Ccr1 encodes a
member of the β-chemokine receptor family. Knockout studies on the
mouse homolog suggested roles for this gene in host protection from
inflammatory responses, and susceptibility to viruses and
parasites. Lilrb3l is a receptor for the major
histocompatibility complex class I antigen (MHC-I), and may play a
physiological role in the brain for neuronal circuitry stability by
inhibiting synaptic plasticity. Zbtb16 encodes a protein
which is located in the nucleus. It is involved in cell cycle
progression and interacts with a histone deacetylase.
Genes related to ADHD and Huntington's
disease
We previously examined gene expression profiles in
the brain, and found that 6 SHRSP-specific genes isolated from the
rats at 6 weeks of age (Agtr1b, Arc, Egr2,
Fos, Hspa1b and Snca) were annotated to
‘behavior' and were suggested to participate in the genesis of ADHD
(5). In the present study, we
investigated gene expression profiles in the kidneys, and
unexpectedly found that 6 SHRSP-specific genes isolated from the
rats at 6 weeks of age (Banp, Ephx2, Rbfox1,
Rxrg, Ryr1 and Zbtb16) were annotated to
‘Huntington's disease' (Table
IV, G-4). Tp53 was also found to be involved in
‘Huntington's disease' (33,52). These findings suggested the
participation of common genes in the genesis of symptoms related to
ADHD and Huntington's disease (Table
IV, G-4).
Conclusion
SHR-specific genes isolated from the kidneys of
3-week-old rats included possible candidate genes that trigger
hypertension (Bcl6 and Sox2), and SHRSP-specific
genes isolated from the kidneys of 3-week-old rats included
possible candidate genes that trigger stroke, such as Agt,
Agtrap and Apoh. The results obtained from
SHRSP-specific genes isolated from the kidneys of 6-week-old rats
included 6 genes that have been functionally annotated to
Huntington's disease (Banp, Ephx2, Rbfox1,
Rxrg, Ryr1 and Zbtb16). These results
implicate these genes in the involuntary movement associated with
Huntington's disease as well as ‘attention-deficit hyperactivity'
observed in ADHD.
Acknowledgments
We thank Dr Etsuro Yamanishi, President Emeritus of
Hirakata General Hospital for Developmental Disorders, and
Professor Kazunori Shimada, Professor Emeritus of Osaka University,
for their constant support and encouragement, and Miss Fumie
Kanazawa for her expert secretarial assistance. We also thank the
National Center for Biotechnology Information (USA) for access to
the network servers and Medical English Service (Japan) for
proofreading our manuscript.
Abbreviations:
|
ADHD
|
attention-deficit hyperactivity
disorder
|
|
BP
|
blood pressure
|
|
DAVID
|
Database for Annotation,
Visualization and Integrated Discovery
|
|
FC
|
fold change
|
|
GEO
|
Gene Expression Omnibus
|
|
GO
|
Gene Ontology
|
|
GS
|
gene symbol
|
|
IPA
|
Ingenuity Pathway Analysis
|
|
RT-qPCR
|
reverse transcription-quantitative
polymerase chain reaction
|
|
SHRs
|
spontaneously hypertensive rats
|
|
SHRSP
|
stroke-prone SHRs
|
|
WKY rats
|
(normotensive) Wistar-Kyoto rats
|
References
|
1
|
Okamoto K and Aoki K: Development of a
strain of spontaneously hypertensive rats. Jpn Circ J. 27:282–293.
1963. View Article : Google Scholar : PubMed/NCBI
|
|
2
|
Okamoto K, Yamori Y and Nagaoka A:
Establishment of the stroke-prone spontaneously hypertensive rat
(SHR). Circ Res. 34–35(Suppl I): I-143–I-153. 1974.
|
|
3
|
Ueno KI, Togashi H, Mori K, Matsumoto M,
Ohashi S, Hoshino A, Fujita T, Saito H, Minami M and Yoshioka M:
Behavioural and pharmacological relevance of stroke-prone
spontaneously hypertensive rats as an animal model of a
developmental disorder. Behav Pharmacol. 13:1–13. 2002. View Article : Google Scholar : PubMed/NCBI
|
|
4
|
Yamamoto H, Okuzaki D, Yamanishi K, Xu Y,
Watanabe Y, Yoshida M, Yamashita A, Goto N, Nishiguchi S, Shimada
K, et al: Genetic analysis of genes causing hypertension and stroke
in spontaneously hypertensive rats. Int J Mol Med. 31:1057–1065.
2013.PubMed/NCBI
|
|
5
|
Yoshida M, Watanabe Y, Yamanishi K,
Yamashita A, Yamamoto H, Okuzaki D, Shimada K, Nojima H, Yasunaga
T, Okamura H, et al: Analysis of genes causing hypertension and
stroke in spontaneously hypertensive rats: gene expression profiles
in the brain. Int J Mol Med. 33:887–896. 2014.PubMed/NCBI
|
|
6
|
Guyton AC: Abnormal renal function and
autoregulation in essential hypertension. Hypertension. 18(Suppl):
III49–III53. 1991. View Article : Google Scholar : PubMed/NCBI
|
|
7
|
Huang W, Sherman BT and Lempicki RA:
Systematic and integrative analysis of large gene lists using DAVID
bioinformatics resources. Nat Protoc. 4:44–57. 2009. View Article : Google Scholar
|
|
8
|
Huang DW, Sherman BT and Lempicki RA:
Bioinformatics enrichment tools: paths toward the comprehensive
functional analysis of large gene lists. Nucleic Acids Res.
37:1–13. 2009. View Article : Google Scholar :
|
|
9
|
Daniel JM and Reynolds AB: The catenin
p120(ctn) interacts with Kaiso, a novel BTB/POZ domain zinc finger
transcription factor. Mol Cell Biol. 19:3614–3623. 1999.PubMed/NCBI
|
|
10
|
Dhordain P, Albagli O, Honore N, Guidez F,
Lantoine D, Schmid M, The HD, Zelent A and Koken MH: Colocalization
and heteromerization between the two human oncogene POZ/zinc finger
proteins, LAZ3 (BCL6) and PLZF. Oncogene. 19:6240–6250. 2000.
View Article : Google Scholar
|
|
11
|
Miles RR, Crockett DK, Lim MS and
Elenitoba-Johnson KS: Analysis of BCL6-interacting proteins by
tandem mass spectrometry. Mol Cell Proteomics. 4:1898–1909. 2005.
View Article : Google Scholar : PubMed/NCBI
|
|
12
|
Wei F, Zaprazna K, Wang J and Atchison ML:
PU.1 can recruit BCL6 to DNA to repress gene expression in germinal
center B cells. Mol Cell Biol. 29:4612–4622. 2009. View Article : Google Scholar : PubMed/NCBI
|
|
13
|
Vasanwala FH, Kusam S, Toney LM and Dent
AL: Repression of AP-1 function: A mechanism for the regulation of
Blimp-1 expression and B lymphocyte differentiation by the B cell
lymphoma-6 protooncogene. J Immunol. 169:1922–1929. 2002.
View Article : Google Scholar : PubMed/NCBI
|
|
14
|
Cox JL, Wilder PJ, Gilmore JM, Wuebben EL,
Washburn MP and Rizzino A: The SOX2-interactome in brain cancer
cells identifies the requirement of MSI2 and USP9X for the growth
of brain tumor cells. PLoS One. 8:e628572013. View Article : Google Scholar : PubMed/NCBI
|
|
15
|
Mansukhani A, Ambrosetti D, Holmes G,
Cornivelli L and Basilico C: Sox2 induction by FGF and FGFR2
activating mutations inhibits Wnt signaling and osteoblast
differentiation. J Cell Biol. 168:1065–1076. 2005. View Article : Google Scholar : PubMed/NCBI
|
|
16
|
Fukuyama K, Ichiki T, Takeda K, Tokunou T,
Iino N, Masuda S, Ishibashi M, Egashira K, Shimokawa H, Hirano K,
et al: Downregulation of vascular angiotensin II type 1 receptor by
thyroid hormone. Hypertension. 41:598–603. 2003. View Article : Google Scholar : PubMed/NCBI
|
|
17
|
Azuma K, Tamura K, Shigenaga A, Wakui H,
Masuda S, Tsurumi-Ikeya Y, Tanaka Y, Sakai M, Matsuda M, Hashimoto
T, et al: Novel regulatory effect of angiotensin II type 1
receptor-interacting molecule on vascular smooth muscle cells.
Hypertension. 50:926–932. 2007. View Article : Google Scholar : PubMed/NCBI
|
|
18
|
Liu Q, Wang G, Zhou G, Tan Y, Wang X, Wei
W, Liu L, Xue W, Feng W and Cai L: Angiotensin II-induced
p53-dependent cardiac apoptotic cell death: its prevention by
metallothionein. Toxicol Lett. 191:314–320. 2009. View Article : Google Scholar : PubMed/NCBI
|
|
19
|
Wang J, Yuan Y, Zhou Y, Guo L, Zhang L,
Kuai X, Deng B, Pan Z, Li D and He F: Protein interaction data set
highlighted with human Ras-MAPK/PI3K signaling pathways. J Proteome
Res. 7:3879–3889. 2008. View Article : Google Scholar : PubMed/NCBI
|
|
20
|
Scotet V, De Braekeleer M, Audrézet MP,
Lodé L, Verlingue C, Quéré I, Mercier B, Duguépéroux I, Codet JP,
Moineau MP, et al: Prevalence of CFTR mutations in
hypertrypsinaemia detected through neonatal screening for cystic
fibrosis. Clin Genet. 59:42–47. 2001. View Article : Google Scholar : PubMed/NCBI
|
|
21
|
Lempinen M, Paju A, Kemppainen E, Smura T,
Kylänpää ML, Nevanlinna H, Stenman J and Stenman UH: Mutations N34S
and P55S of the SPINK1 gene in patients with chronic pancreatitis
or pancreatic cancer and in healthy subjects: a report from
Finland. Scand J Gastroenterol. 40:225–230. 2005. View Article : Google Scholar : PubMed/NCBI
|
|
22
|
Gonzalez-Villalobos RA, Janjoulia T,
Fletcher NK, Giani JF, Nguyen MT, Riquier-Brison AD, Seth DM, Fuchs
S, Eladari D, Picard N, et al: The absence of intrarenal ACE
protects against hypertension. J Clin Invest. 123:2011–2023. 2013.
View Article : Google Scholar : PubMed/NCBI
|
|
23
|
Gumieniak O, Perlstein TS, Williams JS,
Hopkins PN, Brown NJ, Raby BA and Williams GH: Ala92 type 2
deiodinase allele increases risk for the development of
hypertension. Hypertension. 49:461–466. 2007. View Article : Google Scholar : PubMed/NCBI
|
|
24
|
Løset M, Mundal SB, Johnson MP, Fenstad
MH, Freed KA, Lian IA, Eide IP, Bjørge L, Blangero J, Moses EK and
Austgulen R: A transcriptional profile of the decidua in
preeclampsia. Am J Obstet Gynecol. 204:84.e1–84.e27. 2011.
View Article : Google Scholar
|
|
25
|
Delbosc S, Cristol JP, Descomps B, Mimran
A and Jover B: Simvastatin prevents angiotensin II-induced cardiac
alteration and oxidative stress. Hypertension. 40:142–147. 2002.
View Article : Google Scholar : PubMed/NCBI
|
|
26
|
Sakai T, Balasubramanian K, Maiti S,
Halder JB and Schroit AJ: Plasmin-cleaved beta-2-glycoprotein 1 is
an inhibitor of angiogenesis. Am J Pathol. 171:1659–1669. 2007.
View Article : Google Scholar : PubMed/NCBI
|
|
27
|
Simpkins AN, Rudic RD, Schreihofer DA, Roy
S, Manhiani M, Tsai HJ, Hammock BD and Imig JD: Soluble epoxide
inhibition is protective against cerebral ischemia via vascular and
neural protection. Am J Pathol. 174:2086–2095. 2009. View Article : Google Scholar : PubMed/NCBI
|
|
28
|
Thulin A, Ringvall M, Dimberg A, Kårehed
K, Väisänen T, Väisänen MR, Hamad O, Wang J, Bjerkvig R, Nilsson B,
et al: Activated platelets provide a functional microenvironment
for the antiangiogenic fragment of histidine-rich glycoprotein. Mol
Cancer Res. 7:1792–1802. 2009. View Article : Google Scholar : PubMed/NCBI
|
|
29
|
O-Uchi J, Jhun BS, Hurst S, Bisetto S,
Gross P, Chen M, Kettlewell S, Park J, Oyamada H, Smith GL, et al:
Overexpression of ryanodine receptor type 1 enhances mitochondrial
fragmentation and Ca2+- induced ATP production in
cardiac H9c2 myoblasts. Am J Physiol Heart Circ Physiol.
305:H1736–H1751. 2013. View Article : Google Scholar : PubMed/NCBI
|
|
30
|
Bellomo D, Headrick JP, Silins GU,
Paterson CA, Thomas PS, Gartside M, Mould A, Cahill MM, Tonks ID,
Grimmond SM, et al: Mice lacking the vascular endothelial growth
factor-B gene (Vegfb) have smaller hearts, dysfunctional coronary
vasculature, and impaired recovery from cardiac ischemia. Circ Res.
86:E29–E35. 2000. View Article : Google Scholar : PubMed/NCBI
|
|
31
|
Strand AD, Aragaki AK, Shaw D, Bird T,
Holton J, Turner C, Tapscott SJ, Tabrizi SJ, Schapira AH,
Kooperberg C and Olson JM: Gene expression in Huntington's disease
skeletal muscle: a potential biomarker. Hum Mol Genet.
14:1863–1876. 2005. View Article : Google Scholar : PubMed/NCBI
|
|
32
|
Hodges A, Strand AD, Aragaki AK, Kuhn A,
Sengstag T, Hughes G, Elliston LA, Hartog C, Goldstein DR, Thu D,
et al: Regional and cellular gene expression changes in human
Huntington's disease brain. Hum Mol Genet. 15:965–977. 2006.
View Article : Google Scholar : PubMed/NCBI
|
|
33
|
Thomas EA: Striatal specificity of gene
expression dysregulation in Huntington's disease. J Neurosci Res.
84:1151–1164. 2006. View Article : Google Scholar : PubMed/NCBI
|
|
34
|
Kephart DD, Walfish PG, DeLuca H and Butt
TR: Retinoid X receptor isotype identity directs human vitamin D
receptor heterodimer transactivation from the 24-hydroxylase
vitamin D response elements in yeast. Mol Endocrinol. 10:408–419.
1996.PubMed/NCBI
|
|
35
|
Zella LA, Shevde NK, Hollis BW, Cooke NE
and Pike JW: Vitamin D-binding protein influences total circulating
levels of 1,25-dihydroxyvitamin D3 but does not directly modulate
the bioactive levels of the hormone in vivo. Endocrinology.
149:3656–3667. 2008. View Article : Google Scholar : PubMed/NCBI
|
|
36
|
Norkina O, Kaur S, Ziemer D and De Lisle
RC: Inflammation of the cystic fibrosis mouse small intestine. Am J
Physiol Gastrointest Liver Physiol. 286:G1032–G1041. 2004.
View Article : Google Scholar : PubMed/NCBI
|
|
37
|
Fontemaggi G, Kela I, Amariglio N, Rechavi
G, Krishnamurthy J, Strano S, Sacchi A, Givol D and Blandino G:
Identification of direct p73 target genes combining DNA microarray
and chromatin immunoprecipitation analyses. J Biol Chem.
277:43359–43368. 2002. View Article : Google Scholar : PubMed/NCBI
|
|
38
|
Seo E, Basu-Roy U, Zavadil J, Basilico C
and Mansukhani A: Distinct functions of Sox2 control self-renewal
and differentiation in the osteoblast lineage. Mol Cell Biol.
31:4593–4608. 2011. View Article : Google Scholar : PubMed/NCBI
|
|
39
|
Senbonmatsu T, Saito T, Landon EJ,
Watanabe O, Price E Jr, Roberts RL, Imboden H, Fitzgerald TG,
Gaffney FA and Inagami T: A novel angiotensin II type 2 receptor
signaling pathway: possible role in cardiac hypertrophy. EMBO J.
22:6471–6482. 2003. View Article : Google Scholar : PubMed/NCBI
|
|
40
|
El-Shewy HM, Sohn M, Wilson P, Lee MH,
Hammad SM, Luttrell LM and Jaffa AA: Low-density lipoprotein
induced expression of connective tissue growth factor via
transactivation of sphingosine 1-phosphate receptors in mesangial
cells. Mol Endocrinol. 26:833–845. 2012. View Article : Google Scholar : PubMed/NCBI
|
|
41
|
Kyriakis JM and Avruch J: Mammalian
mitogen-activated protein kinase signal transduction pathways
activated by stress and inflammation. Physiol Rev. 81:807–869.
2001.PubMed/NCBI
|
|
42
|
Horisawa K, Tateyama S, Ishizaka M,
Matsumura N, Takashima H, Miyamoto-Sato E, Doi N and Yanagawa H: In
vitro selection of Jun-associated proteins using mRNA display.
Nucleic Acids Res. 32:e1692004. View Article : Google Scholar : PubMed/NCBI
|
|
43
|
Rao S, Matsumura A, Yoon J and Simon MC:
SPI-B activates transcription via a unique proline, serine, and
threonine domain and exhibits DNA binding affinity differences from
PU.1. J Biol Chem. 274:11115–11124. 1999. View Article : Google Scholar : PubMed/NCBI
|
|
44
|
Ai D, Fu Y, Guo D, Tanaka H, Wang N, Tang
C, Hammock BD, Shyy JY and Zhu Y: Angiotensin II up-regulates
soluble epoxide hydrolase in vascular endothelium in vitro and in
vivo. Proc Natl Acad Sci USA. 104:9018–9023. 2007. View Article : Google Scholar : PubMed/NCBI
|
|
45
|
Toh WH, Siddique MM, Boominathan L, Lin KW
and Sabapathy K: c-Jun regulates the stability and activity of the
p53 homologue, p73. J Biol Chem. 279:44713–44722. 2004. View Article : Google Scholar : PubMed/NCBI
|
|
46
|
Canettieri G, Franchi A, Guardia MD,
Morantte I, Santaguida MG, Harney JW, Larsen PR and Centanni M:
Activation of thyroid hormone is transcriptionally regulated by
epidermal growth factor in human placenta-derived JEG3 cells.
Endocrinology. 149:695–702. 2008. View Article : Google Scholar
|
|
47
|
Jahan A and Chiang JY: Cytokine regulation
of human sterol 12alpha-hydroxylase (CYP8B1) gene. Am J Physiol
Gastrointest Liver Physiol. 288:G685–G695. 2005. View Article : Google Scholar
|
|
48
|
Morris JB, Pham TM, Kenney B, Sheppard KE
and Woodcock EA: UTP transactivates epidermal growth factor
receptors and promotes cardiomyocyte hypertrophy despite inhibiting
transcription of the hypertrophic marker gene, atrial natriuretic
peptide. J Biol Chem. 279:8740–8746. 2004. View Article : Google Scholar
|
|
49
|
Fontana X, Hristova M, Da Costa C, Patodia
S, Thei L, Makwana M, Spencer-Dene B, Latouche M, Mirsky R, Jessen
KR, et al: c-Jun in Schwann cells promotes axonal regeneration and
motoneuron survival via paracrine signaling. J Cell Biol.
198:127–141. 2012. View Article : Google Scholar : PubMed/NCBI
|
|
50
|
Kinoshita I, Leaner V, Katabami M, Manzano
RG, Dent P, Sabichi A and Birrer MJ: Identification of
cJun-responsive genes in Rat-1a cells using multiple techniques:
Increased expression of stathmin is necessary for cJun-mediated
anchorage-independent growth. Oncogene. 22:2710–2722. 2003.
View Article : Google Scholar : PubMed/NCBI
|
|
51
|
Sinha S, Malonia SK, Mittal SP, Singh K,
Kadreppa S, Kamat R, Mukhopadhyaya R, Pal JK and Chattopadhyay S:
Coordinated regulation of p53 apoptotic targets BAX and PUMA by
SMAR1 through an identical MAR element. EMBO J. 29:830–842. 2010.
View Article : Google Scholar : PubMed/NCBI
|
|
52
|
Izzotti A, Cartiglia C, Longobardi M,
Bagnasco M, Merello A, You M, Lubet RA and De Flora S: Gene
expression in the lung of p53 mutant mice exposed to cigarette
smoke. Cancer Res. 64:8566–8572. 2004. View Article : Google Scholar : PubMed/NCBI
|
|
53
|
Steffan JS, Kazantsev A, Spasic-Boskovic
O, Greenwald M, Zhu YZ, Gohler H, Wanker EE, Bates GP, Housman DE
and Thompson LM: The Huntington's disease protein interacts with
p53 and CREB-binding protein and represses transcription. Proc Natl
Acad Sci USA. 97:6763–6768. 2000. View Article : Google Scholar : PubMed/NCBI
|