Introduction
Epidemiological and clinical studies in different
countries and involving different ethnic groups have demonstrated
that intrauterine growth restriction (IUGR) is associated with an
increased risk of developing metabolic syndrome (MS), type 2
diabetes mellitus (T2DM), obesity, hypertension and dyslipidemia in
adult life (1–4). Insulin resistance (IR) is a common
pathological and physiological mechanism of MS. Skeletal muscle is
one of the important peripheral tissues to be affected by insulin.
In a model of IUGR mediated by various causes (e.g. calorie
restriction, protein restriction, hypoxic condition in rodents),
IUGR has been shown to alter insulin signaling in rodent offspring,
leading to the development of IR in the skeletal muscles (5–7).
However, the mechanisms that regulate IR in skeletal muscles remain
unclear.
Recently, it has been demonstrated that microRNAs
(miRNAs or miRs) affect skeletal muscles and play important roles
in many aspects of muscle biological processes, such as muscle
growth, development and regeneration (8,9).
miRNAs are known to act as powerful post-transcriptional
regulators, which act either through the inhibition of protein
translation or via mRNA degradation, by partially binding to the
3′UTR of their target mRNAs (10). Considering that miRNAs are
stringently regulated in skeletal muscles in order to maintain
normal biological processes, it is conceivable that alterations of
miRNA expression levels induce functional disorders and, therefore,
influence the development of disease. Indeed, certain studies have
revealed that various miRNAs are involved in the pathology of
several muscle diseases and in metabolism: for example, myogenesis
(11), exercise, atrophy, aging
and dystrophy (8).
Concerning IUGR, several studies on miRNA expression
have been undertaken. These studies mostly compared miRNA
expression profiles or several specific miRNAs in a variety of
tissues, such as glomeruli (12),
skeletal (13), placental
(14), and lung tissues from
different IUGR models, where IUGR was caused by protein restriction
(15), caloric restriction
(14) or seminutrient restriction
(13). However, specific miRNA
signatures which are associated with the IR of skeletal muscles
from subjects with IUGR are less common.
In the present study, we investigated the possible
involvement of miRNAs in IUGR by using a miRNA microarray analysis
of skeletal muscles from the offspring of control and IUGR rats.
One of the key altered miRNAs was miR-29a, which suppressed the
expression of its target gene, peroxisome proliferator-activated
receptor δ (PPARδ), and influenced the expressions of other related
genes, such as peroxisome proliferator-activated receptor-γ
coactivator-1α (PGC-1α) and glucose transporter 4 (GLUT4), as well
as decreasing insulin-stimulated glucose uptake and adenosine
triphosphate (ATP) production in the skeletal muscle cell line
C2C12. These findings provide information on a novel
micro-RNA-mediated mechanism of PPARδ regulation and suggest that
miR-29a affects insulin resistance in the skeletal muscles of rats
with IUGR.
Materials and methods
Animal procedures, collection of skeletal
muscle and isolation of total RNA
Animal procedures were carried out as described
previously (16). Briefly, 20
virgin, 7- to 8-week-old Sprague- Dawley (SD) rats weighing 180±20
g were purchased from the Shanghai Laboratory Animal Center
(Chinese Academy of Sciences, Shanghai, China). All animals were
housed at 21–23°C, 65–69% humidity with a 12-h light/dark cycle and
had free access to food and tap water. Following 10 days of
habituation, female rats were mated overnight with a male and
copulation was verified the next morning by the presence of
spermatozoa in vaginal smears. After conception, pregnant dams were
housed individually and fed isocaloric diets containing either
normal (20%) levels of protein (control) or a protein-restricted
(PR) diet containing 8% protein until delivery. The composition of
the diets has been described previously (17). After delivery, each mother rat fed
8 pups (any extra pups were removed at random) and was fed with
normal rat chow. Six pups born from mothers who received the PR
diet formed the IUGR group and 6 pups from mothers fed a normal
diet formed the control group. Following weaning, 3 or 4 same sex
offspring rats from the same group were housed in 1 cage until the
end of the experiment, and 18-month-old control (CON) and IUGR
offspring rats were sacrificed by decapitation. Six pairs of
gastrocnemius muscle samples taken from the right posterior limb
from the 2 groups were rapidly removed, frozen in liquid nitrogen
and stored at −80°C. All experiments were approved by the Animal
Care and Use Committee of Southeast University (Nanjing,
China).
Total RNA was isolated from samples from both groups
using TRIzol (Invitrogen, Carlsbad, CA, USA) according to the
manufacturer's instructions. The concentration and quality of RNA
was measured using a NanoDrop spectrophotometer (Thermo Scientific
Inc., Nepean, ON, Canada), and RNA integrity was checked using gel
electrophoresis. To minimize the effects of inconsistency and meet
the sample demands for microarray profiling, measurements were
taken to guarantee that an equal amount of RNA from each sample was
taken. Equal aliquots of RNA samples from each group were pooled
(n=5), and miRNA isolation was carried out from the pooled total
RNA using an miRNeasy mini kit (Qiagen, Copenhagen, Denmark)
according to the manufacturer's instructions.
Microarray analysis of miRNA
expression
miRNA expression profiling was performed on the two
pooled total RNA groups mentioned above. miRNA was labeled using
the miRCURY™ Hy3™/Hy5™ power labeling kit (Exiqon, Vedbaek,
Denmark) and hybridized on the miRCURY LNA array (v.18.0; Exiqon).
All procedures were carried out according to the manufacturer's
instructions. This array contains 3,100 capture probes, covering
all human, mouse and rat miRNA annotated in miRBase 18.0. Following
the washing steps, the slides were subsequently canned with the
Agilent Scanner G2505C (Agilent Technologies, Santa Clara, CA,
USA).
Scanned images were then imported into GenePix Pro
6.0 software (Axon Instruments, Union City, CA, USA) for grid
alignment and data extraction. Replicated miRNAs were averaged, and
miRNA with intensities ≥30 in all samples were chosen for
calculating the normalization factor. Expressed data were
normalized using median normalization. After normalization,
differentially expressed miRNA was identified through fold-change
filtering. Finally, hierarchical clustering was performed to
examine distinguishable miRNAexpression profiling among the
samples.
Reverse transcription-quantitative PCR
(RT-qPCR) for analysis of miRNA expression
In order to verify the microarray results, the
expression levels of abnormal genes were analyzed by RT-qPCR.
Briefly, total RNA (3 ng) of skeletal muscle from CON and IUGR rats
was reverse transcribed using an iScript™ cDNA synthesis kit
(Bio-Rad, Hercules, CA, USA) and the miRNA-specific
reverse-transcription primers provided with the SYBR PrimerScript
miRNA RT-PCR kit (Takara, Shiga, Japan). For reverse transcription,
the iCycler™ Thermal cycler (Applied Biosystems, Foster City, CA,
USA) was used under the following conditions: 16°C for 30 min; 42°C
for 30 min and 85°C for 5 min and a quick cooling on ice.
miRNA-specific (1.33 µl) cDNA from this reaction was
amplified with TaqMan Universal PCR master mix and the respective
specific probe provided in the SYBR PrimerScript miRNA RT-PCR kit
(Takara). All primers were synthesized by Shengneng Bicolor Biotech
(Shanghai, China). RT-qPCR was performed in an ABI 7500 RT-PCR
system (Applied Biosystems). Amplification was performed at 95°C
for 10 min, followed by 40 cycles of 95°C for 15 sec and 60°C for 1
min. As an internal control, U6 primers were used for RNA template
normalization. All reactions were performed in triplicate and
included no template or reverse transcription controls for each
gene. All mRNA levels were normalized to the values of U6, and the
results expressed as fold changes of the threshold cycle (Ct) value
relative to controls using the 2−ΔΔCt method. miRNA
levels in the IUGR group were calculated relative to the CON group,
for which values were arbitrarily set to 1 in order to obtain
estimates of relative abundance, as has been previously described
(16).
Prediction of miR-29a targets in
silico
Since it has previously been reported that miR-29a
is one of the most upregulated miRNAs in skeletal muscles from IUGR
rats and that it plays an important role in diabetes mellitus,
which is closely related to diabetes (18), we focused on miR-29a in subsequent
experiments. To explore the potential mechanism by which miR-29a
exerts its effects in IUGR, we applied two bioinformatics
algorithms (from TargetScan and PicTar) to identify its potential
target genes. TargetScan (www.targetscan.org) and PicTar (www.pictar.org) are the most commonly software links
for predicting microRNA target genes. The intersection of the two
results was performed by Gene Ontology (GO) analysis of the
molecular function, biological process and using Kyoto Encyclopedia
of Genes and Genomes (KEGG) biological pathway enrichment
analysis.
Luciferase reporter assay
Firstly, the 3′UTR of rat PPARδ containing the
putative target sites for miR-29a was synthesized. We also
synthesized the control sequences containing several mutated bases
within the complementary binding sites. We then cloned the
corresponding genes into the pGL3-promoter vector (Promega,
Madison, WI, USA). The 293T cells (purchased from the Cell Bank of
the Chinese Academy of Sciences Shanghai Institute of Cell Biology)
were plated at 1×10⁵ in a 12-well plate. After 24 h, the
pGL3 reporters containing wild-type PPARδ binding sites for miR-29a
(WT) or the mutated PPARδ binding sites (MUT) were transiently
co-transfected with either the pre-miR-29a plasmid or the negative
control (pre-miR-NC; both from GenePharma, Shanghai, China) using
Lipofectamine 2000 (Invitrogen), according to the manufacturer's
instructions. Renilla luciferase was used to normalize the
cell number and transfection efficiency. Cells were harvested 48 h
after transfection. Luciferase activity was measured by the Dual
Luciferase assay kit according to the manufacturer's instructions
on a Luminometer (both from Promega). Each assay was analyzed 3
times.
Transfecting C2C12 cells with
miR-29a
The mouse myoblast cell line C2C12, which was
purchased from the Cell Bank of the Chinese Academy of Sciences
Shanghai Institute of Cell Biology, was maintained at 37°C in
Dulbecco's modified Eagle's medium (DMEM) supplemented with 10%
fetal bovine serum (Wisent, St. Bruno, QC, Canada) and 10 U/ml
penicillin/streptomycin. Lentivirus miR-29a expression vector was
synthesized by GenePharma. When the cells reached a confluence of
70–80%, the medium was replaced with DMEM supplemented with 2%
horse serum (Gibco, St. Louis, MO, USA) and 10 U/ml
penicillin/streptomycin to promote myoblast differentiation into
myotubes. Six days later, the differentiated C2C12 cells had fused
into myotubes. Subsequently, C2C12 myoblasts transfected with
miR-29a-GFP-pGLPZ or GFP-pGLPZ lenti-virus (both from GenePharma)
were set as the miR-29a and mock-transfected groups, respectively.
C2C12 myoblasts which had not been transfected with lentivirus were
considered the normal group. After transfection (48 h), the miR-29a
expression levels in each cell line were verified by RT-qPCR and
visualized using a fluorescence microscope (Zeiss, Germany).
RT-qPCR analysis of mRNA expression
The total RNA from each sample was extracted using
TRIzol reagent (Invitrogen)-validated primers, which were designed
for each target mRNA; these were synthesized by Shengneng Bicolor
Biotech (Shanghai, China). The PCR primers used were as follows:
GLUT4 forward, 5′-ACATACCTGACAGGGCAAGG-3′ and reverse,
5′-CGCCCTTAGTTGGTCAGAAG-3′; PGC-1α forward,
5′-TCTGAAAGGGCCAAACAGAG-3′ and reverse, 5′-GTAAATCACACGGCGCTCTT-3′;
PPARδ forward, 5′-GGATTTTAGAGTGGGTGTTTTTTA-3′ and reverse,
5′-CACACCCGATTCCATGTTGAG-3′; β-actin forward,
5′-GAGACCTTCAACACCCCAGCC-3′ and reverse,
5′-GGAGAGCATAGCCCTCGTAG-3′. RT-qPCR analysis was performed on an
ABI 7500 RT-PCR system under the following conditions: initial
denaturation for 10 min at 95°C, followed by 40 cycles of 15 sec
denaturation at 95°C, 30 sec annealing at the optimal primer
temperature and 36 sec extension at 72°C. The expressions of GLUT4,
PPARδ and PGC-1α and the housekeeping gene β-actin were assessed
simultaneously in individual samples. Each sample was assayed in
duplicate. Negative controls (no template or selected untranscribed
RNA) were also run to ensure the absence of contamination. Analysis
was performed using the 2−ΔΔCt method with β-actin as
the housekeeping gene.
Western blot analysis
Western blot analysis was performed to determine
protein expression of GLUT4, PPARδ and PGC-1α. Briefly, cells were
washed with ice-cold PBS and lysed with RIPA Lysis Buffer
(Beyotime, Shanghai, China) for 20 min on ice. Plasma membrane (PM)
proteins were extracted using Eukaryotic Membrane Protein
Extraction Reagent (Pierce, Rockford, IL, USA). Western blot
analysis was performed as described previously (16). Briefly 30 µg protein
lysates was electrophoresed on 10% SDS-PAGE and transferred to PVDF
membranes. The following primary antibodies at the indicated
dilutions were used (GLUT4, 1:1,000, ab564; PPARδ, 1:400, ab23673;
PGC-1α, 1:1,000, ab54481; β-actin, 1:1,000, ab6276). All primary
mouse polyclonal antibodies were purchased from Abcam (Cambridge,
MA, USA). Enhanced chemiluminescence (Amersham, Piscataway, NJ,
USA) reagent was applied to the blots and they were exposed to
autoradiography film. Film was analyzed by densitometry to
determine the quantity of protein expressed in each group, using
Bio-Rad Quantity One software (Bio-Rad). β-actin was used as an
internal control. Results are expressed as optical density.
2-[N-(7-nitrobenz-2-oxa-1,3-diazol-4-yl)amino]-2-deoxy-D-glucose
(2-NBDG) uptake assay
Differentiated C2C12 cells were pre-incubated in
0.05% glucose containing Krebs Ringer Bicarbonate buffer (pH 7.4
with 2% BSA). After this pre-incubation at 37°C for 30 min, cells
were incubated in the presence or absence of insulin (100 nM)
(Peptide Institute, Osaka, Japan) for 10 min and then further
treated with insulin and 500 µM 2-NBDG (Invitrogen) for 2 h
at 37°C in glucose-free Krebs-Ringer Bicarbonate buffer containing
2% BSA. Upon termination of incubation, the cells were washed with
cold PBS, and 2-NBDG uptake into cells was assayed by fluorescence-
activated cell sorting (FACS) analysis (BD Biosciences, San Jose,
CA, USA). Results were expressed as fluorescence intensity
(arbitrary units) of the insulin-treated group as compared to the
normal group. Each sample was analyzed three times.
ATP assay
ATP content was measured using a luciferase-based
luminescence assay kit (Beyotime Institute of Biotechnology,
Haimen, China) according to the manufacturer's instructions.
Briefly, the cell lysates were extracted with cell lysis reagent.
ATP concentrations were determined with a single-tube luminometer
(Turner Biosystems, Sunnyvale, CA, USA) and normalized to protein
concentration. Each sample was analyzed three times.
Statistical analysis
Data are presented as the means ± SEM. Analysis was
performed with SPSS 13.0 software (SPSS Inc., Chicago, IL, USA).
Statistical significance was tested by ANOVA for three parametric
groups. Student's t-test was used for two parametric groups. A
P-value <0.05 was considered to indicate a statistically
significant difference.
Results
Differential miRNA expression in CON and
IUGR skeletal muscle samples
We successfully established an IUGR rat model by
feeding the rats a protein-restricted diet during pregnancy
(16). The miRNA expression
profiles for the two groups were analyzed by employing a highly
sensitive, high-throughput and specific miRCURY LNA microarray
platform. After normalization, obtained average values for each
miRNA were used for statistical analysis. The threshold values we
used to screen up- and downregulated miRNAs are represented as
fold-change >2.00 and fold-change <0.50. A total of 3,100
miRNAs were detected using miRNA microarray in the two groups. In
the microarray-based experiments, we identified 56 overexpressed
and 68 downregulated miRNAs in IUGR samples. Based on these
differentially expressed miRNAs, a tree with a clear distinction
between the IUGR and CON groups was generated by cluster analysis
(data not shown).
Validation of microarray results using
RT-qPCR
To validate the altered expression of miRNAs as
detected by miRNA microarray, miR-29a, let-7a-2-3p, miR-140-5p,
miR-126a-3p, miR-223-3p and miR-133a-5p were selected for
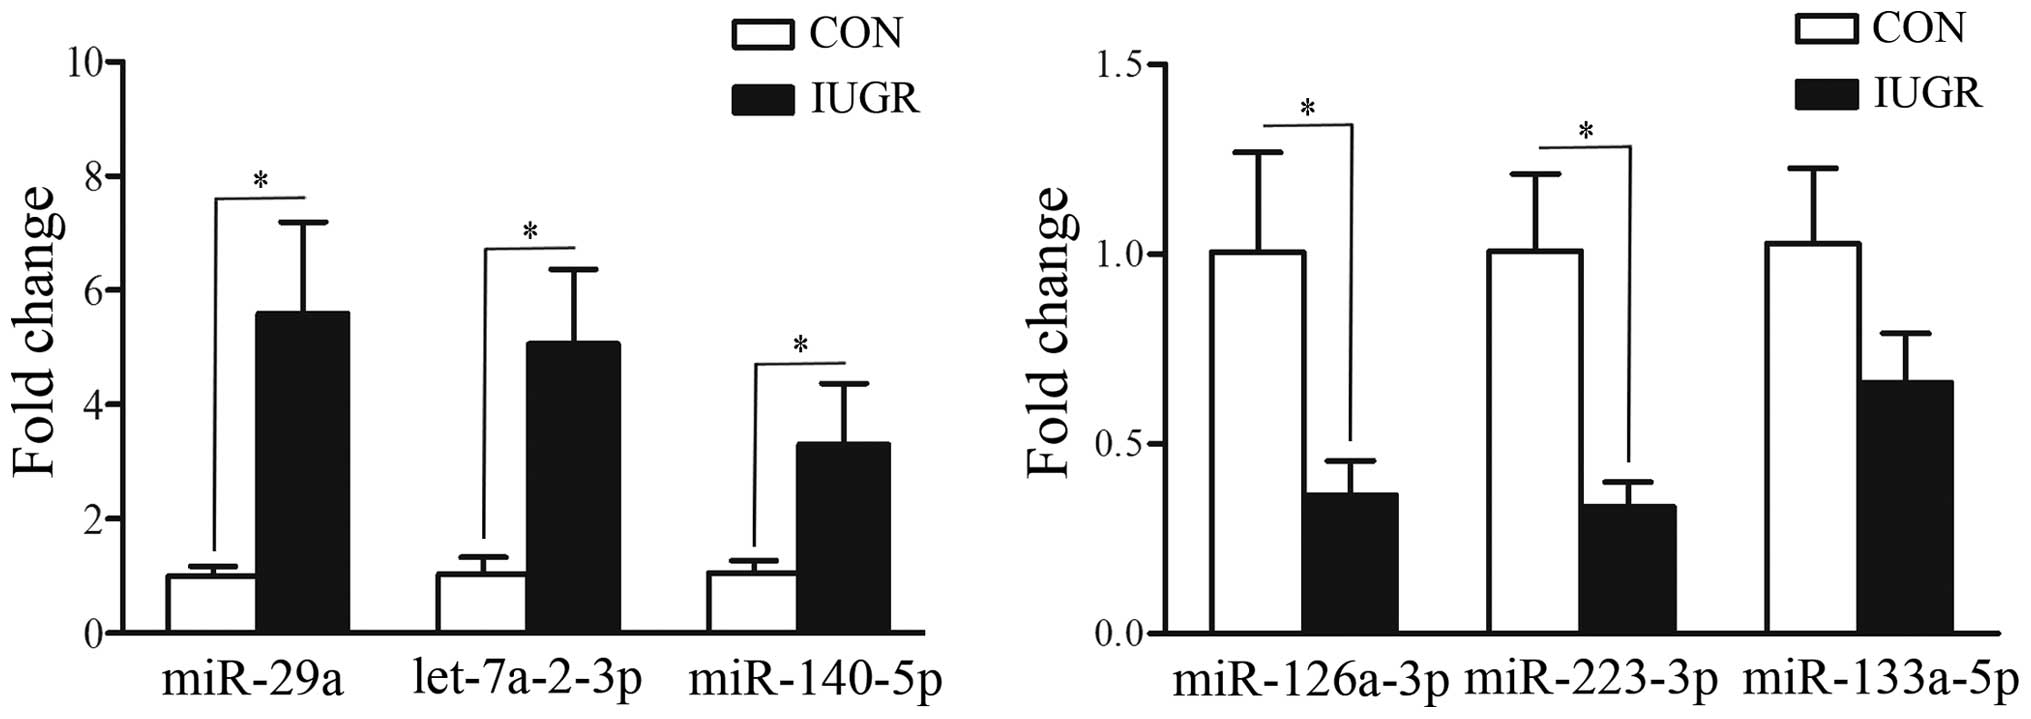
confirmation by RT-qPCR. The majority of the RT-qPCR results
correlated with those obtained by microarray analysis. As shown in
Fig. 1, the expression levels of
miR-29a, let-7a-2-3p and miR-140-5p were upregulated in the IUGR
group (P=0.0001, P=0.0053 and P=0.0033, respectively), whereas the
expression levels of miR-126a-3p and miR-223-3p were downregulated
(P=0.0355 and P=0.0261, respectively) in the IUGR group.
miR-133a-5p followed the same trend, but changes were not deemed to
be significant. This aspect is deserving of further study in the
future.
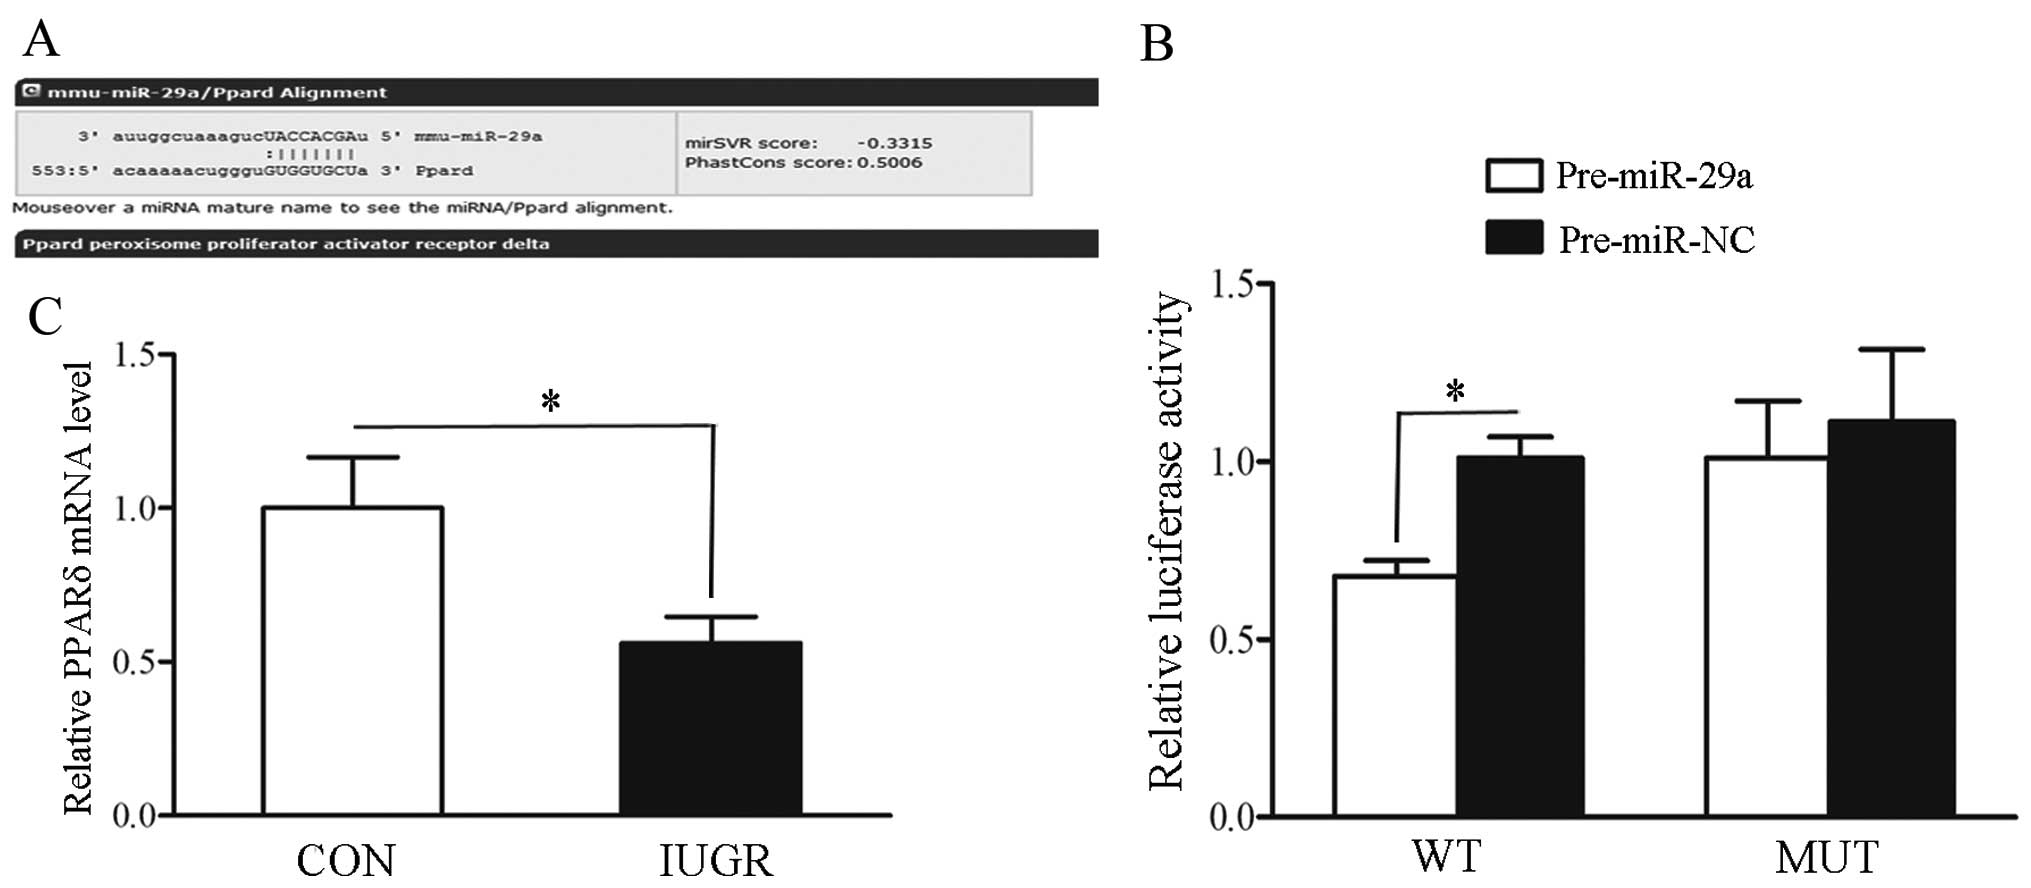
Prediction and validation of PPARδ
regulated by miR-29a
Since miR-29a was the most markedly upregulated
miRNA in muscle samples from the IUGR group and it plays an
important role in diabetes mellitus, which is closely related to
IUGR, as has been reported previously (19), we focused on miR-29a in subsequent
experiments. We found a putative target site for miR-29a in the
3′-UTR of PPARδ gene by applying TargetScan bioinformatics
algorithms (Fig. 2A).
Subsequently, the luciferase reporter assay confirmed that miR-29a
directly regulates the expression of PPARδ by binding to the
complementary sites within the 3′-UTR of the PPARδ gene (Fig. 2B). Finally, we noted that the mRNA
expression level of PPARδ was significantly decreased in skeletal
muscles from IUGR compared with those from control rats (P<0.05)
(Fig. 2C).
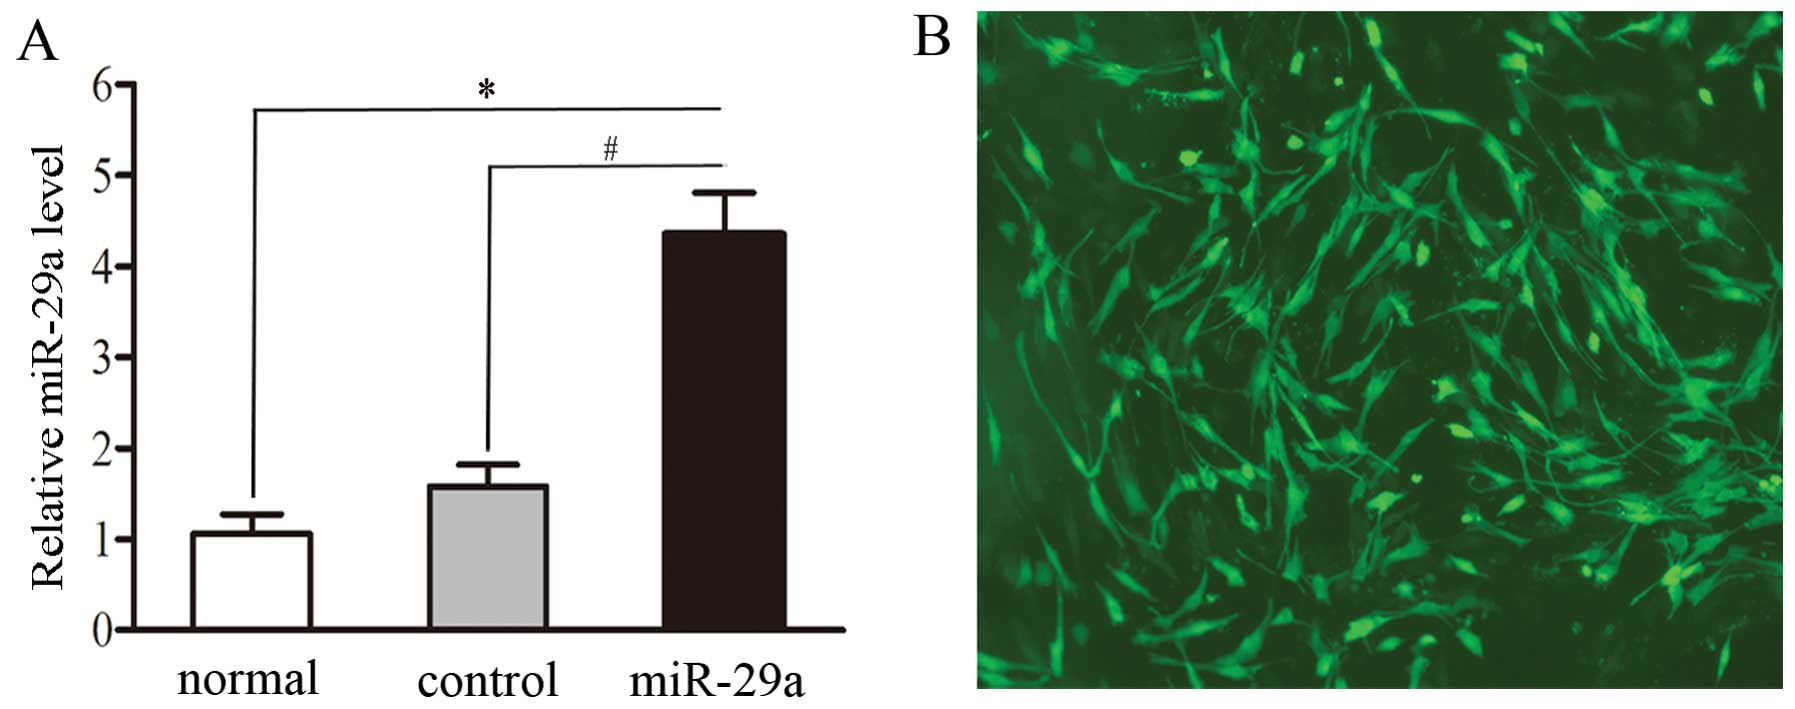
Establishment of miR-29a overexpression
in stable C2C12 cells
In order to study the biological significance of
miR-29a induction, C2C12 cells without the lentivirus (normal
group), C2C12 cells transfected with GFP-pGLPZ lentivirus (mock
control group) or miR-29a-GFP-pGLPZ (miR-29a group) developed into
myotubes after being treated with 2% horse serum for six days.
After transfection (48 h), miR-29a expression levels in each cell
line were detected by RT-qPCR and visualized using a fluorescence
microscope. As expected, compared to non-transfected and
mock-transfected cells, cells transfected with miR-29a exhibited
significantly higher levels of miR-29a (2.30-fold increase,
P=0.0016) (Fig. 3A).
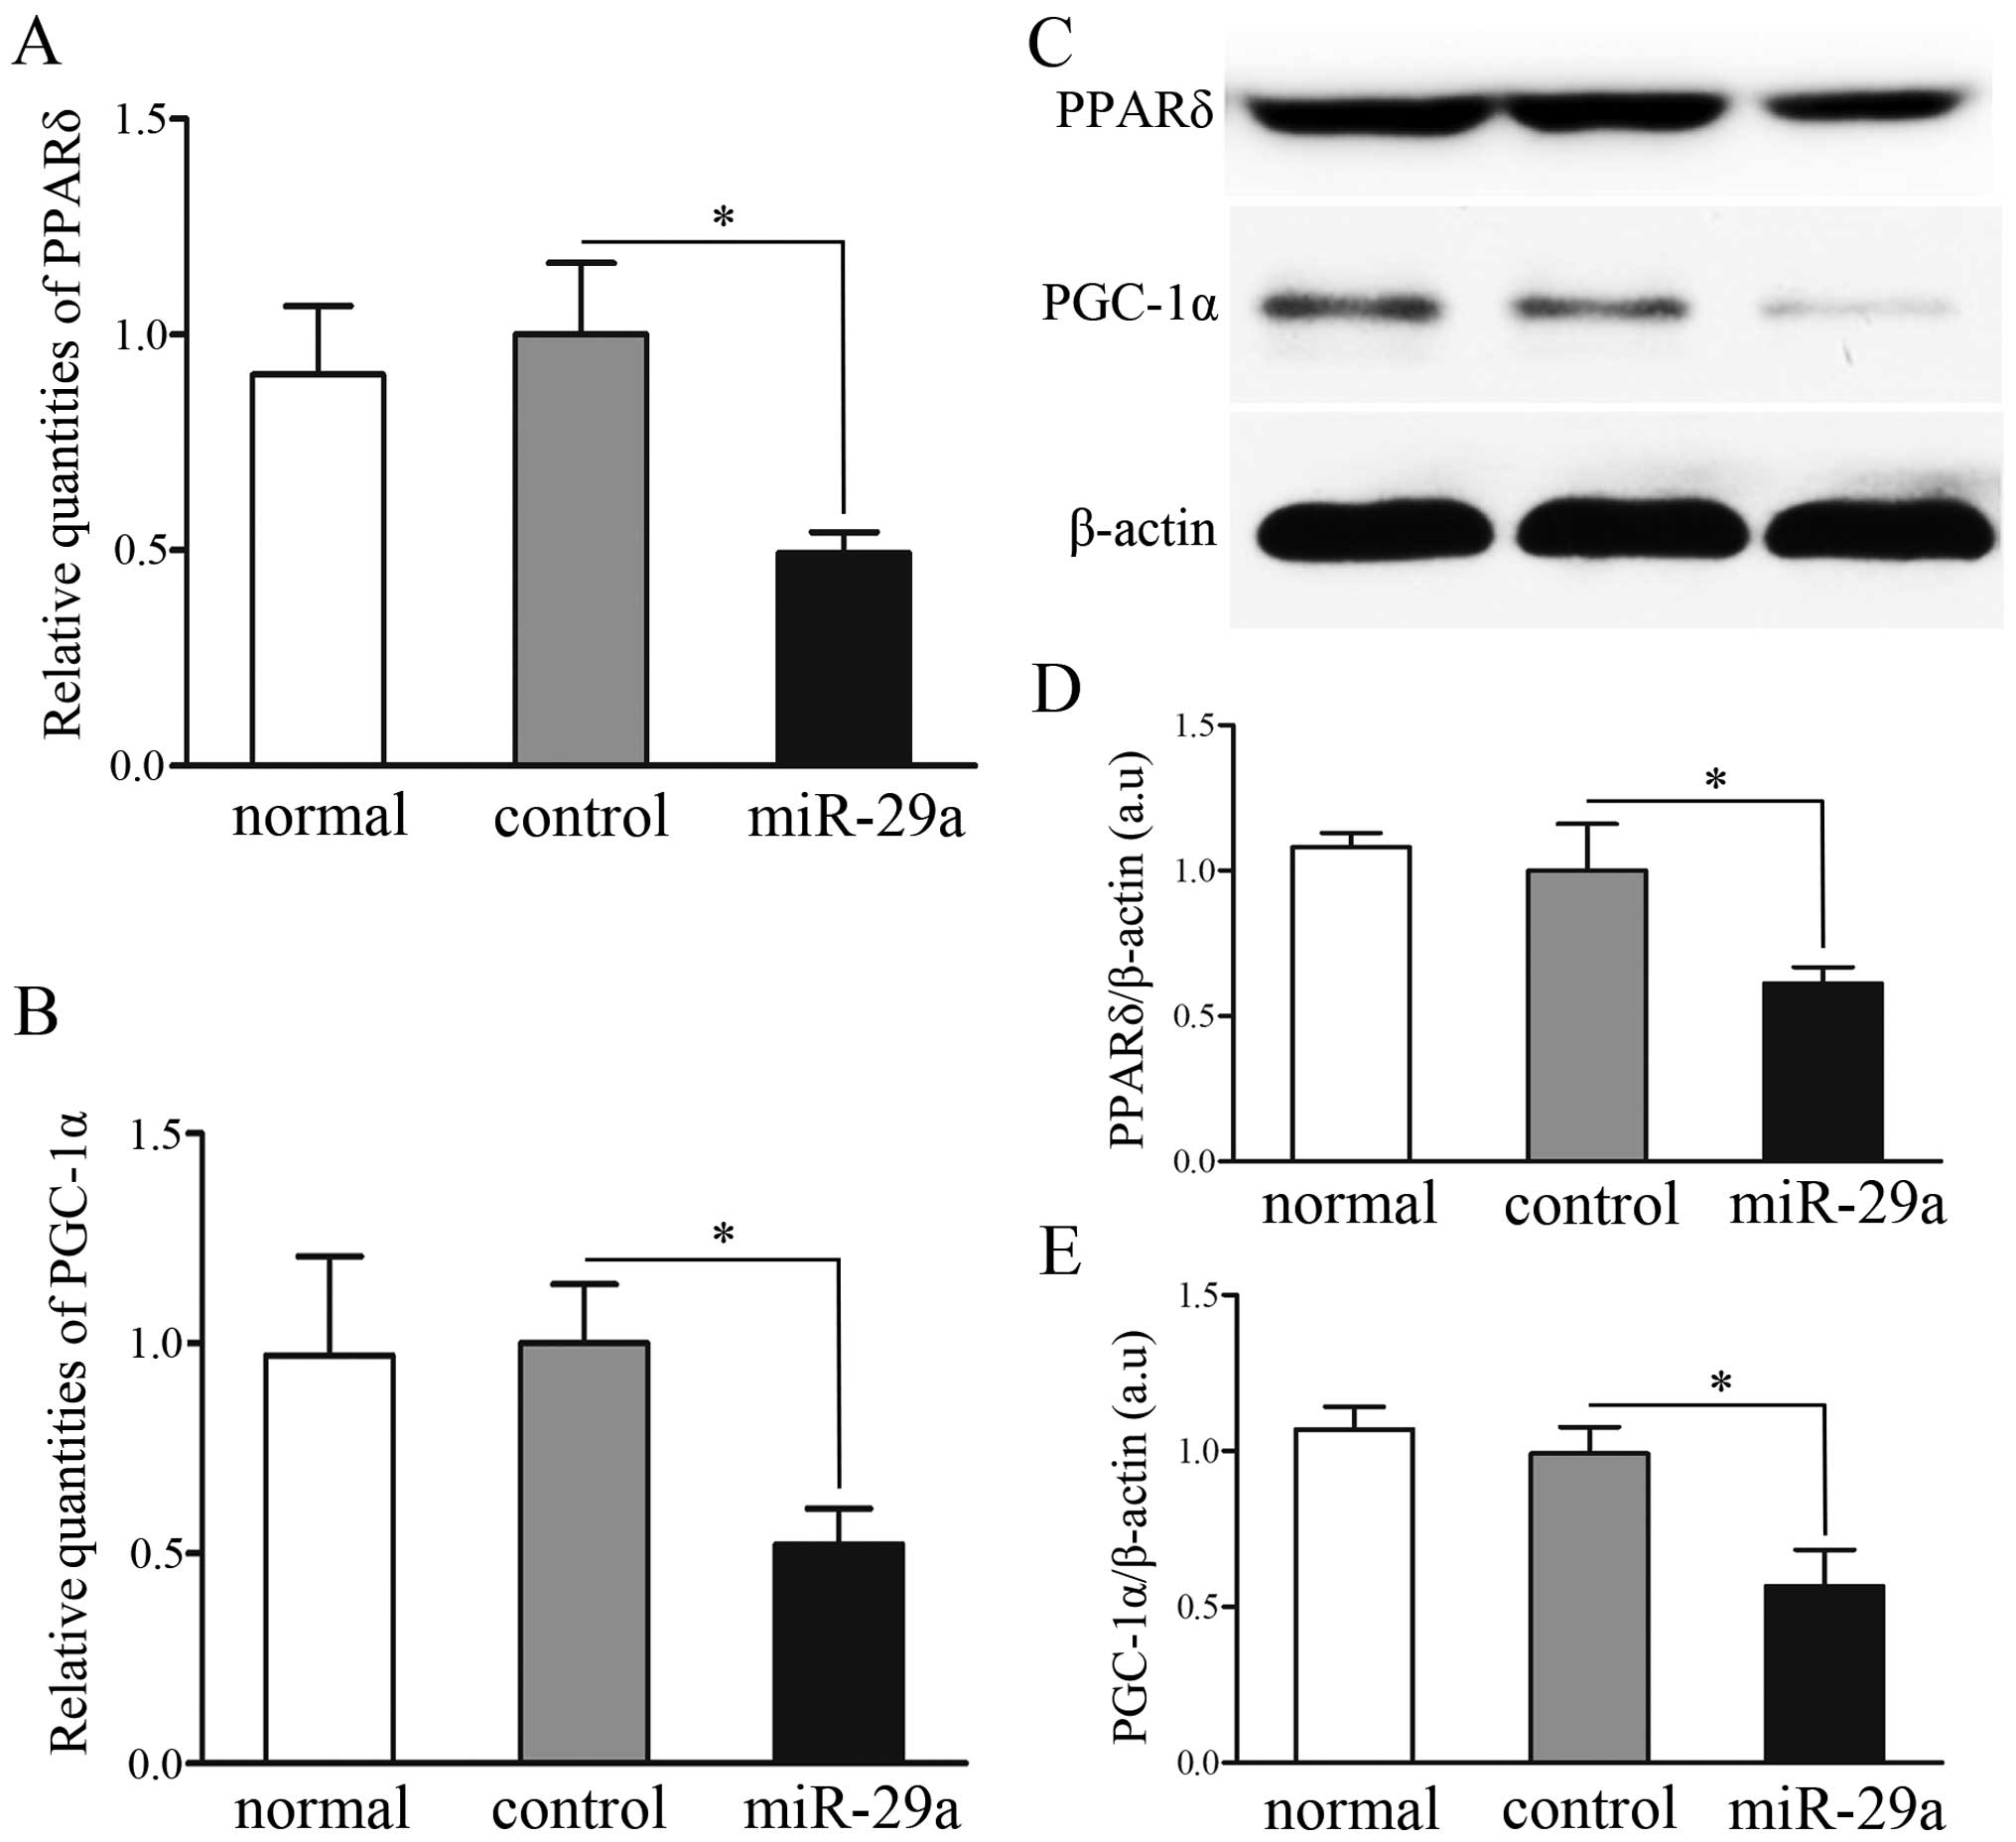
Expression analysis of transcripts
regulated by miR-29a
In the majority of tissues, PPARδ regulates a
variety of material metabolisms with PGC-1α, one of its most
important coactivators. In the C2C12 cells, overexpression of
miR-29a decreased PPARδ and PGC-1α at the mRNA level, as compared
to non- and mock-transfected cells (P<0.05) (Fig. 4A and B). Furthermore, western blot
analysis revealed that expression of PPARδ and PGC-1α protein was
significantly lower in C2C12 cells transfected with miR-29a than in
the non- and mock-transfected cells (P<0.05) (Fig. 4C–E).
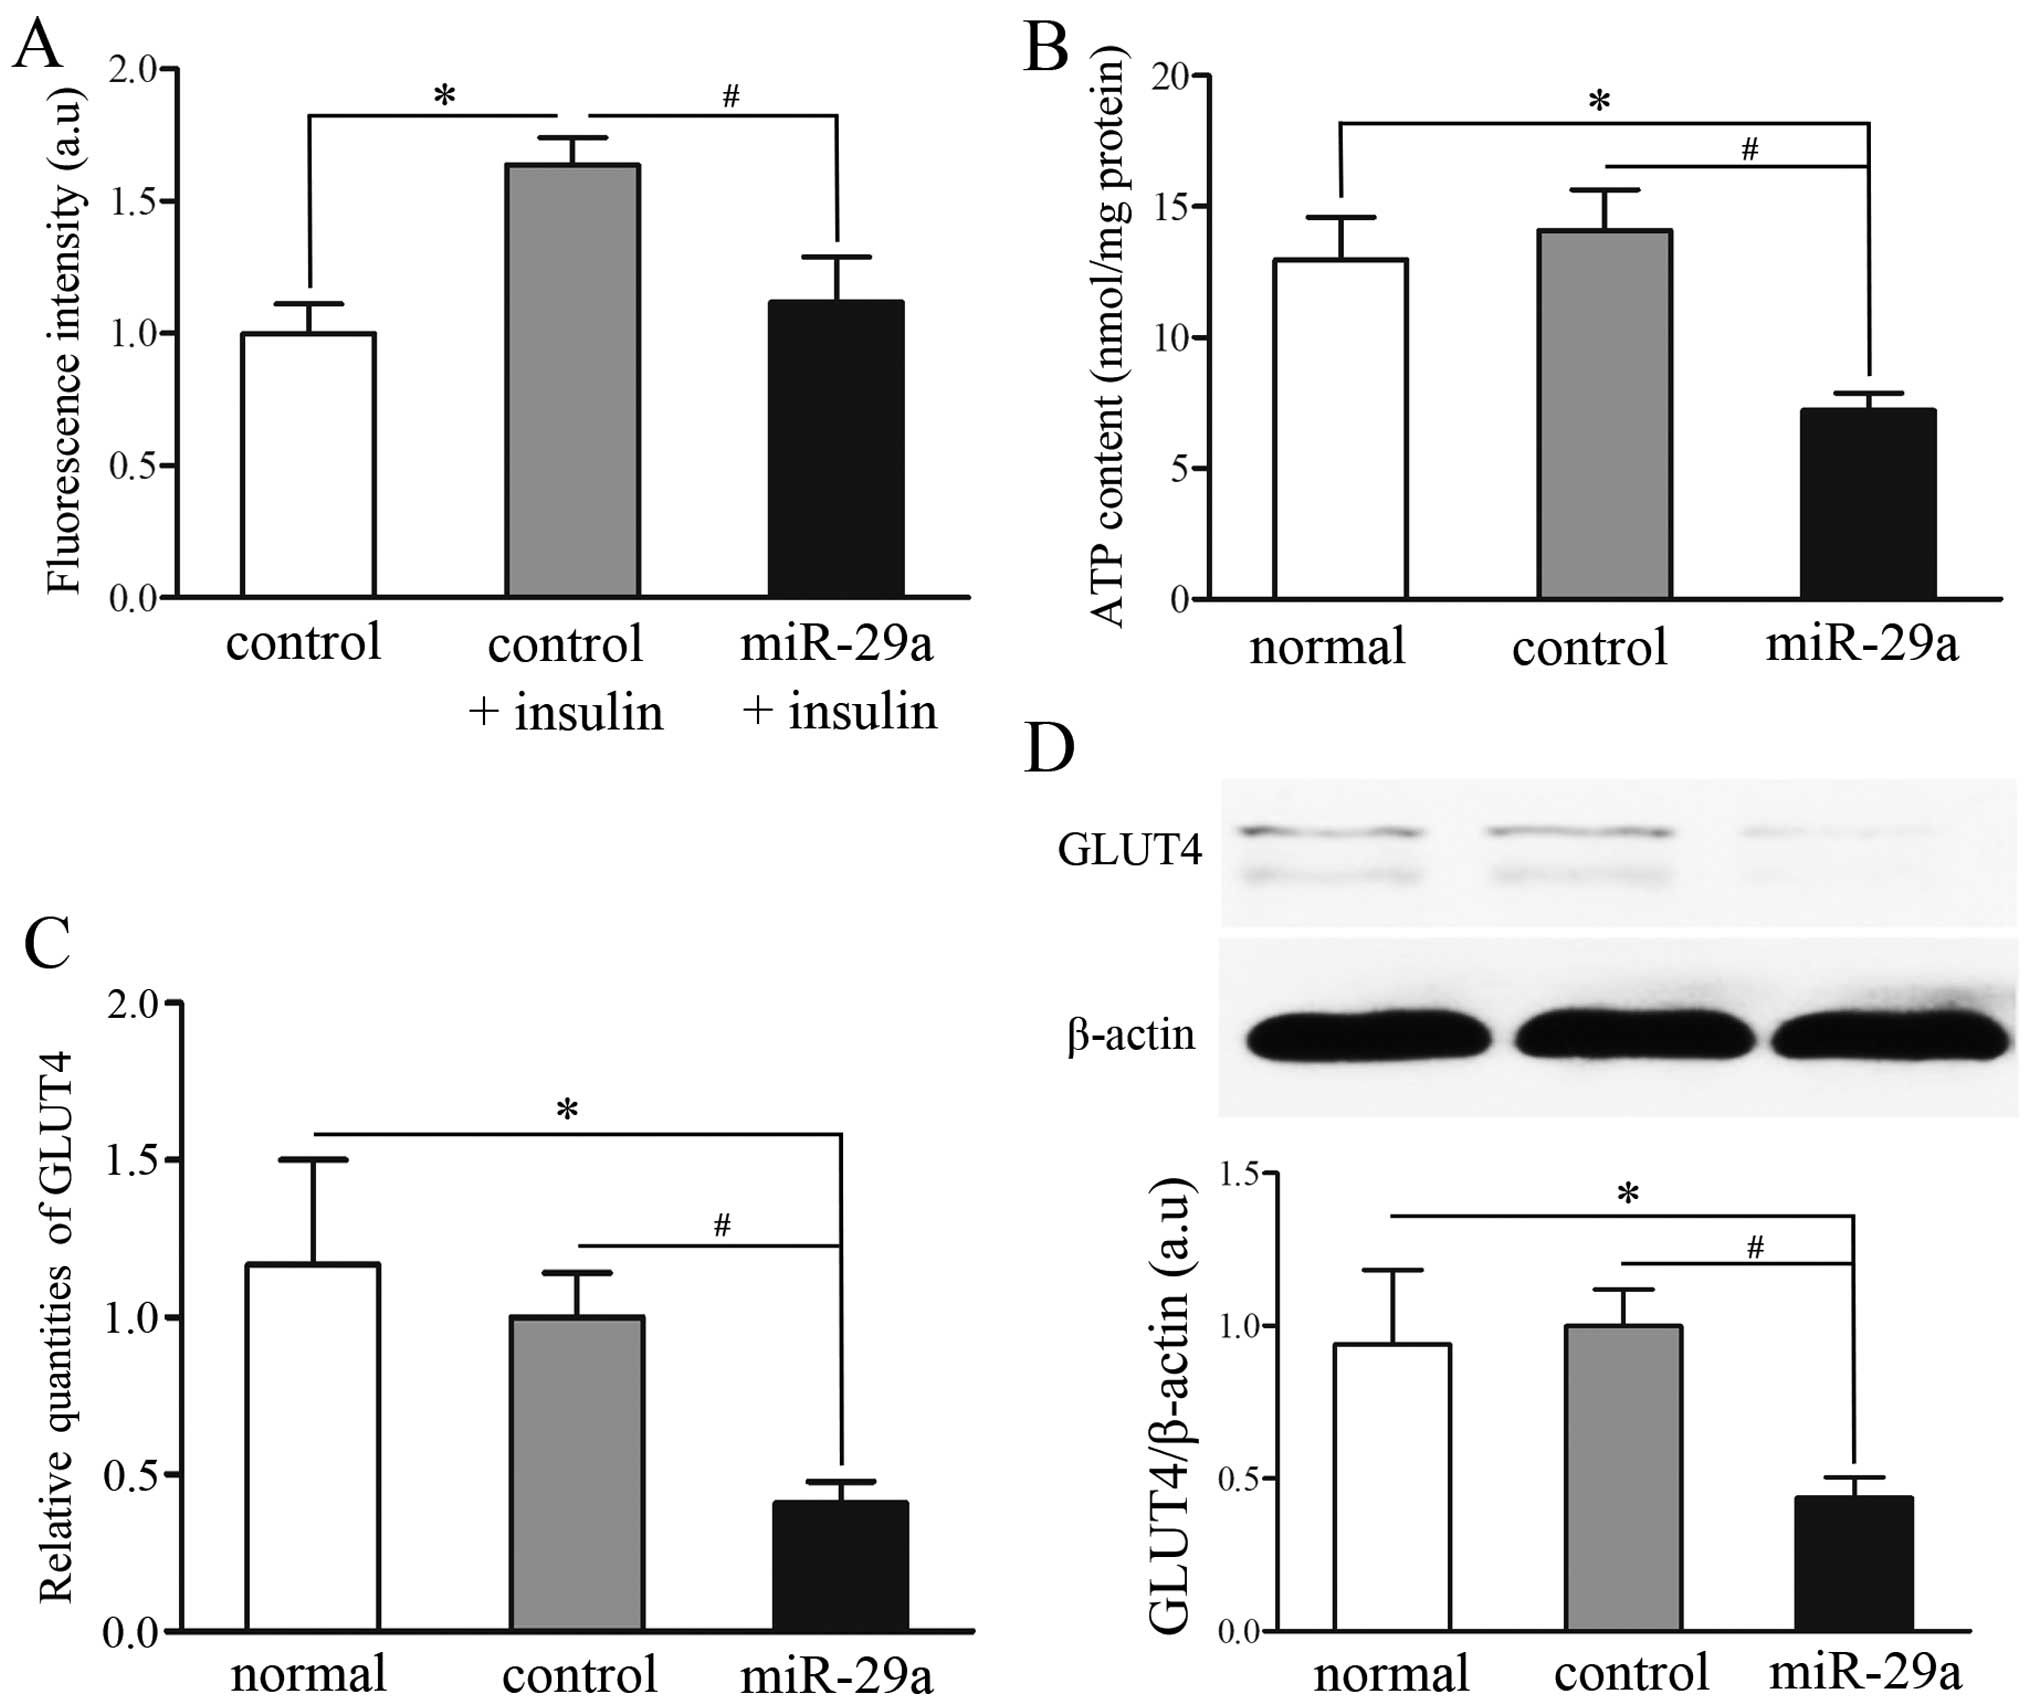
Overexpression of miR-29a attenuates
2-NBDG uptake following insulin treatment and ATP production
Disorders of glucose transport and energy production
are known to be cellular manifestations to IR (20). To study the involvement of miR-29a
and its impact on IR, a 2-NBDG uptake assay and an ATP production
assay were performed in untransfected C2C12 cells (normal group),
C2C12 cells transfected with GFP-pGLPZ lentivirus (control group)
or miR-29a-GFP-pGLPZ (miR-29a group). The control group was divided
into two subgroups, with or without insulin (100 nM) stimulation.
Insulin treatment induced an increase in fluorescence intensity in
both the control group and miR-29a group; fluorescence intensity in
the miR-29a and insulin-treated group was significantly decreased
(P<0.05) (Fig. 5A). Moreover,
mitochondrial activity and energy production, as detected by the
ATP luminescence kit, decreased more in the miR-29a group than the
normal and control groups (P<0.05) (Fig. 5B). These data demonstrate that
miR-29a overexpression induced IR in C2C12 cells.
Overexpression of miR-29a downregulates
GLUT4, an important glucose transporter
During insulin stimulation, one of the most
important glucose transporter molecules is GLUT4 (21). In the present study, we noted a
significant reduction in the mRNA and protein expression of GLUT4
in C2C12 cells transfected with miR-29a-GFP-pGLPZ (miR-29a group)
compared with C2C12 cells which had not been transfected (normal
group) and C2C12 cells transfected with GFP-pGLPZ lentivirus
(control group) (P<0.05) (Fig. 5C
and D). These results illustrated that overexpression of
miR-29a attenuated insulin-induced glucose uptake which is mediated
by regulation of GLUT4.
Discussion
Uteroplacental insufficiency and subsequent IUGR
leads to IR, which is associated with metabolic disease, diabetes
mellitus and angiocardiopathy in adulthood. A basic mechanism of
metabolic diseases is IR, and skeletal muscle is a primary site of
IR (22). Although several
reports have described the status and role of miRNAs in diabetic
tissues, very few studies have focused on the IUGR skeletal muscle
(23). In the present study, we
used an IUGR model induced by a protein-restricted diet during
pregnant, which has also been widely used in other studies
(15). In our previous study, we
noted IR in the skeletal muscles of 18-month-old IUGR offspring
rats (16), reflecting similar
clinical findings in IUGR patients, thus verifying the validity of
the model (24). In the present
study, the skeletal muscles from 18-month-old IUGR offspring rats
were selected. We pooled miRNAs from five control and five IUGR
samples into two groups and compared the differences between them,
in order that the random individual differences between subjects
were eliminated. Although the sample pooling led to some loss of
detailed information, this was not of great importance in our
study.
In this study, we noted that the expression levels
of 56 miRNAs were higher in the IUGR samples than in the CON
samples, whereas 68 miRNAs demonstrated downregulated expression in
the IUGR samples (data not shown). Six representative
differentially expressed miRNAs (miR-29a, let-7a-2-3p, miR-140-5p,
miR-126a-3p, miR-223-3p and miR-133a-5p) were chosen for validation
using the RT-qPCR method and five independent samples. In general,
in the present study the results of RT-qPCR were in concordance
with the normalized microarray data. One exception was miR-133a-5p,
which followed the same trend, but the changes were not deemed to
be significant. Such discrepancies may be attributed to the greater
individual differences among the samples. Furthermore, it should be
noted that the purification process of the stem-loop RT-qPCR assay
cannot completely remove long RNA nucleotides, and therefore we
cannot exclude the possibility that the precursors are also
quantified.
In the present study, miR-29a exhibited the highest
fold change, and it should also be noted that in previous studies
miR-29a has been shown to be critical in inhibiting
insulin-stimulated glucose uptake in 3T3-L1 adipocytes (18), and it has been noted that it
counteracts the effects of insulin on phosphoenolpyruvate
carboxykinase (PEPCK) gene expression by primarily targeting
phosphoinositide 3-kinase (PI3K) and abrogating downstream insulin
signaling in HepG2 cells (25). A
previous study showed that miR-29a expression was much higher in
models using muscles of starved mother starved pups (SMSP) than in
those using control mother control pups (CMCP) and, importantly,
the progression and outcome of this model were similar to those of
our model (13). Such studies
have demonstrated that miR-29a plays various roles in different
cells under different conditions, and we thus focused on miR-29a
for further investigation in this study.
Using the popular website TargetScan for miRNA
target gene prediction, we found that PPARδ harbored a binding site
for miR-29a between 1470 and 1476 nucleotides on its 3′UTR. A
luciferase reporter assay confirmed that PPARδ was the target gene
of miR-29a, which was consistent with the results of the
bioinformatics analysis. Our data demonstrated that PPARδ levels
correspondingly decreased in miR-29a-transfected C2C12 cells. Thus,
our findings provide further support for the theory that PPARδ is
the target gene for miR-29a.
It is well known that PPARδ is involved in many
different biological activities such as the metabolism of lipids,
lipoproteins and glucose. The skeletal muscle is an organ that
plays a key role in such processes (26). One of the best-described cofactors
of PPARδ is a transcriptional coactivator (27). Targeting of PPARδ with miR-29a
suggests that this miRNA contributes to the regulation of the
corresponding metabolisms. Compared with the control group, in the
miR-29a-transfected group, we noted significantly reduced mRNA and
protein levels of PPARδ and PGC-1α in C2C12 cells. A previous study
stated that overexpression of miR-29a in primary hepatocytes also
decreased the protein levels of PGC-1α (28). It has also been reported that
activation of PPARδ in the skeletal muscle led to increased levels
of PGC-1α protein (29). Thus, it
was speculated that one possible explanation for why C2C12 cells
exhibit decreased levels of PGC-1α was most likely attributable to
repression of PPARδ by miR-29a.
Since the skeletal muscle is a key organ for glucose
uptake and lipid oxidation, increased insulin sensitivity in the
skeletal muscle is beneficial to the control of glucose and lipid
homeostasis (30). In the present
study, we noted that overexpression of miR-29a significantly
inhibited glucose uptake in the cell and impaired insulin
sensitivity. GLUT4, the major insulin-stimulated glucose
transporter, is expressed predominantly in skeletal muscle, cardiac
muscle and adipose tissue, and is largely responsible for
insulin-stimulated glucose transport into these tissues (31). In this study, reduced GLUT4
translocation was linked with decreased glucose uptake. The protein
expression of GLUT4 was consistent with the pattern observed at the
mRNA level. IR in type 2 diabetes is linked to decreased
insulin-stimulated glucose transport in adipose tissue and skeletal
muscle, and the downregulation of major insulin-responsive glucose
transporter GLUT (32). Krämer
et al (33) reported that
exposure of human skeletal muscle cells and C2C12 cells to a PPARδ
agonist increased glucose uptake in a PPARδ-dependent manner. Thus,
we suggest that reduced glucose transport noted in our study is due
not only partly to decreased GLUT4 but also partly to the direct
effects of decreased PPARδ.
Furthermore, we found that ATP was significantly
decreased in the miR-29a-transfected C2C12 cells compared to normal
or control cells. This is likely due to energy being transferred
from glucose to ATP through aerobic respiration or anaerobic
respiration in cells and PGC-1α is a master regulator of mito
chondrial biogenesis (34).
Therefore, we speculate that miR-29a is important for efficient
glucose transport activity and ATP production.
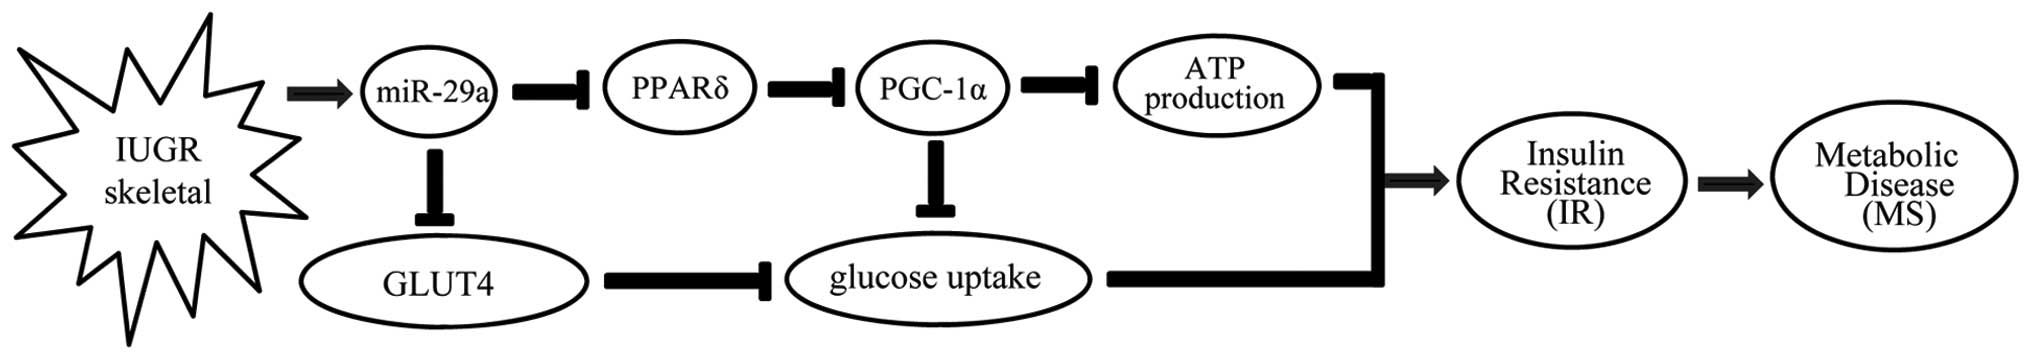
In conclusion, in the present study we noted that
miR-29a was upregulated in skeletal muscle from IUGR offspring
compared to control offspring. Overexpression of miR-29a suppressed
the expression of its target gene, PPARδ, then reduced the
expression of PGC-1α, which is an important coactivator of PPARδ.
Thus, we posit that PPARδ/PGC-1α-dependent signals together reduce
insulin-dependent glucose uptake and ATP production. Overexpression
of miR-29a also caused a decrease in levels of GLUT4, the most
important glucose transporter in skeletal muscle, which partly
induced decreased insulin-dependent glucose uptake. As a result,
metabolic disease occurred, which is secondary to IR in the
skeletal muscles (Fig. 6). Taken
together, the results provide evidence for a novel
micro-RNA-mediated mechanism of PPARδ regulation, and are
suggestive of the IR-promoting actions of miR-29a in skeletal
muscles of IUGR rats. A further elucidation of miR-29a leading to
skeletal dysfunction and other potential mechanisms is thus
required, as well as in vitro and in vivo
studies.
Acknowledgments
This study was supported by the National Natural
Science Foundation of China (grants no. 81300654, 81100592 and
81270800).
References
|
1
|
Henriksen T: Foetal nutrition, foetal
growth restriction and health later in life. Acta Paediatr Suppl.
88:4–8. 1999. View Article : Google Scholar : PubMed/NCBI
|
|
2
|
Grella PV: Low birth weight and early life
origins of adult disease: insulin resistance and type 2 diabetes.
Clin Exp Obstet Gynecol. 34:9–13. 2007.PubMed/NCBI
|
|
3
|
Finken MJ, Keijzer-Veen MG, Dekker FW,
Frölich M, Hille ET, Romijn JA and Wit JM; Dutch POPS-19
Collaborative Study Group: Preterm birth and later insulin
resistance: effects of birth weight and postnatal growth in a
population based longitudinal study from birth into adult life.
Diabetologia. 49:478–485. 2006. View Article : Google Scholar : PubMed/NCBI
|
|
4
|
Phillips DI, Barker DJ, Hales CN, Hirst S
and Osmond C: Thinness at birth and insulin resistance in adult
life. Diabetologia. 37:150–154. 1994. View Article : Google Scholar : PubMed/NCBI
|
|
5
|
Gatford KL, Simmons RA, De Blasio MJ,
Robinson JS and Owens JA: Review: placental programming of
postnatal diabetes and impaired insulin action after IUGR.
Placenta. 31(Suppl): S60–S65. 2010. View Article : Google Scholar : PubMed/NCBI
|
|
6
|
Garg M, Thamotharan M, Oak SA, Pan G,
Maclaren DC, Lee PW and Devaskar SU: Early exercise regimen
improves insulin sensitivity in the intrauterine growth-restricted
adult female rat offspring. Am J Physiol Endocrinol Metab.
296:E272–E281. 2009. View Article : Google Scholar :
|
|
7
|
Neitzke U, Harder T, Schellong K, Melchior
K, Ziska T, Rodekamp E, Dudenhausen JW and Plagemann A:
Intrauterine growth restriction in a rodent model and developmental
programming of the metabolic syndrome: a critical appraisal of the
experimental evidence. Placenta. 29:246–254. 2008. View Article : Google Scholar : PubMed/NCBI
|
|
8
|
Sharma M, Juvvuna PK, Kukreti H and
McFarlane C: Mega roles of microRNAs in regulation of skeletal
muscle health and disease. Front Physiol. 5:2392014.PubMed/NCBI
|
|
9
|
Minetti GC, Feige JN, Bombard F, Heier A,
Morvan F, Nürnberg B, Leiss V, Birnbaumer L, Glass DJ and Fornaro
M: Gαi2 signaling is required for skeletal muscle growth,
regeneration, and satellite cell proliferation and differentiation.
Mol Cell Biol. 34:619–630. 2014. View Article : Google Scholar :
|
|
10
|
Lee RC, Feinbaum RL and Ambros V: The C.
elegans heterochronic gene lin-4 encodes small RNAs with antisense
complementarity to lin-14. Cell. 75:843–854. 1993. View Article : Google Scholar : PubMed/NCBI
|
|
11
|
Liu N and Bassel-Duby R: Regulation of
skeletal muscle development and disease by microRNAs. Results Probl
Cell Differ. 56:165–190. 2015. View Article : Google Scholar
|
|
12
|
Sene LB, Mesquita FF, de Moraes LN, Santos
DC, Carvalho R, Gontijo JA and Boer PA: Involvement of renal
corpuscle microRNA expression on epithelial-to-mesenchymal
transition in maternal low protein diet in adult programmed rats.
PLoS One. 8:e713102013. View Article : Google Scholar :
|
|
13
|
Raychaudhuri S: MicroRNAs overexpressed in
growth-restricted rat skeletal muscles regulate the glucose
transport in cell culture targeting central TGF-β factor SMAD4.
PLoS One. 7:e345962012. View Article : Google Scholar
|
|
14
|
Chen PY, Ganguly A, Rubbi L, Orozco LD,
Morselli M, Ashraf D, Jaroszewicz A, Feng S, Jacobsen SE, Nakano A
and Pellegrini M: Intrauterine calorie restriction affects
placental DNA methylation and gene expression. Physiol Genomics.
45:565–576. 2013. View Article : Google Scholar : PubMed/NCBI
|
|
15
|
Liu X, Lin Y, Tian B, Miao J, Xi C and Liu
C: Maternal protein restriction alters VEGF signaling and decreases
pulmonary alveolar in fetal rats. Int J Clin Exp Pathol.
7:3101–3111. 2014.PubMed/NCBI
|
|
16
|
Zeng Y, Gu P, Liu K and Huang P: Maternal
protein restriction in rats leads to reduced PGC-1α expression via
altered DNA methylation in skeletal muscle. Mol Med Rep. 7:306–312.
2013.
|
|
17
|
Ozanne SE, Martensz ND, Petry CJ, Loizou
CL and Hales CN: Maternal low protein diet in rats programmes fatty
acid desatu rase activities in the offspring. Diabetologia.
41:1337–1342. 1998. View Article : Google Scholar : PubMed/NCBI
|
|
18
|
He A, Zhu L, Gupta N, Chang Y and Fang F:
Overexpression of micro ribonucleic acid 29, highly up-regulated in
diabetic rats, leads to insulin resistance in 3T3-L1 adipocytes.
Mol Endocrinol. 21:2785–2794. 2007. View Article : Google Scholar : PubMed/NCBI
|
|
19
|
Thorn SR, Rozance PJ, Brown LD and Hay WW
Jr: The intrauterine growth restriction phenotype: fetal
adaptations and potential implications for later life insulin
resistance and diabetes. Semin Reprod Med. 29:225–236. 2011.
View Article : Google Scholar : PubMed/NCBI
|
|
20
|
Henriksen EJ and Prasannarong M: The role
of the renin-angiotensin system in the development of insulin
resistance in skeletal muscle. Mol Cell Endocrinol. 378:15–22.
2013. View Article : Google Scholar
|
|
21
|
Govers R: Cellular regulation of glucose
uptake by glucose transporter GLUT4. Adv Clin Chem. 66:173–240.
2014. View Article : Google Scholar : PubMed/NCBI
|
|
22
|
Bouzakri K, Koistinen HA and Zierath JR:
Molecular mechanisms of skeletal muscle insulin resistance in type
2 diabetes. Curr Diabetes Rev. 1:167–174. 2005. View Article : Google Scholar
|
|
23
|
McClelland AD and Kantharidis P: microRNA
in the development of diabetic complications. Clin Sci (Lond).
126:95–110. 2014. View Article : Google Scholar
|
|
24
|
Jaquet D, Vidal H, Hankard R, Czernichow P
and Levy-Marchal C: Impaired regulation of glucose transporter 4
gene expression in insulin resistance associated with in utero
undernutrition. J Clin Endocrinol Metab. 86:3266–3271.
2001.PubMed/NCBI
|
|
25
|
Pandey AK, Verma G, Vig S, Srivastava S,
Srivastava AK and Datta M: miR-29a levels are elevated in the db/db
mice liver and its overexpression leads to attenuation of insulin
action on PEPCK gene expression in HepG2 cells. Mol Cell
Endocrinol. 332:125–133. 2011. View Article : Google Scholar
|
|
26
|
Coll T, Rodrïguez-Calvo R, Barroso E,
Serrano L, Eyre E, Palomer X and Vázquez-Carrera M: Peroxisome
proliferator-activated receptor (PPAR) beta/delta: a new potential
therapeutic target for the treatment of metabolic syndrome. Curr
Mol Pharmacol. 2:46–55. 2009. View Article : Google Scholar : PubMed/NCBI
|
|
27
|
Pérez-Schindler J, Svensson K,
Vargas-Fernández E, Santos G, Wahli W and Handschin C: The
coactivator PGC-1α regulates skeletal muscle oxidative metabolism
independently of the nuclear receptor PPARβ/δ in sedentary mice fed
a regular chow diet. Diabetologia. 57:2405–2412. 2014. View Article : Google Scholar
|
|
28
|
Liang J, Liu C, Qiao A, Cui Y, Zhang H,
Cui A, Zhang S, Yang Y, Xiao X, Chen Y, et al: MicroRNA-29a-c
decrease fasting blood glucose levels by negatively regulating
hepatic gluconeogenesis. J Hepatol. 58:535–542. 2013. View Article : Google Scholar
|
|
29
|
Hancock CR, Han DH, Chen M, Terada S,
Yasuda T, Wright DC and Holloszy JO: High-fat diets cause insulin
resistance despite an increase in muscle mitochondria. Proc Natl
Acad Sci USA. 105:7815–7820. 2008. View Article : Google Scholar : PubMed/NCBI
|
|
30
|
Dugani CB and Klip A: Glucose transporter
4: cycling, compartments and controversies. EMBO Rep. 6:1137–1142.
2005. View Article : Google Scholar : PubMed/NCBI
|
|
31
|
Ishiki M and Klip A: Minireview: recent
developments in the regulation of glucose transporter-4 traffic:
new signals, locations, and partners. Endocrinology. 146:5071–5078.
2005. View Article : Google Scholar : PubMed/NCBI
|
|
32
|
Kellerer M, Lammers R and Häring HU:
Insulin signal transduction: possible mechanisms for insulin
resistance. Exp Clin Endocrinol Diabetes. 107:97–106. 1999.
View Article : Google Scholar : PubMed/NCBI
|
|
33
|
Krämer DK, Al-Khalili L, Guigas B, Leng Y,
Garcia-Roves PM and Krook A: Role of AMP kinase and PPARdelta in
the regulation of lipid and glucose metabolism in human skeletal
muscle. J Biol Chem. 282:19313–19320. 2007. View Article : Google Scholar : PubMed/NCBI
|
|
34
|
Handschin C and Spiegelman BM: The role of
exercise and PGC1alpha in inflammation and chronic disease. Nature.
454:463–469. 2008. View Article : Google Scholar : PubMed/NCBI
|