Introduction
Irritable bowel syndrome (IBS) is a common chronic
gastrointestinal (GI) disorder with a complex pathogenesis
(1). Multiple factors contribute
to the development of IBS, such as diet, an altered neuroendocrine
system, intestinal microbiota, low-grade mucosal inflammation and
genetics (2). The majority of
patients with IBS report that their symptoms develop after
consuming certain foodstuffs (3–5),
most commonly fermentable oligosaccharides, disaccharides,
monosaccharides and polyols (FODMAPs) (6–8).
The types of enteroendocrine cells differ between
the proximal and distal parts of the small intestine (9). The duodenum harbors a large number
of different enteroendocrine cells, such as those related to
serotonin, somatostatin, cholecystokinin, secretin and gastric
inhibitory peptide, whereas the ileum contains serotonin, peptide
YY, pancreatic polypeptide, oxyntomodulin (enteroglucagon) and
somatostatin (10,11).
Chromogranin A (CgA) is a common marker of
enteroendocrine cells in the gut (12–14). Patients with IBS reportedly have
abnormal densities of CgA-immunoreactive cells throughout the
different sections of the GI tract (15–19). Providing patients with IBS with
dietary guidance regarding the consumption of a low-FODMAP diet has
been found to improve their symptoms and quality of life (20) and to normalize the densities of
several enteroendocrine cell types in their stomach (21,22) and colon (23,24). Thus, the present study was
undertaken to investigate the effects of dietary guidance on the
total population of enteroendocrine cells in the small intestine
(duodenum and ileum) as detected by CgA in the same cohort of
patients with IBS.
Subjects and methods
Patients and controls
Patients of both genders aged between 18 and 70
years who were referred to the Division of Gastroenterology, Stord
Hospital, Stord, Norway and fulfilled Rome-III criteria for the
diagnosis of IBS were included in this study. The exclusion
criteria included pregnant or lactating women, and patients with
serious psychiatric or any organic/systemic diseases, drug abuse,
or previous abdominal surgery, with the exception of appendectomy,
caesarean section and hysterectomy.
A control group of 14 subjects comprising 9 females
and 5 males with a mean age of 54 years (range, 26–70 years) was
included in this study. The control group subjects had no symptoms
related to IBS and they were found from subjects presenting with
health concerns not related to IBS. Four subjects in the control
group underwent endoscopies due to GI bleeding where the source was
identified as hemorrhoids (n=3) or angiodysplasia (n=1); the other
10 subjects in the control group had health concerns caused by
family members being diagnosed with cancer of the GI tract.
The study was performed in accordance with the
Declaration of Helsinki and was approved by the Local Committee for
Medical Research Ethics West, Bergen, Norway (no. 2010/2650-2). All
patients and control subjects provided both oral and written
consent prior to participating in the study.
Study design
Forty-six patients (35 females and 11 males) with a
mean age of 35 years (range, 18–69 years) were enrolled in this
study. All the patients underwent physical examinations and blood
tests, including CBC, C-reactive protein, antinuclear antibody
(ANA), electrolytes, creatinine, and thyroid and liver function
tests were performed to exclude the presence of inflammation,
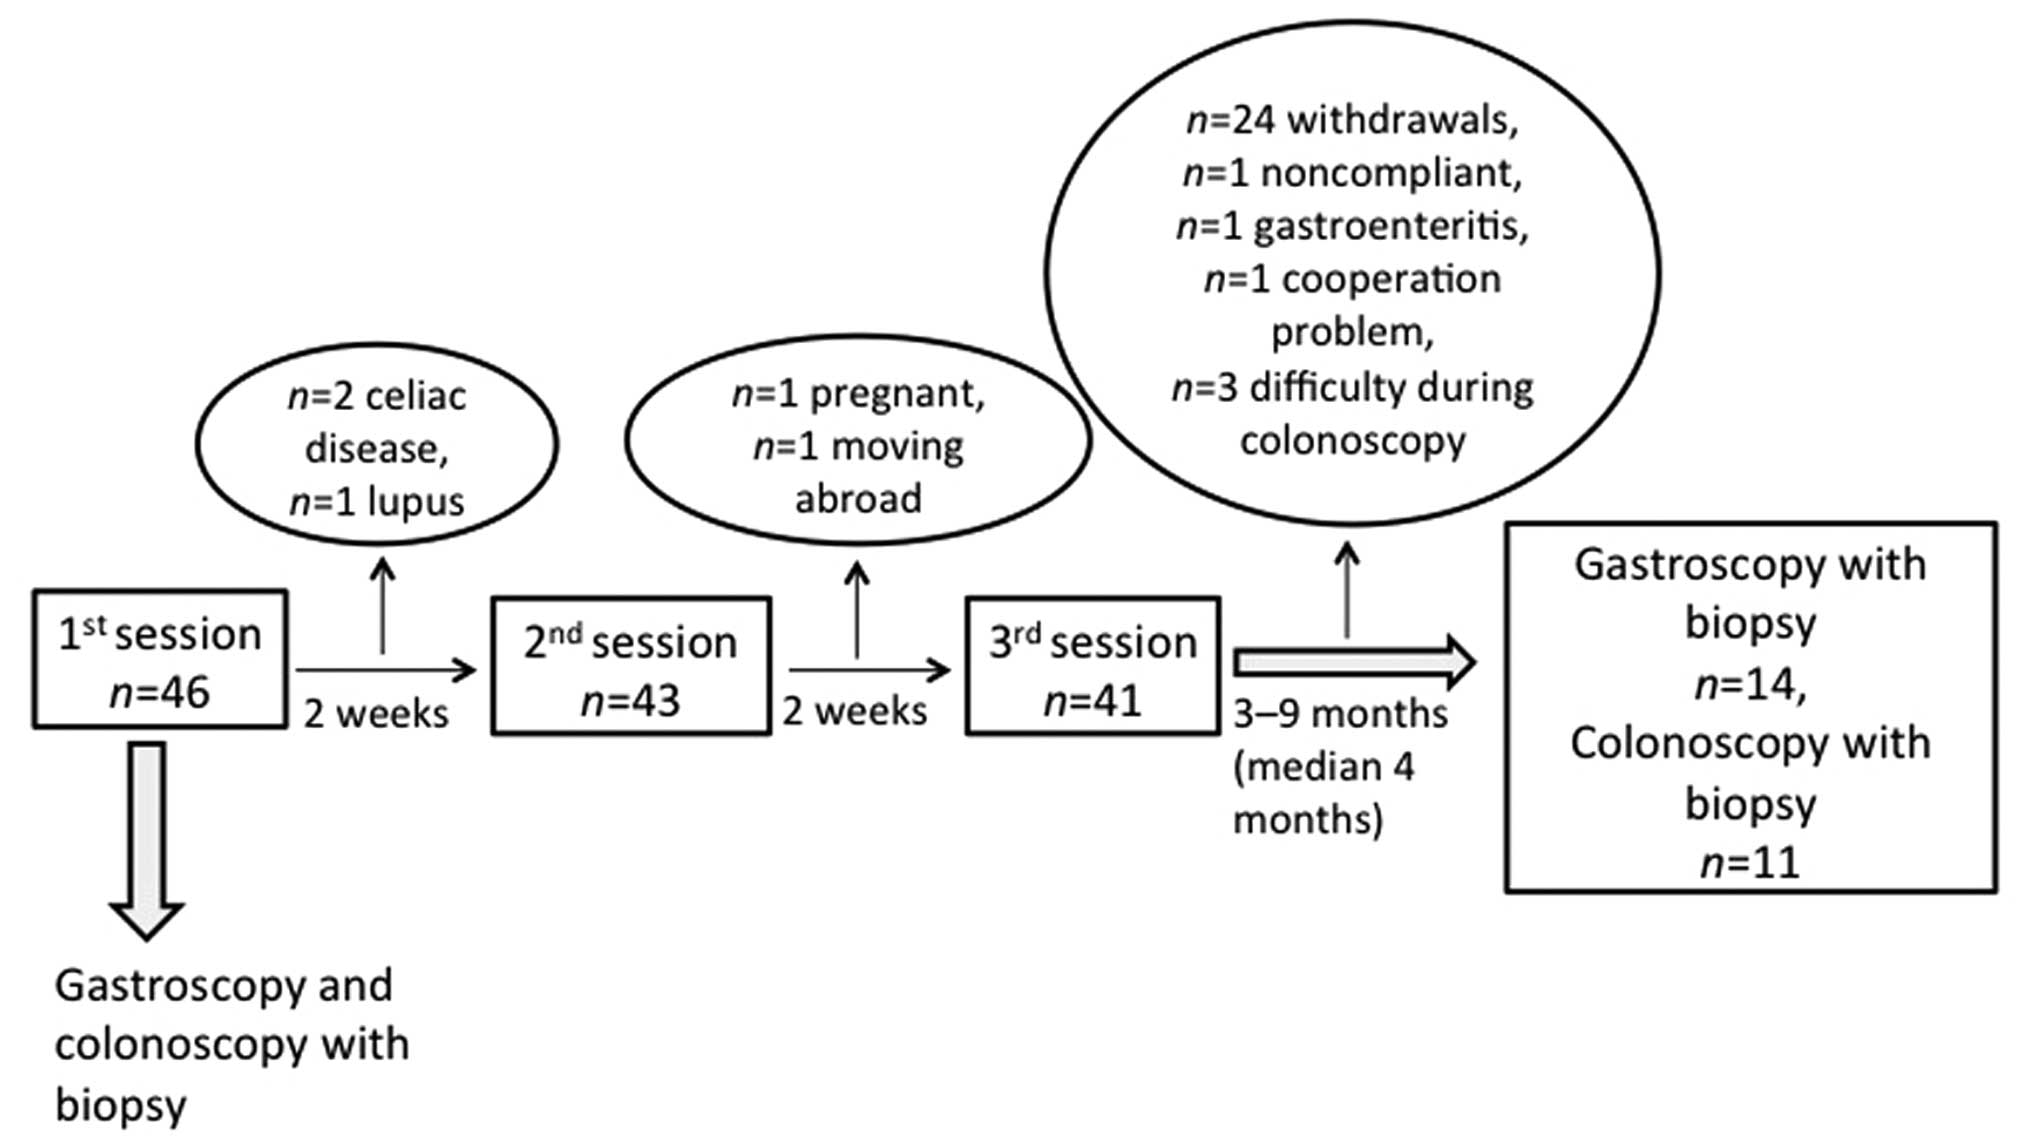
infection and other organic diseases. The patients were scheduled
to receive 3 sessions (45 min each) of individualized dietary
guidance from a nurse experienced in diet and IBS, with the
sessions separated by intervals of at least 2 weeks (Fig. 1). The individualized dietary
guidance has been previously explained in detail in our previous
studies (20–24). Briefly, the first session focused
on delivering general information about IBS, regular and healthy
eating habits and on foodstuffs that aggravate IBS symptoms, such
as insoluble dietary fiber and poorly absorbable FODMAPs. The
patients were told to alternate between consuming diets that were
rich and poor in proteins, fats and carbohydrates, each for 3–4
days, for a total period of 2 weeks. The daily consumption of food
and fluids along with any associated symptoms (frequency and degree
of abdominal pain and abdominal distension) and the frequency and
consistency of the stool were registered in a daily diary. No food
supplements containing probiotics, antibiotics and other
medications were allowed during the study unless otherwise
specified. In the second session, the patients were instructed to
alter the proportions of proteins, fats and carbohydrates in their
diet and to avoid foodstuffs (including vegetables and fruits) that
are rich in FODMAPs or insoluble fiber, and to consume foodstuffs
that contained lower amounts of FODMAPs and insoluble fiber. During
the third session, each patient gave feedback about the dietary
guidance, and a suitable diet was designed for the patient to
follow until the end of the study.
The patients were examined with gastroscopies and
colonoscopies before the first session (baseline) and at 3–9 months
(median, 4 months) following the third session of dietary
guidance.
Dietary assessment
Dietary intake was assessed using the MoBa food
frequency questionnaire (MoBa FFQ). Responses to this questionnaire
report the frequency and the portion sizes of food meals and
beverages consumed over a defined period of time. Data analysis was
conducted using software to calculate the nutrient content of the
diet. The MoBa FFQ was developed and validated by the Norwegian
Institute of Public Health in Oslo, Norway (25,26). This questionnaire inquires about
the consumption of 225 foodstuffs and identifies the dietary habits
of the participant, including the intake of any oral supplements,
according to typical Norwegian meal patterns. The patients
completed the MoBa FFQ form before the first session and again at
least 3 months after the third session of individualized dietary
guidance, which was delivered at the same day when the endoscopy
was scheduled, as previously described (20).
Endoscopies
The control subjects and patients fasted overnight
and used Picoprep® (Ferring Pharmaceuticals, Saint-Prex,
Switzerland) for bowel preparation the day before the endoscopies
were performed. During gastroscopy, 4 biopsy samples were obtained
from the descending part of the duodenum, distal to the papilla of
Vater. Four biopsy samples were also taken from the ileum during
the colonoscopy examination of each subject.
Histopathology and
immunohistochemistry
The enteroendocrine cells are present on the surface
facing the lumen and mostly in the crypts. All the 4 biopsy samples
were fixed overnight in 4% buffered paraformaldehyde, embedded in
paraffin and sectioned at a thickness of 5 µm. Each slide
consisted of 2 sections taken 50 µm apart (related to their
position in the biopsied tissue sample), thus ensuring to have
included slices from the entire mucosa and not just the surface.
The sections were stained with hematoxylin and eosin and
immunostained using the avidin-biotin complex (ABC) method with the
Vectastain ABC kit and the chromogen 3,3′-diaminobenzidine (DAB)
peroxidase substrate kit (both from Vector Laboratories,
Burlingame, CA, USA) as previously described (27). The primary monoclonal mouse
antibody raised against the N-terminal of purified CgA (code no.
M0869; Dako, Glostrup, Denmark) was diluted to 1:1,000. The
sections were then hydrated and immersed in 0.01% hydrogen peroxide
in phosphate-buffered saline (PBS; pH 7.4) for 10 min to inhibit
endogenous peroxidase activity. After washing in buffer, the
sections were treated with 1% bovine serum albumin for 30 min to
block non-specific binding sites and then incubated at room
temperature for 1 h with the primary antibody. The sections were
then washed in PBS and incubated at room temperature for 30 min
with biotinylated swine antimouse IgG (Dako) diluted to 1:200.
After washing the slides in PBS, the sections were incubated for 30
min with avidin-biotin-peroxidase complex diluted to 1:100 and then
submerged in DAB followed by counterstaining with hematoxylin.
Computer image analysis
The density of CgA-immunoreactive cells in the
duodenum and ileum of patients with IBS and the controls was
measured using Olympus Cell^D software (Olympus, Tokyo, Japan). The
number of CgA-immunoreactive cells and the area of the epithelial
cells were measured in 10 randomly selected fields per slide, at
magnification of ×40; at this magnification, each field represents
a tissue area of 0.14 mm2. The data from the fields were
tabulated and the density of CgA-immunoreactive cells, expressed as
the number of cells per square millimeter of the epithelium, was
computed and analyzed statistically. All quantification was
conducted by the same scientist (Dr Tarek Mazzawi) who was blinded
to the identity of the sections.
Statistical analysis
Statistical analyses [95% confidence interval (CI)
and P-value] were conducted using the program GraphPad Prism 6. The
Kruskal-Wallis non-parametric test, with Dunn's test as a post-test
was used to make comparisons between the control subjects and
patients with IBS before dietary guidance, and between the control
subjects and patients with IBS after dietary guidance. The paired
t-test was used to compare the results obtained from the patients
before and after they received dietary guidance. The data are
presented as the mean ± SEM values. A probability value of
P<0.05 was considered to indicate a statistically significant
difference.
Results
Patients and control subjects
Forty-six patients were included in this study and
they received sessions of individualized dietary guidance. The
study flow chart presented in Fig.
1 shows that several patients did not complete the study for
different reasons, namely due to newly diagnosed celiac disease
(n=2) or lupus (n=1), cooperation issues (n=1), noncompliance
(n=1), pregnancy (n=1), moving abroad (n=1), receiving antibiotics
due to gastroenteritis (n=1) and the withdrawal of consent (n=24).
Thus, 14 of the original 46 patients with IBS completed the entire
study, comprising 9 females and 5 males with a mean age of 33 years
(range, 21–44 years). In 3 patients (2 females and 1 male) it was
technically difficult to intubate the ileocecal valve during
colonoscopy; thus only 11 patients (7 females and 4 males) with a
mean age of 33 years (range, 24–44 years) underwent the second
colonoscopy examination with biopsy sampling.
Six of the patients who completed the study used one
or more of the following: proton-pump inhibitors (n=4), thyroxin
substitution tablets (n=2), asthma inhalators (n=1), angiotensin II
receptor antagonist tablets against hypertension (n=1), antiallergy
tablets (n=3), contraceptive pills (n=2), and
antidepressants/anxiolytics (n=2). These patients were instructed
not to take any type of proton-pump inhibitor or antacids starting
from 1 week before the study and for the duration of the study.
All the 14 subjects in the control group underwent a
gastroscopy with biopsy samples obtained from the duodenum in the
same manner as for the patients with IBS. In 4 of these 14 subjects
(2 males and 2 females) it was difficult to intubate the ileocecal
valve, and thus biopsy samples were collected from the ileum only
for 10 control subjects (3 males and 7 females), who had a mean age
of 51 years (range, 26–70 years).
Dietary assessment
The change in diet implemented in the present study
has been described in detail elsewhere (20). In brief, the daily total
consumption of fruits and vegetables rich in FODMAPs decreased
significantly from 16.2±5.3 g before receiving dietary guidance to
9.2±3.2 g after receiving dietary guidance (P=0.02). However, no
significant change was observed in the daily consumption of fiber
before (27.4±2.5 g) and after (23.1±2.2 g) receiving dietary
guidance (P=0.09), as previously described (20).
Endoscopy, histopathology and
immunohistochemistry
The gastroscopies and colonoscopies indicated that
the duodenum and ileum were normal both macroscopically (data not
shown) and microscopically in both patients with IBS and the
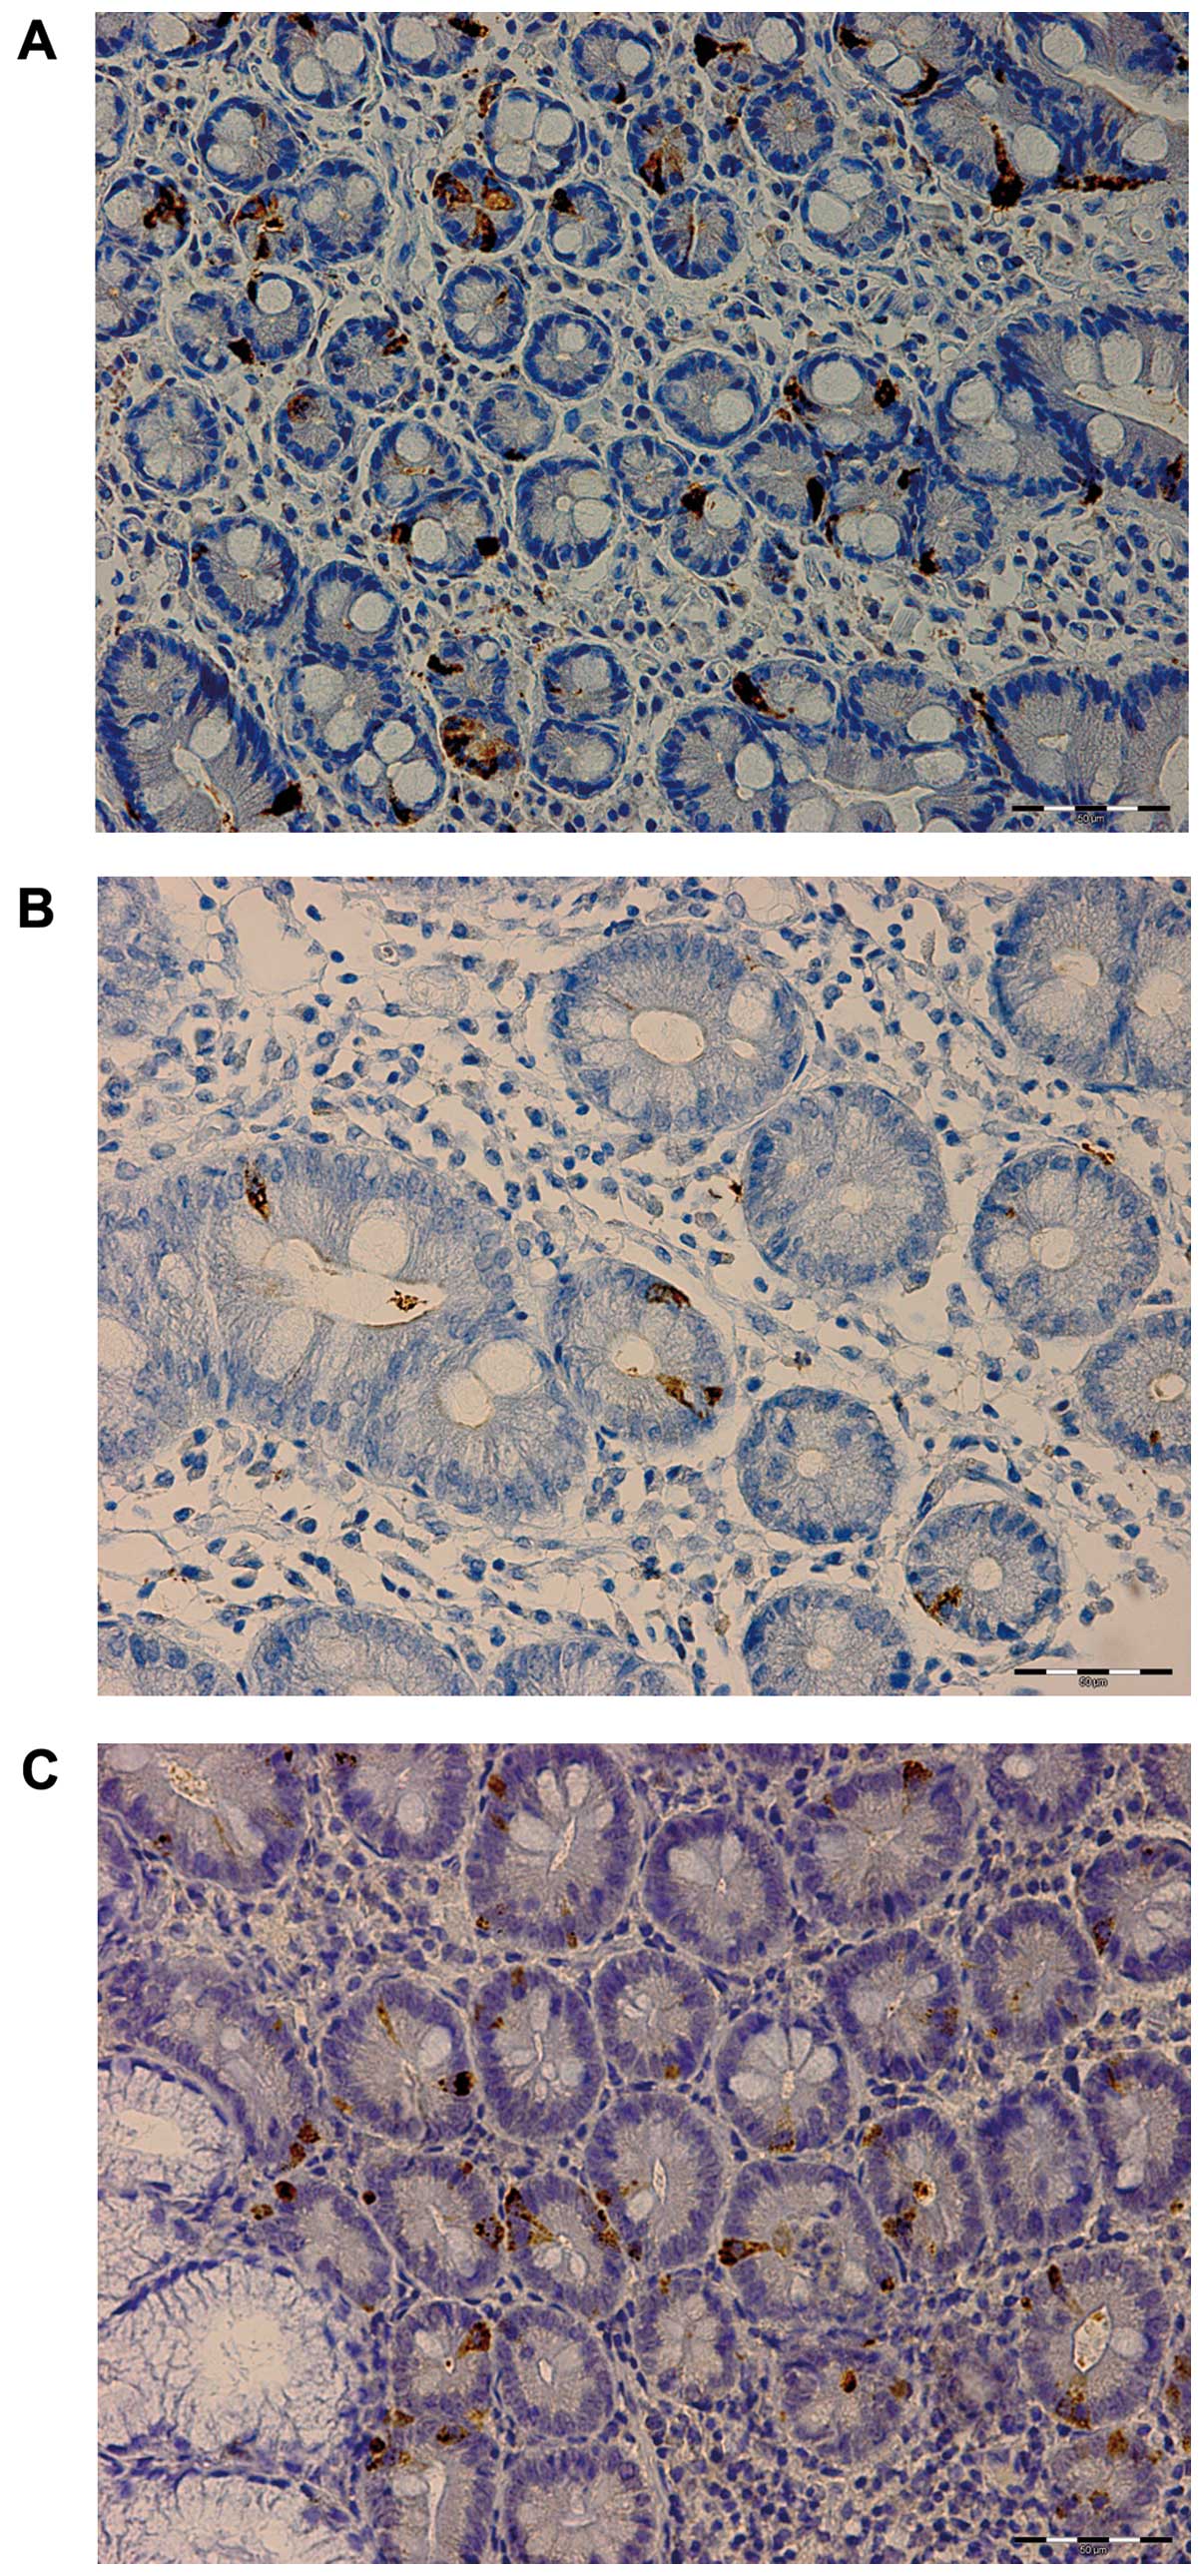
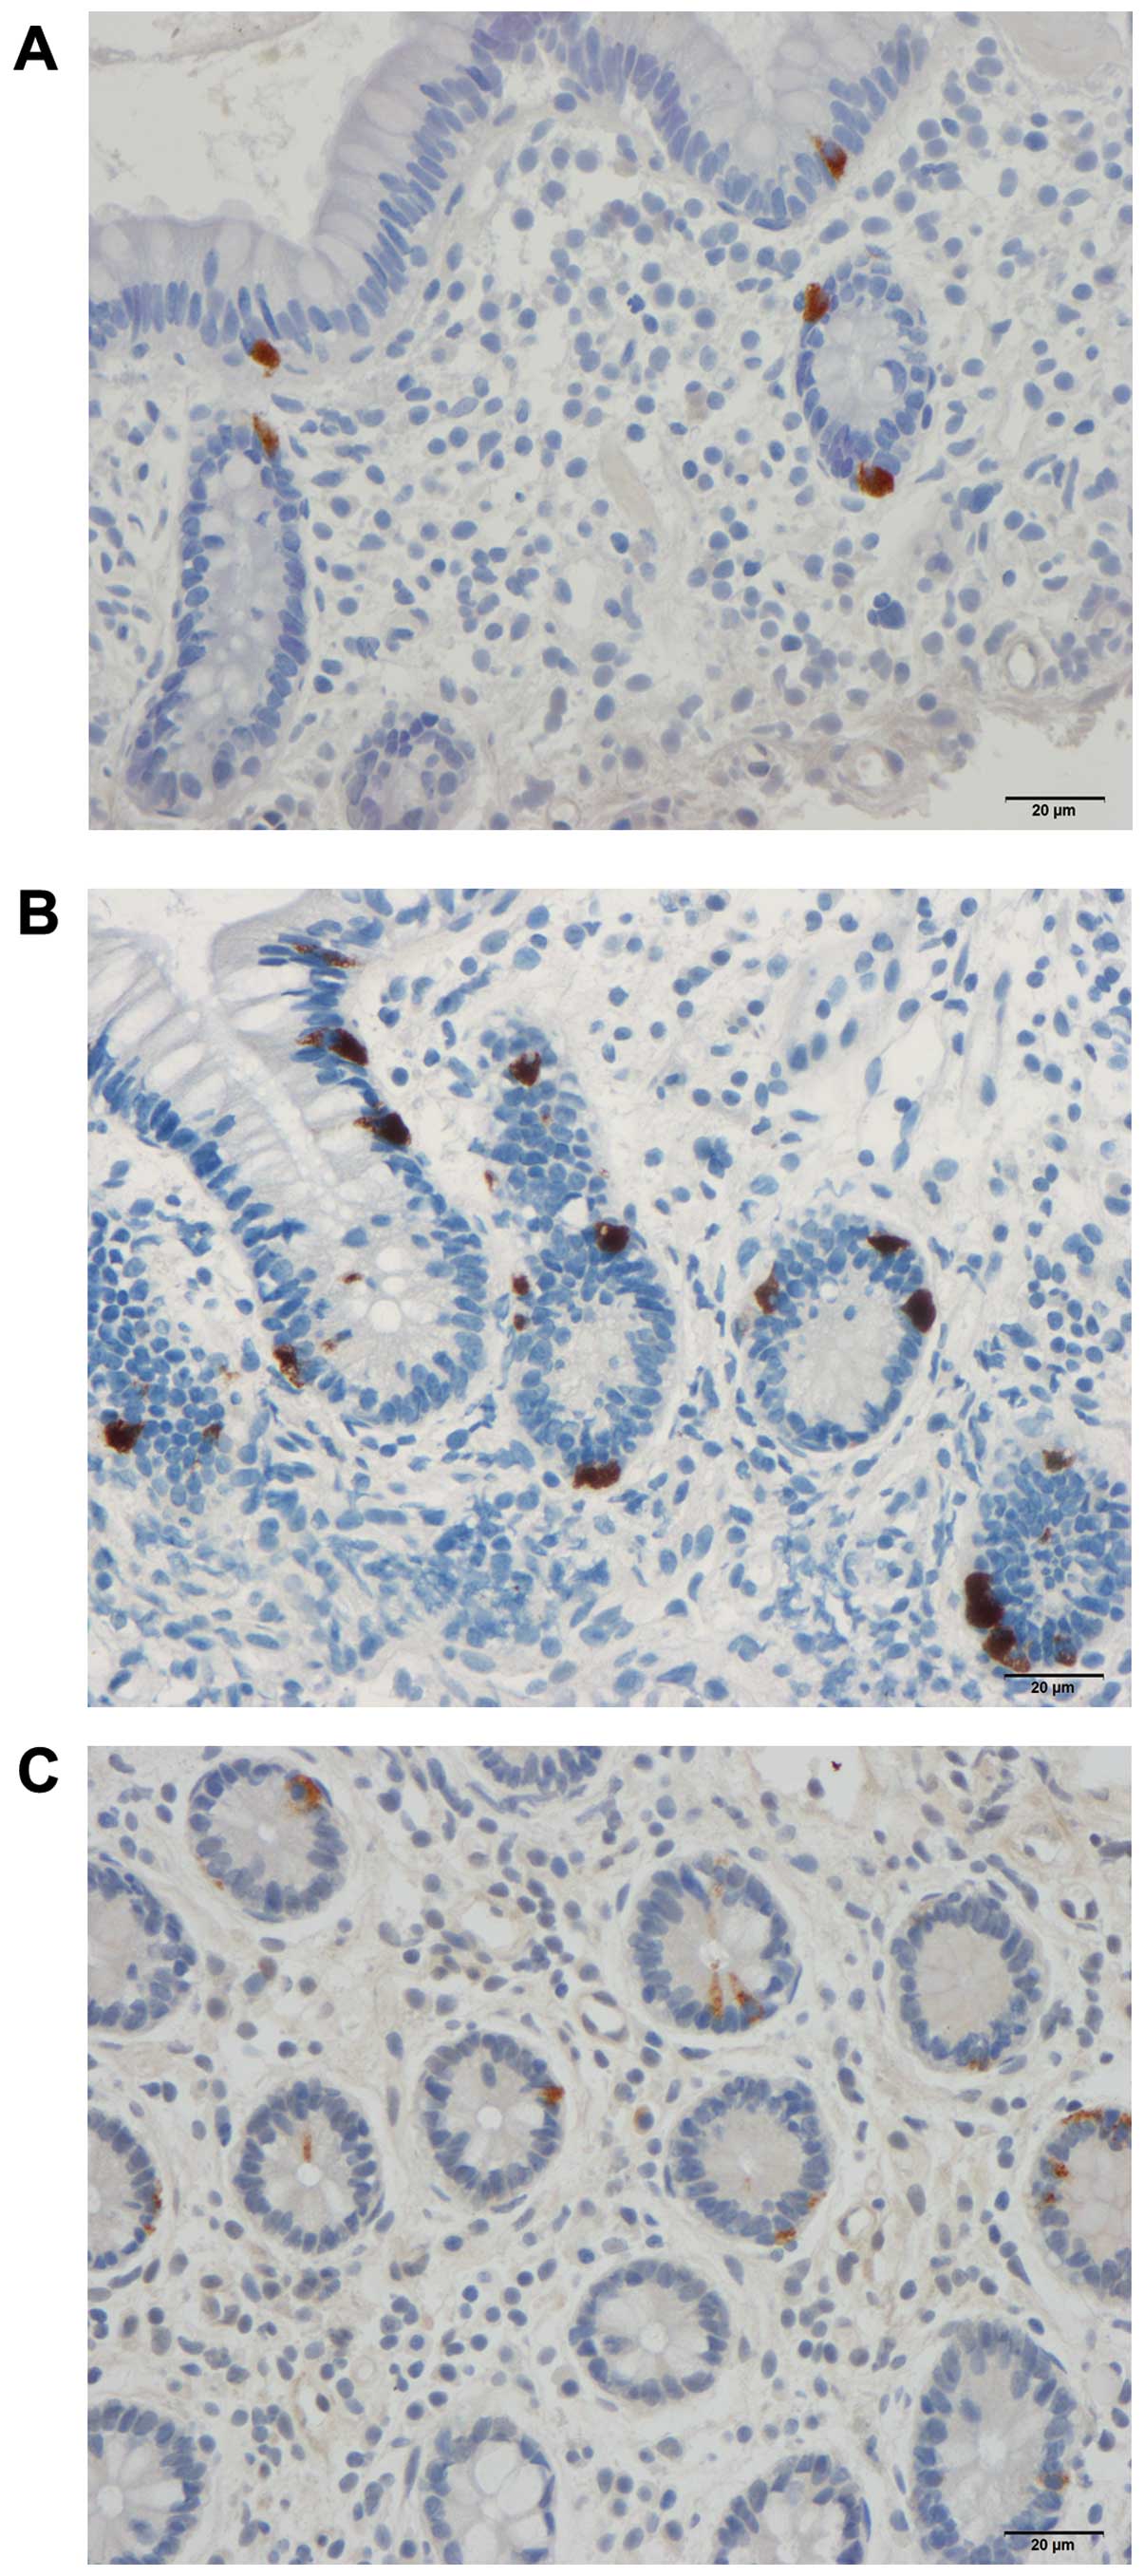
control subjects. CgA-immunoreactive cells were found in the mucosa
of both the duodenum and ileum (mostly crypts) of the patients with
IBS and the control subjects. These cells were either basket- or
flask-shaped, and sometimes exhibited a long basal cytoplasmic
process (Figs. 3 and 5).
Computerized image analysis
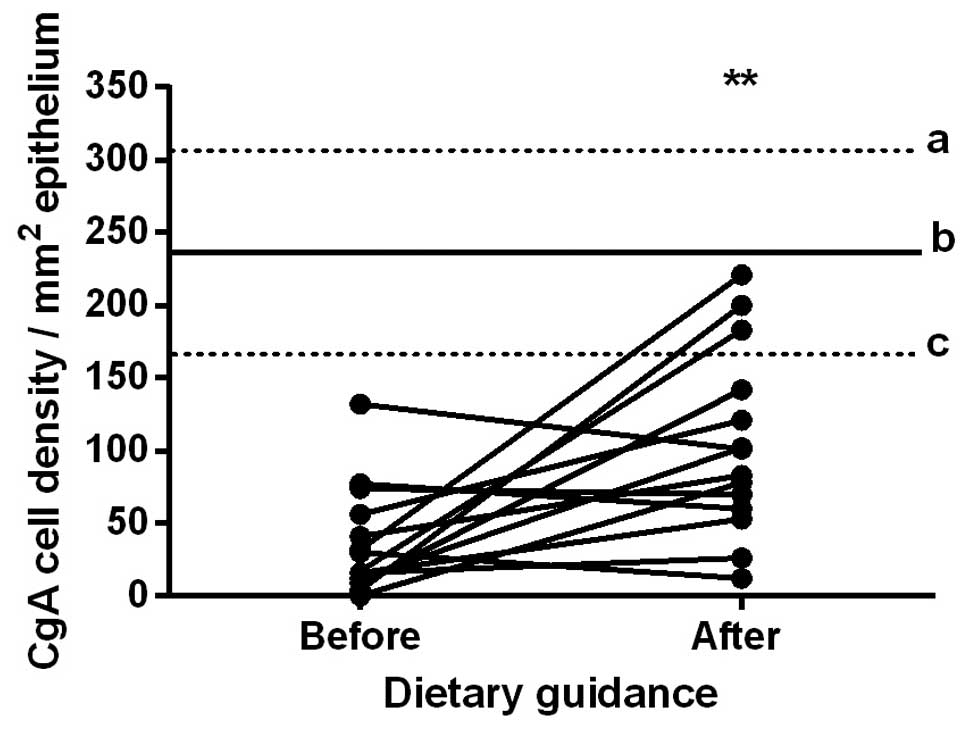
Duodenum
The densities of CgA-immunoreactive cells in the
duodenum in the control subjects and in the patients with IBS
before and after they received dietary guidance are listed in
Table I and illustrated in
Figs. 2 and 3. The paired t-test indicated that the
density of CgA-immunoreactive cells in the duodenum in the patients
with IBS increased significantly after they had received dietary
guidance (P=0.007).
 | Table IDensities of chromogranin
A-immunoreactive cells in the duodenum and ileum of the control
subjects and patients with IBS before and after receiving dietary
guidance. |
Table I
Densities of chromogranin
A-immunoreactive cells in the duodenum and ileum of the control
subjects and patients with IBS before and after receiving dietary
guidance.
| Location | Endocrine cell
densities (cells/mm2)
| aP-value | bP-value | cP-value |
|---|
| Controls | Patients
|
|---|
| Before
guidance | After guidance |
|---|
| Duodenum | 235.9±31.9 | 36.9±9.8 | 103.7±16.9 | <0.0001g | 0.03d | 0.007e |
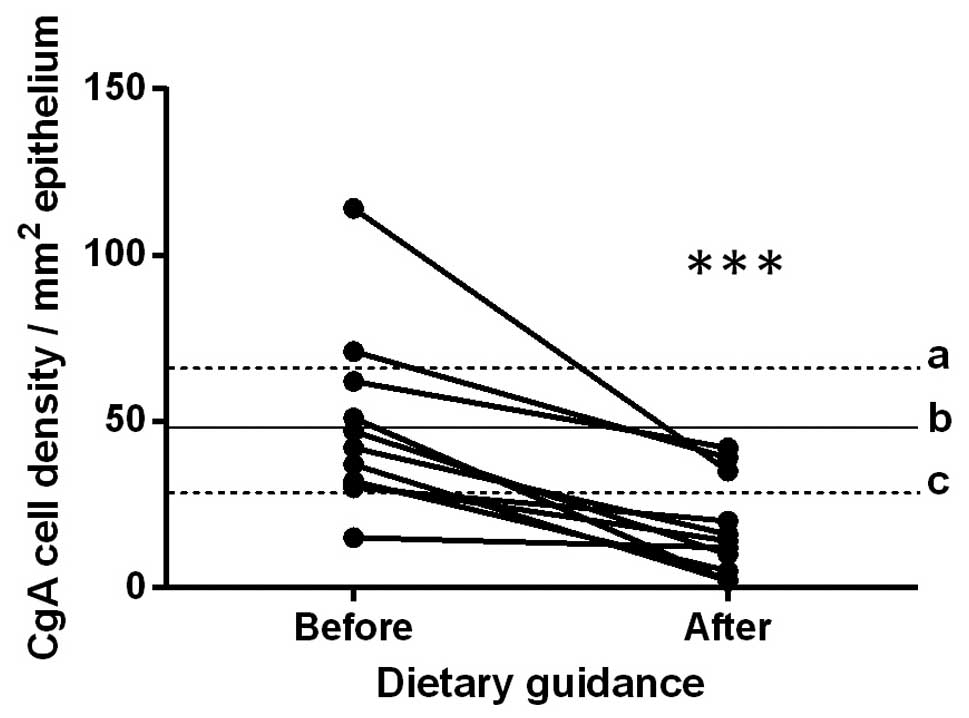
| Ileum | 47.4±8.3 | 48.4±8.1 | 17.9±4.4 | 0.99 | 0.009e | 0.0006f |
Ileum
The densities of CgA-immunoreactive cells in the
ileum in the control subjects, and in the patients with IBS before
and after they received dietary guidance are listed in Table I and illustrated in Figs. 4 and 5. The paired t-test indicated that the
density of CgA-immunoreactive cells in the ileum in the patients
with IBS decreased significantly after they had received dietary
guidance (P=0.0006).
Discussion
Clinical studies involving patients with IBS often
have high drop-out rates, reportedly ranging between 33 and 48%
(28–32), and this was also the case for the
present study. The drop-out rate in the present study was 76%.
Twenty-four patients (52%) out of the total number of patients
included in this study (n=46) were unwilling to complete the whole
study and withdrew their consents due to the complexity of the
study, including 2 gastroscopies and 2 colonoscopies and following
a strict diet for at least 3 months. In addition, 11 patients (24%)
were excluded due to different reasons (celiac disease, lupus,
pregnancy, moving abroad, noncompliance, gastroenteritis and
technical difficulties encountered when performing
colonoscopies).
CgA is a member of the granin
(chromogranin-secretogranin) family located within the vesicles of
neurons and endocrine cells (12,13,33). The biological function of CgA is
not yet completely known (14).
CgA and its derived peptides may act as modulators of cells and
tissues associated with inflammation (34). CgA serves as a marker for the
enteroendocrine cells and endocrine tumors (12–14,17). Thus, the changes in CgA cell
densities reflect changes in the total number of enteroendocrine
cells. The increase or decrease in CgA cell densities signifies
changes in the densities of one or different enteroendocrine cells
in the respective segment of the small intestine. The densities of
CgA-immunoreactive cells have been previously reported to be
abnormal in the duodenum (17)
and ileum (19) of patients with
IBS, which is consistent with our findings obtained from the
patients before receiving dietary guidance. The densities of the
CgA-immunoreactive cells in the small intestine (duodenum and
ileum) changed significantly after the patients received dietary
guidance, with the values moving toward those measured in the
duodenum in the control subjects.
There are at least 15 types of enteroendocrine cells
in the gut, which constitute part of the neuroendocrine system
(10,35). The enteroendocrine cells project
microvilli into the lumen of the gut and regulate the functions of
the GI tract by releasing specific hormones, depending on the
sensed luminal contents (36–48). The main luminal contents that
trigger the enteroendocrine cells in the gut are the nutrients
(1,49). Mature enteroendocrine cells
differentiate from stem cells after 2–6 days (50,51), and the densities of stem cells in
the duodenum is lower in IBS patients than in healthy controls
(52). It can be speculated that
changing the diet through guidance, resulting in improvement in IBS
symptoms, as shown in an earlier study on the same cohort of IBS
patients (20), can alter the
differentiation of enteroendocrine cells and may explain the
observed changes in the CgA-immunoreactive cell densities in the
small intestine. This interaction between diet and enteroendocrine
cells is a dynamic process (53).
The enteroendocrine cells regulate motility, abdominal visceral
sensitivity, secretion, absorption, cell proliferation, local
immune defense and appetite (1).
The symptoms associated with IBS appear to be caused by GI
dysmotility, visceral hypersensitivity and abnormal intestinal
secretion (1). As mentioned
above, motility, visceral sensitivity and secretion are regulated
by the enteroendocrine cells in the gut.
To the best of our knowledge, the present study is
the first to demonstrate that diet can alter the densities of
enteroendocrine cells in the small intestine, in a manner similar
to that observed in the stomach (21,22) and large intestine (23,24), which may have contributed to the
improvement in the IBS symptoms (20). The results also highlight the
involvement of the enteroendocrine cells in the gut in the
pathophysiology of IBS. The change in the CgA-immunoreactive cell
densities after receiving dietary guidance may reflect a change in
the densities of the small intestinal enteroendocrine cells.
However, future studies are warranted to determine the actual types
of enteroendocrine cell that are affected in IBS.
Acknowledgments
The present study was financially supported by a
grant from Helse-Fonna (40415).
References
|
1
|
El-Salhy M, Gundersen D, Gilja OH,
Hatlebakk JG and Hausken T: Is irritable bowel syndrome an organic
disorder? World J Gastroenterol. 20:384–400. 2014. View Article : Google Scholar : PubMed/NCBI
|
|
2
|
El-Salhy M, Gundersen D, Hatlebakk JG and
Hausken T: Irritable bowel syndrome. Nova Science; Publisher, New
York, NY: pp. 1–160. 2012
|
|
3
|
Simrén M, Månsson A, Langkilde AM,
Svedlund J, Abrahamsson H, Bengtsson U and Björnsson ES:
Food-related gastrointestinal symptoms in the irritable bowel
syndrome. Digestion. 63:108–115. 2001. View Article : Google Scholar : PubMed/NCBI
|
|
4
|
Monsbakken KW, Vandvik PO and Farup PG:
Perceived food intolerance in subjects with irritable bowel
syndrome - etiology, prevalence and consequences. Eur J Clin Nutr.
60:667–672. 2006. View Article : Google Scholar : PubMed/NCBI
|
|
5
|
Williams EA, Nai X and Corfe BM: Dietary
intakes in people with irritable bowel syndrome. BMC Gastroenterol.
11(9)2011. View Article : Google Scholar
|
|
6
|
Gibson PR, Barrett JS and Muir JG:
Functional bowel symptoms and diet. Intern Med J. 43:1067–1074.
2013. View Article : Google Scholar : PubMed/NCBI
|
|
7
|
Gibson PR, Newnham E, Barrett JS, Shepherd
SJ and Muir JG: Review article: fructose malabsorption and the
bigger picture. Aliment Pharmacol Ther. 25:349–363. 2007.
View Article : Google Scholar : PubMed/NCBI
|
|
8
|
Gibson PR and Shepherd SJ: Evidence-based
dietary management of functional gastrointestinal symptoms: the
FODMAP approach. J Gastroenterol Hepatol. 25:252–258. 2010.
View Article : Google Scholar : PubMed/NCBI
|
|
9
|
Gunawardene AR, Corfe BM and Staton CA:
Classification and functions of enteroendocrine cells of the lower
gastrointestinal tract. Int J Exp Pathol. 92:219–231. 2011.
View Article : Google Scholar : PubMed/NCBI
|
|
10
|
Rindi G, Leiter AB, Kopin AS, Bordi C and
Solcia E: The 'normal' endocrine cell of the gut: changing concepts
and new evidences. Ann N Y Acad Sci. 1014:1–12. 2004. View Article : Google Scholar : PubMed/NCBI
|
|
11
|
Polak JM, Coulling I, Bloom S and Pearse
AG: Immunofluorescent localization of secretin and enteroglucagon
in human intestinal mucosa. Scand J Gastroenterol. 6:739–744. 1971.
View Article : Google Scholar : PubMed/NCBI
|
|
12
|
Taupenot L, Harper KL and O'Connor DT: The
chromogranin-secretogranin family. N Engl J Med. 348:1134–1149.
2003. View Article : Google Scholar : PubMed/NCBI
|
|
13
|
Wiedenmann B and Huttner WB: Synaptophysin
and chromogranins/secretogranins - widespread constituents of
distinct types of neuroendocrine vesicles and new tools in tumor
diagnosis. Virchows Arch B Cell Pathol Incl Mol Pathol. 58:95–121.
1989. View Article : Google Scholar
|
|
14
|
Deftos LJ: Chromogranin A: its role in
endocrine function and as an endocrine and neuroendocrine tumor
marker. Endocr Rev. 12:181–187. 1991. View Article : Google Scholar : PubMed/NCBI
|
|
15
|
El-Salhy M, Gilja OH, Gundersen D,
Hatlebakk JG and Hausken T: Duodenal chromogranin a cell density as
a biomarker for the diagnosis of irritable bowel syndrome.
Gastroenterol Res Pract. 2014:4628562014. View Article : Google Scholar : PubMed/NCBI
|
|
16
|
El-Salhy M, Gilja OH and Hausken T:
Chromogranin A cells in the stomachs of patients with sporadic
irritable bowel syndrome. Mol Med Rep. 10:1753–1757.
2014.PubMed/NCBI
|
|
17
|
El-Salhy M, Lomholt-Beck B and Hausken T:
Chromogranin A as a possible tool in the diagnosis of irritable
bowel syndrome. Scand J Gastroenterol. 45:1435–1439. 2010.
View Article : Google Scholar : PubMed/NCBI
|
|
18
|
El-Salhy M, Mazzawi T, Gundersen D and
Hausken T: Chromogranin A cell density in the rectum of patients
with irritable bowel syndrome. Mol Med Rep. 6:1223–1225.
2012.PubMed/NCBI
|
|
19
|
El-Salhy M, Wendelbo IH and Gundersen D:
Reduced chromogranin A cell density in the ileum of patients with
irritable bowel syndrome. Mol Med Rep. 7:1241–1244. 2013.PubMed/NCBI
|
|
20
|
Mazzawi T, Hausken T, Gundersen D and
El-Salhy M: Effects of dietary guidance on the symptoms, quality of
life and habitual dietary intake of patients with irritable bowel
syndrome. Mol Med Rep. 8:845–852. 2013.PubMed/NCBI
|
|
21
|
Mazzawi T, Hausken T, Gundersen D and
El-Salhy M: Effect of dietary management on the gastric endocrine
cells in patients with irritable bowel syndrome. Eur J Clin Nutr.
69:519–524. 2015. View Article : Google Scholar :
|
|
22
|
Mazzawi T, Gundersen D, Hausken T and
El-Salhy M: Increased gastric chromogranin A cell density following
changes to diets of patients with irritable bowel syndrome. Mol Med
Rep. 10:2322–2326. 2014.PubMed/NCBI
|
|
23
|
Mazzawi T, Gundersen D, Hausken T and
El-Salhy M: Increased chromogranin a cell density in the large
intestine of patients with irritable bowel syndrome after receiving
dietary guidance. Gastroenterol Res Pract. 2015:8238972015.
View Article : Google Scholar : PubMed/NCBI
|
|
24
|
Mazzawi T, Hausken T, Gundersen D and
El-Salhy M: Dietary guidance normalizes large intestinal endocrine
cells densities in patients with irritable bowel syndrome. Eur J
Clin Nutr. 70:175–181. 2016. View Article : Google Scholar :
|
|
25
|
Masson LF, McNeill G, Tomany JO, Simpson
JA, Peace HS, Wei L, Grubb DA and Bolton-Smith C: Statistical
approaches for assessing the relative validity of a food-frequency
questionnaire: use of correlation coefficients and the kappa
statistic. Public Health Nutr. 6:313–321. 2003. View Article : Google Scholar : PubMed/NCBI
|
|
26
|
Brantsaeter AL, Haugen M, Alexander J and
Meltzer HM: Validity of a new food frequency questionnaire for
pregnant women in the Norwegian Mother and Child Cohort Study
(MoBa). Matern Child Nutr. 4:28–43. 2008. View Article : Google Scholar : PubMed/NCBI
|
|
27
|
El-Salhy M, Stenling R and Grimelius L:
Peptidergic innervation and endocrine cells in the human liver.
Scand J Gastroenterol. 28:809–815. 1993. View Article : Google Scholar : PubMed/NCBI
|
|
28
|
Enck P, Klosterhalfen S and Kruis W:
Determination of placebo effect in irritable bowel syndrome.
Deutsche medizinische Wochenschrift (1946). 130:1934–1937. 2005.In
German. View Article : Google Scholar
|
|
29
|
Ostgaard H, Hausken T, Gundersen D and
El-Salhy M: Diet and effects of diet management on quality of life
and symptoms in patients with irritable bowel syndrome. Mol Med
Rep. 5:1382–1390. 2012.PubMed/NCBI
|
|
30
|
Abdul-Baki H, El Hajj II, Elzahabi L, Azar
C, Aoun E, Skoury A, Chaar H and Sharara AI: A randomized
controlled trial of imipramine in patients with irritable bowel
syndrome. World J Gastroenterol. 15:3636–3642. 2009. View Article : Google Scholar : PubMed/NCBI
|
|
31
|
Zernicke KA, Campbell TS, Blustein PK,
Fung TS, Johnson JA, Bacon SL and Carlson LE: Mindfulness-based
stress reduction for the treatment of irritable bowel syndrome
symptoms: a randomized wait-list controlled trial. Int J Behav Med.
20:385–396. 2013. View Article : Google Scholar
|
|
32
|
Halmos EP, Power VA, Shepherd SJ, Gibson
PR and Muir JG: A diet low in FODMAPs reduces symptoms of irritable
bowel syndrome. Gastroenterology. 146:67–75.e5. 2014. View Article : Google Scholar
|
|
33
|
Khan WI and Ghia JE: Gut hormones:
Emerging role in immune activation and inflammation. Clin Exp
Immunol. 161:19–27. 2010.PubMed/NCBI
|
|
34
|
Helle KB: Regulatory peptides from
chromogranin A and secretogranin II: putative modulators of cells
and tissues involved in inflammatory conditions. Regul Pept.
165:45–51. 2010. View Article : Google Scholar
|
|
35
|
May CL and Kaestner KH: Gut endocrine cell
development. Mol Cell Endocrinol. 323:70–75. 2010. View Article : Google Scholar :
|
|
36
|
Sandström O and El-Salhy M: Ageing and
endocrine cells of human duodenum. Mech Ageing Dev. 108:39–48.
1999. View Article : Google Scholar : PubMed/NCBI
|
|
37
|
El-Salhy M: Ghrelin in gastrointestinal
diseases and disorders: A possible role in the pathophysiology and
clinical implications (Review). Int J Mol Med. 24:727–732. 2009.
View Article : Google Scholar : PubMed/NCBI
|
|
38
|
Tolhurst G, Reimann F and Gribble FM:
Intestinal sensing of nutrients. Handb Exp Pharmacol. 209:309–335.
2012. View Article : Google Scholar : PubMed/NCBI
|
|
39
|
Lee J, Cummings BP, Martin E, Sharp JW,
Graham JL, Stanhope KL, Havel PJ and Raybould HE: Glucose sensing
by gut endocrine cells and activation of the vagal afferent pathway
is impaired in a rodent model of type 2 diabetes mellitus. Am J
Physiol Regul Integr Comp Physiol. 302:R657–R666. 2012. View Article : Google Scholar
|
|
40
|
Parker HE, Reimann F and Gribble FM:
Molecular mechanisms underlying nutrient-stimulated incretin
secretion. Expert Rev Mol Med. 12:e12010. View Article : Google Scholar : PubMed/NCBI
|
|
41
|
Raybould HE: Nutrient sensing in the
gastrointestinal tract: Possible role for nutrient transporters. J
Physiol Biochem. 64:349–356. 2008. View Article : Google Scholar
|
|
42
|
San Gabriel A, Nakamura E, Uneyama H and
Torii K: Taste, visceral information and exocrine reflexes with
glutamate through umami receptors. J Med Invest. 56(Suppl):
209–217. 2009. View Article : Google Scholar : PubMed/NCBI
|
|
43
|
Rudholm T, Wallin B, Theodorsson E,
Näslund E and Hellström PM: Release of regulatory gut peptides
somatostatin, neurotensin and vasoactive intestinal peptide by acid
and hyperosmolal solutions in the intestine in conscious rats.
Regul Pept. 152:8–12. 2009. View Article : Google Scholar
|
|
44
|
Sternini C, Anselmi L and Rozengurt E:
Enteroendocrine cells: a site of 'taste' in gastrointestinal
chemosensing. Curr Opin Endocrinol Diabetes Obes. 15:73–78. 2008.
View Article : Google Scholar : PubMed/NCBI
|
|
45
|
Sternini C: Taste receptors in the
gastrointestinal tract. IV. Functional implications of bitter taste
receptors in gastrointestinal chemosensing. Am J Physiol
Gastrointest Liver Physiol. 292:G457–G461. 2007. View Article : Google Scholar
|
|
46
|
Buchan AM: Nutrient tasting and signaling
mechanisms in the gut III. Endocrine cell recognition of luminal
nutrients. Am J Physiol. 277:G1103–G1107. 1999.PubMed/NCBI
|
|
47
|
Montero-Hadjadje M, Elias S, Chevalier L,
Benard M, Tanguy Y, Turquier V, Galas L, Yon L, Malagon MM,
Driouich A, et al: Chromogranin A promotes peptide hormone sorting
to mobile granules in constitutively and regulated secreting cells:
role of conserved N- and C-terminal peptides. J Biol Chem.
284:12420–12431. 2009. View Article : Google Scholar : PubMed/NCBI
|
|
48
|
Shooshtarizadeh P, Zhang D, Chich JF,
Gasnier C, Schneider F, Haïkel Y, Aunis D and Metz-Boutigue MH: The
antimicrobial peptides derived from chromogranin/secretogranin
family, new actors of innate immunity. Regul Pept. 165:102–110.
2010. View Article : Google Scholar
|
|
49
|
El-Salhy M, Hatlebakk JG, Gilja OH and
Hausken T: Irritable bowel syndrome: recent developments in
diagnosis, pathophysiology, and treatment. Expert Rev Gastroenterol
Hepatol. 8:435–443. 2014. View Article : Google Scholar : PubMed/NCBI
|
|
50
|
Höcker M and Wiedenmann B: Molecular
mechanisms of enteroendocrine differentiation. Ann N Y Acad Sci.
859:160–174. 1998. View Article : Google Scholar
|
|
51
|
Inokuchi H, Fujimoto S and Kawai K:
Cellular kinetics of gastrointestinal mucosa, with special
reference to gut endocrine cells. Arch Histol Jpn. 46:137–157.
1983. View Article : Google Scholar : PubMed/NCBI
|
|
52
|
El-Salhy M, Hatlebakk JG and Hausken T:
Reduction in duodenal endocrine cells in irritable bowel syndrome
is associated with stem cell abnormalities. World J Gastroenterol.
21:9577–9587. 2015. View Article : Google Scholar : PubMed/NCBI
|
|
53
|
El-Salhy M, Gilja OH, Gundersen D,
Hatlebakk JG and Hausken T: Interaction between ingested nutrients
and gut endocrine cells in patients with irritable bowel syndrome
(Review). Int J Mol Med. 34:363–371. 2014.PubMed/NCBI
|