Introduction
Macrophages are well-known not only as major
regulators of innate and adaptive immunity, but also important
mediators of systemic metabolism, hematopoiesis, vasculogenesis,
apoptosis, malignancy and reproduction (1–4).
There are two differentiation patterns, M1 and M2. M1 macrophages
(classically activated macrophages) act as regulators of the host
defense system. They protect from infection due to bacteria,
protozoa and viruses (5). M2
macrophages (alternatively activated macrophages) have been
reported to have anti-inflammatory activity and are important in
wound healing (6). This
plasticity can change according to the macrophage environment.
M1 activation is induced by interferon-γ (IFN-γ) and
lipopolysaccharide (LPS). The M1 phenotype upregulates
pro-inflammatory cytokines and chemokines [e.g., tumor necrosis
factor-α (TNF-α), interleukin (IL)-12, IL-6, IL-1β and CCL2] and
promotes the production of reactive oxygen and nitrogen species
(ROS and RNS) (8,9). LPS is well known as a stimulant for
macrophages, and it is recognized for the activation of the
Toll-like receptor 4 (TLR4)-related signaling pathway. TLR4 leads
to the activation of the MyD88 and MaL/Tirap-dependent pathways,
leading to the rapid switch to the M1 phenotype (10). The secretion of cytokines and
chemokines in macrophages with the M1 phenotype is related to
various transcription factors, such as nuclear factor-κB (NF-κB),
activator protein 1 (AP-1), interferon-regulatory factors (IRF)s
and signal transducer and activator of transcription (STAT)1
(11). M1 macrophages have been
reported to play an important role in chronic inflammatory
diseases. Consequently, the abnormal or long-term activation of
macrophages must be controlled to prevent damage to the host.
M2 activation is related to Th2-produced IL-4 and
IL-13 (12). M2 macrophages are
associated with the upregulation of galactose receptor, mannose
receptor-1, chitinase-like 3 (Chil3; also known as Ym1), resistin
like beta (RETNLB; also known as FIZZ1) and arginase 1 (ARG1)
(13). Different metabolic
processes are induced between M1 and M2. In particular, L-arginine
metabolizes to produce nitric oxide (NO) in M1 macrophages, but in
M2 macrophages L-arginine metabolizes to produce polyamines
(1).
Pyropia yezoensis (P. yezoensis; Rhodophyta,
Bangiaceae) is widely used as a food in Korea, China and Japan.
P. yezoensis had been used as a medicine for the treatment
of emesis, diarrhea and hemorrhoids in oriental medicine (14). P. yezoensis protein has
been reported to have angiotensin I converting enzyme inhibitory
activities (15), and to exert
anti-inflammatory (16) and liver
protective effects against acetaminophen (17).
In this study, we examined the effects of P.
yezoensis glycoprotein (PYGP) on M1 to M2 macrophage
polarization in lipopolysaccharide (LPS)-stimulated macrophages. In
particulary, we focused on the similarities of the biological
functions of anti-inflammation and wound healing between P.
yezoensis and M2 polarization.
Materials and methods
Cell culture
RAW 264.7 cells were obtained from the American Type
Culture Collection (ATCC, Manassas, VA, USA). The cells were grown
in Dulbecco's modified Eagle's medium (DMEM; Gibco-BRL,
Gaitherburg, MD, USA) containing 10% fetal bovine serum (FBS) and
1% penicillin/streptomycin (both from Gibco-BRL). The cells were
maintained at 37°C in 5% CO2 humidified atmosphere, and
were subcultured at approximately 70–80% confluence in 100 mm
diameter culture dish, and the medium was replaced every 2
days.
Preparation of PYGP
P. yezoensis was obtained from the Republic
of Korea in 2014 (Suhyup, Busan, South Korea). P. yezoensis
powder (40 g) was diluted with 1 liter distilled water and stirred
for 4 h at room temperature. The solution was centrifuged at 3000 ×
g, 4°C for 20 min and vacuum filtered, and triple volumes of
ethanol (supernatant 1:ethanol 3) were added. After 24 h, the
solution was filtered and concentrated by rotary evaporation at
40°C. The concentrated solution was divided into 1.5 ml tubes,
freeze-dried and stored at −70°C until further use.
Cell treatment
The cells were treated with PYGP (2.5, 5, 10, 20 and
40 µg/ml) for 24 h and then stimulated with 1 µg/ml
LPS with PYGP (2.5, 5, 10, 20 and 40 µg/ml) for 24 h.
Determination of nitrite
concentration
The nitrite concentration in the cultured medium was
determined using Griess reagent (Enzo Life Sciences, Farmingdale,
NY, USA). Fifty microliters of supernatant from the 96-well plates
were mixed with the same volume of Griess reagent. After 30 min,
the absorbance was measured at 540 nm using a Benchmark Plus 10730
microplate reader (Benchmark; Bio-Rad Laboratories, Inc., Hercules,
CA, USA). Phe percentage of nitrite concentration was calculated
using the following formula: NO (%) = AT/AC ×100, where AC is the
absorbance of the control and AT is the absorbance of the test
group.
Determination of prostaglandin
E2 (PGE2) levels
The levels of PGE2 in the RAW 264.7
macrophages were measured using the PGE2 express EIA kit
according to the manufacturer's instructions (Cayman, Ann Arbor,
MI, USA). The absorbance was measured using a microplate reader
(Benchmark plus 10730; Bio-Rad Laboratories, Inc.). The percentage
of PGE2 was calculated using the following formula:
PGE2 (%) = AT/AC ×100, where AC is the absorbance of the
control and AT is the absorbance of the test group.
Determination of ROS generation
The levels of ROS were determined using
2′,7′-dichlorofluorescenin diacetate (DCF-DA; Sigma-Aldrich, St.
Louis, MO, USA). The RAW 264.7 cells were incubated with DCF-DA for
30 min in the dark. The cells were then washed twice with ice-cold
phosphate-buffered saline (PBS). The level of ROS was analyzed at
an excitation wavelength of 480 nm and an emission wavelength of
535 nm using a fluorescence microplate reader (FilterMAX F5;
Molecular Devices, LLC, Sunnyvale, CA, USA). The percentage of ROS
was calculated as follows: ROS (%) = AT/AC ×100, where AC is the
absorbance of the control and AT is the absorbance of the test
group.
Determination of thiobarbituric acid
reactive substances (TBARS)
The levels of TBARS in the RAW 264.7 cells were
measured using the TBARS assay kit according to the manufacturer's
instructions (Cell Biolabs, San Diego, CA, USA). The absorbance was
measured using a microplate reader (Benchmark plus 10730; Bio-Rad
Laboratories, Inc.). The percentage of TBARS was calculated as
follows: TBARS (%) = AT/AC ×100, where AC is the absorbance of the
control and AT is the absorbance of the test group.
Western blot analysis
The RAW 264.7 cells were washed with ice-cold PBS
(0.15 M sodium phosphate, 0.15 M sodium chloride, pH 7.4;
Gibco-BRL), followed by lysis buffer [150 mM sodium chloride, 50 mM
Tris-HCl (pH 7.5), 0.5% sodium deoxycholate, 0.1% sodium dodecyl
sulfate, 1% Triton X-100, and 2 mM ethylenediaminetetra-acetic
acid; Intron Biotechnology Inc., Seongnam, Korea] with inhibitors
(1 mM Na3VO4, 1 µg/ml aprotinin, 1
µg/ml leupeptin, 1 µg/ml pepstatin A and 1 mM PMSF;
Sigma-Aldrich). Protein levels were determined using the
bichinchominic acid assay kit (Pierce Biotechnology, Rockford, IL,
USA). Equal protein amounts (20 µg) of each sample were
separated by 10–15% sodium dodecyl sulfate (SDS)-polyacrylamide gel
and transferred onto a polyvinylidene fluoride membrane (Millipore,
Billerica, MA, USA). The transferred membrane was blocked with 1%
bovine serum albumin (BSA) in TBS-T [10 mM Tris-HCl (pH 7.5), 150
mM NaCl, and 0.1% Tween-20; USB Corporation, Cleveland, OH, USA].
Subsequently, the membrane was incubated for 4 h at room
temperature with the following primary immunoglobulin G antibodies,
diluted to 1:1,000 in BSA/TBS-T: rabbit anti-mouse STAT3 polyclonal
antibody (sc-482), goat anti-mouse p-STAT3 polyclonal antibody
(sc-7993), rabbit anti-mouse STAT6 polyclonal antibody (sc-621),
rabbit anti-mouse p-STAT6 polyclonal antibody (sc-11762), rabbit
anti-mouse CD163 polyclonal antibody (sc-33560), rabbit anti-mouse
CD206 polyclonal antibody (sc-48758), rabbit anti-mouse
glyceraldehyde 3-phosphate dehydrogenase (GAPDH) polyclonal
antibody (sc-25778) (all from Santa Cruz Biotechnology Inc.,
Dallas, TX, USA). The secondary antibodies were
peroxidase-conjugated anti-goat (81-1620), anti-mouse (62-6520),
and anti-rabbit (65-6120) antibodies (1:10,000; Bethyl
Laboratories, Montgomery, TX, USA). Antibody binding was visualized
using the Super Signal West Pico Stable Peroxide Solution and the
Super Signal West Pico Luminol/Enhancer solution (Thermo Fisher
Scientific Inc., Rockford, IL, USA). The signal was monitored using
Kodak X-ray film and a developer and fixer twin pack (both from
Kodak, Rochester, NY, USA).
Reverse transcription-quantitative
polymerase chain reaction (RT-qPCR)
Total RNA was extracted from the cells using TRIzol
reagent (Invitrogen, Carlsbad, CA, USA). cDNA was sythesized using
RevoScript™ RT preMix (Intron Biotechnology Inc.). The synthesized
cDNA and primer were added to 2X TOPsimple™ DyeMIX-nTaq (Enzynomics
Inc., Deajeon, Korea). Amplifications were performed using TOPreal™
qPCR 2X PreMIX SYBR-Green (Enzynomics Inc.) in a Eco™ Real-Time PCR
system (Illumina Inc., San Diego, CA, USA). Gene expression levels
were normalized to GAPDH and calculated using the comparative ΔΔCT
method, as previously described (18). The oligonucleotide primers used
for PCR were as follows: IL-12 forward, 5′-CGT GCT CAT GGC TGG TGC
AAA-3′ and reverse, 5′-CTT CAT CTG CAA GTT CTT GGG-3′; IFN-γ,
forward, 5′-ACA CTC ATT GAA AGC CTA GAA AGT CTG-3′ and reverse,
5′-ATT CTT CTT ATT GGC ACA CTC TCT ACC-3′; IL-6 forward, 5′-GTT CTC
TGG GAA ATC GTG GA-3′ and reverse, 5′-TGT ACT CCA GGT AGC TAT
GG-3′; nitric oxide synthase-2 (NOS-2) forward, 5′-CTG CAT GGA ACA
GTA TAA GGC AAA C-3′ and reverse, 5′-CAG ACA GTT TCT GGT CGA TGT
CAT GA-3′; IL-1β forward, 5′-GTG TGG ATC CCA AGC AAT ACC CA-3′ and
reverse, 5′-CCA GCC CAT ACT TTA GGA AGA CAC AGA-3′; Ym1 forward,
5′-GGA TGG CTA CAC TGG AGA AA-3′ and reverse, 5′-AGA AGG GTC ACT
CAG GAT AA-3′; FIZZ1 forward, 5′-CCC TCC ACT GTA ACG AAG-3′ and
reverse, 5′-GTG GTC CAG TCA ACG AGT AA-3′; ARG1 forward, 5′-CTC CAA
GCC AAA GTC CTT AGA G-3′ and reverse, 5′-AGG AGC TGT CAT TAG GGA
CAT C-3′; IL-10 forward, 5′-CTG CTC CAC TGC CTT GCT CTT ATT-3′ and
reverse, 5′-GTG AAG ACT TTC TTT CAA ACA AAG-3′; Krüppel-like factor
4 (KLF4) forward, 5′-GCA CAC CTG CGA ACT CAC AC-3′ and reverse,
5′-CCG TCC CAG TCA CAG TGG TAA-3′; peroxisome
proliferator-activated receptor γ (PPARγ) forward, 5′-ACC ACT CGC
ATT CCT TTG AC3′ and reverse, 5′-AAC CAT TGG GTC AGC TCT TG-3′;
GAPDH forward, 5′-ACT CCA CTC ACG GCA AAT TCA-3′ and reverse,
5′-CGC TCC TGG AAG ATG GTG-3′.
Small interfering RNA (siRNA)
transfection
STAT3 (5′-CCC GCC AAC AAA UUA AGA ATT-3′ and 3′-UUC
UUA AUU UGU UGG CGG GTT-5′) and STAT6 (5′-CCA AGA CAA CAA CGC CAA
ATT-3′ and 3′-UUU GGC GUU GUU GUC UUG GTT-5′) and silencer negative
control siRNAs were purchased from GenePharma (Shanghai, China). It
should be noted that initially, we purchased 3 types of siRNAs for
STAT3 and STAT6 (siRNA-1-3, respectively). From these siRNAs, STAT3
siRNA-3 and STAT6 siRNA-3 most effectively suppressed the
expression of STAT3 and STAT6, respectively. Thus, these siRNAs
were recorded and used in our experiments. The RAW 264.7 cells were
transiently transfected with siRNA for 24 h using Lipofectamine
2000 reagent (Invitrogen), according to the manufacturer's
instructions. Following transfection, the medium was replaced with
fresh culture medium.
Statistical analysis
Values are presented as the means ± standard
deviation and data were analyzed with SPSS ver. 10.0 software (SPSS
Inc., Chicago, IL, USA) using an analysis of variance followed by a
Duncan's multiple range test. P-values <0.05 were considered to
indicate statistically significant differences.
Results
Effect of PYGP on LPS-induced NO
release
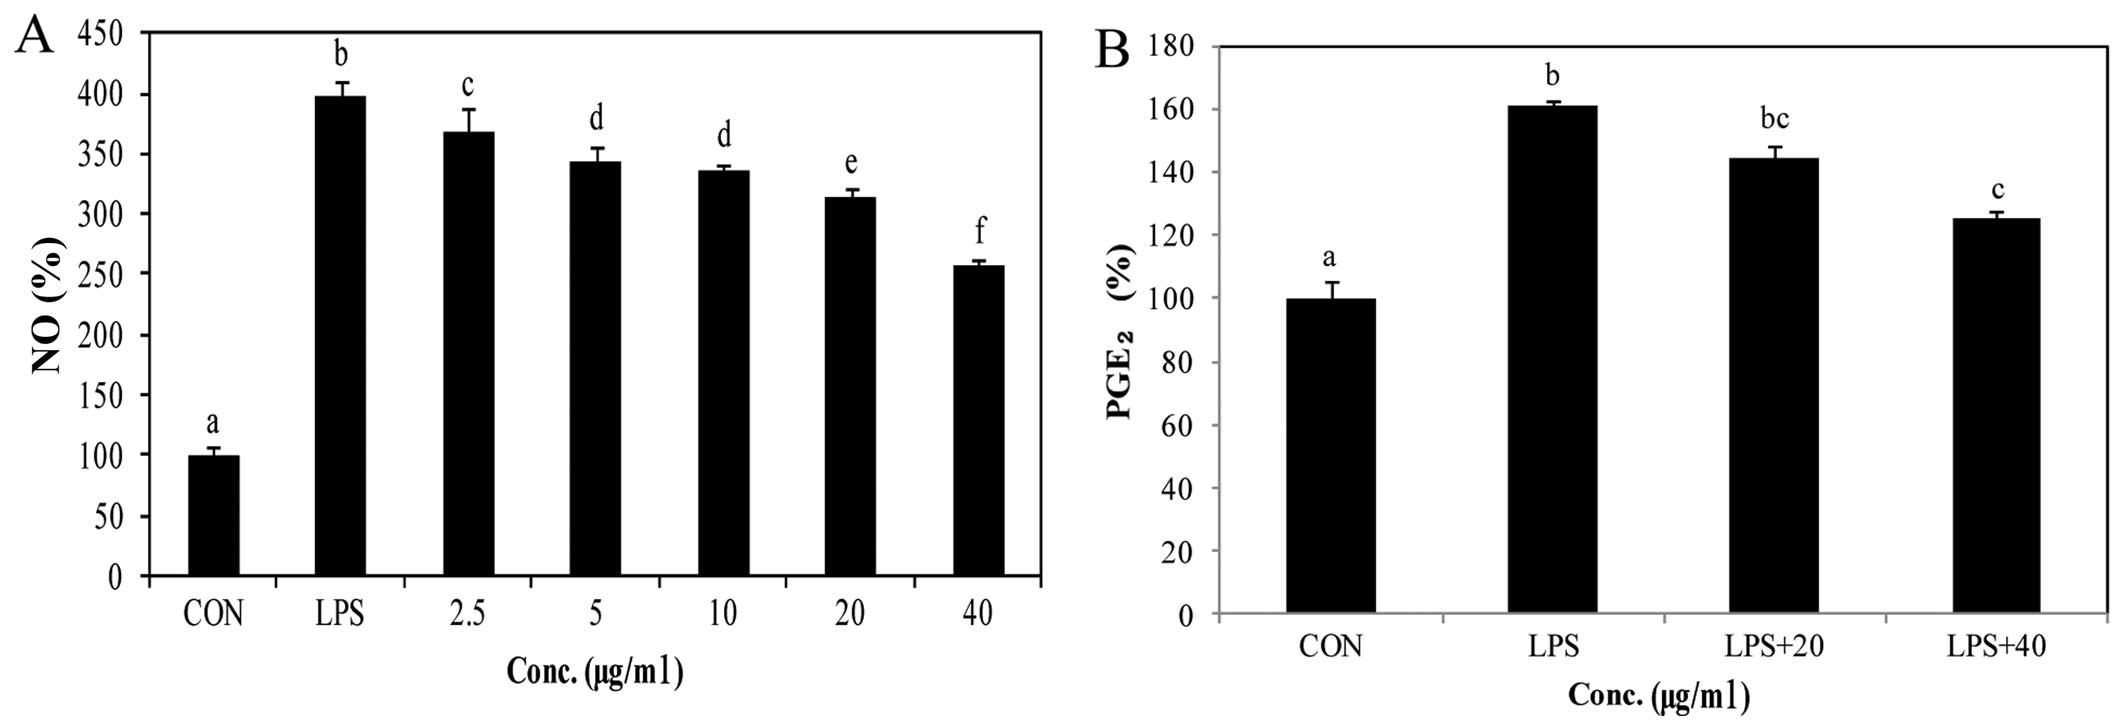
We used Griess reagent to determine the production
of NO (Fig. 1A). In the
macrophages stimulated with LPS, NO production was significantly
increased, and NO was released into the extracellular matrix.
However, the NO concentration was high in the culture medium only
in the LPS only-treated group. In the presence of PYGP, the
concentration of NO in the culture medium was inhibited in a
dose-dependent manner (Fig.
1A).
Effect of PYGP on LPS-induced
PGE2 production
The production levels of PGE2 were
measured in the LPS-stimulated RAW 264.7 cells (Fig. 1B). PGE2 secretion into
the supernatant of the cell cultures was estimated by
PGE2 express ELISA kit. Following stimulation with LPS
(1 µg/ml), PGE2 expression in the medium was
markedly increased. However, when the RAW 264.7 cells were
pre-treated with PYGP, PGE2 expression was significantly
decreased.
Effect of PYGP on LPS-induced TBARS and
ROS generation
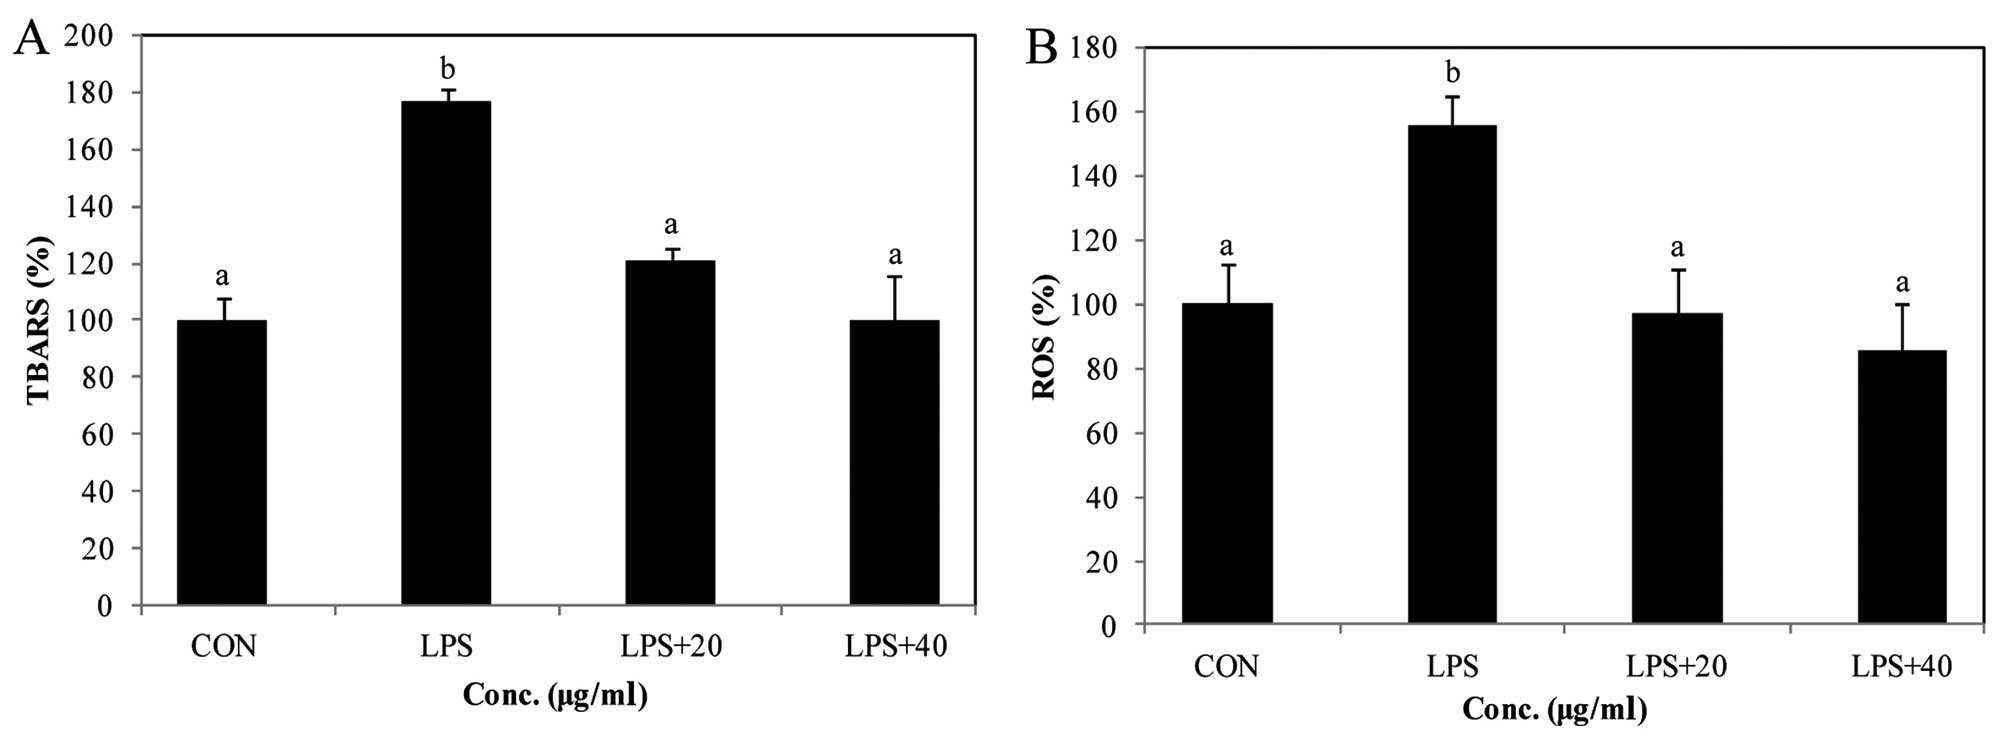
TBARS formation was determined in the LPS-stimulated
RAW 264.7 cells through oxidative stress mechanisms (Fig. 2A). Our results revealed that the
TBARS levels in the cells were significantly higher in the LPS
only-treated group. In addition, pretreatment with PYGP
significantly decreased the TBARS levels in the RAW 264.7 cells in
comparison with the LPS only-treated group.
We also wished to determine whether PYGP attenuates
ROS generation in LPS-stimulated RAW 264.7 cells using DCF-DA
(Fig. 2B). The LPS-stimulated RAW
264.7 cells significantly generated ROS compared with the
unstimulated controls. However, pre-treatment with PYGP markedly
decreased the generation of ROS induced by LPS.
Effects of PYGP on M1 polarization
markers
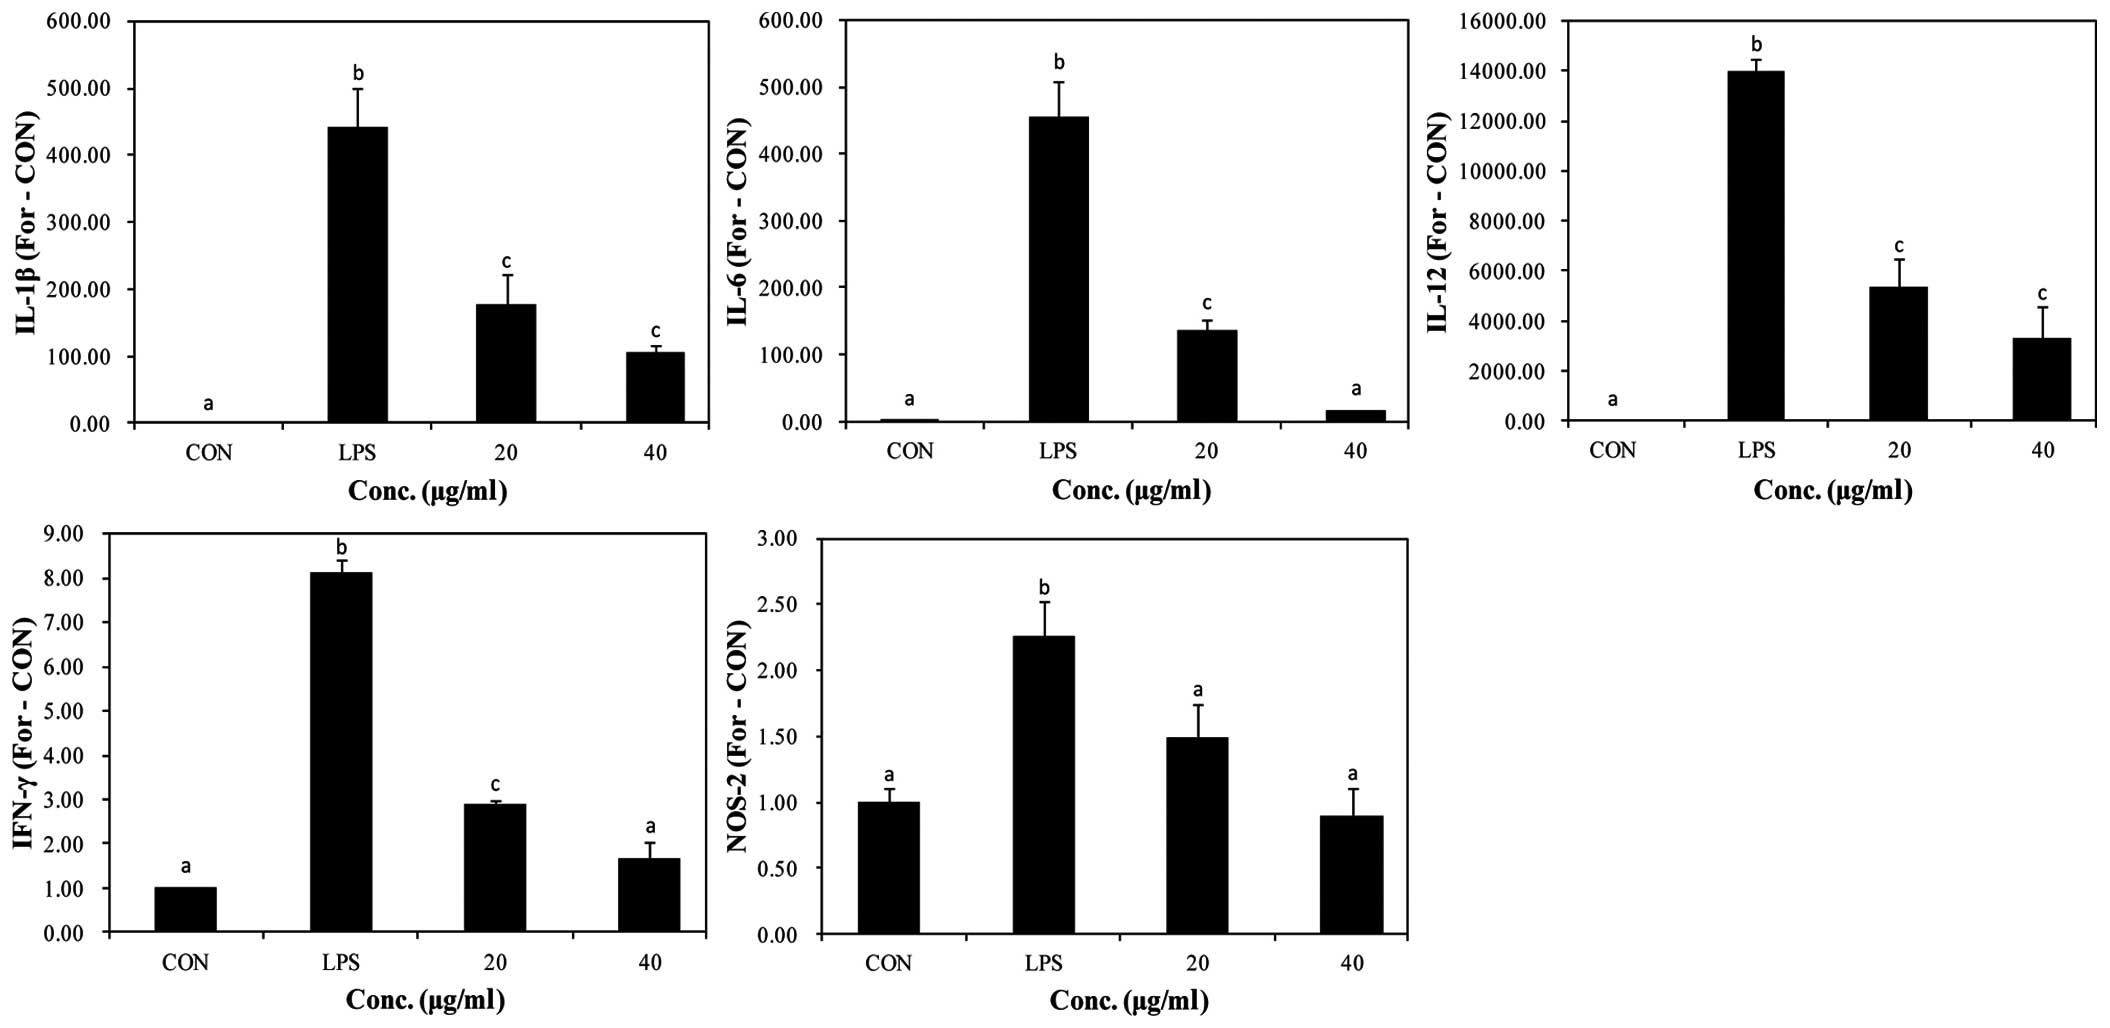
It is known that M1-activated RAW 264.7 macrophages
produce pro-inflammatory cytokines. Thus, in our study, in order to
examine the effects of PYGP on the LPS-stimulated RAW 264.7 cells,
we determined the mRNA expression of pro-inflammatory cytokines
(Fig. 3). The results of RT-qPCR
revealed that LPS upregulated the mRNA expression of the
pro-inflammatory cytokines, IL-1β, IL-6, IL-12, IFN-γ and NOS-2.
Pre-treatment with PYGP significantly suppressed the mRNA
expression of these pro-inflammatory cytokines. These results
suggest that PYGP suppresses pro-inflammatory cytokine expression
and prevents the M1 activation of LPS-stimulated RAW 264.7
macrophages.
Effects of PYGP on M2 polarization
markers
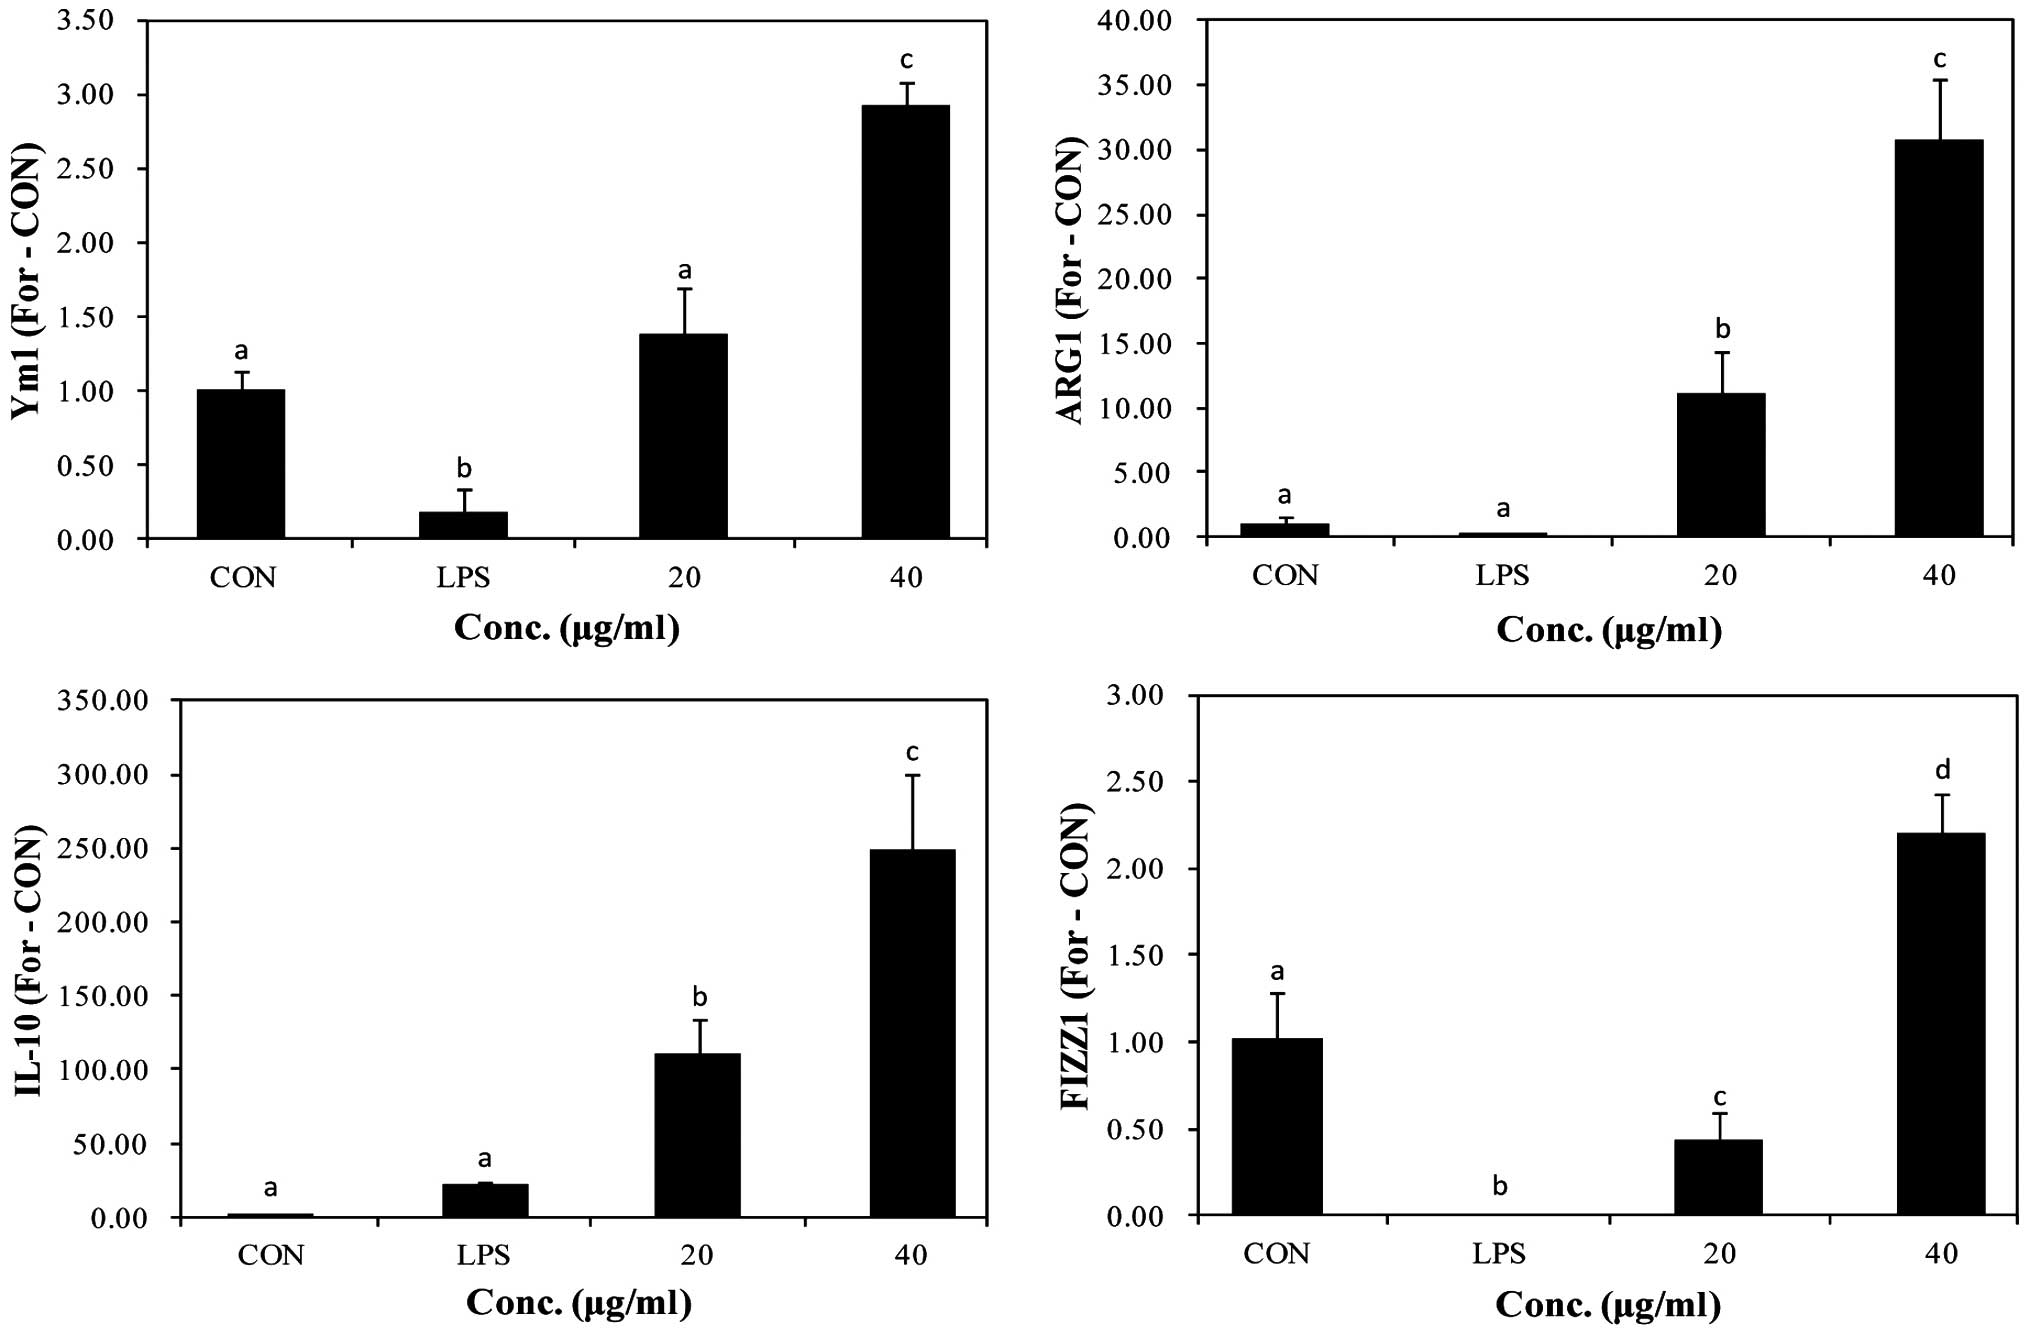
M2-activated RAW 264.7 macrophages lead to metabolic
alterations. Consequently, macrophages produce Ym1, ARG1, IL-10 and
FIZZ1. The mRNA expression of M2 markers was not observed in the
control group and LPS-stimulated. However, in the PYGP-treated
cells, the mRNA expression of M2 marker genes increased (Fig. 4). These results indicate that PYGP
prevents the induction of the M1 macrophage phenotype by LPS and
promotes the switch to the M2 phenotype.
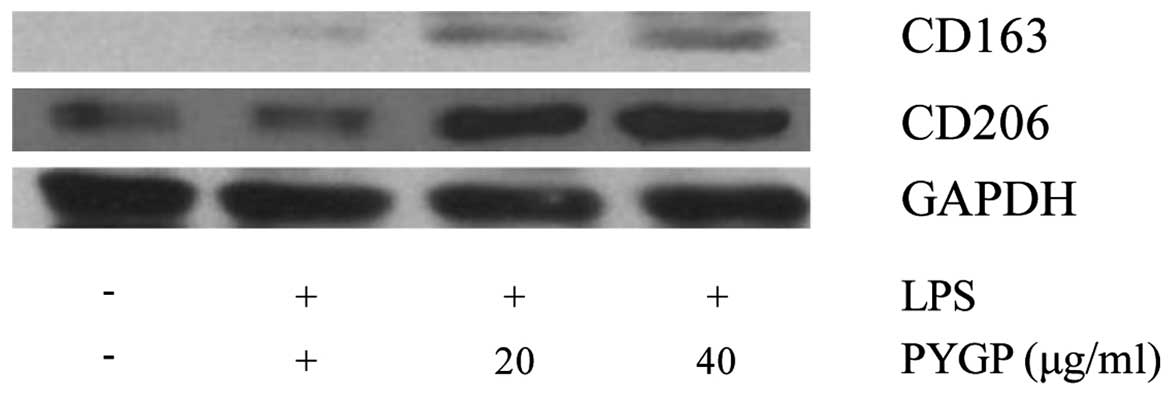
There is evidence to indicate that non-opsonic
receptors, such as CD163 and CD206 are upregulated M2-activated
macrophages (38,39). In this study, we used western blot
analysis to measure the protein expression levels of CD163 and
CD206 (Fig. 5). Stimulation with
LPS decreased CD163 and CD206 expression in the RAW 264.7 cells. In
the cells pretreated with PYGP, the expression levels of CD163 and
CD206 were significantly increased compared with those of the
control and the LPS only-treated groups.
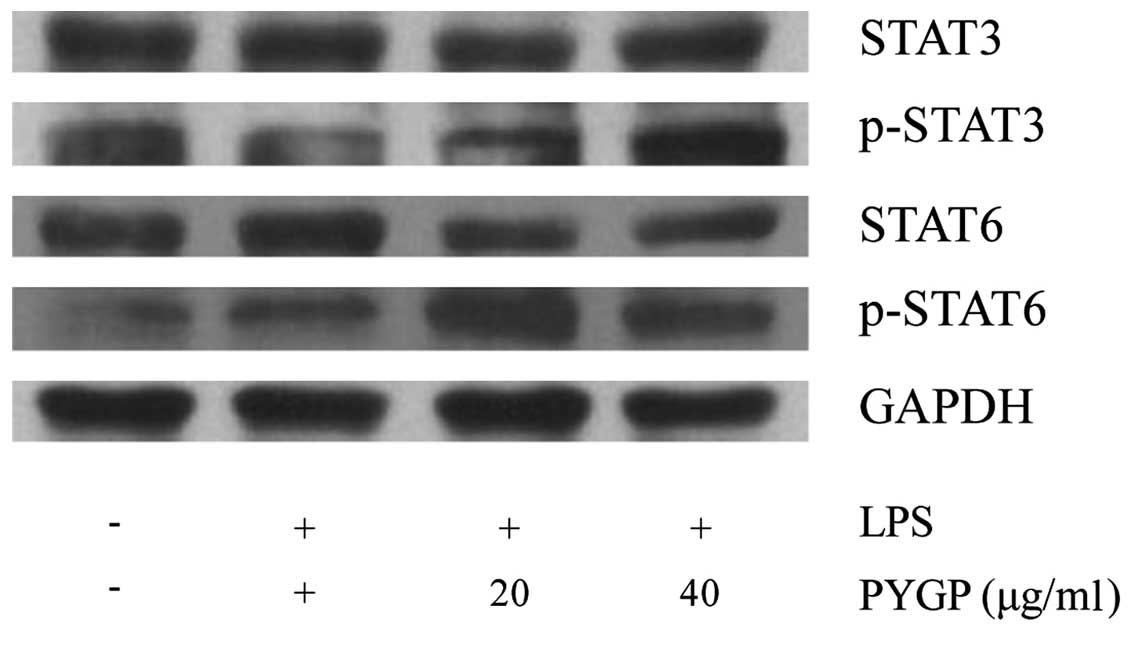
Effects of PYGP on the STAT3 and STAT6
signaling pathways
STAT3 and STAT6 are well known transcription factors
that induce M2 macrophage activation and inhibit inflammation.
Thus, we measured the phosphorylation levels of STAT3 and STAT6 by
western blot analysis (Fig. 6).
Our results revealed that stimulation with LPS did not affect STAT3
and STAT6 phosphorylation. In the PYGP-pre-treated cells, the
phosphorylation levels of STAT3 and STAT6 were increased in a
dose-dependent manner. However, the total STAT3 and STAT6 protein
expression levels were not altered following treatment with LPS or
pre-treatment with PYGP.
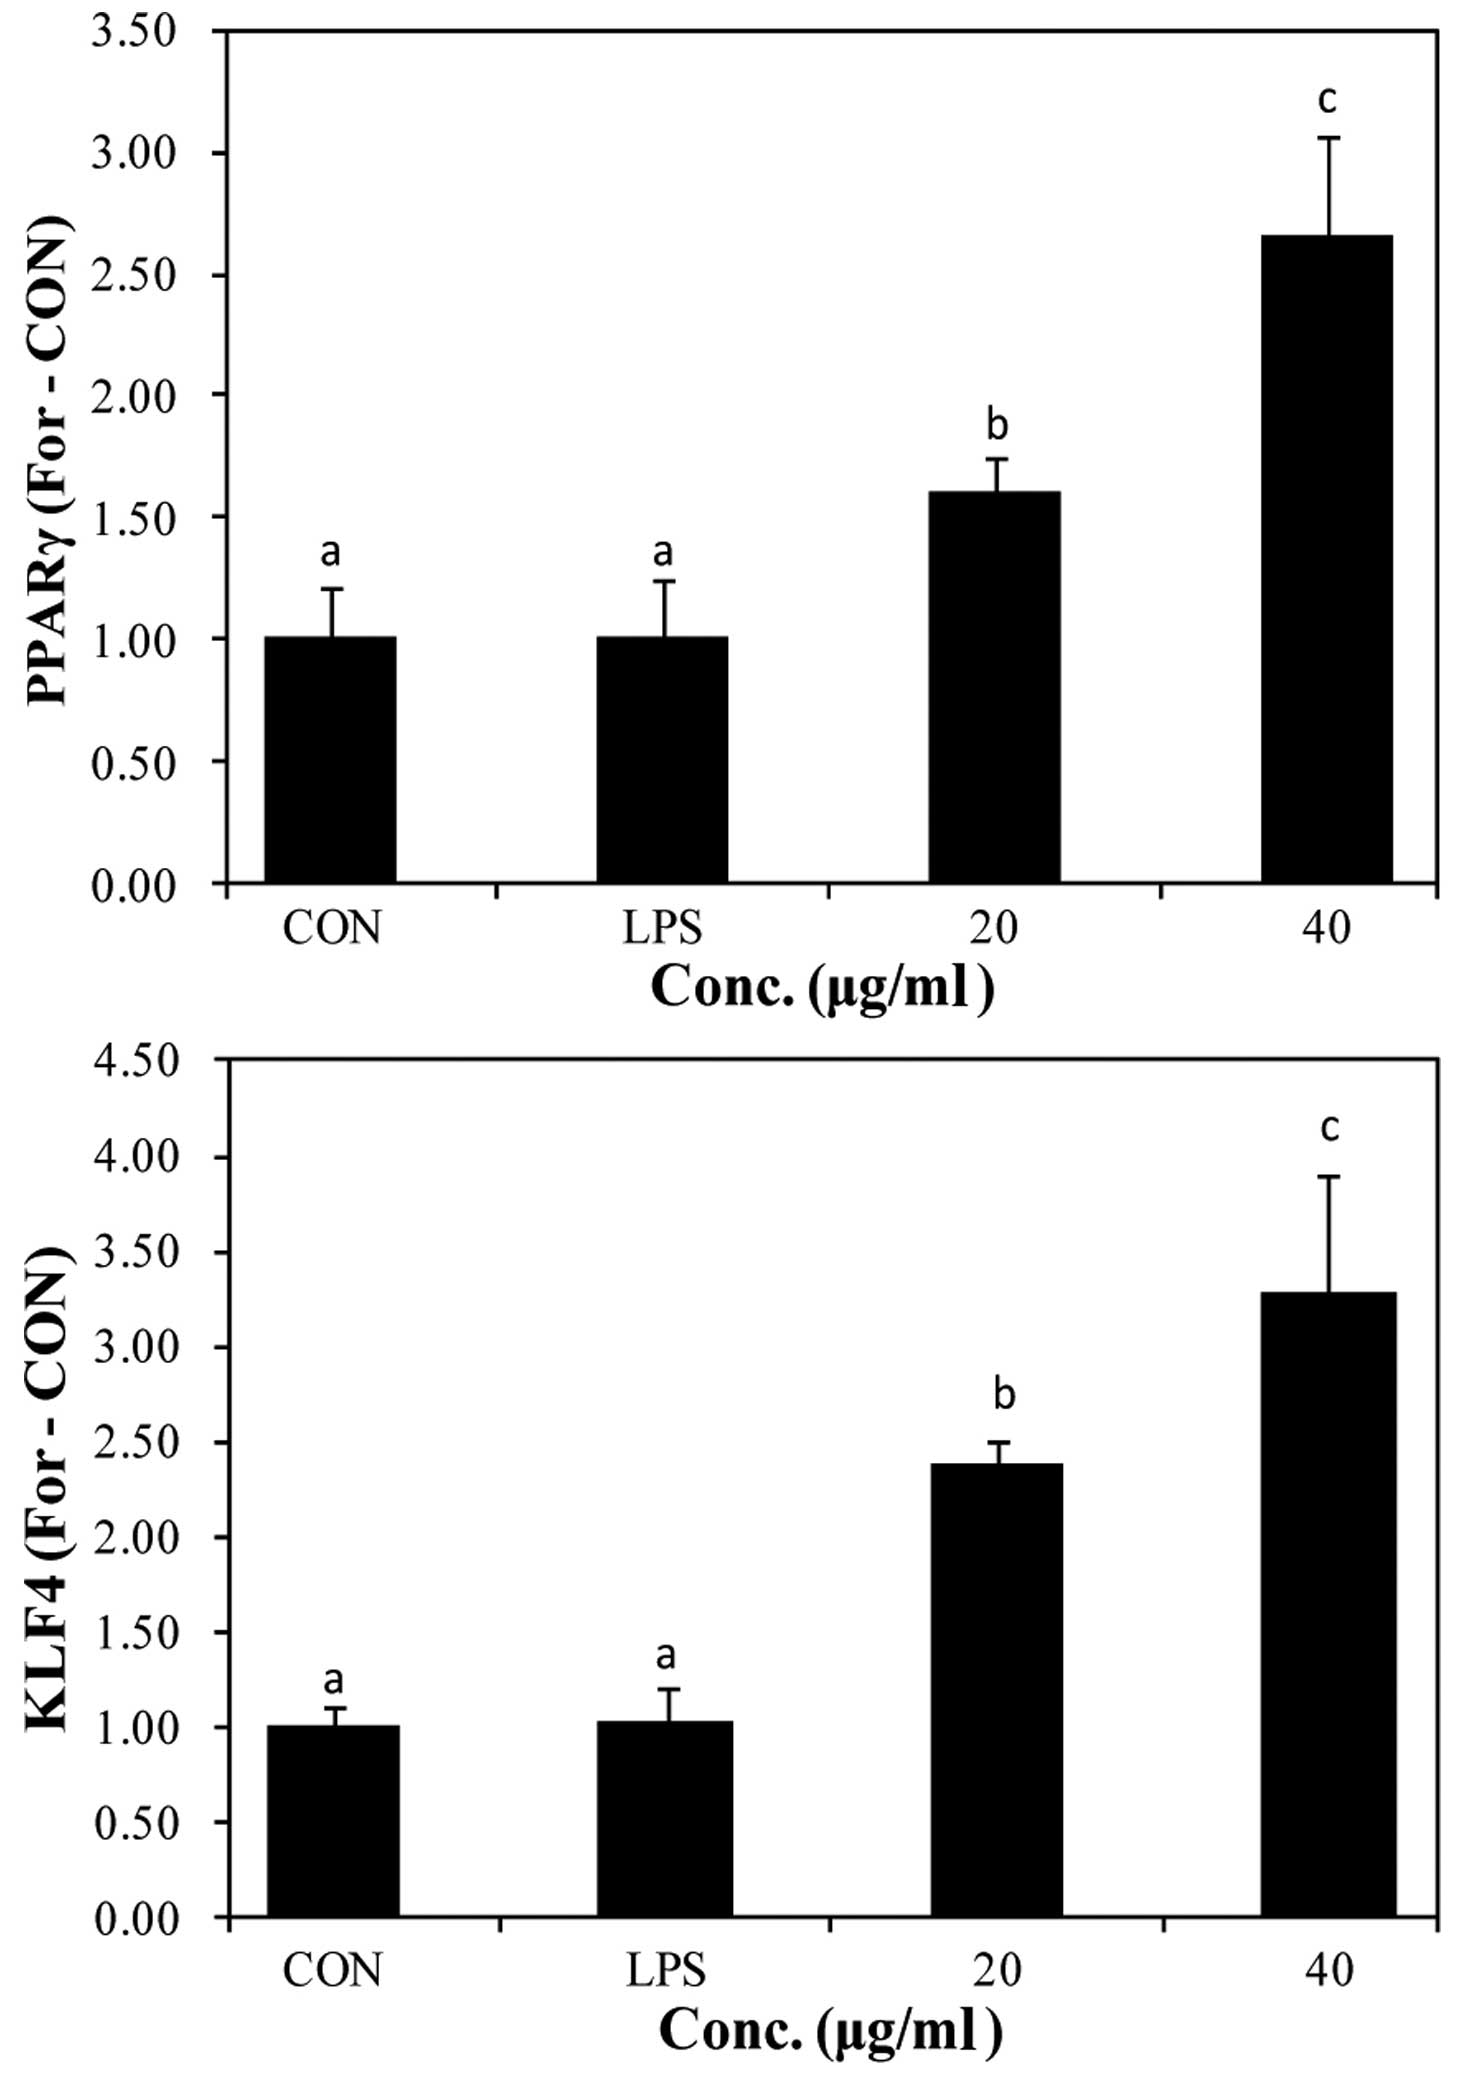
The expression of PPARγ and KLF4 has been reported
to increase by STAT6 phosphorylation. The increased expression of
PPARγ and KLF4 promotes the switch to the M2 macrophage phenotype
(19,20). We used RT-qPCR to determine the
mRNA expression of PPARγ and KLF4 following stimulation with LPS
and pre-treatment with PYGP (Fig.
7). Stimulation with LPS did not affect PPARγ and KLF4 mRNA
expression compared with the control group. However, pre-treatment
with PYGP increased PPARγ and KLF4 mRNA expression in a
dose-dependent manner.
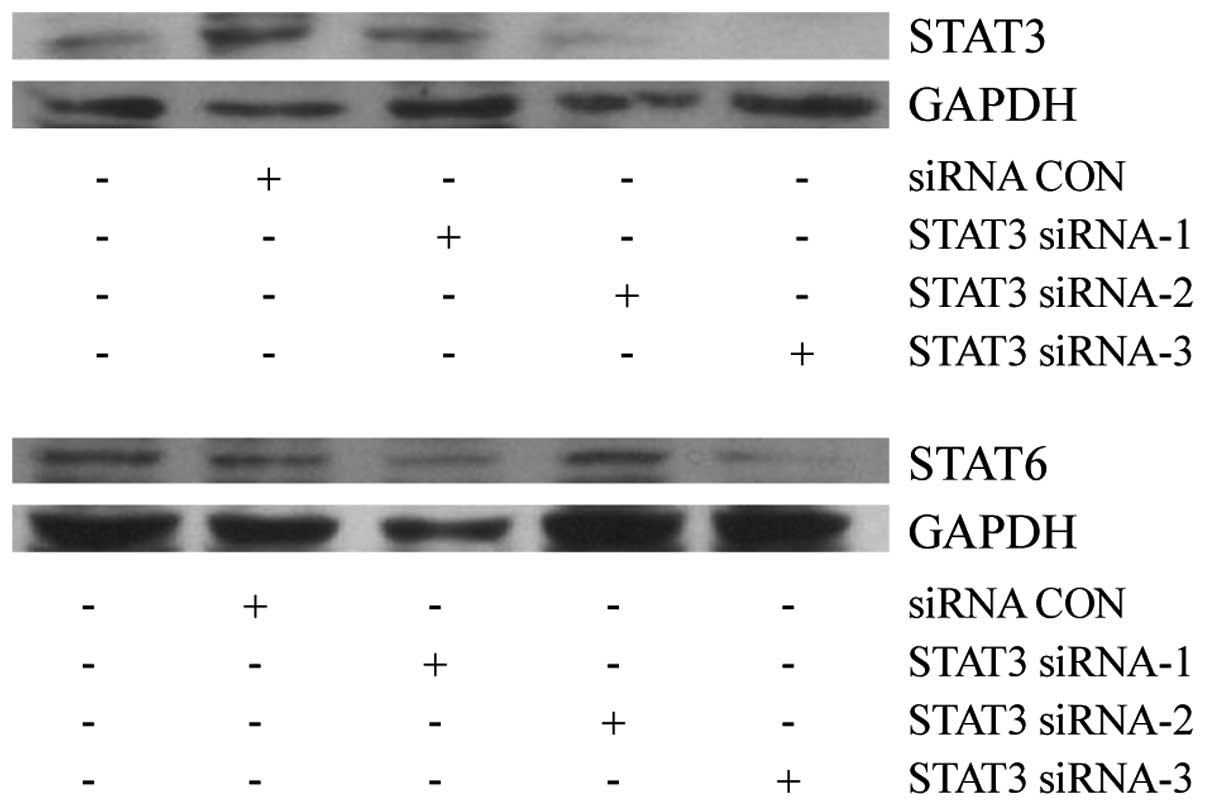
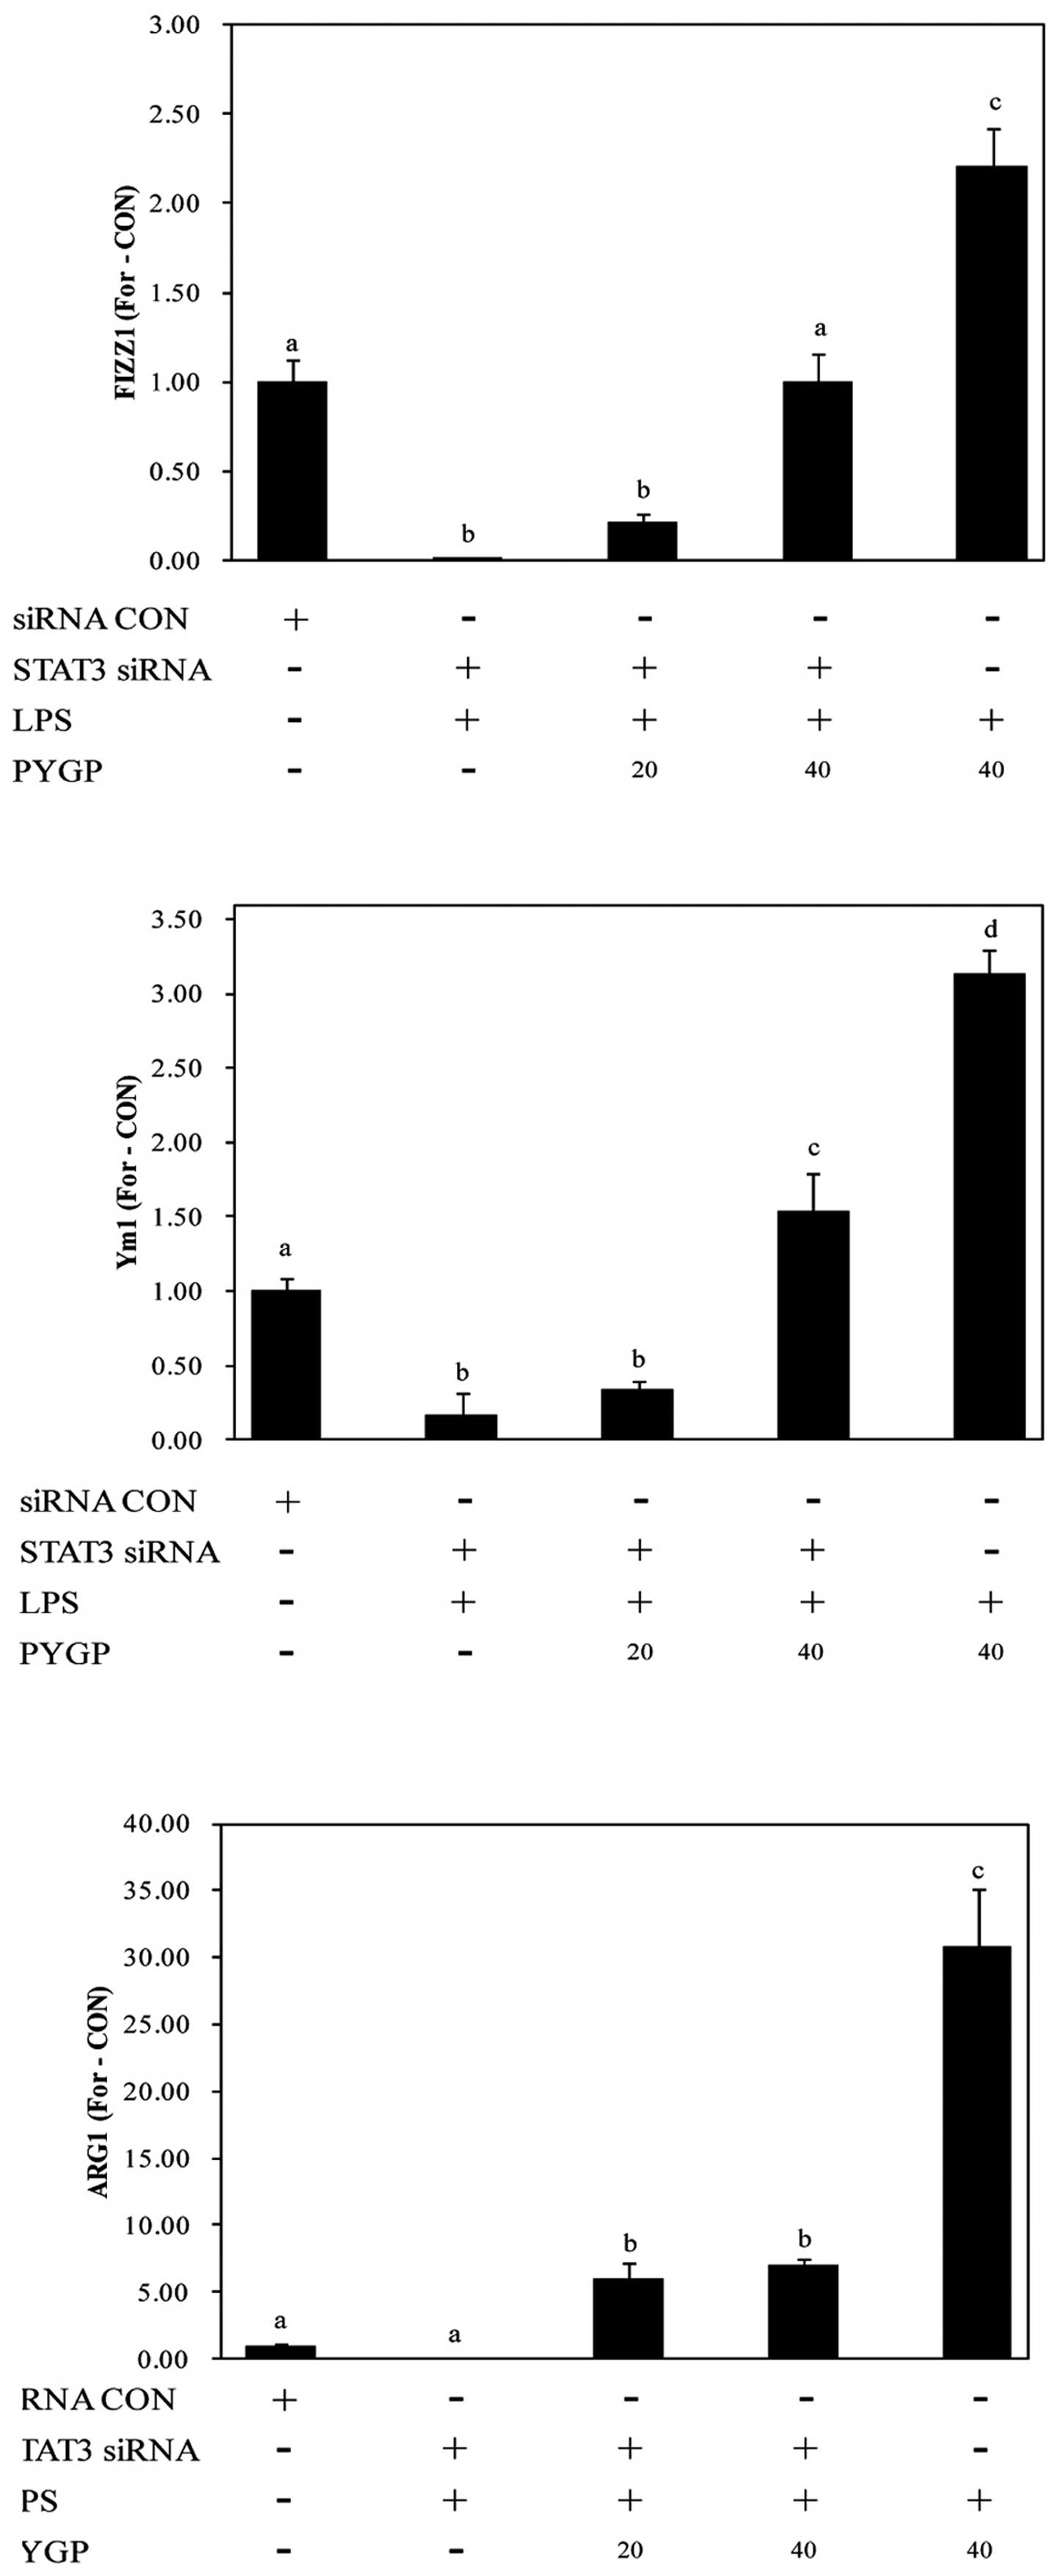
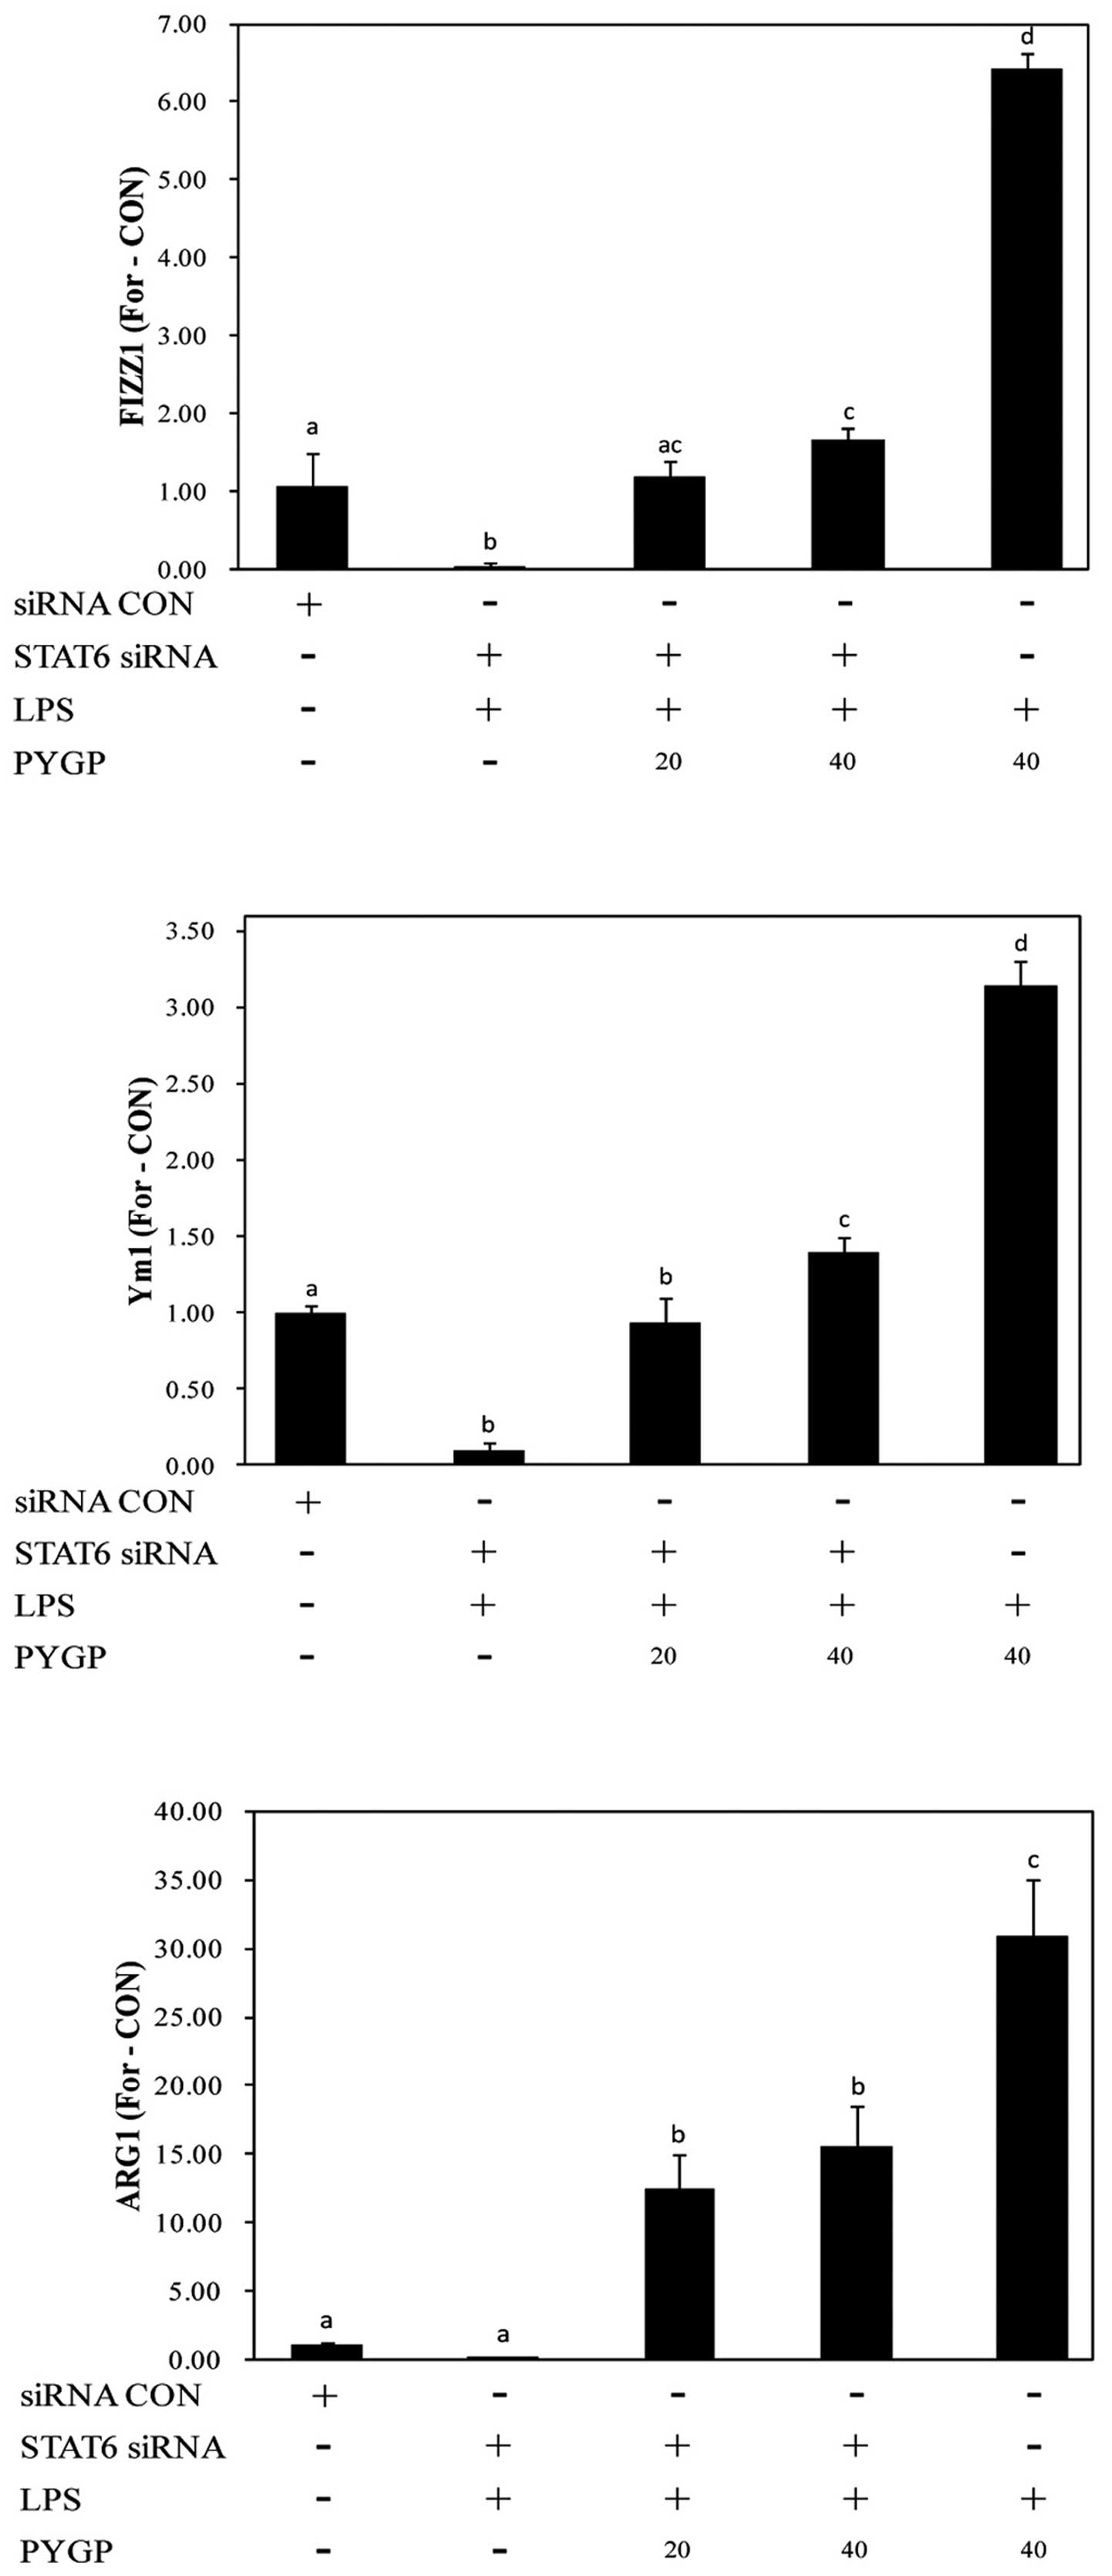
Analysis of M2 polarization markers
following transfection with siRNA targeting STAT3 and STAT6
STAT3 and STAT6 are major transcription factors that
are involved in the regulation of the immune response by
macrophages. STAT3 and STAT6 are essential for macrophage
differentiation into the M2 phenotype (23,43). In this study, to clarify whether
STAT3 and STAT6 play a role in the PYGP-mediated M2 activation of
RAW 264.7 cells, we examined the expression of M2 markers following
the knockdown of STAT3 and STAT6 gene expression. We tested 3 types
of STAT3 and STAT6 siRNA, and the expression of STAT3 and STAT6 was
most significantly downregulated using STAT3 siRNA-3 and STAT6
siRNA-3, respectively (Fig. 8).
Transfection of the RAW 264.7 cells with STAT3 siRNA and STAT6
siRNA attenuated the PYGP-induced increase in the mRNA expression
of FIZZ1, Ym1 and ARG1 (Figs. 9
and 10). These results indicate
that the activation of STAT3 and STAT6 plays an important role in
the switch from the M1 to the M2 RAW 264.7 macrophage phenotype
induced by PYGP.
Discussion
Macrophages play a key role in the early stages of
the adaptive immune reponse, the innate immune response and in the
regulation of inflammation. Macrophages can differentiate into
different phenotypes, namely the M0 (unstimulated state), M1
(classical activation) and the M2 (alterative activation) phenotype
(21). IFN, TNF, GM-CSF and TLR
ligand stimulation promotes the production of pro-inflammatory
cytokines, such as IL-1β, IL-6, TNF-β, IL-12, IFN-γ. Moreover, it
promotes the switch to the M1 macrophage phenotype (22,23). IL-4, IL-13, IL-10, glucocorticoids
and M-CSF stimulation promotes the secretion of IL-1ra, IL-10,
TGF-β and the switch to the M2 macrophage phenotype (24).
LPS is a major stimulator of the M1 macrophage
phenotype via TLR4 stimulation in (25). LPS-activated M1 macrophages
produce NO and PGE2, and protect the host against
infections. However, the abnormal and chronic production of NO and
PGE2 leads to the development of various diseases
(26,27). In this study, we demonstrated that
stimulation with LPS significantly increased NO and PGE2
production, which were inhibited by pre-treatment of the RAW 264.7
cells with PYGP.
The classical activation of M1 macrophages increases
aerobic glycolysis, glucose uptake and the conversion of pyruvate
to lactate (28,29). Moreover, ROS production is
increased from the mitochondria via NADPH oxidase activation
(30). Lipid
peroxidation-produced ROS cause cellular injury by the inactivation
of membrane enzymes and receptors (31). In the present study, the levels of
ROS and TBARS were increased in the LPS treatment group compared
with the control group. However, pre-treatment with PYGP
significantly decreased the LPS-induced production of ROS and
TBARS.
M1 and M2 macrophages do not only differ in their
biological functions, but also as regards metabolism. The main
differentiation between M1 and M2 macrophages is L-arginine
metabolism. L-arginine has three metabolic pathways, including NO
production by NOS-2, ureum and L-ornithine by arginase and agmatine
by arginine decarboxylase (29,32,33). These characteristics can be
utilized in macrophages in the active state. Lipid metabolism also
differs between M1 and M2 macrophages. This differentiation is
revealed by the transcriptional profiling of the IL-13-steered
human monocyte (34). The
function of these genes is not yet fully understood, such as that
of FIZZ. PPAR ligation has been reported to inhibit the expression
of pro-inflammatory cytokines and NOS-2 (35,36). Futhermore, differences in cytokine
secretion have been observed between M1 and M2 macrophages. M1
secrete pro-inflammatory cytokines, such as IL-1β, IL-6, IL-12 and
type 1 IFN, whereas M2 secrete anti-inflammatory cytokines, such as
IL-10 and TGF-β (37). In
addition, IL-4, IL-13 and IL-10 upregulate several non-opsonic
receptors, such as mannose receptor (CD206) and CD163 (38,39). These features have been used in
many studies as markers to distinguish between the activity of
macrophages (40–42). In the present study, LPS increased
the production of pro-inflammatory cytokines, including IL-1β,
IL-6, IL-12, IFN-γ and NOS-2. However, pre-treatment with PYGP
inhibited these pro-inflammatory cytokines and increased the
expression of M2-associated markers, such as CD163, CD206, Ym1,
FIZZ1 and ARG1. These results suggest that PYGP promotes the switch
from the M1 to the M2 phenotype following stimulation with LPS.
M2 activation has been shown to involve various
transcription factors. STAT3 and STAT6 play a key role in M2
activation (23,43). STAT3 is the major
anti-inflammatory mediator, mediate IL-10 transcription (44). The knockdown of STAT3 and STAT6 in
mouse and human macrophages has been reported be prevent the switch
to the M2 phenotype (7,45,46). In the present study, the silencing
of STAT3 and STAT6 inhibited the promoting effects of PYGP on the
mRNA expression of M2 activation markers, including FIZZ1, Ym1 and
ARG1. According to our observation, STAT3 siRNA and STAT6 siRNA
decreased STAT3, STAT6, FIZZ1, Ym1 and ARG1 mRNA expression in the
PYGP-treated M1 macrophages, indicating that the pre-treatment of
M1 activated macrophages with PYGP promotes the switch to the M2
macrophage phenotype via STAT3 and STAT6 signaling.
In conclusion, our results demonstrate that
stimulation with LPS activates M1 macrophages. PYGP inhibits the
production of pro-inflammatory cytokines and promotes the switch to
the M2 phenotype via STAT3 and STAT6 activation. These findings may
provide a molecular basis for the use of PYGP as a treatment agent
for LPS-induced inflammatory diseases.
Acknowledgments
This study was supported by the Research Program
through the National Research Foundation of Korea (NRF) funded by
the Ministry of Education (grant no. 2012R1A6A1028677).
References
|
1
|
Tugal D, Liao X and Jain MK:
Transcriptional control of macrophage polarization. Arterioscler
Thromb Vasc Biol. 33:1135–1144. 2013. View Article : Google Scholar : PubMed/NCBI
|
|
2
|
Lin SL, Li B, Rao S, Yeo EJ, Hudson TE,
Nowlin BT, Pei H, Chen L, Zheng JJ, Carroll TJ, et al: Macrophage
Wnt7b is critical for kidney repair and regeneration. Proc Natl
Acad Sci USA. 107:4194–4199. 2010. View Article : Google Scholar : PubMed/NCBI
|
|
3
|
Nikolic-Paterson DJ and Atkins RC: The
role of macrophages in glomerulonephritis. Nephrol Dial Transplant.
16(Suppl 5): 3–7. 2001. View Article : Google Scholar : PubMed/NCBI
|
|
4
|
Aliprantis AO, Diez-Roux G, Mulder LC,
Zychlinsky A and Lang RA: Do macrophages kill through apoptosis?
Immunol Today. 17:573–576. 1996. View Article : Google Scholar : PubMed/NCBI
|
|
5
|
Murray PJ and Wynn TA: Protective and
pathogenic functions of macrophage subsets. Nat Rev Immunol.
11:723–737. 2011. View
Article : Google Scholar : PubMed/NCBI
|
|
6
|
Barros MHM, Hauck F, Dreyer JH, Kempkes B
and Niedobitek G: Macrophage polarisation: An immunohistochemical
approach for identifying M1 and M2 macrophages. PLoS One.
8:e809082013. View Article : Google Scholar : PubMed/NCBI
|
|
7
|
Gordon S and Martinez FO: Alternative
activation of macrophages: Mechanism and functions. Immunity.
32:593–604. 2010. View Article : Google Scholar : PubMed/NCBI
|
|
8
|
Kohchi C, Inagawa H, Nishizawa T and Soma
G: ROS and innate immunity. Anticancer Res. 29:817–821.
2009.PubMed/NCBI
|
|
9
|
Schroder K, Sweet MJ and Hume DA: Signal
integration between IFNgamma and TLR signalling pathways in
macrophages. Immunobiology. 211:511–524. 2006. View Article : Google Scholar : PubMed/NCBI
|
|
10
|
Martinez FO and Gordon S: The M1 and M2
paradigm of macrophage activation: Time for reassessment.
F1000Prime Rep. 6:132014. View
Article : Google Scholar : PubMed/NCBI
|
|
11
|
Hu X and Ivashkiv LB: Cross-regulation of
signaling pathways by interferon-γ: Implications for immune
responses and autoimmune diseases. Immunity. 31:539–550. 2009.
View Article : Google Scholar : PubMed/NCBI
|
|
12
|
Mantovani A, Biswas SK, Galdiero MR, Sica
A and Locati M: Macrophage plasticity and polarization in tissue
repair and remodelling. J Pathol. 229:176–185. 2013. View Article : Google Scholar
|
|
13
|
Mantovani A, Garlanda C and Locati M:
Macrophage diversity and polarization in atherosclerosis: A
question of balance. Arterioscler Thromb Vasc Biol. 29:1419–1423.
2009. View Article : Google Scholar : PubMed/NCBI
|
|
14
|
Kim SC, Lee JR and Park SJ: Porphyra
tenera induces apoptosis of oral cancer cells. Kor J Herbology.
30:25–30. 2015.
|
|
15
|
Kim YM, In JP and Park JH: Angiotensin I
converting enzyme (ACE) inhibitory activities of laver (Porphyra
tenera) protein hydrolysates. Prev Nutr Food Sci. 18:11–18.
2005.
|
|
16
|
Shin ES, Hwang HJ, Kim IH and Nam TJ: A
glycoprotein from Porphyra yezoensis produces anti-inflammatory
effects in liposaccharide-stimulated macrophages via the TLR4
signaling pathway. Int J Mol Med. 28:809–815. 2011.PubMed/NCBI
|
|
17
|
Hwang HJ, Kwon MJ, Kim IH and Nam TJ:
Chemoprotective effects of a protein from the red algae Porphyra
yezoensis on acetaminophen-induced liver injury in rats. Phytother
Res. 22:1149–1153. 2008. View
Article : Google Scholar : PubMed/NCBI
|
|
18
|
Livak KJ and Schmittgen TD: Analysis of
relative gene expression data using real-time quantitative PCR and
the 2−ΔΔCT method. Methods. 25:402–408. 2001. View Article : Google Scholar
|
|
19
|
Liao X, Sharma N, Kapadia F, Zhou G, Lu Y,
Hong H, Paruchuri K, Mahabeleshwar GH, Dalmas E, Venteclef N, et
al: Krüppel-like factor 4 regulates macrophage polarization. J Clin
Invest. 121:2736–2749. 2011. View
Article : Google Scholar : PubMed/NCBI
|
|
20
|
Szanto A, Balint BL, Nagy ZS, Barta E,
Dezso B, Pap A, Szeles L, Poliska S, Oros M, Evans RM, et al: STAT6
transcription factor is a facilitator of the nuclear receptor
PPARγ-regulated gene expression in macrophages and dendritic cells.
Immunity. 33:699–712. 2010. View Article : Google Scholar : PubMed/NCBI
|
|
21
|
Labonte AC, Tosello-Trampont AC and Hahn
YS: The role of macrophage polarization in infectious and
inflammatory diseases. Mol Cells. 37:275–285. 2014. View Article : Google Scholar : PubMed/NCBI
|
|
22
|
Krausgruber T, Blazek K, Smallie T,
Alzabin S, Lockstone H, Sahgal N, Hussell T, Feldmann M and Udalova
IA: IRF5 promotes inflammatory macrophage polarization and TH1-TH17
responses. Nat Immunol. 12:231–238. 2011. View Article : Google Scholar : PubMed/NCBI
|
|
23
|
Lawrence T and Natoli G: Transcriptional
regulation of macrophage polarization: Enabling diversity with
identity. Nat Rev Immunol. 11:750–761. 2011. View Article : Google Scholar : PubMed/NCBI
|
|
24
|
Biswas SK and Mantovani A: Macrophage
plasticity and interaction with lymphocyte subsets: Cancer as a
paradigm. Nat Immunol. 11:889–896. 2010. View Article : Google Scholar : PubMed/NCBI
|
|
25
|
Verreck FA, de Boer T, Langenberg DM,
Hoeve MA, Kramer M, Vaisberg E, Kastelein R, Kolk A, de
Waal-Malefyt R and Ottenhoff TH: Human IL-23-producing type 1
macrophages promote but IL-10-producing type 2 macrophages subvert
immunity to (myco)bacteria. Proc Natl Acad Sci USA. 101:4560–4565.
2004. View Article : Google Scholar : PubMed/NCBI
|
|
26
|
Agard M, Asakrah S and Morici LA: PGE(2)
suppression of innate immunity during mucosal bacterial infection.
Front Cell Infect Microbiol. 3:452013. View Article : Google Scholar : PubMed/NCBI
|
|
27
|
Kilbourn RG and Griffith OW:
Overproduction of nitric oxide in cytokine-mediated and septic
shock. J Natl Cancer Inst. 84:827–831. 1992. View Article : Google Scholar : PubMed/NCBI
|
|
28
|
Hard GC: Some biochemical aspects of the
immune macrophage. Br J Exp Pathol. 51:97–105. 1970.PubMed/NCBI
|
|
29
|
Galván-Peña S and O'Neill LA: Metabolic
reprograming in macrophage polarization. Front Immunol.
5:4202014.PubMed/NCBI
|
|
30
|
West AP, Brodsky IE, Rahner C, Woo DK,
Erdjument-Bromage H, Tempst P, Walsh MC, Choi Y, Shadel GS and
Ghosh S: TLR signalling augments macrophage bactericidal activity
through mitochondrial ROS. Nature. 472:476–480. 2011. View Article : Google Scholar : PubMed/NCBI
|
|
31
|
Jacobson MD: Reactive oxygen species and
programmed cell death. Trends Biochem Sci. 21:83–86. 1996.
View Article : Google Scholar : PubMed/NCBI
|
|
32
|
Corraliza IM, Soler G, Eichmann K and
Modolell M: Arginase induction by suppressors of nitric oxide
synthesis (IL-4, IL-10 and PGE2) in murine bone-marrow-derived
macrophages. Biochem Biophys Res Commun. 206:667–673. 1995.
View Article : Google Scholar : PubMed/NCBI
|
|
33
|
Munder M, Eichmann K and Modolell M:
Alternative metabolic states in murine macrophages reflected by the
nitric oxide synthase/arginase balance: Competitive regulation by
CD4+ T cells correlates with Th1/Th2 phenotype. J
Immunol. 160:5347–5354. 1998.PubMed/NCBI
|
|
34
|
Scotton CJ, Martinez FO, Smelt MJ, Sironi
M, Locati M, Mantovani A and Sozzani S: Transcriptional profiling
reveals complex regulation of the monocyte IL-1 β system by IL-13.
J Immunol. 174:834–845. 2005. View Article : Google Scholar : PubMed/NCBI
|
|
35
|
Raes G, De Baetselier P, Noël W, Beschin
A, Brombacher F and Hassanzadeh Gh G: Differential expression of
FIZZ1 and Ym1 in alternatively versus classically activated
macrophages. J Leukoc Biol. 71:597–602. 2002.PubMed/NCBI
|
|
36
|
Ricote M, Welch JS and Glass CK:
Regulation of macrophage gene expression by the peroxisome
proliferator-activated receptor-γ. Horm Res. 54:275–280. 2000.
View Article : Google Scholar
|
|
37
|
Mantovani A, Sica A, Sozzani S, Allavena
P, Vecchi A and Locati M: The chemokine system in diverse forms of
macrophage activation and polarization. Trends Immunol. 25:677–686.
2004. View Article : Google Scholar : PubMed/NCBI
|
|
38
|
Brown BN, Londono R, Tottey S, Zhang L,
Kukla KA, Wolf MT, Daly KA, Reing JE and Badylak SF: Macrophage
phenotype as a predictor of constructive remodeling following the
implantation of biologically derived surgical mesh materials. Acta
Biomater. 8:978–987. 2012. View Article : Google Scholar
|
|
39
|
Lau SK, Chu PG and Weiss LM: CD163: A
specific marker of macrophages in paraffin-embedded tissue samples.
Am J Clin Pathol. 122:794–801. 2004. View Article : Google Scholar : PubMed/NCBI
|
|
40
|
Chen Z, Wu C, Gu W, Klein T, Crawford R
and Xiao Y: Osteogenic differentiation of bone marrow MSCs by
β-tricalcium phosphate stimulating macrophages via BMP2 signalling
pathway. Biomaterials. 35:1507–1518. 2014. View Article : Google Scholar
|
|
41
|
Lee AS, Jung YJ, Kim D, Nguyen-Thanh T,
Kang KP, Lee S, Park SK and Kim W: SIRT2 ameliorates
lipopolysaccharide-induced inflammation in macrophages. Biochem
Biophys Res Commun. 450:1363–1369. 2014. View Article : Google Scholar : PubMed/NCBI
|
|
42
|
Lopez-Castejón G, Baroja-Mazo A and
Pelegrín P: Novel macrophage polarization model: From gene
expression to identification of new anti-inflammatory molecules.
Cell Mol Life Sci. 68:3095–3107. 2011. View Article : Google Scholar
|
|
43
|
Wang N, Liang H and Zen K: Molecular
mechanisms that influence the macrophage m1-m2 polarization
balance. Front Immunol. 5:6142014. View Article : Google Scholar : PubMed/NCBI
|
|
44
|
Murray PJ: Understanding and exploiting
the endogenous interleukin-10/STAT3-mediated anti-inflammatory
response. Curr Opin Pharmacol. 6:379–386. 2006. View Article : Google Scholar : PubMed/NCBI
|
|
45
|
Mandal P, Pratt BT, Barnes M, McMullen MR
and Nagy LE: Molecular mechanism for adiponectin-dependent M2
macrophage polarization: Link between the metabolic and innate
immune activity of full-length adiponectin. J Biol Chem.
286:13460–13469. 2011. View Article : Google Scholar : PubMed/NCBI
|
|
46
|
MacKinnon AC, Farnworth SL, Hodkinson PS,
Henderson NC, Atkinson KM, Leffler H, Nilsson UJ, Haslett C, Forbes
SJ and Sethi T: Regulation of alternative macrophage activation by
galectin-3. J Immunol. 180:2650–2658. 2008. View Article : Google Scholar : PubMed/NCBI
|