Introduction
Recently, there has been a worldwide increase in the
incidence of type II diabetes associated with obesity, the
development of which seems to be due to a combination of
high-caloric diets and physical inactivity (1,2).
The predicted estimates suggest that the worldwide population with
this syndrome may double to over 300 million by the year 2025
(3). Triglyceride (TG)
accumulation in tissues, particularly in fatty tissues, is
associated with the excessive intake of fatty acids. The excess of
fatty acids in non-adipose tissues has been linked to the higher
circulation of fatty acids and insulin (2). Insulin resistance has been shown to
be associated with higher levels of fatty acid binding, and a
higher availability of transport proteins in adipose and
non-adipose tissues, which facilitate the uptake of fatty acid by
these tissues. The higher levels of free fatty acid (FFA)
deposition in muscle trigger a negative feedback in glucose
utilization and the insulin-mediated muscle insulin signaling
pathway (4). Prolonged exposure
to FFAs in the pancreas may cause impaired insulin release through
lipotoxicity (5). High FFA
concentrations in the liver resist the action of insulin by
enhancing glucose output (6). The
accumulation of TGs in the liver causes non-alcoholic fatty liver
disease (NAFLD). The liver is the main organ for glucose metabolism
and NAFLD damages the liver via hepatocellular necrosis, steatosis,
fibrosis and steatohepatitis (7).
The imbalanced lipolysis and hepatic lipogenesis causes NAFLD and
insulin resistance (8).
It has been reported that oxidative stress
inhibition and the control of post-prandial hyperglycemia play an
important role in the treatment of diabetes (9). Hence, safe and effective
α-glucosidase inhibitors, antioxidants and functional food
materials from natural sources have been the focus of research
(10,11). For example, metformin, an orally
administrated anti-diabetic drug from the biguanide class has been
used in the treatment of type II diabetes (12). The most severe potential
side-effect of metformin is lactic acidosis, although the
occurrence of this phenomenon is very rare and it has been mostly
related to comorbid conditions, i.e., impaired kidney or liver
function (13).
Protein hydrolysates have evolved to the point where
they are promising nutrient supplements for use in clinical and
elemental nutrition, in the treatment of weight loss, as well as
malnutrition associated with various clinical conditions (14). Fish hydrolysates, which have been
suggested to be advantageous protein nutritional supplements for
different medical conditions (15,16), also have antioxidant,
antimicrobial and antiproliferative effects (17). In particular, some protein
hydrolysates have been shown to exert hypolipidemic and
anti-obesity effects in high-fat diet (HFD)-fed obese animal models
(18–21). The melanian snail,
Semisulcospira libertina, is one of the most commonly
encountered freshwater snails in Far East Asia, and has been used
as an ingredient of tonic functional foods in Korea (22–24).
The present study was performed to examine the
pharmacological anti-diabetic activity, and ameliorating effects
with respect to related complications, of melanian snail
(Semisulcospira libertina) protein hydrolysates (MPh) in
mice with type II diabetes.
Materials and methods
Animals
In total, 50 female specific pathogen-free (SPF) ICR
mice (6 weeks old upon receipt; OrientBio, Seungnam, Korea) were
used in the experiments after a 7-day period of acclimatization to
the laboratory environment. The animals were allocated 4–5 per
polycarbonate cage in a temperature (20–25°C)- and humidity
(40–45%)-controlled room under a 12:12-h light:dark cycle with free
access to commercial rodent chow (Samyang, Seoul, Korea) and water.
The animals were allocated to 6 groups following a 1-week
adaptation period (n=8 mice/group; total of 40 HFD-fed mice and 8
normal diet-fed mice as the intact group) based on body weight
(intact control: mean, 29.60±1.59 g; HFD group: mean, 32.33±1.63
g). The formulas of the normal diets and HFDs used in this study
are shown in Table I. All
laboratory animals were treated according to the national
regulations for the usage and welfare of laboratory animals, and
the protocol was approved by the Institutional Animal Care and Use
Committee of Daegu Haany University (Gyeongsan, Gyeongbuk, Korea)
prior to the experiments (approval no. DHU2015-017).
 | Table IFormulas of normal and high-fat diets
used in this study. |
Table I
Formulas of normal and high-fat diets
used in this study.
| Composition | Normal pellet
diet
(g/kg diet) | High-fat
diet
(g/kg diet)a |
|---|
| Ingredient | | |
| Casein | 200 | 200 |
| L-cysteine | 3 | 3 |
| Corn starch | 150 | 72.8 |
| Sucrose | 500 | 172.8 |
| Cellulose | 50 | 50 |
| Soybean oil | 50 | 25 |
| Lard | 0 | 177.5 |
| Mineral
mixture | 35 | 10 |
| Vitamin
mixture | 10 | 10 |
| Choline
bitartrate | 2 | 2 |
| Energy
(kcal/g) | 0.21 | 4.73 |
| Protein (%
kcal/kg) | 13.3 | 20 |
| Carbohydrate (%
kcal/kg) | 47.4 | 35 |
| Fat (%
kcal/kg) | 8.0 | 45 |
| Fiber (%
kcal/kg) | 8.0 | 8.0 |
Preparation and administration of test
agents
Green powders of MPh were prepared by the following
method: briefly, melanian snail meat samples were warmed at 50°C
for 10 min, mixed with 5 volumes of distilled water, and then
reacted with Protamax (E/S=3.6 AU/g) at 50°C for 10 min with
shaking at 300 rpm. The enzyme activities were then inhibited by
heating in a water bath at 95°C for 15 min. Finally, the samples
were centrifuged at 1,500 × g (Sorvall Legend Micro 17; Thermo
Fisher Scientific Inc., Waltham, MA, USA) for 10 min, and the
supernatants were completely lyophilized. The MPh samples thus
obtained were stored at −20°C and protected against light and
humidity until use. Some MPh samples were deposited in the
herbarium of the Medical Research Center for Globalization of
Herbal Formulation, Daegu Haany University (encoded as
MPh2015Ku01). Metformin hydrochloride (Wako, Osaka, Japan) was used
as a reference.
MPh dissolved in distilled water was administered
orally, at doses of 125, 250 and 500 mg/kg, once a day for 84 days
after 7 days of HFD adaptation. Metformin dissolved in distilled
water was also administered orally at 250 mg/kg. The intact vehicle
and diabetic control mice received an oral administration of equal
volumes of distilled water.
Changes in body and organ weight
Body weight was measured just before commencement of
the HFD regime. One day before the initiation of MPh
administration, on the first administration day (day 0), and then
weekly until termination on day 84 using an automatic electronic
balance (Precisa Instruments, Dietikon, Switzerland). At initiation
and termination of administration, all experimental animals were
fasted overnight with access only to water (approximately 12 h) to
reduce differences due to feeding. In addition, body weight gain
was calculated during the adaptation period (from day -8 to 0 of
test agent administration) and administration period (from day 0–84
of test agent administration) as follows:
Equation [1], body weight gain (g): during the 7-day
adaptation period = body weight at initiation of administration -
body weight at initiation of HFD supply (from day −8 to 0 of test
agent administration); and during the 84-day administration period
= body weight at termination - body weight at initiation of
administration (from day 0–84 of test agent administration).
At sacrifice, the weights of the liver, pancreas and
left kidney were determined individually and to minimize the effect
of inter-individual difference in body weight, the relative weights
(% of body weight) were also calculated by means of body weight at
sacrifice.
Mean daily food consumption
measurements
Diets of 150 g in each individual cage were
supplied, with the remaining amount of food measured after 24 h via
an automatic electronic balance (Precisa Instruments). That amount
was then divided by the number of animals reared in the cage. These
measurements were conducted once a week for 84 days during the
administration period, as previously described (25,26).
Measurement of serum biochemistry
levels
For the measurement of blood glucose levels, blood
samples were collected from the caudal vena cava into NaF glucose
vacuum tubes (Becton-Dickinson, Franklin Lakes, NJ, USA) and plasma
was separated at sacrifice. Blood glucose levels were measured
using an automated blood glucose analyzer (200 FR; Toshiba, Tokyo,
Japan). For other serum biochemistry measurements, blood samples
were collected from the caudal vena cava into clotting activated
serum tubes. The samples were centrifuged at 16,200 × g for 10 min
at ambient temperature. The alanine aminotransferase (ALT), serum
aspartate aminotransferase (AST), blood urine nitrogen (BUN), TG,
total cholesterol (TC), creatinine, low-density lipoprotein (LDL),
high-density lipoprotein (HDL) cholesterol and cholesterol levels
were measured using an automated blood analyzer (Hemagen Analyst
Hemagen Diagnostic, Columbia, MD, USA), while serum LDL and HDL
levels were detected using different blood analyzer (AU400;
Olympus, Tokyo, Japan). Serum insulin and blood HbA1c levels were
measured using a HbA1c measuring system (Infopia, Anyang, Korea)
and an enzyme-linked immunosorbent assay (ELISA) kit (Alpco
Diagnostics, Windham, NH, USA), as previously described (27,28).
Lipid peroxidation and liver antioxidant
defense system
Before measuring the lipid peroxidation and
antioxidant activities, organ weights were measured. Glutathione
(GSH) and malondialdehyde (MDA) contents, and the enzyme activities
of superoxide dismutase (SOD) and catalase (CAT) in mouse hepatic
tissues, were measured. Liver tissues were weighed and homogenized
in ice-cold 0.01 M Tris-HCl (pH 7.4), and centrifuged at 12,000 × g
for 15 min, as previously described by Kavutcu et al
(29). Lipid peroxidation in the
liver was determined by estimating MDA contents using the
thiobarbituric acid test at absorbance 525 nm as nM of MDA
mg−1 tissue (30).
Total protein contents were measured using a previously described
method (31) and bovine serum
albumin (BSA) (Invitrogen, Carlsbad, CA, USA) was used as an
internal standard. Prepared homogenates were mixed with 0.1 ml of
25% trichloroacetic acid (Merck, San Francisco, CA, USA), and
centrifuged at 1,700 × g for 40 min at 4°C. GSH contents were
determined by measuring the absorbance at 412 nm using
2-nitrobenzoic acid (Sigma-Aldrich, St. Louis, MO, USA) as
µM/mg tissue (32).
H2O2 decomposition in the presence of CAT was
measured at 240 nm, as previously described (33). CAT activity was defined as the
amount of enzyme required to decompose 1 nM
H2O2/min at 25°C, pH 7.8 and the results are
expressed as U/mg tissue. SOD activity was measured according to
the method described by Sun et al (34). The estimation of SOD activity was
based on superoxide radical generation by xanthine and xanthine
oxidase, which react with nitrotetrazolium blue to form formazan
dye. SOD activity was measured at absorbance 560 nm as the degree
of inhibition of this reaction, and was expressed as U/mg tissue.
One unit of SOD enzymatic activity was equivalent to the amount of
enzyme that reduced the initial absorbance of nitroblue tetrazolium
by 50% in 1 min.
Measurement of hepatic glucose-regulating
enzyme activities
The hepatic enzyme source was prepared based on the
method described by Hulcher and Oleson (35). Briefly, 0.3 g of hepatic tissue
was homogenized in buffer solution (0.1 M triethanol-amine, 0.2 M
EDTA and 0.002 M dithiothreitol), and centrifuged at 1,000 × g for
15 min at 4°C. The supernatant was centrifuged again at 10,000 × g
for 15 min at 4°C. Glucokinase (GK) activity was measured according
to the method described by Davidson and Arion (36) with slight modifications. Briefly,
0.98 ml of the reaction mixture [100 mM KCl, 50 mM NAD+,
50 mM HEPES-NaGT, pH 7.4, 10 mM glucose, 7.5 mM MgCl2,
2.5 mM dithioerythritol, 10 µl of hepatic tissue homogenate,
4 units of glucose-6-phosphate dehydrogenase (G6PDH) and 10 mg/ml
albumin], was pre-incubated at 37°C for 10 min. The reaction was
initiated by the addition of 10 µl of 5 mM ATP, and the
mixture was incubated at 37°C for 10 min. The variation in
absorbance at 340 nm was recorded. Glucose-6-phosphatase (G6pase)
activity was measured by following the method described by Alegre
et al (37). The reaction
mixture contained 765 µl of 131.58 mM HEPES-NaGT (pH 6.5),
100 µl of 265 mM glucose-6-phosphate, 100 µl of 18 mM
EDTA (pH 6.5), 10 µl of 0.2 M NADP+, 0.6 IU/ml glucose
dehydrogenase and 0.6 IU/ml mutarotase. A total of 5 µl of
the pre-incubated hepatic tissue homogenate at 37°C was added to
the mixture and incubated again at 37°C for 4 min. The change in
absorbance at 340 nm was recorded. The phosphoenolpyruvate
carboxykinase (PEPCK) activity was assessed using the Bentle and
Lardy (38) method. The reaction
mixture contained 500 mM NaHCO3, 200 mM PEP, 100 mM IDP,
72.92 mM sodium HEPES (pH 7.0), 25 mM NADH, 10 mM MnCl2,
10 mM dithiothreitol, 10 µl of hepatic tissue homogenate and
7.2 units of malic dehydrogenase. The hepatic enzyme activity was
measured based on the decrease in absorbance of the mixture at 340
nm at 25°C. All reagents and chemicals used in this hepatic enzyme
activity measurement were obtained from Sigma-Aldrich.
Histopathology
After measuring organ weights, the splenic lobes of
the pancreas and the left lateral lobes of the left kidney and
liver were fixed in 10% neutral-buffered formalin, embedded in
paraffin and cut into serial sections of 3–4 µm thickness.
Representative sections were stained with hematoxylin and eosin
(H&E; Sigma-Aldrich) for light microscopy (microscope: Eclipse
80i; Nikon Corp., Tokyo, Japan). The histological profiles of
individual organs were then examined. Alternatively, the liver
portions dehydrated in 30% sucrose solution were cut into frozen
sections on a cryostat for staining with Oil Red O (Alfa Aesar,
Heysham, UK), as previously described (39,40). To observe more detail
histopathological changes, the steatohepatitic regions and mean
hepatocyte diameter (H&E staining) were calculated by automated
image analysis (iSolution FL ver. 9.1; IMT i-solution Inc.,
Vancouver, QC, Canada) on the restricted view fields according to
previously described methods (25,26,39,40). Steatohepatitic regions, i.e.,
regions with fatty deposits in the hepatic parenchyma, were
calculated as a percentage of lipid deposition regions on cryostat
sections with Oil Red staining using a microscope with an automated
image analysis program (% mm−2 of hepatic parenchyma).
The mean diameter (µm) of hepatocytes was also calculated by
an automated image analysis program using H&E staining; at
least 10 hepatocytes were examined per view field of the liver. In
addition, means of vacuolated renal tubules with lipid droplet
deposition were calculated using an automated image analysis
program (number 100−1 tubules; one field/sample); the
mean area occupied by zymogen granules (% mm−2 of
pancreatic parenchyma), diameters (µm) of pancreatic islets,
as well as the numbers (islets/10 mm2 of pancreatic
parenchyma) were also measured using an automated image analysis
program according to previously established methods (25,26,40). The histopathologist was blinded to
group allocation at the time of the analysis.
Immunohistochemistry
Serial sections of other pancreatic tissues
(remaining tissue after H&E staining) were immunostained by the
avidin-biotin-peroxidase (ABC) method (40) using rabbit polyclonal
anti-glucagon (dilution 1:2,000; Cat. no. ab133195, Abcam,
Cambridge, MA, USA) or guinea pig polyclonal anti-insulin (dilution
1:2000; Cat. no. ab7842, Abcam) (both from DiaSorin, Stillwater MN,
USA) antiserum. Briefly, endogenous peroxidase activity was blocked
by incubating in 0.3% H2O2 and methanol for
30 min, and non-specific binding of immunoglobulin was blocked with
normal horse serum blocking solution (dilution 1:100; Vector
Laboratories, Burlingame CA, USA) for 1 h in a humid chamber.
Treatment with primary antiserum was performed overnight at 4°C in
a humid chamber, followed by incubation with biotinylated universal
secondary antibody (dilution 1:50; Cat. no. PK-6200; Vector
Laboratories) and ABC reagents (dilution 1:50, Vectastain Elite ABC
kit; Vector Laboratories) for 1 h at room temperature in a humid
chamber. Finally, the sections were reacted with the peroxidase
substrate kit (Vector Laboratories) for 3 min at room temperature.
All sections were rinsed 3 times in 0.01 M phosphate-buffered
saline (PBS) between steps. Immunoreactive cell densities over 20%
as compared with other naïve cells were regarded as positive, and
the positive cells were assessed based on mean areas of pancreatic
islets (mm2) using the automated image analysis, as
previously described (41,40).
The ratios of insulin-positive/glucagon-positive cells were
calculated as shown below in equation [2]. The histopathologist was
blinded to the group allocation at the time of the analysis.
Insulin positive/glucagon positive cells(ratio)=AB
where, A represents the mean number of insulin immunoreactive
cells, and B represents the mean number of glucagon immunoreactive
cells.
Statistical analyses
All numerical values are expressed as the means ±
standard deviation (SD) of 8 mice. Multiple comparison tests of the
different dose groups were conducted. Homogeneity of variance was
examined using Levene's test (42). In case of no significant
deviations detected from homogeneity of variance by Levene's test,
the data were analyzed by one-way ANOVA followed by the
least-significant differences multi-comparison (LSD) test to
determine the significantly different group pairs. In case of
significant deviations from homogeneity of variance on Levene's
test, the non-parametric Kruskal-Wallis H test was conducted. When
a significant difference was observed on the Kruskal-Wallis H test,
the Mann-Whitney U test was performed to determine the
significantly different specific group pairs. Statistical analyses
were performed using SPSS software (ver. 14.0; SPSS Inc., Chicago,
IL, USA), as previously described (43). The efficacy of the test agents was
calculated by comparing the percentage changes with HFD control,
and the assess disease induction was assessed by calculating the
percentage changes between intact and HFD controls according to
equations [3] and [4], as previously described (40).
%changes compared with intact control=Data of HFD control−Data of intact controlData of intact control×100
%changes compared with HFD control=Data of test agent treated mice−Data of HFD controlData of HFD control×100
Results
Changes in body weight and food
consumption
We selected only adapted mice exhibiting a regular
body weight increase as compared to the intact (normal diet)
controls during 1 week of HFD supply (intact control: mean,
29.60±1.59 g; range, 27.30–32.20 g; HFD group: mean, 32.33±1.63 g;
range, 29.70–35.80 g). HFD control mice exhibited significant
(p<0.01) increases in body weight compared with the intact
controls from 1 week after commencement of being fed the HFD;
accordingly, body weight gains during the 7-day HFD adaptation
period and 84-day administration period were also significantly
increased compared with the intact controls (both p<0.01).
However, significant (p<0.01 or p<0.05) decreases in body
weight were detected in mice treated with metformin at 250 mg/kg,
or MPh at 125, 250 and 500 mg/kg; accordingly, body weight gains
during the 84 days of administration were also significantly
decreased in these groups compared with the HFD controls (all
p<0.01) (Table II).
| Table IIChanges on body weight gain and mean
daily food consumption in mice with type II diabetes. |
Table II
Changes on body weight gain and mean
daily food consumption in mice with type II diabetes.
| Group | Body weight (g) at
days after initial test substance treatment
| Body weight gain
during
| Mean daily food
consumption (g) |
|---|
| 8 days before
[A] | 1 day before
[B] | 0 daya before [C] | 84 daysa [D] | Adaptation period
[B-A] | Administration
period [D-C] |
|---|
| Controls | | | | | | | |
| Intact | 29.03±1.51 | 29.60±1.59 | 27.13±1.70 | 32.65±2.52 | 0.58±0.36 | 5.53±1.46 | 5.30±0.63 |
| HFD | 28.94±1.81 | 32.38±2.00b | 30.10±1.89b | 49.95±6.45c | 3.44±1.22c | 19.85±7.10c | 4.05±0.41c |
| Reference | | | | | | | |
| Metformin | 28.98±1.48 | 32.34±1.58b | 30.13±1.57b | 38.41±1.72c,e | 3.36±1.12c | 8.29±1.93c,e | 4.09±0.61c |
| MPh-treated | | | | | | | |
| 500 mg/kg | 28.98±1.55 | 32.31±1.60b | 30.20±1.18b | 34.93±0.92d,e | 3.34±0.63c | 4.73±1.95e | 4.02±0.69c |
| 250 mg/kg | 28.98±1.60 | 32.28±1.65b | 30.06±1.61b | 35.26±2.12d,e | 3.30±0.24c | 5.20±2.13e | 4.09±0.40c |
| 125 mg/kg | 29.04±1.70 | 32.31±1.81b | 29.98±1.74b | 37.68±2.31c,e | 3.28±0.36c | 7.70±2.15e | 4.09±0.49c |
Although a significant (p<0.01) decrease in mean
daily food consumption was detected in all HFD-fed mice compared
with the intact controls, no significant changes were observed in
mean daily food consumption in any of the test agent groups
(Table II).
Anti-diabetic effects
Effects on pancreatic weight
changes
A significant (p<0.01) decrease in the relative
pancreas weight was identified in the HFD control mice compared
with the intact controls. However, a significant (p<0.01)
increase in relative pancreas weight was noted in the mice treated
with metformin at 250 mg/kg or MPh at 125, 250 and 500 mg/kg
compared with the HFD controls. No significant changes were
detected in the absolute pancreatic weight in any of the
experimental HFD-fed mice, including HFD controls, compared with
the intact controls (Table
III).
| Table IIIChanges on absolute and relative
organ weights in mice with type II diabetes. |
Table III
Changes on absolute and relative
organ weights in mice with type II diabetes.
| Group | Absolute organ
weight (g)
| Relative organ
weight (% of body weight)
|
|---|
| Liver | Kidney | Pancreas | Liver | Kidney | Pancreas |
|---|
| Controls | | | | | | |
| Intact | 1.174±0.063 | 0.177±0.008 | 0.201±0.023 | 3.168±0.373 | 0.543±0.040 | 0.617±0.073 |
| HFD | 1.729±0.109a | 0.245±0.015d | 0.187±0.019 | 3.502±0.401 | 0.497±0.069 | 0.380±0.069a |
| Reference | | | | | | |
| Metformin | 1.334±0.134a,c | 0.206±0.026d,g | 0.188±0.009 | 3.486±0.447 | 0.537±0.079 | 0.491±0.037a,c |
| MPh-treated | | | | | | |
| 500 mg/kg | 1.140±0.110c | 0.180±0.008f | 0.197±0.019 | 3.260±0.256b | 0.515±0.031 | 0.566±0.061c |
| 250 mg/kg | 1.180±0.083c | 0.186±0.008e,f | 0.192±0.020 | 3.357±0.314 | 0.530±0.043 | 0.546±0.068b,c |
| 125 mg/kg | 1.307±0.086b,c | 0.201±0.010d,f | 0.188±0.010 | 3.476±0.229 | 0.534±0.039 | 0.501±0.035a,c |
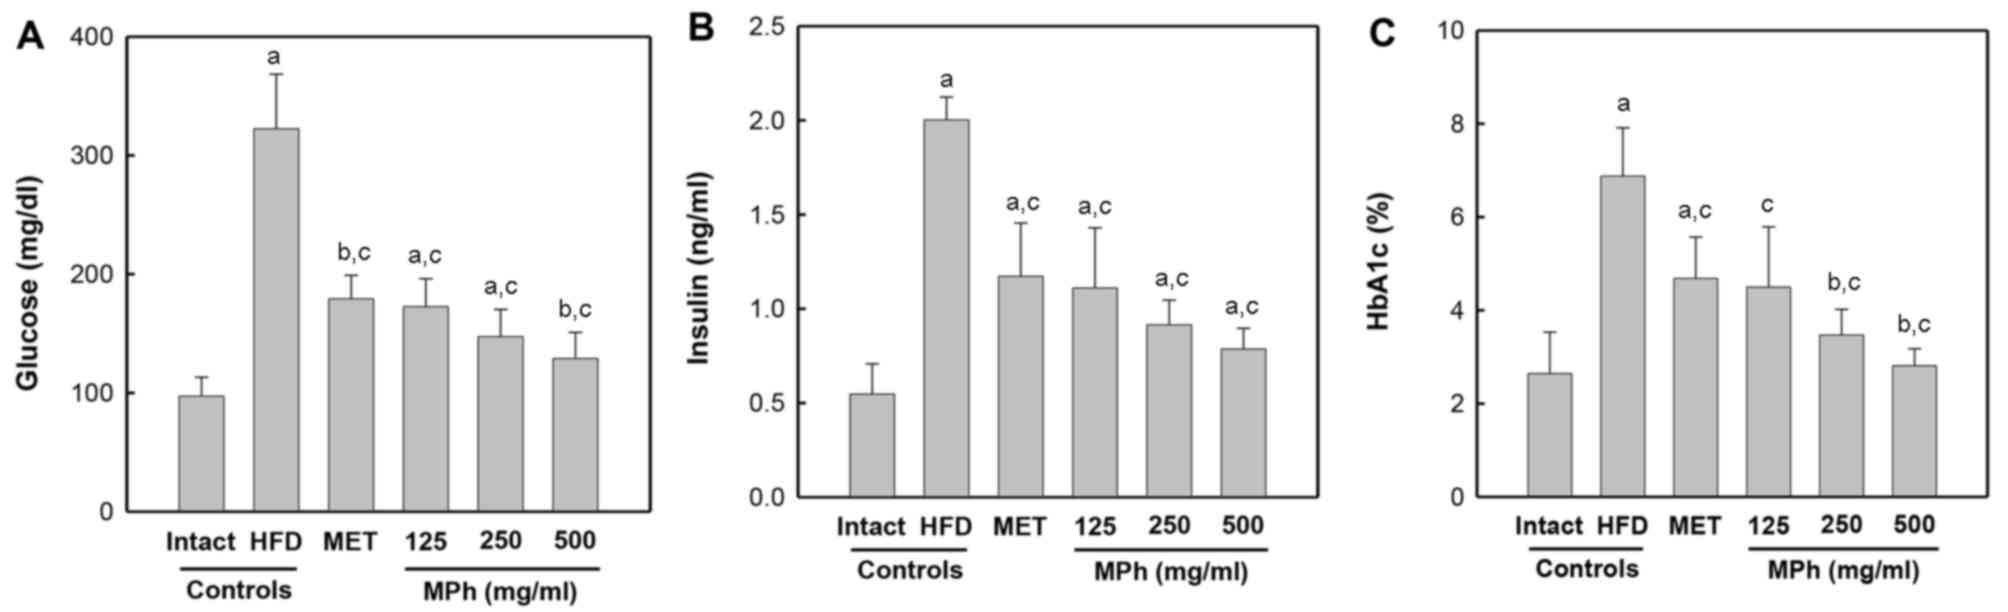
Effects on blood glucose, insulin and
HbA1c levels
A significant (p<0.01) increase in blood glucose
levels was noted in the HFD controls compared with the intact
controls. However, the blood glucose levels were significantly
(p<0.01) decreased by treatment with metformin or MPh compared
with the HFD controls (Fig. 1A).
A significant (p<0.01) increase in serum insulin levels was
detected in the HFD controls compared with the intact controls.
However, the serum insulin levels were significantly (p<0.01)
decreased by treatment with all test agents compared with the HFD
controls (Fig. 1B). In addition,
a significant (p<0.01) increase in the blood HbA1c content was
observed in the HFD controls compared with the intact controls.
However, the blood HbA1c content was significantly (p<0.01)
decreased by treatment with all test agents compared with the HFD
controls (Fig. 1C).
Effects on pancreatic islet
hyperplasia and expansion
A significant (p<0.01) increase in the number and
mean diameter of pancreatic islets was detected in the HFD controls
compared with the intact controls due to marked hyperplasia of the
pancreatic islets themselves or component endocrine cells. However,
both hyperplasia and expansion of islets were significantly
(p<0.01 or p<0.05) reduced by treatment with all test agents,
including MPh at 125 mg/kg, compared with the HFD controls
(Table IV and Fig. 2).
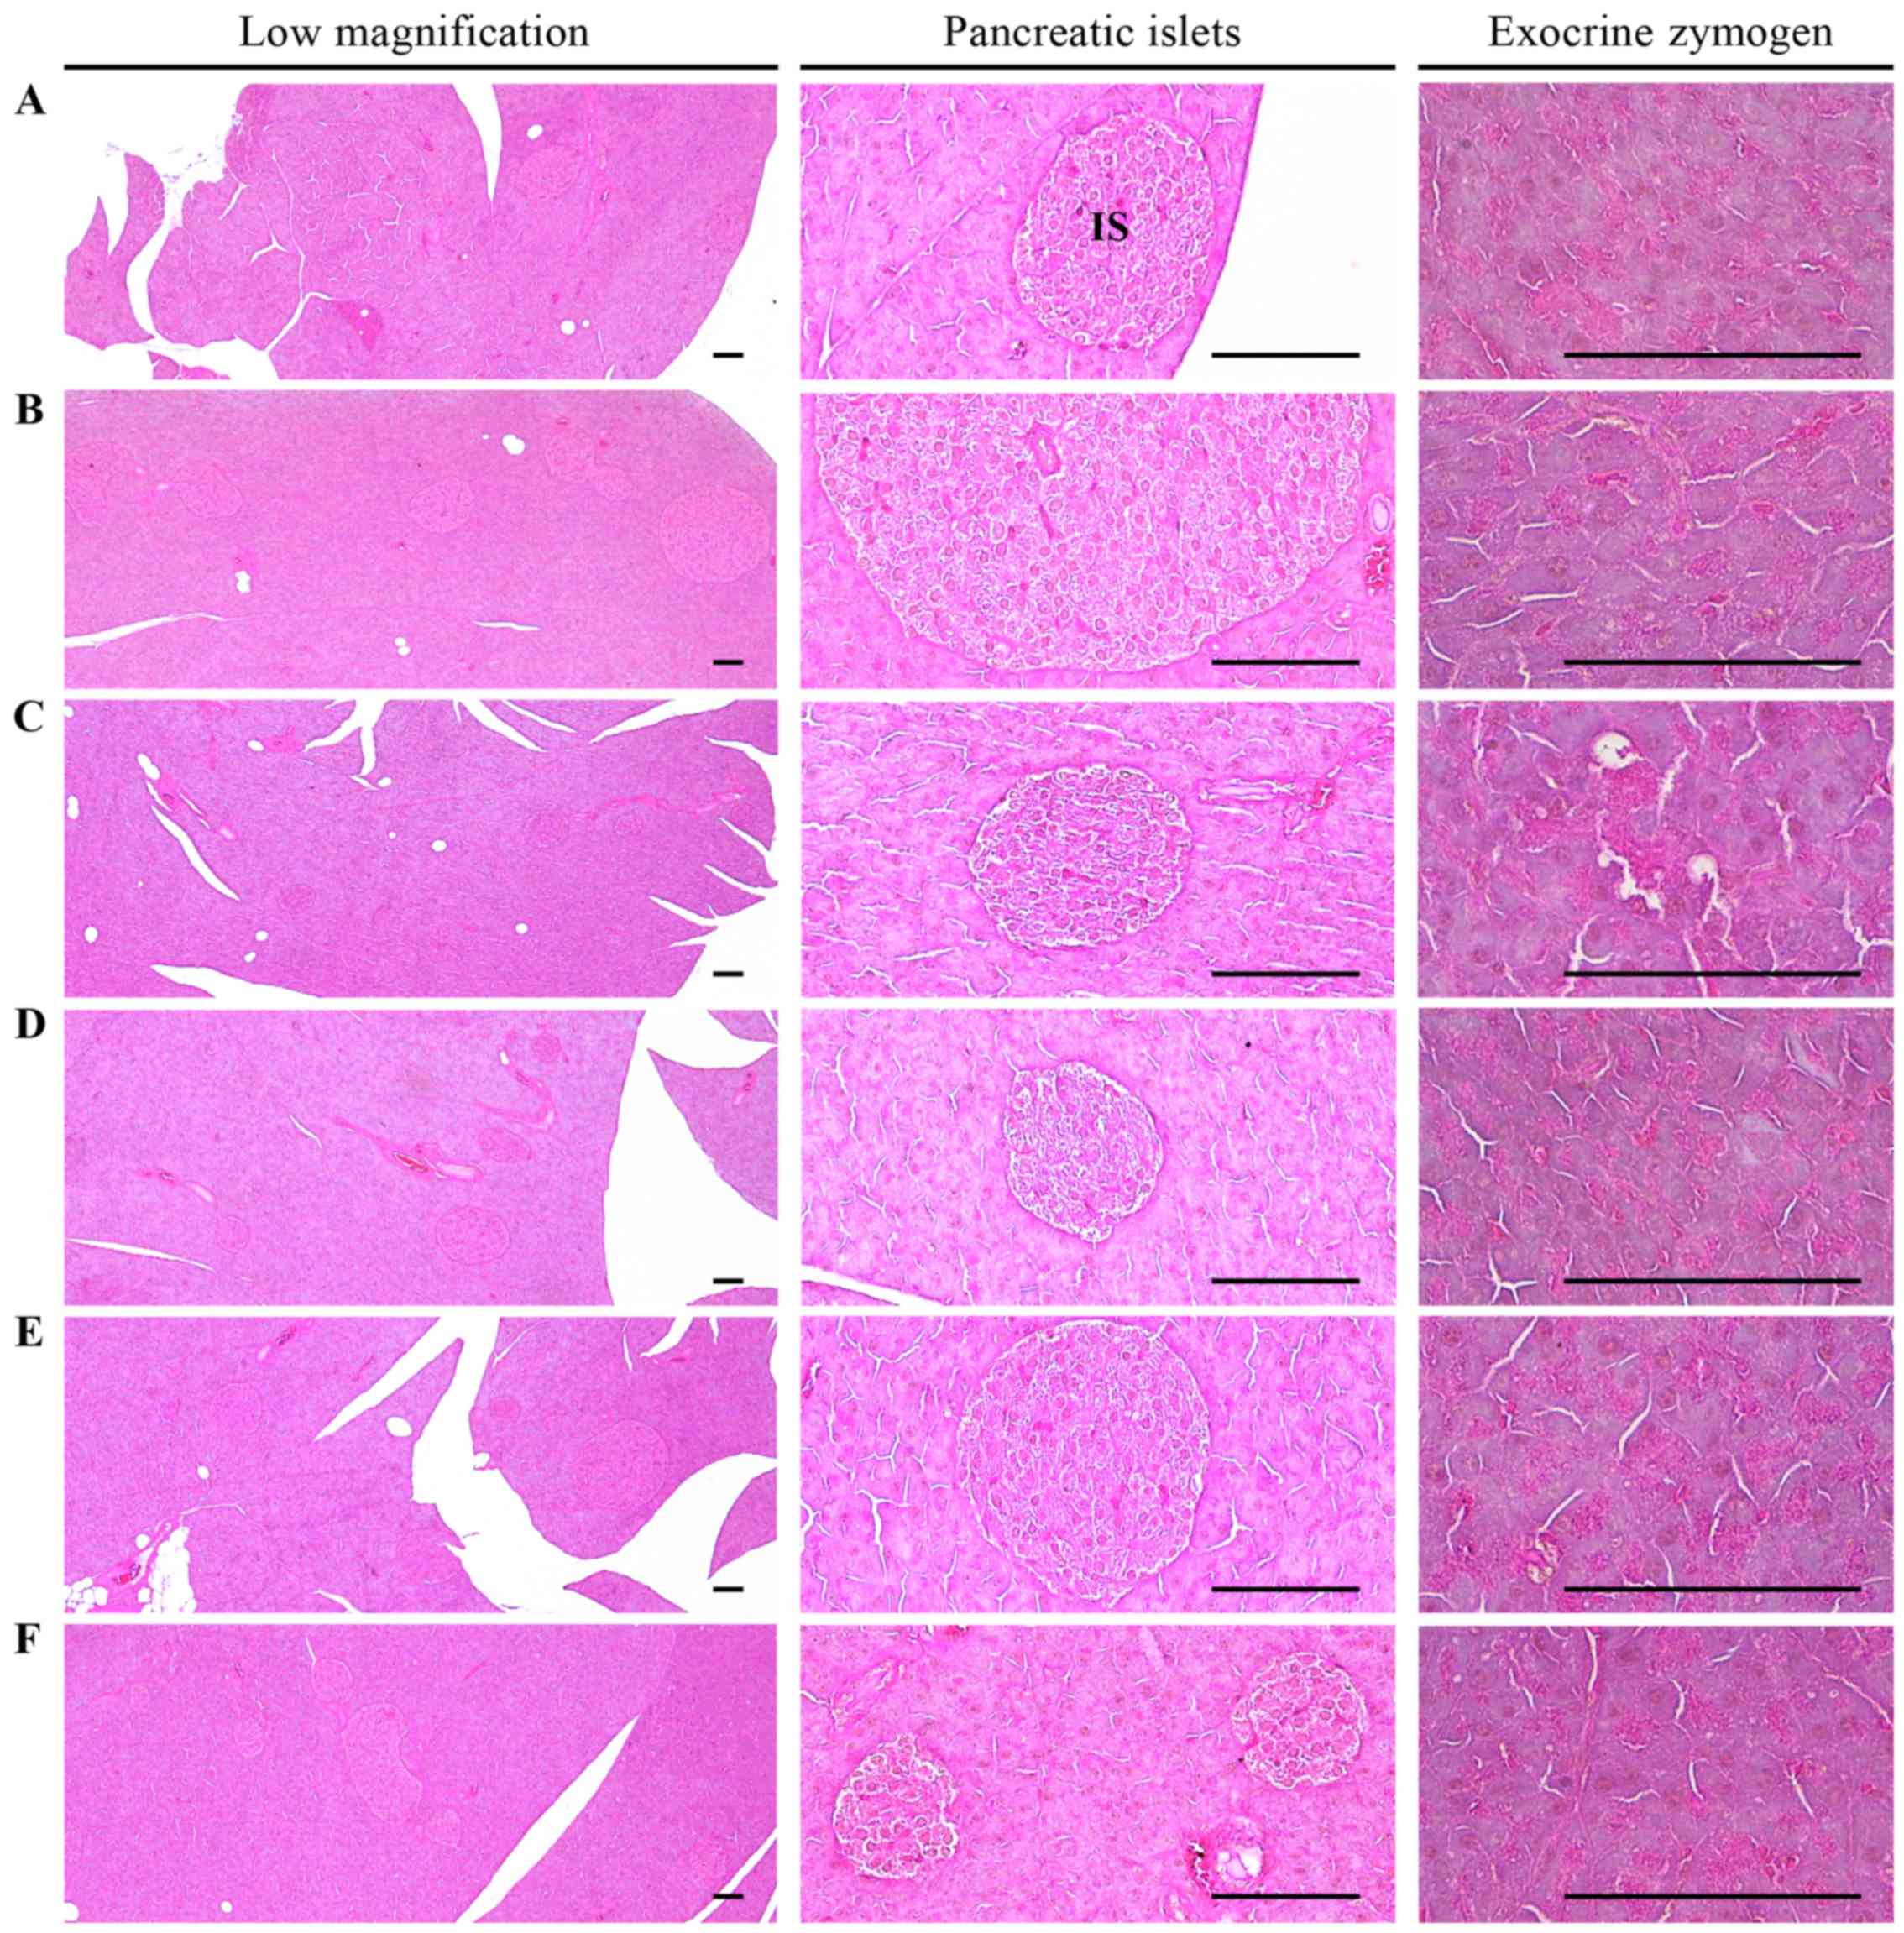 | Figure 2Histological images of the pancreas.
Note that the noticeable decrease in the exocrine pancreas zymogen
granule content (the percentages of exocrine pancreas occupied by
zymogen granules) may be due to the release of zymogen granules,
and an increase in pancreatic islet numbers and mean diameters
results from marked hyperplasia of the pancreatic islet itself or
component endocrine cells detected in the HFD control as compared
with the intact control. However, exocrine pancreas zymogen granule
contents were markedly increased in all test material-treated mice
as compared with the HFD control, in which the percentages of
exocrine pancreas occupied by zymogen granules were not
significantly altered as compared to those of HFD control mice. In
addition, expansions of pancreatic islets were also meaningfully
inhibited by treatment with all test materials in the present
study. (A) Intact control: mice supplied normal pellet diet
(vehicle control mice); mice administered 10 ml/kg of distilled
water orally. (B) HFD control: mice administered 10 ml/kg of
distilled water orally with HFD supply. (C) Metformin, mice
administered 250 mg/kg of metformin orally with HFD supply. (D) MPh
500, mice administered 500 mg/kg of MPh orally with HFD supply. (E)
MPh 250, mice administered 250 mg/kg of MPh orally with HFD supply.
(F) MPh 125, mice administered 125 mg/kg of MPh orally with HFD
supply. HFD, 45% kcal high-fat diet; MPh, melanian snail
(Semisulcospira libertina) protein hydrolysates, test
material; IS, pancreatic islet. PD, pancreatic secretory duct. All
images show hematoxylin and eosin staining. Scale bars, 80
µm. |
| Table IVChanges on
histopathology-histomorphometry of the pancreas of mice with type
II diabetes. |
Table IV
Changes on
histopathology-histomorphometry of the pancreas of mice with type
II diabetes.
| Group | Zymogen granules
(%/mm2 of exocrine) | Mean islet numbers
(nos./10 mm2) | Mean islet diameter
(µm/islet) | Insulin-IR cells
(cells/mm2) [A] | Glucagon-IR cells
(cells/mm2) [B] | Insulin/glucagon
ratio [A/B] |
|---|
| Controls | | | | | | |
| Intact | 53.26±10.96 | 8.38±2.20 | 94.76±22.61 | 638.50±102.84 | 176.38±22.43 | 3.61±0.23 |
| HFD | 12.79±3.15d | 36.38±5.88d |
335.85±81.03d |
3022.50±256.92d |
353.00±33.23a | 8.57±0.26d |
| Reference | | | | | | |
| Metformin | 29.40±10.34d,f | 24.38±8.62d,g |
169.05±30.70d,f |
1946.13±516.31d,f |
275.50±51.64a,c | 6.98±0.63d,f |
| MPh-treated | | | | | | |
| 500 mg/kg | 37.01±5.90d,f | 16.38±1.41d,f |
132.30±25.48e,f |
1031.25±102.05d,f |
214.63±26.67b,c | 4.83±0.33d,f |
| 250 mg/kg | 32.66±3.20d,f | 19.38±2.50d,f |
146.14±18.42d,f |
1411.50±152.84d,f |
248.50±14.42a,c | 5.70±0.74d,f |
| 125 mg/kg | 30.23±6.24d,f | 23.50±4.17d,f |
166.77±33.19d,f |
1872.00±161.92d,f |
276.63±37.05a,c | 6.82±0.66d,f |
Effects on pancreatic islet glucagon-
and insulin-immunoreactive cells
A significant (p<0.01) increase in glucagon- and
insulin-immunoreactive cells, and in the
insulin-immunoreactive/glucagon-immunoreactive cell ratio, was
noted in the HFD control mice compared with the intact controls.
However, these abnormal increases in insulin- and
glucagon-immunoreactive cells and their ratios
(insulin-immunoreactive/glucagon-immunoreactive cells) were
significantly (p<0.01) normalized by treatment with all test
agents, including MPh at 250 mg/kg, compared with the HFD controls
(Table IV and Fig. 3).
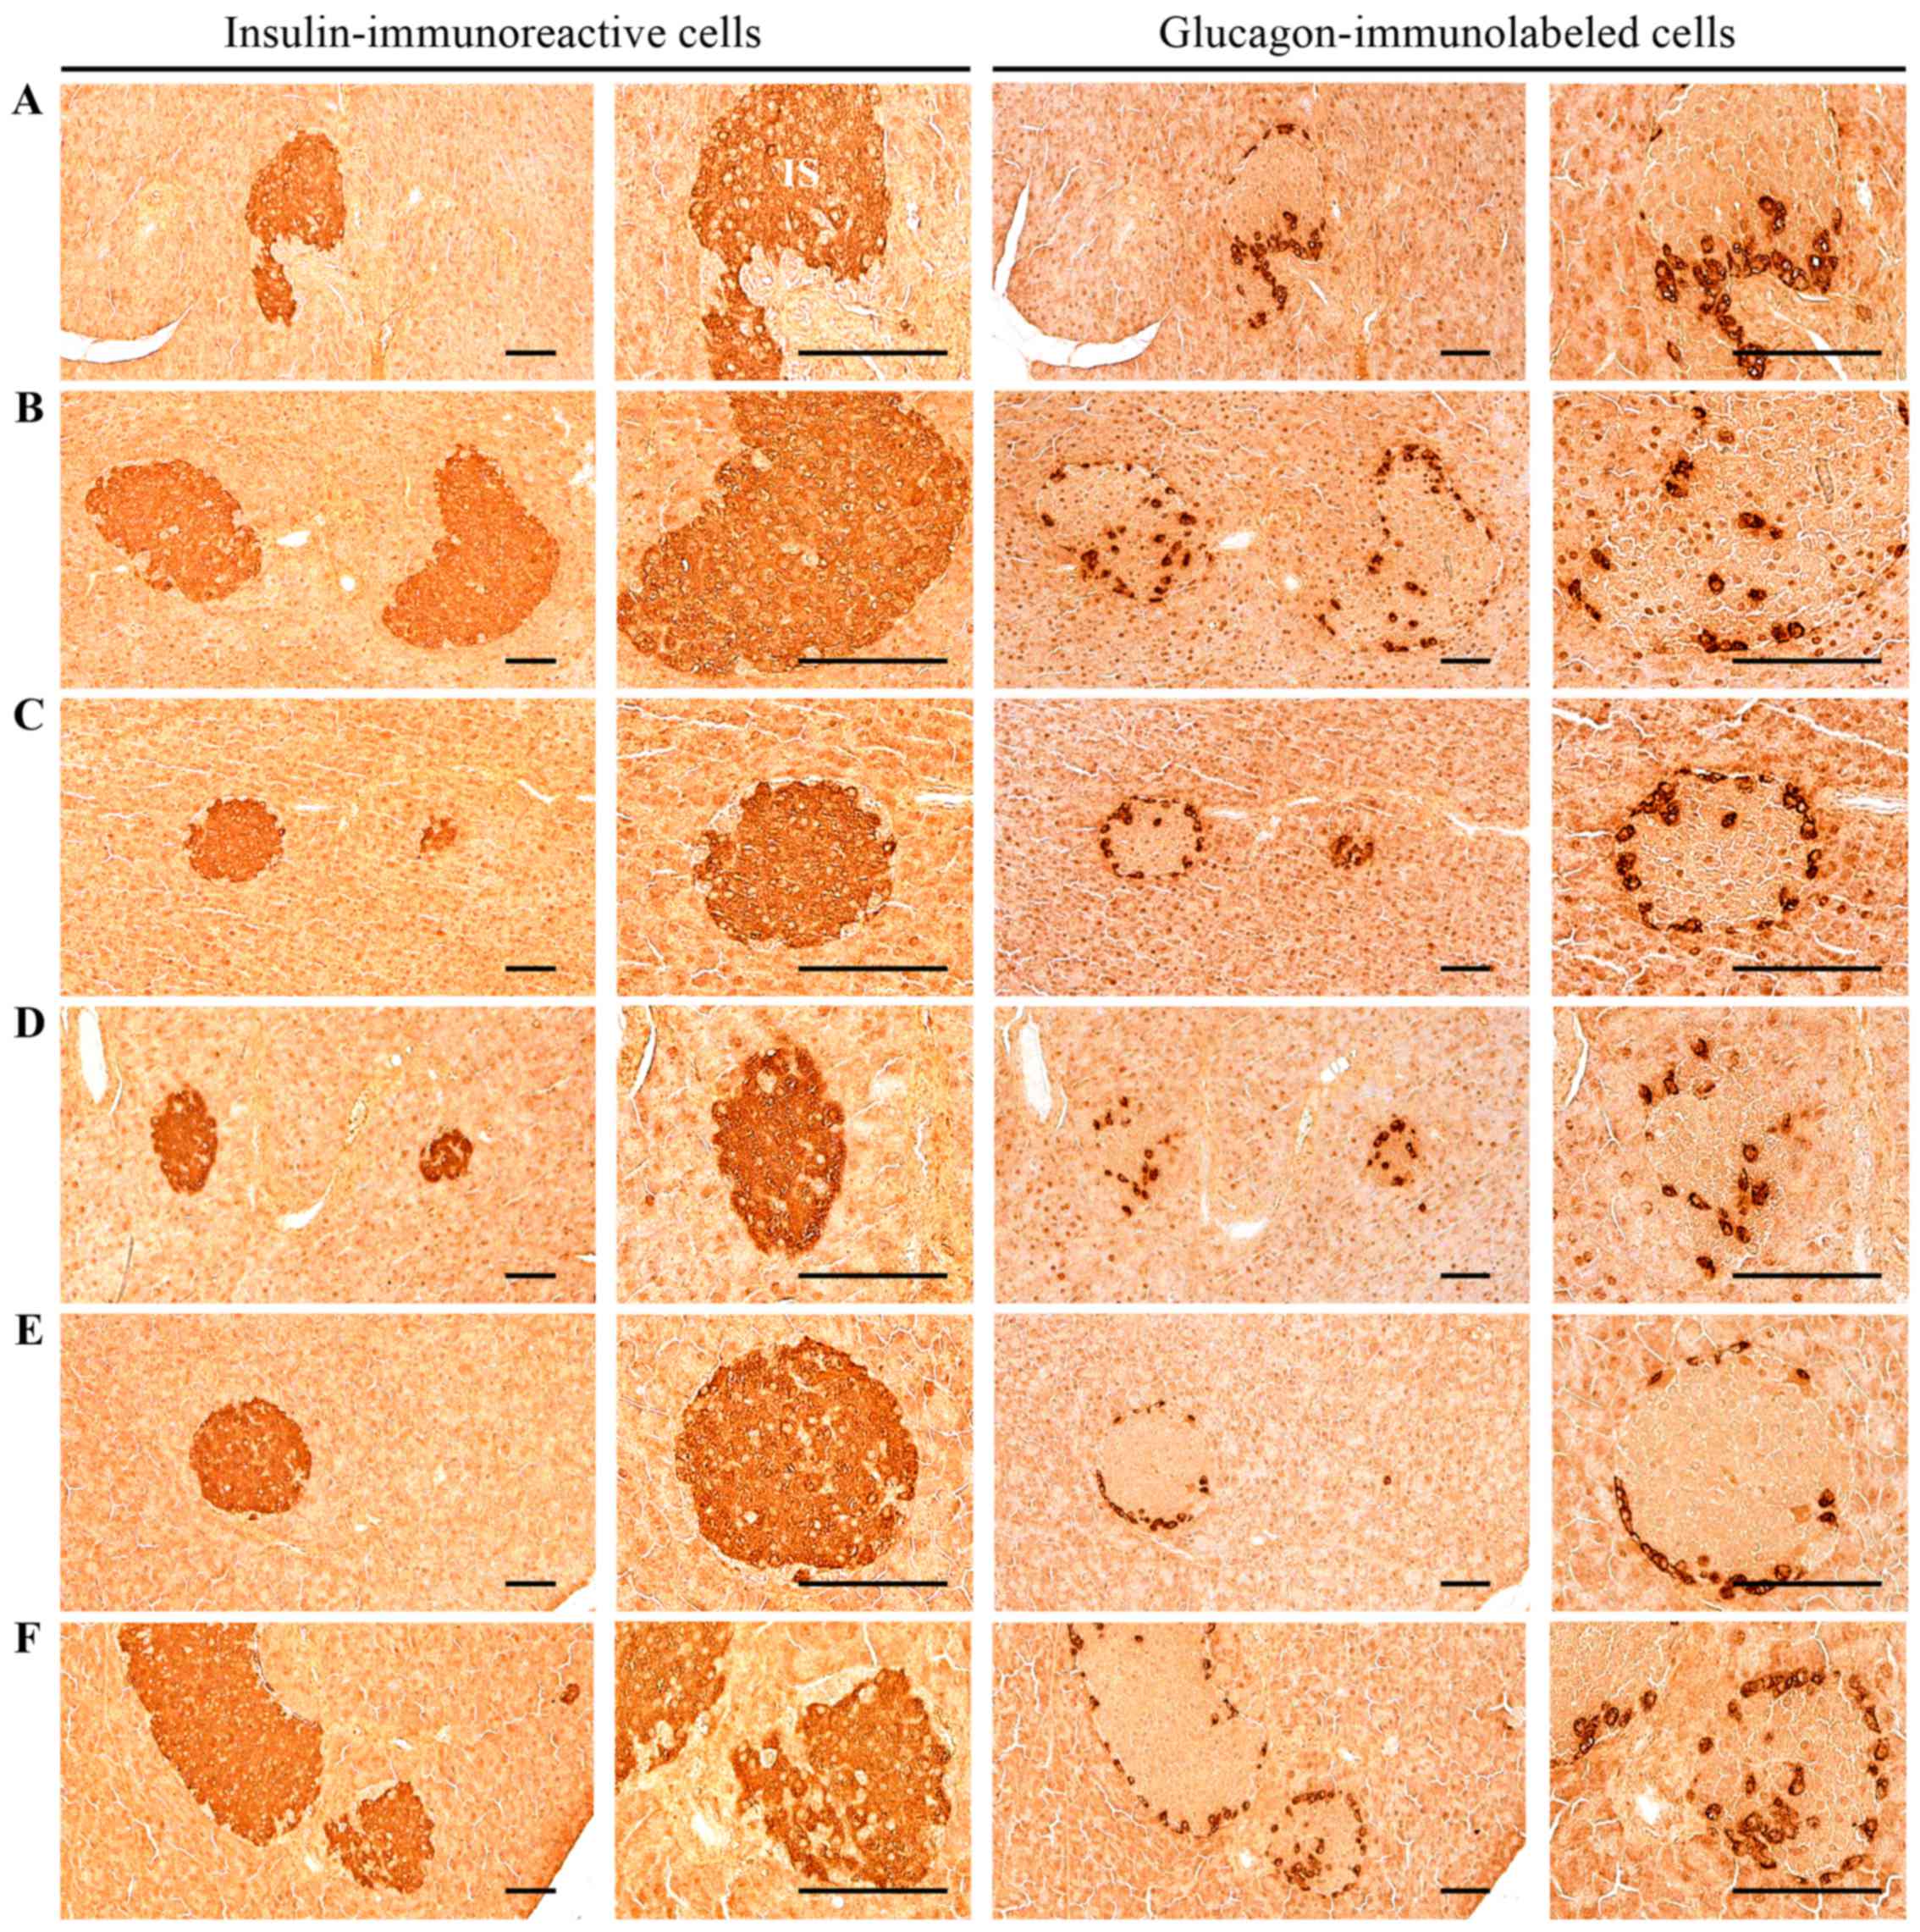 | Figure 3Histological images of the insulin-
and glucagon-immunoreactive cells in the pancreas. Significant
increases of insulin and glucagon-immunoreactive cells, and also
insulin/glucagon cells were detected in the HFD control mice as
compared with the intact control. However, these abnormal increases
in insulin and glucagon-immunostained cells and their ratio
(insulin/glucagon cells) were significantly normalized by treatment
with all test materials, including MPh 250 mg/kg as compared with
the HFD control.(A) Intact control: mice supplied normal pellet
diet (vehicle control mice); mice administered 10 ml/kg of
distilled water orally. (B) HFD control: mice administered 10 ml/kg
of distilled water orally with HFD supply. (C) Metformin, mice
administered 250 mg/kg of metformin orally with HFD supply. (D) MPh
500, mice administered 500 mg/kg of MPh orally with HFD supply. (E)
MPh 250, mice administered 250 mg/kg of MPh orally with HFD supply.
(F) MPh 125, mice administered 125 mg/kg of MPh orally with HFD
supply. HFD, 45% kcal high-fat diet. MPh, melanian snail
(Semisulcospira libertina) protein hydrolysates, test
material. All images show immunostaining with
avidin-biotin-peroxidase complex. Scale bars, 80 µm. |
Antihyperlipidemic effects
Effects on serum TC, TG, LDL, and HDL
levels
A significant (p<0.01) increase in serum TC, TG
and LDL levels was detected in the HFD controls compared with the
intact controls. However, the serum TC, TG and LDL levels were
significantly (p<0.01) decreased in all the test agent groups.
The mice treated with MPh at 250 or 500 mg/kg in particular
exhibited a marked decrease in TC and TG levels compared with the
HFD controls (Table V). In
addition, a significant (p<0.01) decrease in serum HDL levels
was noted in the HFD controls compared with the intact controls.
However, the serum HDL levels were significantly (p<0.01)
increased in all of the test agent groups (Table V).
| Table VChanges in the levels of secondary
liver damage markers in mice with type II diabetes. |
Table V
Changes in the levels of secondary
liver damage markers in mice with type II diabetes.
| Group | AST (IU/l) | ALT (IU/l) | TC (mg/dl) | TG (mg/dl) | LDL cholesterol
(mg/dl) | HDL cholesterol
(mg/dl) | Liver steatosis
(%/mm2 of hepatic tissues) | Mean hepatocyte
diameters (µm/cell) |
|---|
| Controls | | | | | | | | |
| Intact | 75.88±14.36 | 36.25±12.01 | 118.50±22.55 | 52.63±18.32 | 15.25±2.38 | 107.00±24.93 | 7.28±2.66 | 17.91±1.90 |
| HFD |
230.63±28.91a |
176.13±21.12a |
289.75±30.06a |
218.13±18.73a |
51.00±8.19d | 21.00±7.89a | 78.95±11.01a | 55.14±12.63a |
| Reference | | | | | | | | |
| Metformin |
152.00±45.23a,c | 99.63±19.67a,c |
207.38±39.19a,c |
147.63±15.65a,c |
28.88±8.63d,f | 58.88±18.88a,c | 42.82±14.23a,c | 28.71±1.70a,c |
| MPh-treated | | | | | | | | |
| 500 mg/kg |
114.38±38.44b,c | 61.63±15.13a,c |
151.38±17.02b,c |
104.63±20.83a,c |
18.88±2.10d,f | 81.13±12.23a,c | 15.07±3.91a,c | 20.88±4.92c |
| 250 mg/kg |
121.75±37.92b,c | 72.75±17.65a,c |
171.13±20.19a,c |
114.63±27.33a,c |
20.50±2.33d,f | 76.50±15.43a,c | 19.02±3.53a,c | 21.04±2.52b,c |
| 125 mg/kg |
146.13±38.36a,c | 90.13±17.88a,c |
192.13±29.35a,c |
139.00±19.79a,c |
27.50±5.48d,f | 68.75±14.85a,c | 37.79±12.52a,c | 26.13±4.18a,c |
Effects on zymogen granule contents of
exocrine pancreas
A significant (p<0.01) decrease in the zymogen
granule contents of the exocrine pancreas (percentages of exocrine
pancreas occupied by zymogen granules) was identified in the HFD
controls compared with the intact controls due to the release of
zymogen granules. However, the exocrine pancreas zymogen granule
contents significantly (p<0.01) increased in mice treated with
MPh at all concentrations examined compared with the HFD controls
(Table IV and Fig. 2).
Effects on glucose-regulating enzymes in
the liver
Effects on hepatic GK activity
A significant (p<0.01) decrease in the activity
of hepatic GK, one of the blood glucose-utilizing hepatic enzymes,
was noted in the HFD controls compared with the intact controls;
however, these levels were significantly (p<0.01) normalized by
treatment with all test agents compared with the HFD control mice
(Table VI).
| Table VIChanges in hepatic glucose-regulating
enzyme activities in mice with type II diabetes. |
Table VI
Changes in hepatic glucose-regulating
enzyme activities in mice with type II diabetes.
| Group | Glucokinase
(nM/min/mg protein) |
Glucose-6-phosphatase (nM/min/mg
protein) | PEPCK (nM/min/mg
protein) |
|---|
| Controls | | | |
| Intact | 2.93±0.28 | 106.12±16.57 | 1.84±0.40 |
| HFD | 1.71±0.37a |
194.17±23.69a | 4.91±0.79a |
| Reference | | | |
| Metformin | 2.34±0.27a,c |
143.48±21.87a,c | 2.99±0.65a,c |
| MPh-treated | | | |
| 500 mg/kg | 2.85±0.32c |
120.64±17.81c | 2.40±0.43c |
| 250 mg/kg | 2.65±0.46c |
132.41±21.62b,c | 2.63±0.42b,c |
| 125 mg/kg | 2.39±0.42a,c |
139.86±26.50a,c | 2.91±0.74a,c |
Effects on hepatic G6pase
activity
A significant (p<0.01) increase in the activity
of hepatic G6pase, one of the gluconeogenesis hepatic enzymes, was
identified in the HFD controls compared with the intact controls;
however, these levels were significantly (p<0.01) normalized by
treatment with all test agents compared with the HFD control mice
(Table VI).
Effects on hepatic PEPCK activity
A significant (p<0.01) increase in the activity
of hepatic PEPCK, a gluconeogenesis hepatic enzyme, was noted in
the HFD controls compared with the intact controls; however, these
levels were significantly (p<0.01 or p<0.05) normalized by
treatment with all test agents compared with the HFD control mice
(Table VI).
Effects on liver damage
Effects on liver weight
A significant (p<0.01) increase in absolute liver
weight was observed in the HFD controls compared with the intact
controls. However, this increase in absolute liver weight was
significantly (p<0.01) normalized by treatment with all test
agents, including MPh at 250 mg/kg, compared with the HFD control
mice. No significant changes in relative liver weight were observed
in the HFD control mice compared with the intact controls, and mice
treated with any of the test agents compared with the HFD controls
(Table III).
Effects on serum AST and ALT
levels
A significant (p<0.01) increase in serum AST and
ALT levels was observed in the HFD control mice as compared to the
intact controls. However, the serum AST and ALT levels were
significantly (p<0.01) decreased in all the test
agent-administered mice (Table
VI).
Effects on steatohepatitis and
hepatocyte hypertrophy
A significant (p<0.01) increase in
steatohepatitis (percentage change of fatty regions in liver
parenchyma) was noted in the HFD controls as compared to the intact
controls. This was perhaps due to the severe hypertrophy of
hepatocytes related to intracellular lipid depositions. However,
increases in steatohepatitis were significantly (p<0.01)
normalized by treatment with all test agents, including metformin
at 250 mg/kg. A significant (p<0.01) increase in the mean
diameter of hepatocytes (hypertrophy) was observed in the HFD
controls compared with the intact controls. However, hepatocyte
hypertrophy was markedly and significantly (p<0.01) decreased in
all test agent-treated mice, including the MPh 125 mg/kg group,
compared with the HFD controls (Table
V and Fig. 4).
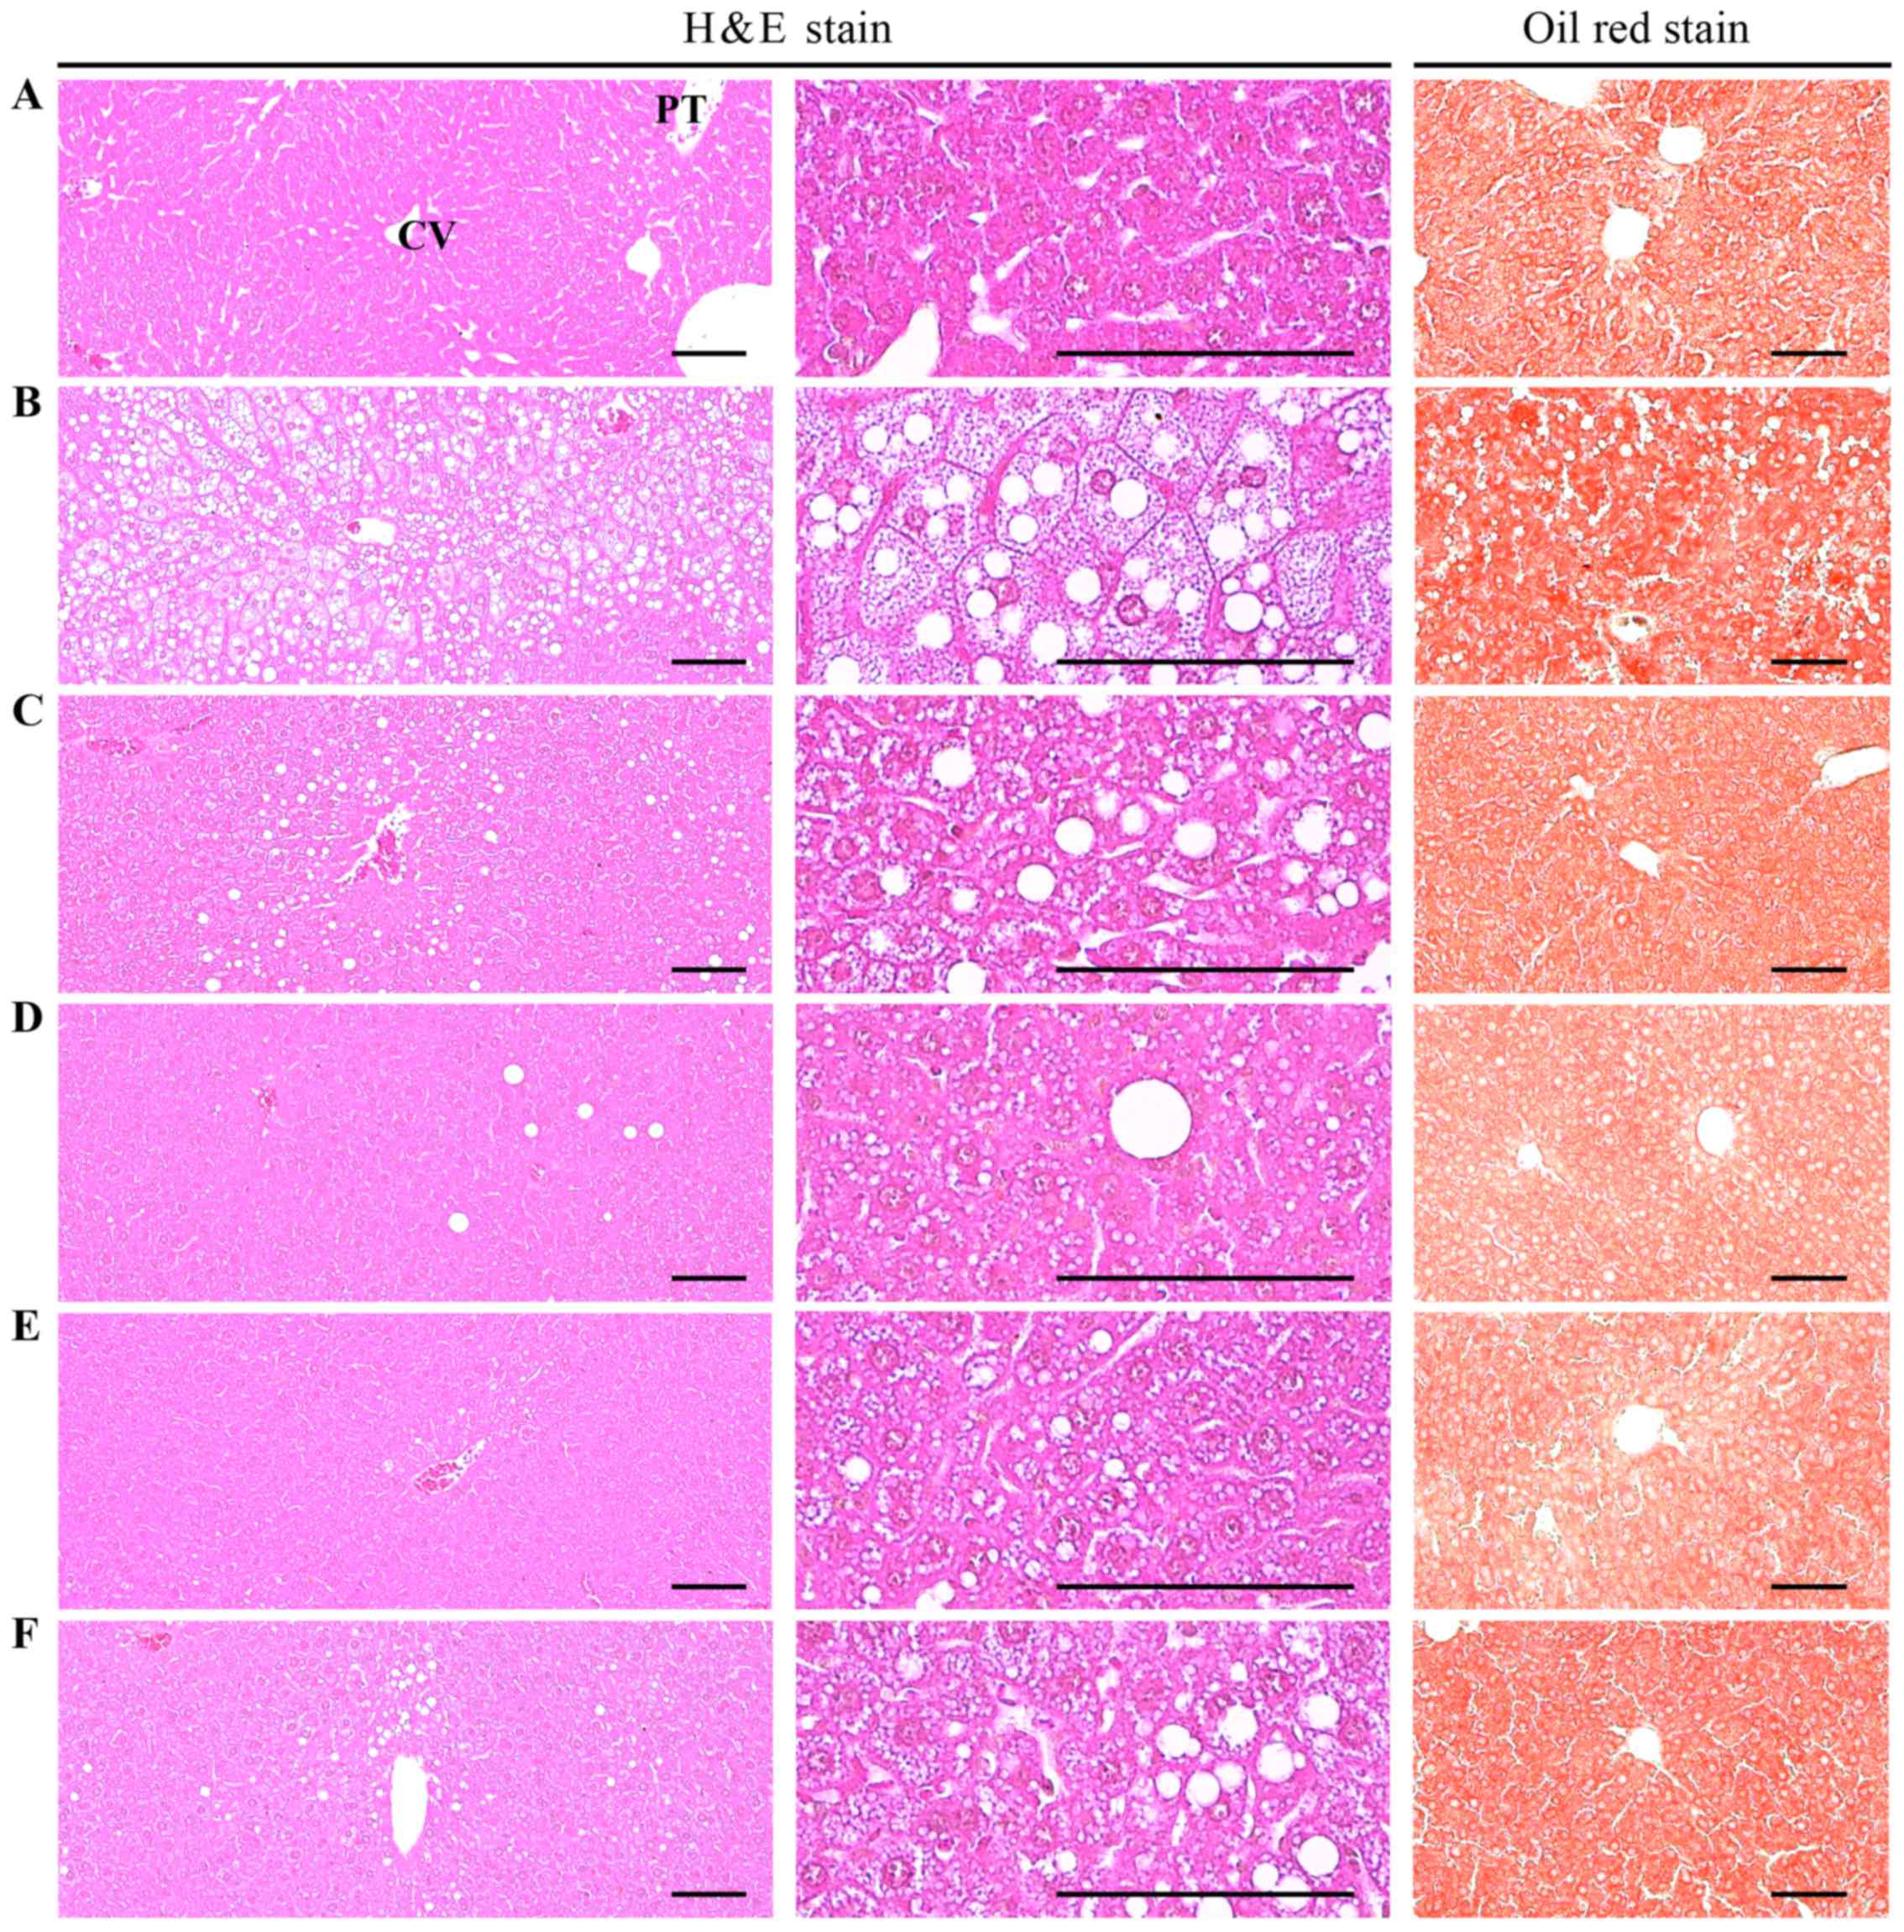 | Figure 4Histological images of the liver.
Note that marked increases in steatohepatitis and in the
percentages of fatty changed regions in liver parenchyma, were
detected in the HFD control as compared with the intact control,
resulting from severe hypertrophy of hepatocyte related to
intracellular lipid depositions. However, steatohepatitis was
normalized by treatment with all test materials, including MPh 250
mg/kg treated mice. In particular, the HFD-fed mice treated with
MPh at 125, 250 and 500 m/kg also exhibited noticeable decreases in
steatohepatitis regions and related hepatocyte hypertrophies as
compared with HFD-fed mice, in this experiment. (A) Intact control:
mice supplied normal pellet diet (vehicle control mice); mice
administered 10 ml/kg of distilled water orally. (B) HFD control:
mice administered 10 ml/kg of distilled water orally with HFD
supply. (C) Metformin, mice administered 250 mg/kg of metformin
orally with HFD supply. (D) MPh 500, mice administered 500 mg/kg of
MPh orally with HFD supply. (E) MPh 250, mice administered 250
mg/kg of MPh orally with HFD supply. (F) MPh 125, mice administered
125 mg/kg of MPh orally with HFD supply.. HFD, 45% kcal high-fat
diet; MPh, melanian snail (Semisulcospira libertina) protein
hydrolysates, test material; CV, central vein; PT, portal triad.
Scale bars, 80 µm. |
Effects on kidney damage
Effects on kidney weight
A significant (p<0.01) increase in absolute
kidney weight was observed in the HFD controls compared with the
intact controls; this increase was significantly (p<0.01 or
p<0.05) normalized by treatment with all test agents, including
MPh at 500 mg/kg, compared with the HFD-fed mice. No significant
changes in relative kidney weight were noted in the HFD control
mice compared with the intact controls, and there were no
significant changes in relative kidney weight in mice treated with
any of the test agents compared with the HFD control mice (Table III).
Effects on serum BUN and creatinine
levels
A significant (p<0.01) increase in serum BUN
levels was observed in the HFD controls compared with the intact
controls. However, the serum BUN levels were significantly
(p<0.01) decreased in the HFD-fed mice treated with all test
agents compared with the HFD controls (Table VII). In addition, a significant
(p<0.01) increase in serum creatinine levels was noted in the
HFD control mice compared with intact the controls. However, the
serum creatinine levels were significantly (p<0.01) decreased in
all test agent-treated HFD mice, including the MPh group at 500
mg/kg group, when compared with the HFD controls (Table VII).
| Table VIIChanges in the levels of secondary
kidney damage markers in mice with type II diabetes. |
Table VII
Changes in the levels of secondary
kidney damage markers in mice with type II diabetes.
| Group | BUN (mg/dl) | Creatinine
(mg/dl) | Degenerative renal
tubule numbers (%) |
|---|
| Controls | | | |
| Intact | 37.00±13.05 | 0.69±0.20 | 3.88±1.89 |
| HFD |
103.00±21.67a | 2.25±0.32a | 75.75±14.19a |
| Reference | | | |
| Metformin | 68.25±15.94a,c | 1.56±0.32a,c | 44.63±15.19a,c |
| MPh-treated | | | |
| 500 mg/kg | 41.75±10.79c | 0.94±0.12b,c | 21.00±3.93a,c |
| 250 mg/kg | 57.75±14.24a,c | 1.03±0.18a,c | 30.13±6.13a,c |
| 125 mg/kg | 66.13±11.34a,c | 1.43±0.33a,c | 41.75±9.32a,c |
Effects on kidney histopathology
A significant (p<0.01) increase in degenerative
vacuolated renal tubules was observed in the HFD control mice
compared with the intact controls, which resulted from diabetic
nephropathies associated with lipid droplet deposition; however,
these diabetic nephropathies were significantly (p<0.01)
normalized by treatment with all test agents in the experiments
(Table VII and Fig. 5).
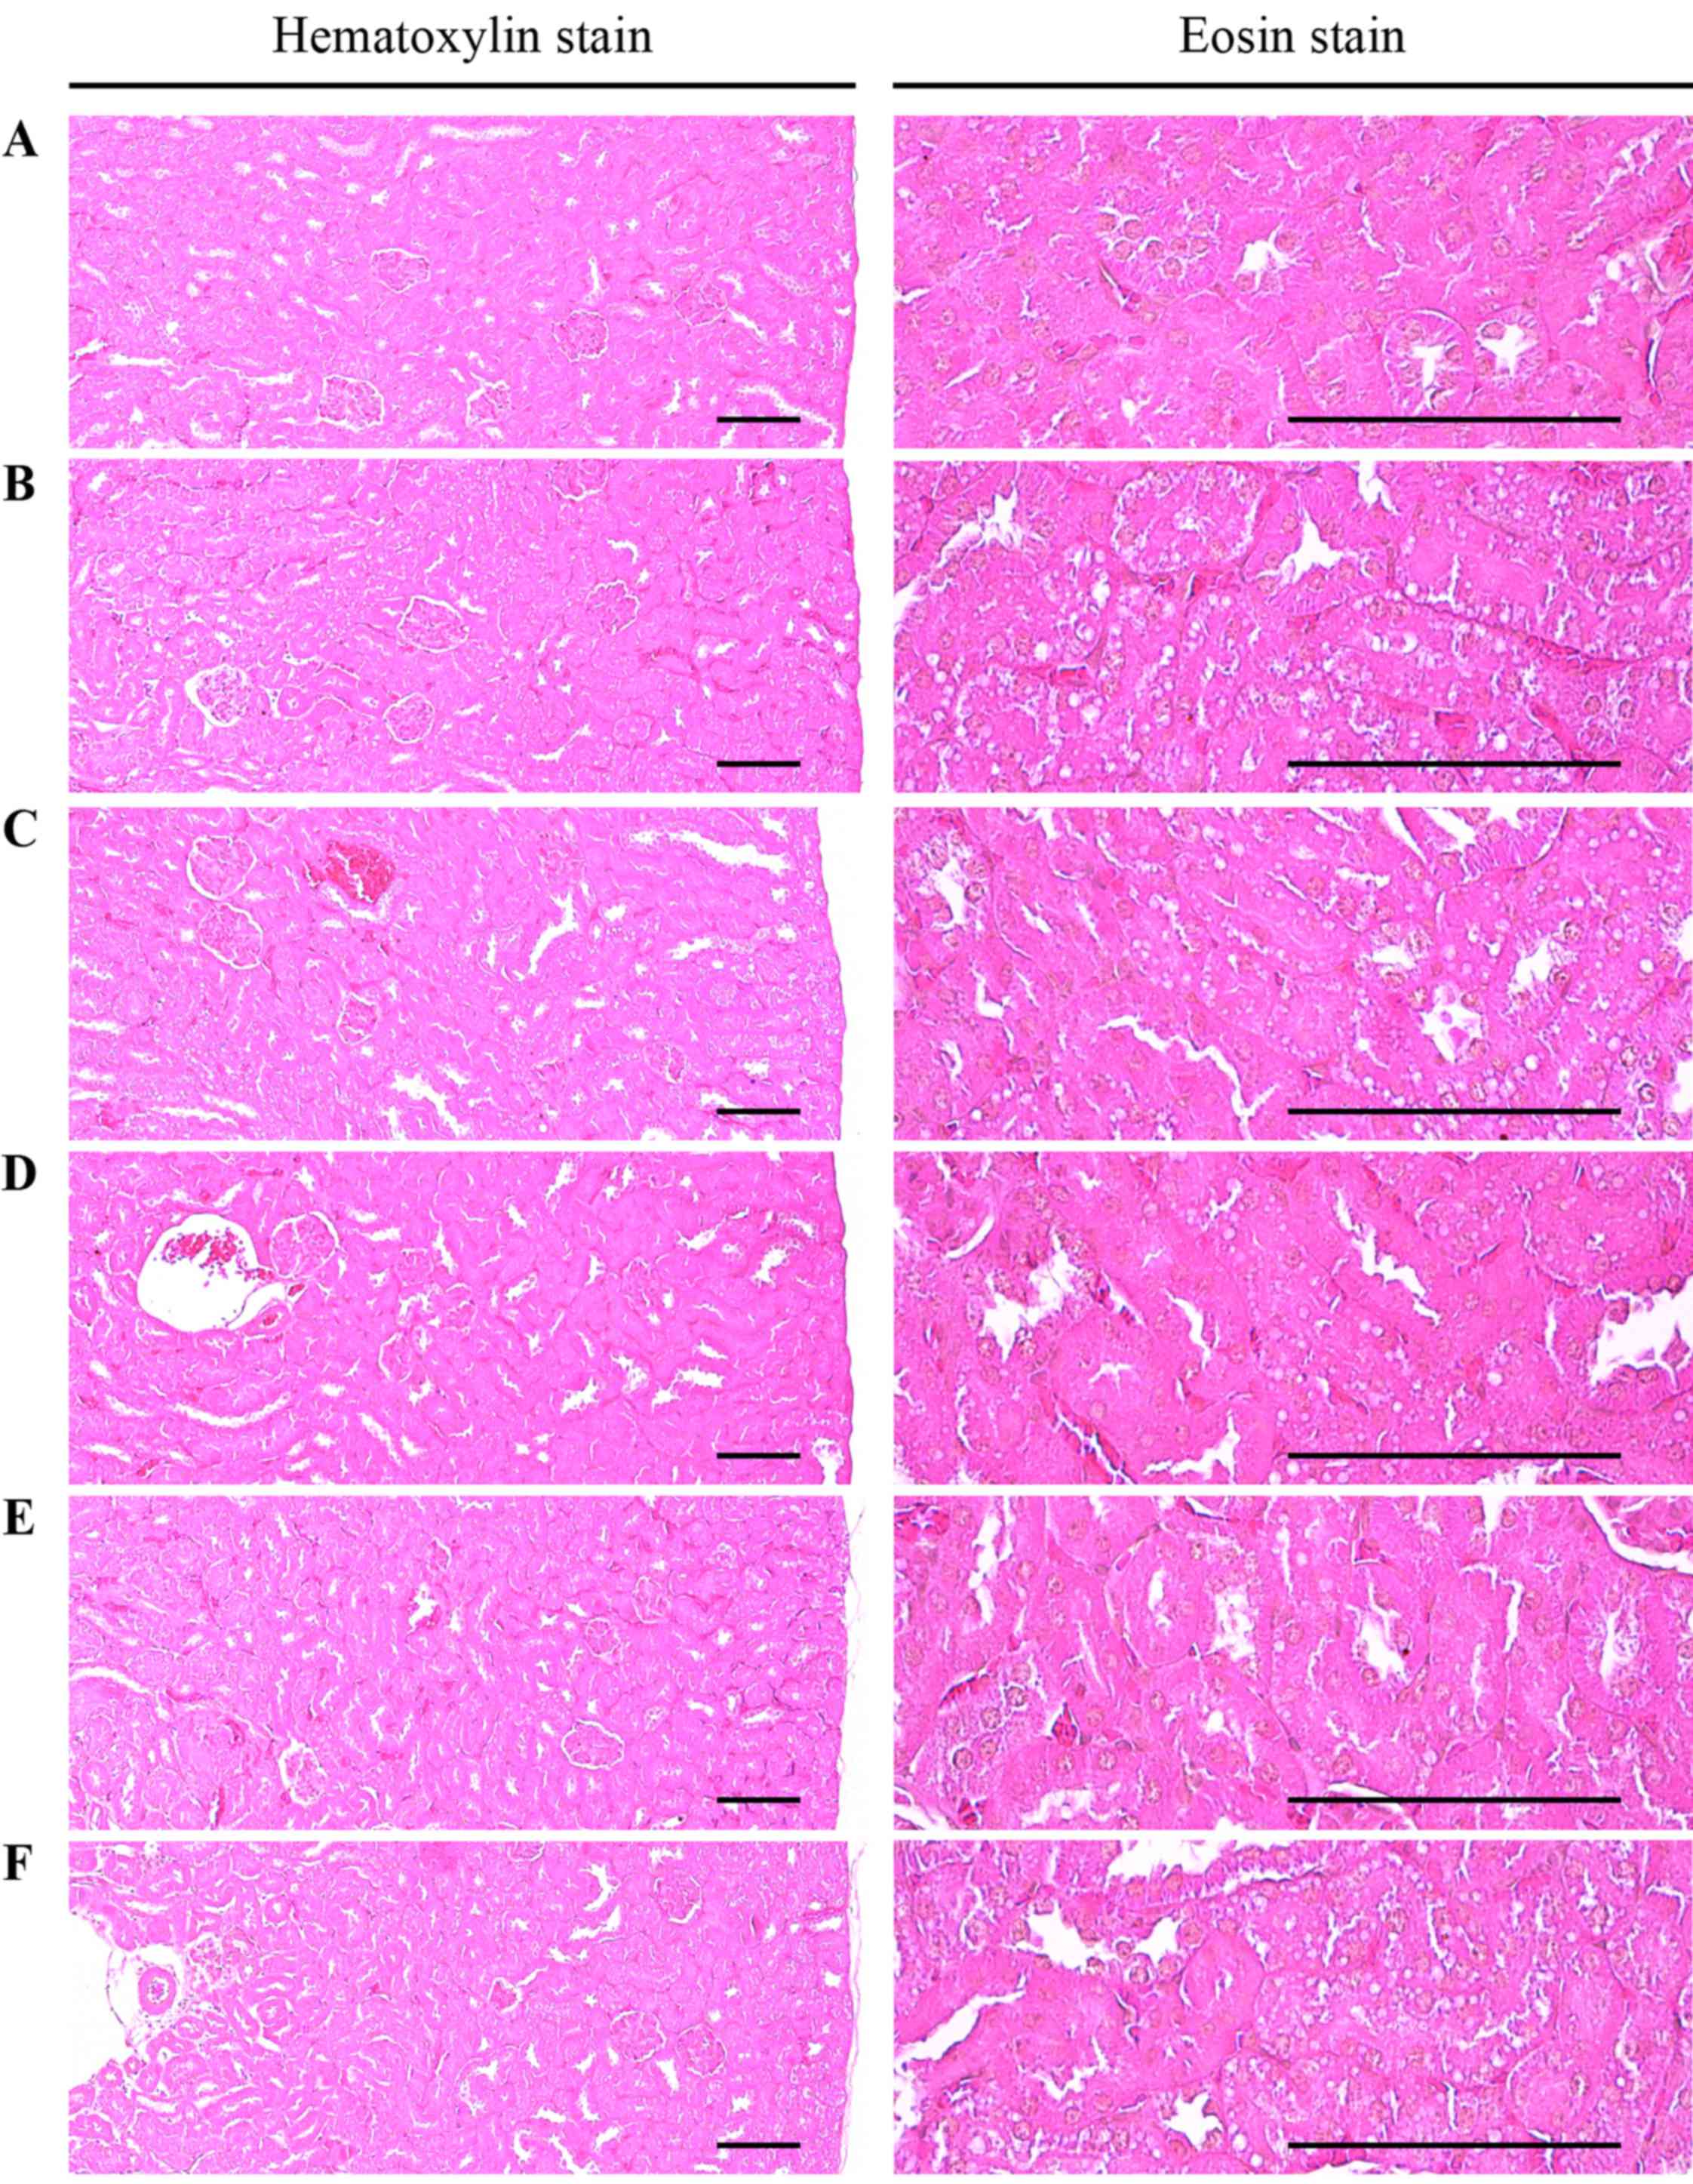 | Figure 5Histological images of the kidney
revealed that significant increases in degenerative vacuolated
renal tubules were detected in the HFD control as compared with the
intact control, resulting from lipid droplet deposited diabetic
nephropathies; however, these diabetic nephropathies were
significantly normalized by treatment with all test materials as
compared with the HFD control, in our experiment. (A) Intact
control: mice supplied normal pellet diet (vehicle control mice);
mice administered 10 ml/kg of distilled water orally. (B) HFD
control: mice administered 10 ml/kg of distilled water orally with
HFD supply. (C) Metformin, mice administered 250 mg/kg of metformin
orally with HFD supply. (D) MPh 500, mice administered 500 mg/kg of
MPh orally with HFD supply. (E) MPh 250, mice administered 250
mg/kg of MPh orally with HFD supply. (F) MPh 125, mice administered
125 mg/kg of MPh orally with HFD supply. HFD, 45% kcal high-fat
diet; MPh, melanian snail (Semisulcospira libertina) protein
hydrolysates, test material. All images show hematoxylin and eosin
staining. Scale bars, 80 µm. |
Effects on the antioxidant system of the
liver
Effects on liver lipid
peroxidation
A significant (p<0.01) increase in liver lipid
peroxidation and the elevation of hepatic MDA content was noted in
the HFD controls compared with the intact controls; however, these
increases were significantly (p<0.01) normalized by treatment
with all test agents, including MPh at 125 mg/kg, compared with the
HFD controls (Table VIII).
| Table VIIIChanges in liver lipid peroxidation
and antioxidant defense systems in mice with type II diabetes. |
Table VIII
Changes in liver lipid peroxidation
and antioxidant defense systems in mice with type II diabetes.
| Group | Lipid peroxidation
| Antioxidant defense
system
|
|---|
| Malondialdehyde
(nM/mg tissue) | Glutathione
(µM/mg tissue) | Catalase (U/mg
tissue) | SOD (U/mg
tissue) |
|---|
| Controls | | | | |
| Intact | 11.93±1.66 | 37.49±8.75 | 32.58±7.24 | 3.47±0.85 |
| HFD | 32.31±6.27a | 10.38±1.29c | 9.94±2.65c | 0.82±0.09c |
| Reference | | | | |
| Metformin | 24.58±5.28a,b | 18.44±2.95c,e | 16.90±1.61c,e | 1.71±0.52c,e |
| MPh-treated | | | | |
| 500 mg/kg | 15.56±3.06b | 28.67±5.68d,e | 23.69±4.11d,e | 2.20±0.39c,e |
| 250 mg/kg | 17.98±1.61a,b | 23.85±3.93c,e | 19.71±1.89c,e | 2.02±0.21c,e |
| 125 mg/kg | 23.32±5.01a,b | 19.84±3.49c,e | 17.13±3.00c,e | 1.78±0.34c,e |
Effects on the GSH contents and on
hepatic CAT and SOD activities
A significant (p<0.01) decrease in the
hepatic GSH content, and CAT and SOD enzymatic activity, as
representative endogenous antioxidants, was observed in the HFD
control mice compared with the intact controls. However, the
hepatic GSH content was significantly (p<0.01) increased in all
test agent-treated HFD mice (Table
VIII). In addition, the decreases in hepatic CAT and SOD
activities were significantly (p<0.01) normalized by treatment
with all test agents (Table
III).
Discussion
Diabetes mellitus is a major human health concern
due to its increasing prevalence, debilitating complications and
chronic course (44). The
inhibition of oxidative stress and postprandial hyperglycemia are
considered important for the treatment of diabetes (40,44). There has been a great deal of
research aiming to identify safe and effective α-glucosidase
inhibitors and antioxidants from natural materials to develop
compounds or physiological functional foods for the treatment of
diabetes (10,11,25,26,40). The present study was performed to
examine the pharmacological activities of MPh in mice fed a HFD,
leading to mild diabetes and obesity (25,28,45,46). Metformin, a representative
anti-diabetic drug used in the treatment of type II diabetes
(47,48), was used as a potent reference
agent.
HFD-fed animals exhibit mild obesity and
hyperglycemia; therefore, models using these animals are
appropriate for the development of preventive agents for metabolic
syndromes (48). In the present
study, the HFD control mice exhibited a significant increase in
body weight as compared to the intact mice 1 week after the
commencement of HFD feeding; accordingly, body weight gains during
the 7-day HFD adaptation period and 84-day administration period
were also significantly increased compared with the intact
controls. However, these increases in body weight were
significantly and dose-dependently inhibited by treatment with MPh
at 125, 250 and 500 mg/kg, and also by metformin at 250 mg/kg.
The energy content of the HFD (4.73 kcal/kg) was
much higher (approximately 20-fold) (Table I) than that of the normal diet
(0.21 kcal/g); hence, the decrease in mean daily food consumption
observed in all the diabetic mice compared with the intact controls
was considered not to be a critical issue. A similar decrease has
previously been reported in the daily food consumption of HFD-fed
mice (26,40). In the present study, no
significant changes in the levels of mean daily food consumption
were detected in any of the test agent-administered groups compared
with the HFD controls, suggesting that the pharmacological effects
of the test agents detected in this study were unlikely to have
been due to the inhibition of food consumption.
Marked increases in blood glucose, insulin and HbA1c
levels, together with increases in insulin- and
glucagon-immunoreactive cells, pancreatic islet numbers and
diameters, and the insulin/glucagon cell ratio upon
histopathological observation, were detected in the HFD control
mice compared with the intact controls, similar to the insulin
resistance observed in type II diabetes. However, all three doses
of MPh effectively and dose-dependently inhibited these increases
in insulin, HbA1c content and blood glucose levels, as well as
abnormal endocrine histopathological changes in the pancreas
(Table IV and Fig. 1). HbA1c is a form of hemoglobin
that is measured primarily to identify the average plasma glucose
concentration over prolonged periods, and is produced by
erythrocytes with long-term exposure to high levels of glucose
(49,50). It has been reported that the
hyperglycemia, a main sign of diabetes, should be controlled to
treat the disease (25,26,40,51). The HFD-fed mouse has been used as
an animal model of type II diabetes and also exhibits noticeable
hyperglycemia (25,26,45,46,52). Long-term HFD feeding revealed the
characteristics of type II diabetes, altered Hb1Ac levels and
marked elevations in the blood (27,28). In addition, increased insulin
secretion is related to pancreatic islet hyperplasia commensurate
with the progression of insulin resistance caused by HFD feeding
(53–55). In previous studies,
insulin-producing cells and total pancreatic islet numbers were
increased after chronic consumption of HFD, with the islets
increasing in area and number to secrete more insulin for
maintenance of glucose homeostasis (56), followed by noticeable hypertrophy
or hyperplasia of endocrine pancreas cells (53–56). These findings directly indicate
that MPh exerts obvious hypoglycemic effects in mice, possibly
through the inhibition of pancreatic endocrine changes.
Hyperlipidemia also generally occurs with the
chronic progression of diabetes in HFD-fed mice (44). As the most critical issues in
hyperlipidemia are the increases in serum TG, TC and LDL levels
with decreased HDL levels (25,26,57) the efficacy of hypolipidemic agents
is generally evaluated based on decreases in serum TC, TG and LDL
along with increases in HDL levels (25,26,40,58). In the present study, all doses of
MPh effectively and dose-dependently decreased the serum TC, LDL
and TG levels, while increasing serum HDL levels compared with the
HFD control mice, suggesting that MPh exerts favorable
hypolipidemic effects on HFD-fed mice. In particular, in this
study, MPh at 125 mg/kg exerted hypolip-idemic effects comparable
to those of metformin at 250 mg/kg on HFD-fed mice. In addition, it
has been reported that HFD feeding results in the development of
acinar cell atrophy, pancreatic steatosis and a decrease in the
number of zymogen granules (40,59,60). Increases in the numbers f zymogen
granules in exocrine pancreatic acinar cells indicate the
production of digestive enzymes, particularly for digestion of
proteins and lipids (61). In the
present study, a reduction in the number of pancreatic zymogen
granules was also detected histopathologically in the HFD-fed
control group compared with the intact controls. However, these
reductions in zymogen deposition in the exocrine pancreas were
effectively inhibited, in a dose-dependent manner, by metformin at
250 mg/kg and also by treatment with MPh at 125, 250 and 500 mg/kg.
These results may have direct evidence for the anti-hyperlipidemic
effects of MPh in mice, which could be mediated by inhibition of
lipid digestion caused by decrease in pancreatic enzyme release or
production. As we could not completely exclude the possibility that
MPh induced increases in digestive tract motility, further detailed
studies are required to elucidate the precise mechanisms of action
of MPh.
The hepatic enzyme, GK, is related to glucose
homeostasis and its increased expression, which could cause an
increase in blood glucose utilization for energy production or
glycogen storage in the liver, leading to a reduction in blood
glucose levels (62,63). By contrast, the enzymes, PEPCK and
G6pase, are associated with hepatic glucose output and
gluconeogenesis and increases in their activities are correlated
with elevated glucose levels (64,65). Generally, noticeable decreases in
hepatic GK activities, and increases in PEPCK and G6pase
activities, are observed with HFD feeding (27), and were also observed in the HFD
control mice in this study. All three doses of MPh effectively
inhibited HFD-induced hepatic glucose-regulating enzyme activity
changes in a dose-dependent manner. These results were considered
direct evidence that MPh has favorable effects on the activities of
hepatic glucose-regulating enzymes and, by extension, on the
control of blood glucose levels.
With the progression of diabetes, increases in liver
weight due to abnormal glycosylation-related hepatosteatosis,
fibrosis and/or hepatocyte hypertrophic changes were observed, with
elevation of serum ALT and AST levels (26,40,66). These phenomena have been regarded
as diabetic hepatopathy, and were observed previously in HFD-fed
mice (26,67). Improvements in these abnormal
changes have been considered as direct evidence for the improvement
of diabetic hepatopathy (66). In
this study, all three doses of MPh effectively and dose-dependently
decreased diabetic hepatopathy compared with HFD control mice,
suggesting that they had favorable hepatoprotective effects. In
addition, increases in kidney weight due to inflammation, necrotic
processes and swelling were observed with the elevation of
creatinine and serum BUN levels in chronic diabetes. The
attenuation of these abnormal changes are considered as direct
evidence of the amelioration of diabetic nephropathy (26,40). In this study, HFD-fed mice
exhibited a marked increase in absolute kidney weight, elevated
creatinine and serum BUN levels, and lipid droplet
deposition-related renal tubule vacuolation upon histopathological
observations. This suggests mild diabetic nephropathy; however,
these levels were normalized by treatment with metformin and all
three doses of MPh, representing direct evidence of the favorable
nephroprotective effects of these agents.
There is considerable evidence of the roles of free
radicals in altered antioxidant defenses in diabetes and the
etiology of diabetes (68).
Oxidative stress has been reported to play an important role in
diabetes mellitus. The generation of free radicals by hyperglycemia
is related to glucose autooxidation. Glucose autooxidation has been
linked to non-enzymatic glycosylation, and glycosylated proteins
have been reported to be a source of free radicals [reactive oxygen
species (ROS)] (40,69). In addition, various toxic products
of lipid peroxidation damage the surrounding tissues (70). Elevated lipid peroxidation,
observed in various organs in HFD-fed mice, also acts as a potent
redox cycler by generating harmful ROS and causing organ damage
(71,72). Oxidative stress in diabetes
co-exists with a decrease in the antioxidant status (73), which can increase the deleterious
effects of free radicals. The generation of ROS-related oxidative
stress also plays an important role in the etiology of diabetic
complications (74). Therefore,
the endogenous antioxidant content, the degree of lipid
peroxidation, GSH and activities of the antioxidative enzymes, CAT
and SOD, in the liver tissue are of secondary importance to improve
diabetes and various related complications (75,76). GSH is a representative endogenous
antioxidant that prevents tissue damage by maintaining ROS at low
levels (at certain cellular concentrations), and is accepted as a
protective endogenous antioxidant factor in tissues (77). CAT is an enzyme that catalyzes the
conversion of H2O2 to H2O and SOD is an
antioxidant enzyme that contributes to enzymatic defense mechanisms
(78). The depletion of GSH
content, the marked elevation of hepatic lipid peroxidation and
decreases in CAT and SOD activities were noted in HFD controls in
the present study (25,79). However, MPh at 125, 250 and 500
mg/kg dose-dependently and effectively inhibited the deterioration
of hepatic antioxidant defense systems compared with the HFD
control mice, suggesting favorable antioxidant effects of MPh in
mice.
In this study, MPh exerted potent anti-diabetic and
ameliorating effects on mice with diabetic complications, through
the increased modulation of antioxidant defense systems, hepatic
glucose-regulating enzyme activities and pancreatic lipid digestion
enzymes. The overall effects of MPh at 125 mg/kg on HFD-induced
diabetes and related complications were similar or more potent than
those of metformin at 250 mg/kg. Therefore, MPh is a promising,
potent and novel medicinal food or ingredient for the treatment of
type II diabetes and its related complications.
Acknowledgments
This study was a component of the project (no.
20130285) entitled 'Development of high value material and
bioactive components from freshwater fish', funded by the Ministry
of Oceans and Fisheries, Republic of Korea.
References
|
1
|
James PT, Leach R, Kalamara E and Shayeghi
M: The worldwide obesity epidemic. Obes Res. 9(Suppl 4): 228S–233S.
2001. View Article : Google Scholar : PubMed/NCBI
|
|
2
|
Ahmadian M, Wang Y and Sul HS: Lipolysis
in adipocytes. Int J Biochem Cell Biol. 42:555–559. 2010.
View Article : Google Scholar
|
|
3
|
Zimmet P: The burden of type 2 diabetes:
are we doing enough? Diabetes Metab. 29:6S9–18. 2003. View Article : Google Scholar
|
|
4
|
Lafontan M and Langin D: Lipolysis and
lipid mobilization in human adipose tissue. Prog Lipid Res.
48:275–297. 2009. View Article : Google Scholar : PubMed/NCBI
|
|
5
|
Lebovitz HE: Insulin resistance:
Definition and consequences. Exp Clin Endocrinol Diabetes.
109(Suppl 2): S135–S148. 2001. View Article : Google Scholar : PubMed/NCBI
|
|
6
|
Goldstein BJ: Insulin resistance as the
core defect in type 2 diabetes mellitus. Am J Cardiol. 90:3G–10G.
2002. View Article : Google Scholar : PubMed/NCBI
|
|
7
|
Angulo P: Nonalcoholic fatty liver
disease. N Engl J Med. 346:1221–1231. 2002. View Article : Google Scholar : PubMed/NCBI
|
|
8
|
Kadowaki T and Yamauchi T: Adiponectin and
adiponectin receptors. Endocr Rev. 26:439–451. 2005. View Article : Google Scholar : PubMed/NCBI
|
|
9
|
Chen H, Qu Z, Fu L, Dong P and Zhang X:
Physicochemical properties and antioxidant capacity of 3
polysaccharides from green tea, oolong tea, and black tea. J Food
Sci. 74:C469–C474. 2009. View Article : Google Scholar : PubMed/NCBI
|
|
10
|
Hays NP, Galassetti PR and Coker RH:
Prevention and treatment of type 2 diabetes: Current role of
lifestyle, natural product, and pharmacological interventions.
Pharmacol Ther. 118:181–191. 2008. View Article : Google Scholar : PubMed/NCBI
|
|
11
|
Kwon YI, Apostolidis E and Shetty K: In
vitro studies of eggplant (Solanum melongena) phenolics as
inhibitors of key enzymes relevant for type 2 diabetes and
hypertension. Bioresour Technol. 99:2981–2988. 2008. View Article : Google Scholar
|
|
12
|
Davidson MB and Peters AL: An overview of
metformin in the treatment of type 2 diabetes mellitus. Am J Med.
102:99–110. 1997. View Article : Google Scholar : PubMed/NCBI
|
|
13
|
Khurana R and Malik IS: Metformin: Safety
in cardiac patients. Heart. 96:99–102. 2010.
|
|
14
|
Manninen AH: Protein hydrolysates in
sports nutrition. Nutr Metab (Lond). 6:382009. View Article : Google Scholar
|
|
15
|
Nesse KO, Nagalakshmi AP, Marimuthu P and
Singh M: Efficacy of a fish protein hydrolysate in malnourished
children. Indian J Clin Biochem. 26:360–365. 2011. View Article : Google Scholar :
|
|
16
|
López-Barrios L, Gutiérrez-Uribe JA and
Serna-Saldívar SO: Bioactive peptides and hydrolysates from pulses
and their potential use as functional ingredients. J Food Sci.
79:R273–R283. 2014. View Article : Google Scholar : PubMed/NCBI
|
|
17
|
Ryan JT, Ross RP, Bolton D, Fitzgerald GF
and Stanton C: Bioactive peptides from muscle sources: Meat and
fish. Nutrients. 3:765–791. 2011. View Article : Google Scholar
|
|
18
|
Kim KM, Chang UJ, Kang DH, Kim JM, Choi YM
and Suh HJ: Yeast hydrolysate reduces body fat of dietary obese
rats. Phytother Res. 18:950–953. 2004. View Article : Google Scholar : PubMed/NCBI
|
|
19
|
Wergedahl H, Gudbrandsen OA, Røst TH and
Berge RK: Combination of fish oil and fish protein hydrolysate
reduces the plasma cholesterol level with a concurrent increase in
hepatic cholesterol level in high-fat-fed Wistar rats. Nutrition.
25:98–104. 2009. View Article : Google Scholar
|
|
20
|
Liu X, Zhang M, Zhang C and Liu C:
Angiotensin converting enzyme (ACE) inhibitory, antihypertensive
and antihyperlipidaemic activities of protein hydrolysates from
Rhopilema esculentum. Food Chem. 134:2134–2140. 2012. View Article : Google Scholar
|
|
21
|
Mun JM, Ok HM and Kwon O: Corn gluten
hydrolysate and capsaicin have complimentary actions on body weight
reduction and lipid-related genes in diet-induced obese rats. Nutr
Res. 34:458–465. 2014. View Article : Google Scholar : PubMed/NCBI
|
|
22
|
Yokogawa S, Cort WW and Yokogawa M:
Paragonimus and paragonimiasis. Exp Parasitol. 10:81–137. 1960.
View Article : Google Scholar : PubMed/NCBI
|
|
23
|
Yokogawa S, Cort WW and Yokogawa M:
Paragonimus and paragonimiasis. Exp Parasitol. 10:139–205. 1960.
View Article : Google Scholar : PubMed/NCBI
|
|
24
|
Park GM, Kim JJ, Chung PR, Wang Y and Min
DY: Karyotypes on three species of Chinese mesogastropod snails,
Semisulcospira libertina, S. dolichostoma and Viviparus rivularis.
Korean J Parasitol. 37:5–11. 1999. View Article : Google Scholar : PubMed/NCBI
|
|
25
|
Jung YM, Lee SH, Lee DS, You MJ, Chung IK,
Cheon WH, Kwon YS, Lee YJ and Ku SK: Fermented garlic protects
diabetic, obese mice when fed a high-fat diet by antioxidant
effects. Nutr Res. 31:387–396. 2011. View Article : Google Scholar : PubMed/NCBI
|
|
26
|
Kim CM, Yi SJ, Cho IJ and Ku SK: Red-koji
fermented red ginseng ameliorates high fat diet-induced metabolic
disorders in mice. Nutrients. 5:4316–4332. 2013. View Article : Google Scholar : PubMed/NCBI
|
|
27
|
Chung SI, Rico CW and Kang MY: Comparative
study on the hypoglycemic and antioxidative effects of fermented
paste (doenjang) prepared from soybean and brown rice mixed with
rice bran or red ginseng marc in mice fed with high fat diet.
Nutrients. 6:4610–4624. 2014. View Article : Google Scholar : PubMed/NCBI
|
|
28
|
Kim UH, Yoon JH, Li H, Kang JH, Ji HS,
Park KH, Shin DH, Park HY and Jeong TS: Pterocarpan-enriched soy
leaf extract ameliorates insulin sensitivity and pancreatic β-cell
proliferation in type 2 diabetic mice. Molecules. 19:18493–18510.
2014. View Article : Google Scholar : PubMed/NCBI
|
|
29
|
Kavutcu M, Canbolat O, Oztürk S, Olcay E,
Ulutepe S, Ekinci C, Gökhun IH and Durak I: Reduced enzymatic
antioxidant defense mechanism in kidney tissues from
gentamicin-treated guinea pigs: Effects of vitamins E and C.
Nephron. 72:269–274. 1996. View Article : Google Scholar : PubMed/NCBI
|
|
30
|
Jamall IS and Smith JC: Effects of cadmium
on glutathione peroxidase, superoxide dismutase, and lipid
peroxidation in the rat heart: A possible mechanism of cadmium
cardiotoxicity. Toxicol Appl Pharmacol. 80:33–42. 1985. View Article : Google Scholar : PubMed/NCBI
|
|
31
|
Lowry OH, Rosebrough NJ, Farr AL and
Randall RJ: Protein measurement with the Folin phenol reagent. J
Biol Chem. 193:265–275. 1951.PubMed/NCBI
|
|
32
|
Sedlak J and Lindsay RH: Estimation of
total, protein-bound, and nonprotein sulfhydryl groups in tissue
with Ellman's reagent. Anal Biochem. 25:192–205. 1968. View Article : Google Scholar : PubMed/NCBI
|
|
33
|
Aebi H: Catalase. Methods in Enzymatic
Analysis. Bergmeyer HU: Academic Press; New York: pp. 673–686.
1974, View Article : Google Scholar
|
|
34
|
Sun Y, Oberley LW and Li Y: A simple
method for clinical assay of superoxide dismutase. Clin Chem.
34:497–500. 1988.PubMed/NCBI
|
|
35
|
Hulcher FH and Oleson WH: Simplified
spectrophotometric assay for microsomal 3-hydroxy-3-methylglutaryl
CoA reductase by measurement of coenzyme A. J Lipid Res.
14:625–631. 1973.PubMed/NCBI
|
|
36
|
Davidson AL and Arion WJ: Factors
underlying significant underestimations of glucokinase activity in
crude liver extracts: Physiological implications of higher cellular
activity. Arch Biochem Biophys. 253:156–167. 1987. View Article : Google Scholar : PubMed/NCBI
|
|
37
|
Alegre M, Ciudad CJ, Fillat C and
Guinovart JJ: Determination of glucose-6-phosphatase activity using
the glucose dehydrogenase-coupled reaction. Anal Biochem.
173:185–189. 1988. View Article : Google Scholar : PubMed/NCBI
|
|
38
|
Bentle LA and Lardy HA: Interaction of
anions and divalent metal ions with phosphoenolpyruvate
carboxykinase. J Biol Chem. 251:2916–2921. 1976.PubMed/NCBI
|
|
39
|
Kawakami S, Han KH, Nakamura Y, Shimada K,
Kitano T, Aritsuka T, Nagura T, Ohba K, Nakamura K and Fukushima M:
Effects of dietary supplementation with betaine on a nonalcoholic
steatohepatitis (NASH) mouse model. J Nutr Sci Vitaminol (Tokyo).
58:371–375. 2012. View Article : Google Scholar
|
|
40
|
Kang SJ, Lee JE, Lee EK, Jung DH, Song CH,
Park SJ, Choi SH, Han CH, Ku SK and Lee YJ: Fermentation with
Aquilariae Lignum enhances the anti-diabetic activity of green tea
in type II diabetic db/db mouse. Nutrients. 6:3536–3571. 2014.
View Article : Google Scholar : PubMed/NCBI
|
|
41
|
Lee HS, Chang JH and Ku SK: An
immunohistochemical study of the pancreatic endocrine cells of the
ddN mouse. Folia Histochem Cytobiol. 48:387–393. 2010. View Article : Google Scholar : PubMed/NCBI
|
|
42
|
Levene A: Pathological factors influencing
excision of tumours in the head and neck. Part I. Clin Otolaryngol
Allied Sci. 6:145–151. 1981. View Article : Google Scholar : PubMed/NCBI
|
|
43
|
Ludbrook J: Update: Microcomputer
statistics packages. A personal view. Clin Exp Pharmacol Physiol.
24:294–296. 1997. View Article : Google Scholar : PubMed/NCBI
|
|
44
|
Chen X, Osborne MC, Rybczynski PJ, Zeck R,
Yang M, Xu J, Zhou L, Cryan E, Tang Y and Demarest KT:
Pharmacological profile of a novel, non-TZD PPARgamma agonist.
Diabetes Obes Metab. 7:536–546. 2005. View Article : Google Scholar : PubMed/NCBI
|
|
45
|
Yun SN, Moon SJ, Ko SK, Im BO and Chung
SH: Wild ginseng prevents the onset of high-fat diet induced
hyperglycemia and obesity in ICR mice. Arch Pharm Res. 27:790–796.
2004. View Article : Google Scholar : PubMed/NCBI
|
|
46
|
Lee JW, Lee KW, Lee SW, Kim IH and Rhee C:
Selective increase in pinolenic acid (all-cis-5,9,12,18,3) in
Korean pine nut oil by crystallization and its effect on
LDL-receptor activity. Lipids. 39:383–387. 2004. View Article : Google Scholar : PubMed/NCBI
|
|
47
|
Seufert J, Lübben G, Dietrich K and Bates
PC: A comparison of the effects of thiazolidinediones and metformin
on metabolic control in patients with type 2 diabetes mellitus.
Clin Ther. 26:805–818. 2004. View Article : Google Scholar : PubMed/NCBI
|
|
48
|
Park SH, Ko SK and Chung SH: Euonymus
alatus prevents the hyperglycemia and hyperlipidemia induced by
high-fat diet in ICR mice. J Ethnopharmacol. 102:326–335. 2005.
View Article : Google Scholar : PubMed/NCBI
|
|
49
|
Bookchin RM and Gallop PM: Structure of
hemoglobin AIc: Nature of the N-terminal beta chain blocking group.
Biochem Biophys Res Commun. 32:86–93. 1968. View Article : Google Scholar : PubMed/NCBI
|
|
50
|
Larsen ML, Hørder M and Mogensen EF:
Effect of long-term monitoring of glycosylated hemoglobin levels in
insulin-dependent diabetes mellitus. N Engl J Med. 323:1021–1025.
1990. View Article : Google Scholar : PubMed/NCBI
|
|
51
|
Sathishsekar D and Subramanian S:
Beneficial effects of Momordica charantia seeds in the treatment of
STZ-induced diabetes in experimental rats. Biol Pharm Bull.
28:978–983. 2005. View Article : Google Scholar : PubMed/NCBI
|
|
52
|
Surwit RS, Kuhn CM, Cochrane C, McCubbin
JA and Feinglos MN: Diet-induced type II diabetes in C57BL/6J mice.
Diabetes. 37:1163–1167. 1988. View Article : Google Scholar : PubMed/NCBI
|
|
53
|
Milburn JL Jr, Hirose H, Lee YH, Nagasawa
Y, Ogawa A, Ohneda M, BeltrandelRio H, Newgard CB, Johnson JH and
Unger RH: Pancreatic beta-cells in obesity. Evidence for induction
of functional, morphologic, and metabolic abnormalities by
increased long chain fatty acids. J Biol Chem. 270:1295–1299. 1995.
View Article : Google Scholar : PubMed/NCBI
|
|
54
|
Jia D, Yamamoto M, Otani M and Otsuki M:
Bezafibrate on lipids and glucose metabolism in obese diabetic
Otsuka Long-Evans Tokushima fatty rats. Metabolism. 53:405–413.
2004. View Article : Google Scholar : PubMed/NCBI
|
|
55
|
Terauchi Y, Takamoto I, Kubota N, Matsui
J, Suzuki R, Komeda K, Hara A, Toyoda Y, Miwa I, Aizawa S, et al:
Glucokinase and IRS-2 are required for compensatory beta cell
hyperplasia in response to high-fat diet-induced insulin
resistance. J Clin Invest. 117:246–257. 2007. View Article : Google Scholar : PubMed/NCBI
|
|
56
|
Noriega-López L, Tovar AR,
Gonzalez-Granillo M, Hernández-Pando R, Escalante B,
Santillán-Doherty P and Torres N: Pancreatic insulin secretion in
rats fed a soy protein high fat diet depends on the interaction
between the amino acid pattern and isoflavones. J Biol Chem.
282:20657–20666. 2007. View Article : Google Scholar : PubMed/NCBI
|
|
57
|
Kamada T, Hata J, Kusunoki H, Ito M,
Tanaka S, Kawamura Y, Chayama K and Haruma K: Eradication of
Helicobacter pylori increases the incidence of hyperlipidaemia and
obesity in peptic ulcer patients. Dig Liver Dis. 37:39–43. 2005.
View Article : Google Scholar : PubMed/NCBI
|
|
58
|
Zdrenghea D, Gligor E, Ossian V and Pop D:
The effect of simvastatin associated with ranitidine and alcohol
upon serum lipids. Rom J Intern Med. 42:143–148. 2004.PubMed/NCBI
|
|
59
|
Tasso F, Clop J and Sarles H: The
interaction of ethanol, dietary lipids and proteins on the rat
pancreas. II. Ultrastructural study. Digestion. 4:23–34. 1971.
View Article : Google Scholar : PubMed/NCBI
|
|
60
|
Wilson JS, Korsten MA, Leo MA and Lieber
CS: Combined effects of protein deficiency and chronic ethanol
consumption on rat pancreas. Dig Dis Sci. 33:1250–1259. 1988.
View Article : Google Scholar : PubMed/NCBI
|
|
61
|
Gartner LP and Hiatt JL: Color Textbook of
Histology. 3rd edition. Saunders; Philadelphia: pp. 417–422.
2007
|
|
62
|
Ferre T, Riu E, Bosch F and Valera A:
Evidence from transgenic mice that glucokinase is rate limiting for
glucose utilization in the liver. FASEB J. 10:1213–1218.
1996.PubMed/NCBI
|
|
63
|
Coope GJ, Atkinson AM, Allott C,
McKerrecher D, Johnstone C, Pike KG, Holme PC, Vertigan H, Gill D,
Coghlan MP, et al: Predictive blood glucose lowering efficacy by
Glucokinase activators in high fat fed female Zucker rats. Br J
Pharmacol. 149:328–335. 2006. View Article : Google Scholar : PubMed/NCBI
|
|
64
|
She P, Shiota M, Shelton KD, Chalkley R,
Postic C and Magnuson MA: Phosphoenolpyruvate carboxykinase is
necessary for the integration of hepatic energy metabolism. Mol
Cell Biol. 20:6508–6517. 2000. View Article : Google Scholar : PubMed/NCBI
|
|
65
|
van Schaftingen E and Gerin I: The
glucose-6-phosphatase system. Biochem J. 362:513–532. 2002.
View Article : Google Scholar : PubMed/NCBI
|
|
66
|
Quine SD and Raghu PS: Effects of
(−)-epicatechin, a flavonoid on lipid peroxidation and antioxidants
in streptozotocin-induced diabetic liver, kidney and heart.
Pharmacol Rep. 57:610–615. 2005.PubMed/NCBI
|
|
67
|
Neves RH, Alencar AC, Aguila MB,
Mandarim-de-Lacerda CA, Machado-Silva JR and Gomes DC: Hepatic
stereology of Schistosomiasis mansoni infected-mice fed a high-fat
diet. Mem Inst Oswaldo Cruz. 101(Suppl 1): 253–260. 2006.
View Article : Google Scholar
|
|
68
|
Garg MC, Singh KP and Bansal DD: Effect of
vitamin C supplementation on oxidative stress in experimental
diabetes. Indian J Exp Biol. 35:264–266. 1997.PubMed/NCBI
|
|
69
|
Ceriello A, Quatraro A and Giugliano D:
New insights on non-enzymatic glycosylation may lead to therapeutic
approaches for the prevention of diabetic complications. Diabet
Med. 9:297–299. 1992. View Article : Google Scholar : PubMed/NCBI
|
|
70
|
Comporti M: Lipid peroxidation and
cellular damage in toxic liver injury. Lab Invest. 53:599–623.
1985.PubMed/NCBI
|
|
71
|
Lee YM, Gweon OC, Seo YJ, Im J, Kang MJ,
Kim MJ and Kim JI: Antioxidant effect of garlic and aged black
garlic in animal model of type 2 diabetes mellitus. Nutr Res Pract.
3:156–161. 2009. View Article : Google Scholar : PubMed/NCBI
|
|
72
|
Jung UJ, Park YB, Kim SR and Choi MS:
Supplementation of persimmon leaf ameliorates hyperglycemia,
dyslipidemia and hepatic fat accumulation in type 2 diabetic mice.
PLoS One. 7:e490302012. View Article : Google Scholar : PubMed/NCBI
|
|
73
|
Collier A, Wilson R, Bradley H, Thomson JA
and Small M: Free radical activity in type 2 diabetes. Diabet Med.
7:27–30. 1990. View Article : Google Scholar : PubMed/NCBI
|
|
74
|
Giugliano D, Ceriello A and Paolisso G:
Oxidative stress and diabetic vascular complications. Diabetes
Care. 19:257–267. 1996. View Article : Google Scholar : PubMed/NCBI
|
|
75
|
Erejuwa OO, Sulaiman SA, Wahab MS, Salam
SK, Salleh MS and Gurtu S: Comparison of antioxidant effects of
honey, glibenclamide, metformin, and their combinations in the
kidneys of streptozotocin-induced diabetic rats. Int J Mol Sci.
12:829–843. 2011. View Article : Google Scholar : PubMed/NCBI
|
|
76
|
Wu D, Wen W, Qi CL, Zhao RX, Lü JH, Zhong
CY and Chen YY: Ameliorative effect of berberine on renal damage in
rats with diabetes induced by high-fat diet and streptozotocin.
Phytomedicine. 19:712–718. 2012. View Article : Google Scholar : PubMed/NCBI
|
|
77
|
Odabasoglu F, Cakir A, Suleyman H, Aslan
A, Bayir Y, Halici M and Kazaz C: Gastroprotective and antioxidant
effects of usnic acid on indomethacin-induced gastric ulcer in
rats. J Ethnopharmacol. 103:59–65. 2006. View Article : Google Scholar
|
|
78
|
Cheeseman KH and Slater TF: An
introduction to free radical biochemistry. Br Med Bull. 49:481–493.
1993. View Article : Google Scholar : PubMed/NCBI
|
|
79
|
Wu D, Zheng N, Qi K, Cheng H, Sun Z, Gao
B, Zhang Y, Pang W, Huangfu C, Ji S, et al: Exogenous hydrogen
sulfide mitigates the fatty liver in obese mice through improving
lipid metabolism and antioxidant potential. Med Gas Res. 5:12015.
View Article : Google Scholar : PubMed/NCBI
|