Introduction
Metabolomics is the youngest of the emerging 'omics'
sciences and along with 'sister' genomics, transcriptomics and
proteomics, comprises a Systems Biology approach with a potential
significant role in personalized medicine (1,2)
While genomics relates to the genotype and metabolomics reflects
the phenotype, recent studies have demonstrated that the
association of genetic polymorphisms and consequent metabolite
changes may provide unique individual genetic and phenotype
information towards personalized medicine, and may reflect
individual responses to lifestyle and epigenetic factors (3,4).
Organic acids (OAs) are a particular group of metabolites, which
have gained increasing scientific interest. Indeed, these organic
compounds are intermediate metabolites of critical metabolic
pathways, such as the Krebs cycle, carbohydrate metabolism, ketone
body metabolism, fatty acid β-oxidation, neurotransmitters turnover
and protein metabolism. The determination of OAs in urine has been
utilized, from the early study by Tanaka and Isselbacher, who
documented the first organic aciduria in 1970 (5). This breakthrough finding was
revolutionarily utilized to detect congenital errors of metabolism
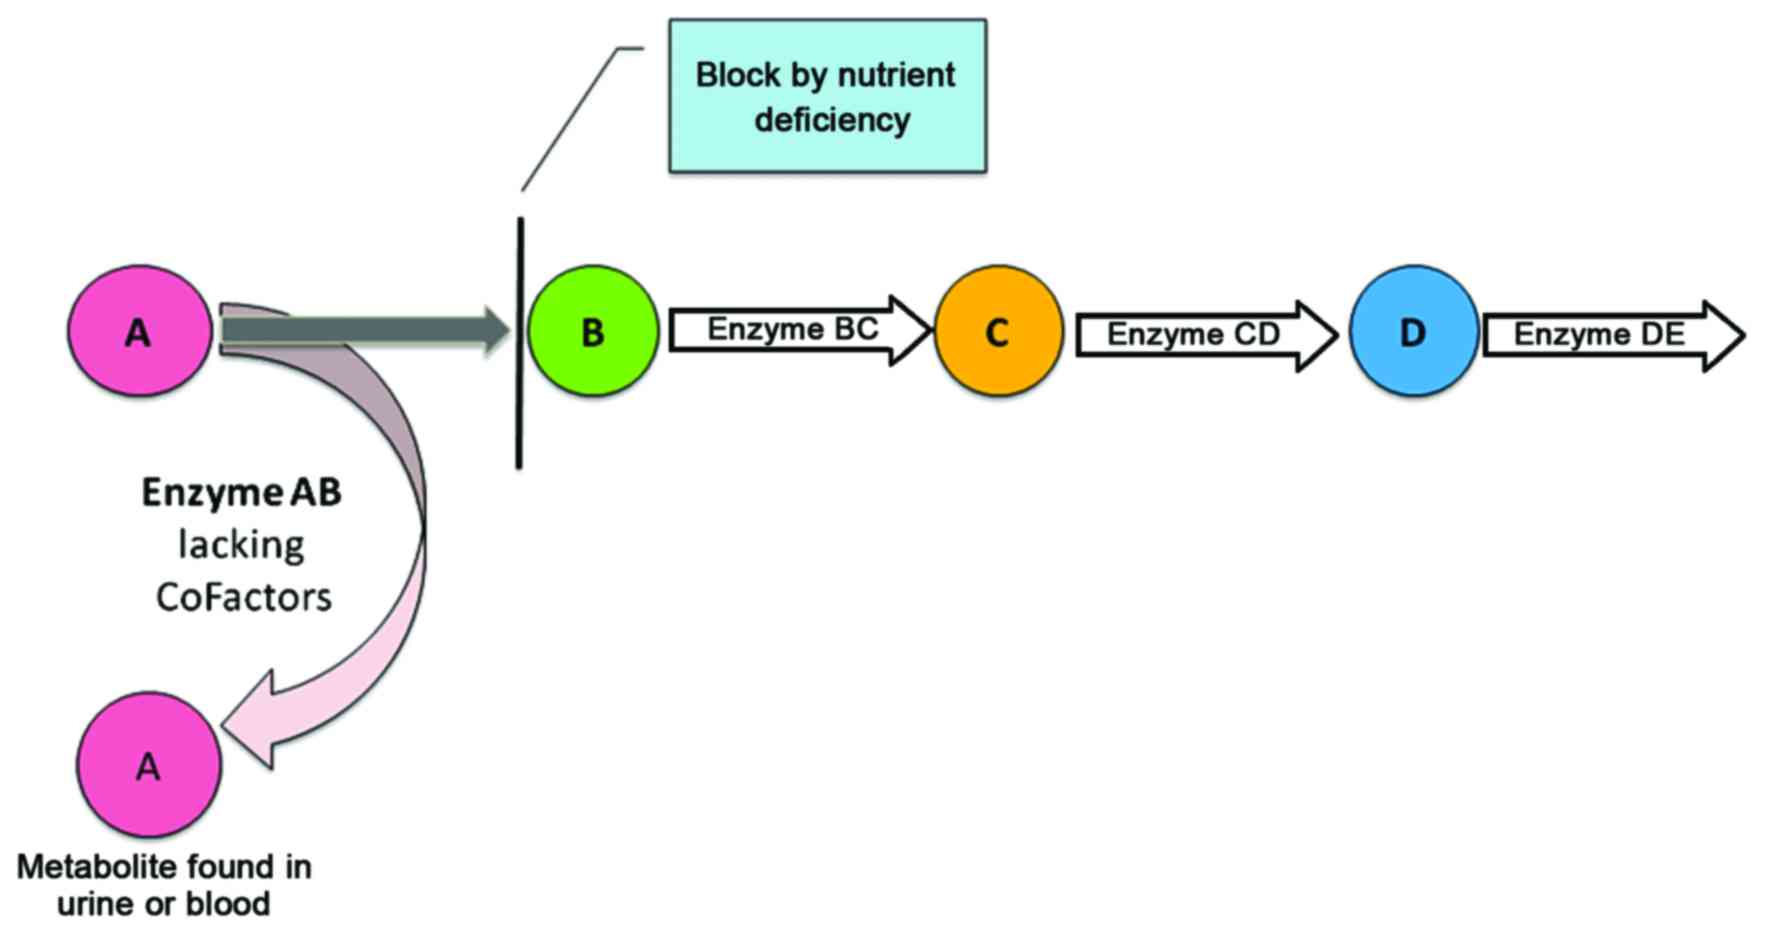
(3,4). The underlying concept in diagnosing
congenital metabolic diseases is that the quantification of OAs and
other metabolites can pinpoint dysfunction or even the absence of
an enzyme due to a genetic defect (Fig. 1). Accordingly, the dysfunctioning
or missing enzyme may cause metabolite accumulation in the related
pathway (6,7). In the early seventies, Horning and
Horning, first described the term metabolic profile (8). Moreover, the research efforts of
Horning's team (8) in parallel
with those of Pauling et al led to the use of gas
chromatography-mass spectrometry (GC-MS) for the quantification of
metabolites in urine (9). This
was the beginning of the use of metabolomics as a personalized
approach in individuals not suffering from congenital metabolic
diseases (10). Further
developments in the field allowed for the quantification of OAs to
become a fast-growing systems biology approach. Thus, in 2004, the
human metabolome project was launched to identify all human
metabolites, and its first version was released in 2007 (11). The metabolome is not only a
simpler and more reflective index of health status, but it also
incorporates environmental influences, for example, from exercise
and diet, according to a Harvard Magazine article (7).
Urine OAs may reflect the activity of main metabolic
pathways, and their quantification can be used to assess health
status, nutritional status, vitamin deficiencies and response to
pharmaceutical interventions, and may even be applied in toxicology
and poisoning (1,7,12).
For instance, urine fumarate and urine malate levels have been
found to be associated with mitochondrial disease with a 5% false
positive rate (13). Given the
fact that metabolomics reflects the phenotype and is sensitive to
genetic, epigenetic and environmental factors, such as diet, age,
lifestyle and xenobiotic exposure, it has been proposed as a useful
tool for the identification of specific pathological conditions by
assessing their influence on phenotype. The concentration of OAs in
urine may vary in different populations due to different
interactions among genetic and phenotypic factors (14). OAs have been widely used to screen
inborn errors of metabolism, where the alterations in metabolite
levels may be a hundred-or a thousand-fold increased in comparison
to those of healthy subjects and this is reflected on the precision
of reference values (RVs) currently used in laboratories (14,15).
To date, a limited number of studies have focused on
the generation of sensitive RVs for a healthy population. Thus, the
aim of the present study was the evaluation of RVs in urine OAs in
a well-defined healthy adult population.
Subjects and methods
Subjects
In this study, 122 Caucasian adults (51 males and 71
females) from Greece were included. The mean age of all the
participants was 42.0±9.6 years with a range of 21–81 years.
Sampling procedures for the patients and healthy controls were
defined according to the ethical guidelines of the Ethics Committee
of the University of Crete (approval no. 1019/18/07_12_2016). The
participants did not exhibit any symptoms of disease, showed normal
results on clinical laboratory tests (hemogram and chemical
constituents) and were not on a restricted diet. At the time of the
analysis, no supplements or medication were taken. Early morning
urine samples were collected and stored at −80°C until analysis.
GC-MS, as previously described by Tanaka et al (16), was used to identify 22 different
OAs (Table I). In brief, OAs were
extracted from urine by liquid-liquid extraction after mixing the
specimen with an internal standard solution. The oxidation of
2-keto acids with hydroxylamine hydrochloride was performed. OAs
were converted to their corresponding trimethylsilyl (TMS) ethers
with N,O,-bis-(trimethylsilyl) trifluoroacetamide
(BSTFA) containing 1% trimethylchlorosilane (TMCS) (both from
Supelco, Bellefonte, PA, USA). The derivatization imparts
volatility to the OAs, which is required for GC-MS analysis. The
OA-TMS ethers were separated in a capillary gas chromatography
column containing an immobilized, non-polar stationary phase.
Following chromatographic separation, OAs were routinely detected
by electron impact mass spectrometry performed in the scan mode
with a mass range between m/z 50 and 550. Identification was
achieved by comparison to published spectra compounds and
quantification by comparison to the calibration of pure standard
compounds in ratio to an internal standard.
 | Table IUrine OA metabolites and their
validated analytical parameters. |
Table I
Urine OA metabolites and their
validated analytical parameters.
| Analyte | Precision (cv%
duplicates) | Linearity | Recovery |
|---|
| 2-OH Glutaric
acid | 4.4 | 1.0 | 101 |
| 3-Methylglutaric
acid | 9.7 | 1.0 | 112 |
| 3-OH-3 methylglutaric
acid | 11.2 | 1.0 | 55 |
| 3-OH Isobutyric | 14.8 | 0.99 | 78 |
| 3-OH Isovaleric | 64.1 | 0.84 | 102 |
| 4-OH Butyric | 12.0 | 1.0 | 63 |
| Adipic acid | 6.4 | 1.0 | 114 |
| Glyceric acid | 9.7 | 1.0 | 79 |
| Ethylmalonic
acid | 5.1 | 1.0 | 100 |
| Fumaric acid | 9.2 | 1.0 | 87 |
| Glutaric acid | 1.2 | 1.0 | 101 |
| Glycolic acid | 13.7 | 0.99 | 86 |
|
Hexanoylglycine | 16.5 | 0.98 | 109 |
| 2-Ketoglutaric
acid | 15.5 | 1.0 | 84 |
| Malic acid | 30.4 | 0.99 | 76 |
| Methylmalonic
acid | 5.0 | 1.0 | 104 |
| Mevalonic acid | 57.6 | 0.92 | 49 |
| Pyroglutamic
acid | 4.5 | 1.0 | 82 |
| Sebacic acid | 7.3 | 1.0 | 105 |
| Suberic acid | 6.5 | 1.0 | 101 |
| Tiglylglycine | 5.8 | 1.0 | 92 |
| Vanilactic
acid | 10.3 | 0.99 | 88 |
Statistical analysis
A list of descriptive statistics for tendency
(means, median, min and max) and dispersion (standard deviation,
standard error of mean, percentiles and interquartile range) were
used for describing the levels of OAs. The physiological values of
OAs were set using 95% confidence intervals of the mean. The
Kolmogorov-Smirov test was applied for examining the data
normality. It has been previously demonstrated that 'normalization
to partial sums' (or similar methods) has better performance as
compared to normalization to creatinine concentration (17). Differences in OA levels between
two or more subgroups were examined using parametric (t-test,
ANOVA) and non-parametric tests (Mann-Whitney, Kruskall-Wallis).
IBM SPSS Statistics 22.0 (IBM SPSS, Armonk, NY, USA) was used for
analysis of the data.
Results
The chemical analysis characteristics (precision,
linearity and recovery) of 22 selected urine OAs are documented in
Table I. To determine the RVs for
each metabolite, the 5% percentile lower limit and 95% percentile
upper limit was defined. In some cases, to achieve a more effective
clinical sensitivity, changes in determining the lower and upper
RVs were applied (18). The
detection limit of the urine OA concentration is 1 μmol/l.
Our study population consisted of 122 volunteers of which 71 were
females (58.2%). The mean age of all the participants was 42.0±9.6
years with a range of 21–81 years. There was no significant
difference in age between the sexes. For analytical purposes and
with respect to age, the participants were divided into 4 groups
(≤30, 30–40, 40–50 and 50+) consisting of 18, 28, 56 and 20
subjects, respectively. Table II
shows the basic descriptive parameters of the analyzed OA urine
levels and the estimated physiological 95% confidence intervals. A
zero concentration was set for 95% lower limit of urine OA
concentration when a negative concentration was estimated. Only 3
of the urine OAs [pimelic acid (Pim), 3-hydroxyglutaric acid (3-OH
Glut) and malic acid (Mal)], showed a positive (non-zero) 95%
percentile lower limit. In Table
III the 5th, 10th, 20th, 25th, 50th (median), 75th, as well as
the 90th percentile of specific metabolites are presented. The mean
levels of OAs over the age groups exhibited no significant
differences (P>0.05) among the females and males (Table IV).
| Table IIThe concentration percentiles for
specific metabolites. |
Table II
The concentration percentiles for
specific metabolites.
| Urine OA
metabolites | Detected
(>LOD) | Mean | SD | Min-Max | Estimated 95%
CI | Known 95% CI | No of cases outside
95% CIa |
|---|
| 5-HIAA | 92.6% | 4.9 | 9.3 | 1.0–61.8 | 0.0–23.4 | 0–7.0 | 4 (13) |
| 3-OH Pr | 96.7% | 8.0 | 8.0 | 1.0–54.4 | 0.0–23.9 | | |
| Pim | 42.6% | 1.8 | 0.8 | 1.0–4.0 | 0.1–3.4 | | |
| EMA | 97.5% | 2.2 | 1.7 | 1.0–10.1 | 0.0–5.5 | 0.4–4.2 | 9 (13) |
| 3-OH Glut | 51.6% | 1.1 | 0.3 | 1.0–2.6 | 0.5–1.6 | 1.0–10.0 | 3 (0) |
| HVA | 92.6% | 2.2 | 1.4 | 1.0–8.7 | 0.0–4.9 | | |
| Glyc | 77.0% | 2.7 | 6.2 | 1.0–44.6 | 0.0–14.9 | 0.0–3.0 | 2 (2) |
| Pyrog | 100.0% | 27.8 | 15.5 | 1.7–103.4 | 0.0–58.6 | | |
| 3-OH Isob | 99.2% | 10.3 | 8.6 | 2.0–78.0 | 0.0–27.4 | | |
| 2-OH Glut | 96.7% | 3.4 | 2.3 | 1.0–18.0 | 0.0–7.9 | | |
| ICit | 98.4% | 5.2 | 5.9 | 1.3–61.4 | 0.0–16.9 | 16.0–99.0 | 2 (0) |
| Cit | 100.0% | 88.7 | 75.9 | 2.0–509.5 | 0.0–239.0 | 0.0–656.0 | 3 (0) |
| Mal | 82.0% | 1.1 | 0.3 | 1.0–2.5 | 0.6–1.6 | 0.0–5.3 | 5 (0) |
| Suc | 89.3% | 4.8 | 7.1 | 1.0–64.0 | 0.0–19.0 | 29.0–87.0 | 3 (0) |
| 2-ketog | 100.0% | 18.9 | 19.2 | 1.0–145.8 | 0.0–57.0 | 41.0–82.0 | 5 (112) |
| Pyr | 100.0% | 9.6 | 6.9 | 2.0–55.2 | 0.0–23.2 | 3.5–22.0 | 4 (12) |
| Lac | 100.0% | 21.8 | 86.1 | 2.1–926.6 | 0.0–192.2 | 20.0–101.0 | 2 (101) |
| Metmal | 90.2% | 1.4 | 0.8 | 1.0–6.0 | 0.0–3.0 | 0.0–1.0 | 5 (43) |
| 3-MetGlut | 88.5% | 2.1 | 1.4 | 0.8–7.3 | 0.0–4.8 | | |
| Table IIIPercentiles and quartiles of urine
OAs. |
Table III
Percentiles and quartiles of urine
OAs.
| 1st quartile
| 2nd quartile
(median)
| 3rd quartile
|
|---|
| 5th percentile | 10th
percentile | 25th
percentile | 50th
percentile | 75th
percentile | 90th
percentile | 95th
percentile |
|---|
| 5-HIAA | 1.0 | 1.0 | 1.5 | 2.0 | 4.3 | 8.1 | 16.6 |
| 3-OH Pr | 1.6 | 1.9 | 3.3 | 5.0 | 10.2 | 18.6 | 25.5 |
| Pim | 1.0 | 1.0 | 1.1 | 1.3 | 2.6 | 3.0 | 3.0 |
| EMA | 1.0 | 1.0 | 1.1 | 1.5 | 2.3 | 4.8 | 6.2 |
| 3-OH Glut | 1.0 | 1.0 | 1.0 | 1.0 | 1.0 | 1.2 | 1.8 |
| HVA | 1.0 | 1.0 | 1.3 | 1.7 | 2.7 | 3.8 | 5.1 |
| Glyc | 1.0 | 1.0 | 1.6 | 2.0 | 2.0 | 2.0 | 2.0 |
| Pyrog | 5.9 | 12.0 | 18.3 | 26.0 | 33.6 | 43.1 | 55.5 |
| 3-OH Isob | 2.9 | 4.6 | 5.2 | 7.8 | 13.0 | 18.0 | 22.7 |
| 2-OH Glut | 1.0 | 1.3 | 1.9 | 2.8 | 4.2 | 5.6 | 7.5 |
| ICit | 1.7 | 2.3 | 3.0 | 4.3 | 5.5 | 8.5 | 10.0 |
| Cit | 19.8 | 26.8 | 43.8 | 65.3 | 115.6 | 171.0 | 204.7 |
| Mal | 1.0 | 1.0 | 1.0 | 1.0 | 1.0 | 1.2 | 2.0 |
| Suc | 1.2 | 1.4 | 1.9 | 2.8 | 5.1 | 8.9 | 11.6 |
| 2-ketog | 2.4 | 2.9 | 6.5 | 13.2 | 25.8 | 39.4 | 52.2 |
| Pyr | 2.9 | 4.0 | 5.4 | 8.4 | 11.5 | 16.6 | 21.1 |
| Lac | 3.3 | 3.6 | 5.0 | 8.4 | 13.8 | 26.3 | 54.6 |
| Metmal | 1.0 | 1.0 | 1.0 | 1.0 | 1.5 | 2.6 | 3.0 |
| 3-MetGlut | 1.0 | 1.0 | 1.1 | 1.8 | 2.4 | 4.2 | 5.0 |
| Table IVDescriptive statistics of urine OAs
in the different age groups and according to sex. |
Table IV
Descriptive statistics of urine OAs
in the different age groups and according to sex.
| Age group (females)
| P-valuea | Age group (males)
| P-valuea |
|---|
≥30
| 31–40
| 41–50
| 51+
| ≤30
| 31–40
| 41–50
| 51+
|
|---|
| Mean | SD | Mean | SD | Mean | SD | Mean | SD | Mean | SD | Mean | SD | Mean | SD | Mean | SD |
|---|
| 5-HIAA | 4.4 | 5.9 | 3.7 | 1.7 | 3.4 | 3.3 | 10.0 | 19.1 | 0.228 | 7.6 | 13.9 | 2.5 | 1.6 | 5.0 | 12.6 | 7.2 | 11.1 | 0.735 |
| 3-OH Pr | 5.6 | 3.5 | 7.5 | 7.4 | 12.0 | 12.3 | 9.2 | 7.4 | 0.432 | 6.0 | 2.5 | 4.6 | 1.9 | 6.9 | 5.6 | 5.8 | 2.9 | 0.529 |
| Pim | 1.8 | 0.8 | 1.9 | 0.8 | 1.8 | 0.8 | 2.1 | 1.0 | 0.957 | 1.5 | 0.8 | 1.8 | 1.2 | 1.1 | 0.1 | 1.7 | 0.9 | 0.585 |
| EMA | 2.4 | 2.2 | 2.7 | 2.0 | 2.2 | 1.3 | 2.7 | 2.3 | 0.699 | 1.3 | 0.4 | 2.3 | 1.8 | 1.4 | 0.5 | 2.7 | 2.8 | 0.082 |
| 3-OH Glut | 1.1 | 0.2 | 1.0 | 0.0 | 1.1 | 0.4 | 1.0 | 0.0 | 0.698 | 1.3 | 0.5 | 1.0 | 0.0 | 1.0 | 0.0 | 1.0 | 0.1 | 0.071 |
| HVA | 2.2 | 1.1 | 2.4 | 1.1 | 2.5 | 1.8 | 2.8 | 1.1 | 0.507 | 2.1 | 0.6 | 1.6 | 0.6 | 2.0 | 1.7 | 1.7 | 0.8 | 0.761 |
| Glyc | 1.9 | 0.2 | 1.9 | 0.2 | 1.8 | 0.4 | 9.0 | 17.5 | 0.649 | 8.9 | 17.2 | 1.8 | 0.3 | 1.6 | 0.5 | 1.7 | 0.4 | 0.096 |
| Pyrog | 24.8 | 16.6 | 33.8 | 18.3 | 27.2 | 15.3 | 36.0 | 25.4 | 0.331 | 30.3 | 11.1 | 23.7 | 7.8 | 22.4 | 10.6 | 30.9 | 11.5 | 0.103 |
| 3-OH Isob | 10.1 | 6.1 | 12.6 | 8.8 | 12.4 | 13.2 | 11.6 | 8.0 | 0.882 | 9.7 | 5.2 | 9.0 | 4.1 | 7.0 | 3.4 | 7.5 | 3.7 | 0.303 |
| 2-OH Glut | 3.1 | 1.9 | 4.2 | 2.5 | 4.2 | 3.0 | 3.4 | 1.3 | 0.437 | 3.5 | 1.5 | 2.0 | 1.1 | 2.6 | 1.9 | 2.5 | 2.0 | 0.384 |
| ICit | 4.4 | 2.5 | 5.6 | 3.1 | 5.1 | 3.4 | 5.8 | 3.8 | 0.493 | 4.6 | 1.3 | 3.6 | 1.2 | 6.4 | 12.3 | 5.2 | 1.7 | 0.824 |
| Cit | 79.0 | 52.3 | 92.3 | 37.6 | 118.1 | 92.1 | 131.6 | 63.3 | 0.117 | 64.1 | 36.4 | 37.8 | 30.9 | 71.6 | 99.7 | 64.9 | 18.2 | 0.616 |
| Mal | 1.0 | 0.0 | 1.1 | 0.4 | 1.1 | 0.2 | 1.0 | 0.0 | 0.717 | 1.0 | 0.0 | 1.0 | 0.1 | 1.2 | 0.4 | 1.1 | 0.3 | 0.613 |
| Suc | 3.4 | 2.1 | 4.6 | 2.6 | 7.1 | 12.6 | 5.8 | 3.7 | 0.375 | 2.6 | 1.5 | 3.8 | 2.4 | 3.5 | 2.5 | 2.7 | 1.5 | 0.536 |
| 2-ketog | 22.5 | 18.7 | 28.8 | 20.4 | 25.3 | 25.2 | 23.8 | 13.1 | 0.739 | 11.7 | 7.8 | 7.6 | 5.2 | 9.3 | 13.7 | 12.0 | 7.4 | 0.764 |
| Pyr | 9.2 | 5.3 | 13.1 | 12.2 | 11.5 | 7.5 | 9.6 | 4.7 | 0.769 | 8.2 | 3.5 | 8.5 | 3.0 | 6.1 | 3.2 | 8.8 | 3.8 | 0.084 |
| Lac | 10.6 | 5.7 | 72.1 | 228.0 | 29.2 | 42.5 | 13.2 | 6.4 | 0.267 | 5.4 | 3.4 | 5.9 | 3.0 | 5.4 | 2.4 | 5.5 | 2.2 | 0.969 |
| MetMal | 1.4 | 0.6 | 1.4 | 0.8 | 1.5 | 0.9 | 1.4 | 0.4 | 0.858 | 1.4 | 0.8 | 1.3 | 0.4 | 1.3 | 1.1 | 1.2 | 0.3 | 0.982 |
| 3-MetGlut | 3.4 | 2.0 | 2.3 | 1.2 | v2.2 | 1.5 | 2.5 | 1.0 | 0.247 | 1.3 | 0.4 | 1.7 | 1.1 | 2.0 | 1.3 | 1.3 | 0.4 | 0.278 |
Moreover, Pearson's and Spearman's rho coefficients
were applied to estimate bivariate associations between urine OAs
(Table V). Of note, there was a
positive correlation (P<0.05), between the levels of discrete OA
metabolites (Table V). Thus,
homovanillic acid (HVA) correlated with all of OAs except Pim, 3-OH
Glut, glyceric acid (Glyc) and Mal. Similar correlations were
detected for ethylmalonic acid (EMA). By contrast, Mal only
correlated significantly, but with a moderate intensity with
methylmalonic acid (MetMal) (rs=0.22), 3-hydroxyisobu-tyric acid
(3-OH Isob) (rs=0.22) and 3-hydroxypropionic acid (3-OH Pr)
(rs=0.20).
| Table VBivariate associations of measured
OAs. |
Table V
Bivariate associations of measured
OAs.
| Correlation
coefficientsa | 5-HIAA | 3-OH Pr | Pim | EMA | 3-OH Glut | HVA | Glyc | Pyrog | 3-OH Isob | 2-OH Glut | ICit | Cit | Mal | Suc | 2-ketog | Pyr | Lac | MetMal | 3 MetGlut |
|---|
| 5-HIAA | | −0.04 | 0.13 | 0.16 | 0.09 |
0.43 | −0.03 | 0.14 | −0.08 |
0.20 |
0.57 |
0.47 | −0.02 | −0.02 | 0.27 | 0.00 | −0.01 |
0.36 | −0.004 |
| 3-OH Pr | 0.02 | | 0.11 | 0.12 |
0.46 |
0.34 | 0.01 |
0.35 |
0.53 |
0.39 | 0.13 |
0.41 | 0.13 | 0.13 |
0.42 |
0.45 | 0.23 |
0.36 | 0.04 |
| Pim | 0.27 | 0.02 | | 0.07 | 0.28 |
0.32 | 0.01 |
0.31 | 0.05 | 0.12 |
0.43 | 0.27 | 0.07 | −0.10 | 0.24 | 0.21 | 0.06 | 0.28 |
0.32 |
| EMA |
0.35 |
0.25 | 0.25 | | 0.24 |
0.20 |
0.23 |
0.25 |
0.26 | 0.13 | 0.12 |
0.23 | −0.01 | 0.02 |
0.31 |
0.24 | 0.04 |
0.27 | 0.01 |
| 3-OH Glut |
0.28 | 0.04 | 0.19 | 0.18 | |
0.33 | −0.02 |
0.33 | 0.05 |
0.51 | 0.22 |
0.44 | 0.07 |
0.35 |
0.46 | 0.21 | −0.04 |
0.40 |
0.33 |
| HVA |
0.28 |
0.26 | 0.27 |
0.27 | 0.19 | | 0.00 |
0.42 | 0.12 |
0.46 |
0.64 |
0.73 | −0.03 | 0.03 |
0.54 |
0.22 | 0.03 |
0.49 |
0.32 |
| Glyc | 0.12 | 0.11 | 0.01 |
0.28 | 0.02 | 0.01 | | 0.11 | 0.11 | 0.02 | −0.03 | −0.03 | −0.05 | 0.00 | 0.00 | 0.06 | −0.01 | 0.15 | −0.01 |
| Pyrog |
0.40 |
0.30 |
0.32 |
0.36 | 0.23 |
0.48 | 0.18 | |
0.29 |
0.50 |
0.37 |
0.40 | 0.05 | −0.06 |
0.47 |
0.55 | 0.36 |
0.45 |
0.26 |
| 3-OH Isob | 0.14 |
0.65 | 0.14 |
0.45 | 0.04 |
0.32 | 0.16 |
0.32 | |
0.27 | 0.03 | 0.16 | 0.13 | 0.01 |
0.31 |
0.68 | 0.44 |
0.52 | 0.04 |
| 2-OH Glut | 0.18 | 0.13 | −0.05 |
0.21 | 0.21 |
0.38 | 0.08 |
0.35 |
0.34 | |
0.49 |
0.61 | 0.09 | 0.15 |
0.75 |
0.42 | 0.26 |
0.48 |
0.24 |
| ICit |
0.40 |
0.29 |
0.41 |
0.34 |
0.35 |
0.55 | −0.05 |
0.67 |
0.32 |
0.48 | |
0.73 | 0.04 | 0.03 |
0.47 | 0.15 | 0.00 |
0.67 | 0.18 |
| Cit |
0.20 |
0.32 | 0.22 |
0.34 |
0.31 |
0.56 | 0.12 |
0.33 |
0.33 |
0.47 |
0.57 | | −0.04 | 0.13 |
0.68 |
0.24 | 0.03 |
0.55 |
0.23 |
| Mal | 0.16 |
0.20 | 0.12 | 0.19 | 0.06 | 0.07 | 0.03 | 0.12 |
0.22 | 0.17 | 0.15 | 0.07 | | 0.00 | 0.12 | 0.08 | 0.02 | 0.05 | −0.12 |
| Suc | 0.00 |
0.20 | 0.04 | 0.07 | 0.09 |
0.22 | 0.11 | 0.03 | 0.14 |
0.24 | 0.05 |
0.21 | 0.16 | | 0.04 | 0.02 | 0.09 | 0.01 | 0.02 |
| 2-ketog |
0.24 | 0.10 | 0.15 |
0.43 | 0.12 |
0.47 | 0.14 |
0.45 |
0.30 |
0.62 |
0.46 |
0.61 | 0.13 | 0.06 | |
0.32 | 0.09 |
0.38 | 0.16 |
| Pyr | 0.15 |
0.44 |
0.28 |
0.46 | 0.23 |
0.30 | 0.15 |
0.41 |
0.70 |
0.26 |
0.40 |
0.32 | 0.12 | −0.06 |
0.36 | |
0.71 |
0.60 | 0.11 |
| Lac |
0.20 |
0.37 | 0.21 |
0.52 | 0.06 |
0.42 | 0.08 |
0.27 |
0.62 |
0.39 |
0.34 |
0.51 | 0.09 |
0.34 |
0.46 |
0.65 | |
0.35 | 0.04 |
| MetMal |
0.21 |
0.38 | 0.20 |
0.39 |
0.50 |
0.30 | 0.02 |
0.43 |
0.58 |
0.32 |
0.34 |
0.24 |
0.22 | 0.02 |
0.24 |
0.58 |
0.42 | | 0.16 |
| 3-MetGlut | 0.09 | 0.03 | 0.22 | 0.03 | 0.18 |
0.28 | 0.16 |
0.22 | 0.09 |
0.24 |
0.24 |
0.22 | −0.02 | 0.15 |
0.19 | 0.12 |
0.27 | 0.00 | |
Discussion
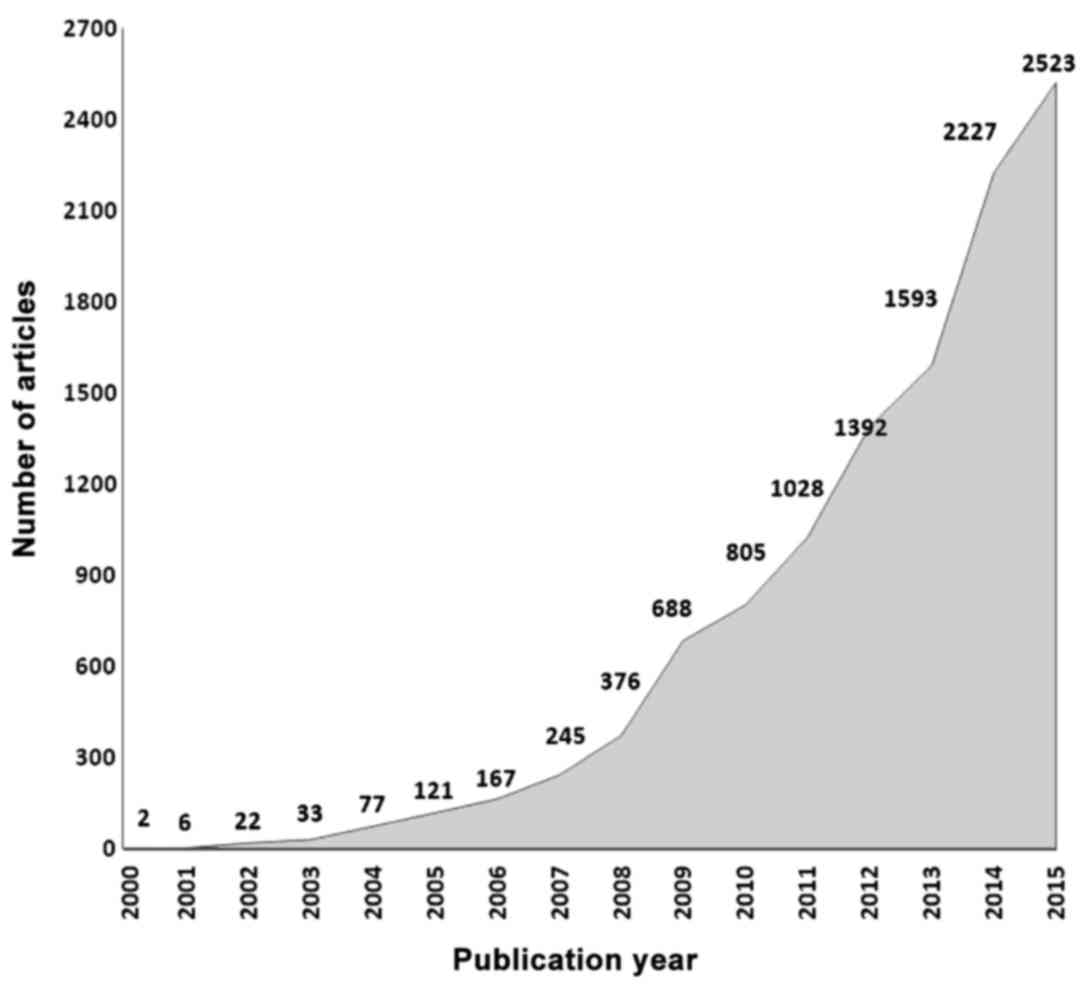
The rising significance and potential utilization of
metabolomics details illustrated by the fact that since the year
2000, 12.272 articles have been published containing the word
'Metabolomics' (Fig. 2).
Importantly, it has been established that alterations in the levels
of the metabolites in the quantified metabolic pathways correlate
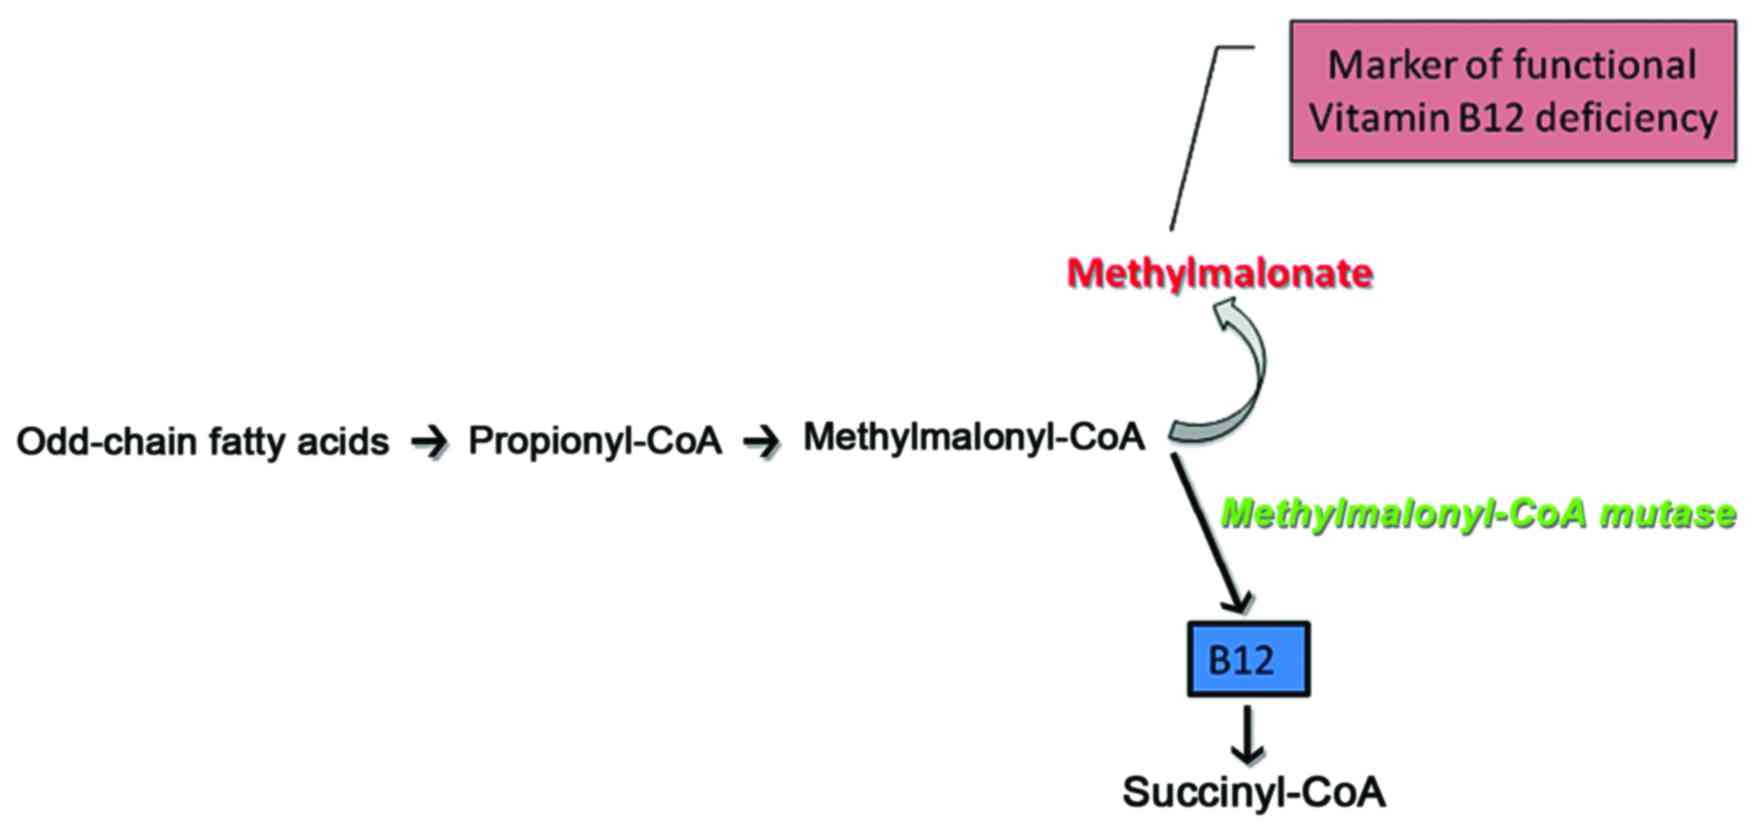
with the patient clinical status. In particular, the citric acid
cycle (CDC)-metabolites in healthy individuals reflect the
performance of the enzymes, which catalyze specific reactions
(Fig. 3). Thus, according to
studies where CDC metabolites were quantified and correlated to
mitochondrial dysfunction in chronic diseases, it was shown that
the presence of CDC antagonists or the lack of specific nutrients
can alter CDC enzyme efficiency, and may thus provide vital
information on the causative nature of a disease in a healthy North
Indian pediatric population (14). Indeed, mitochondrial dysfunction
has been associated with a number of chronic diseases. Heavy
metals, such as mercury, can disrupt acotinase for example, in an
antagonistic manner. The lack of fumarase co-factors, such as
ubiquinol may disrupt fumarate conversion to malate with concurrent
fumarate elevation (19). Another
important application of the measurement of OAs is the case of
3-hydroxybutyric acid, the levels of which increase in urine due to
the failure of glucose utilization in both fasting and diabetic
subjects, and can thus be used as a marker for subclinical
ketoacidosis, insulin sensitivity and complications associated with
diabetes (13,20). In a recent clinical study,
children presenting with non-alcoholic fatty liver disease (NAFLD)
were treated with probiotic VSL#3 and subsequently their urinary
OAs, including amino-acid metabolites and nucleic acid degradation
metabolites were estimated. The data obtained in that study
suggested that the urinary OAs levels of children with NAFLD may be
utilized as efficient biomarkers to evaluate the response to
therapy (21). It has recently
been discussed that both genetic and biochemical data indicate a
contribution of the mitochondrial disease during the pathological
evolvement of autism spectrum disorder (ASD) in a specific subgroup
of children (22). Indeed,
significant differences in urinary 4-hydroxyphen-ylacetic,
2-oxoglutaric, isocitric, citric, 4-hydroxybenzoic, hippuric,
adipic and suberic levels have been detected in autistic children,
as compared to age-matched healthy controls (23,24). Furthermore, urine homovanillic
acid and vanilmandelic acid levels have shown to be related to
neurotransmitter metabolism in subjects suffering from occupational
stress (25). Moreover, a
utilization of metabolic profiling for the detection of early
chronic kidney disease has recently been highlighted. Such an
approach could significantly decrease the existing time lapse
between the onset of the pathology and the time point when symptoms
are of adequate intensity as to initiate therapy (25). Moreover, metabolic profiling,
including the evaluation of 2-hydroxyisobutyric acid, has been
suggested as a feasible strategy in the evaluation of renal disease
progression (26). A separate
study demonstrated a correlation between urinary amino acid
metabolites' levels and chronic kidney disease progression
(27). Moreover, changes in
arginine metabolism have likewise been indicated as a biomarker for
the 2, 3 and 4 stages of chronic kidney disease (28). As these patients constitute a
significant subgroup of total human pathologies, improved early
detection and accurate disease monitoring could increase the
efficiency of treatment and significantly improve the socioeconomic
aspects of disease. Another feasible application of metabolic
profiling is the evaluation of intestinal disease. Thus,
4-hydroxyphenylacetic acid, an intestinal bacterial flora
metabolite, was found to be a marker of small-bowel disease due to
bacterial overgrowth as and in the case of Giardia infestation
(29). The utilization of OAs as
disease markers is still limited due to the lack of stringent,
reproducible RVs of healthy controls, as well as to difficulties
when comparing data from different platforms (30). At present, RVs are mainly based on
studies and measurements performed with the aim to detect inborn
errors of metabolism (31). In
patients presenting with congenital metabolic diseases, the lack or
substantial dysfunction of an enzyme participating in a specific
metabolic pathways markedly alters the levels of the metabolites
involved, allowing the use of a wider interval for RVs. However, in
patients suffering from a metabolic pathway dysfunction due to
epigenetic factors, there are smaller variations of the metabolite
levels between the healthy controls and subjects with pathologies.
This, demands strictly defined RVs in order to detect and correctly
interpret minor to moderate deviations. The human metabolome
database has contributed significantly to the increased application
of metabolic profiling in clinical settings. Moreover, the
accumulation of high resolution metabolomics data from a variety of
platforms is approaching the critical threshold in assembling a
central, reference human metabolome (11,30). This study, therefore aimed to
qualitatively contribute to existing data bases of urine
metabolites with the utmost goal being to increase sensitivity in
detecting metabolic pathway deviations in chronic diseases.
Over the past 6 years, we have performed more than
15,000 OA profiles, targeting metabolites that relate to critical
metabolic pathways, such as the CDC, neurotransmitter turnover,
bacterial flora markers, protein metabolism, ketones metabolism,
fatty acid β-oxidation methylation markers, vitamin B sufficiency
and carbohydrate metabolism. Therefore, according to our
experience, more sensitive RVs are required to identify smaller
variations in individuals presenting with various pathologies but
not suffering from inborn errors of metabolism.
This study was designed to determine the RV for a
set of key OA metabolites in a population of healthy Greek adult
males and females, who were on an unrestricted diet. The
establishment of a successful analytical profiling technique
involves the simultaneous analysis of numerous metabolites with
various chemical characteristics. Furthermore, the separation,
identification and quantification of these metabolites need to be
performed with the highest possible accuracy. It is imperative to
be able to detect very low concentrations of metabolites in order
to detect any deviation with respect to normal levels. According to
the above-mentioned characteristics, the technical method of choice
needs to exhibit high sensitivity and repeatability. In previous
studies, the analytical techniques that have been used are GC-MS,
HPLC, TANDEM-MS and others. However, the gold standard for the
evaluation of OAs in urine is GC-MS with the chemical modification
of metabolites, separated by chromatography and identified by mass
spectrometry (32–34). Prior to application in each
respective laboratory, the method needs to be validated with
specific conclusions about the value ranges, the repeatability and
the linearity of measurements. This methodology needs to be
carefully applied for the obtaining of accurate and representative
RV. To the best of our knowledge, this study is the first of its
kind conducted in Greece. The concentrations of OAs may vary among
populations from different geographical regions due to genotype,
different diet and various other environmental and epigenetic
factors. Moreover, there is extensive individual variation in
metabolite secretion following specific dietary intake (28). Along these lines, our results are
in agreement with those of similar studies performed on different
ethnic groups with minor differences attributed to the details of
laboratory methods (35). A
recent study performed on a healthy north Indian pediatric
population utilizing mass GS-MS indicated that the concentrations
of OAs were higher (14) as
compared to matched age-groups in Turkish and Swiss (36,37) pediatric populations. Thus, Kumari
et al, putatively attribute the higher RVs of some
metabolites to dietary deficiency, as protein intake was inadequate
in the North Indian pediatric population (14). Moreover, studies on pediatric
populations have shown a strong age dependent effects on RVs of OA
metabolites (14,37).
Our study contributes to the available data with the
aim to narrow the RV range, and the increase sensitivity and the
clinical application of urine metabolites in detecting deviation
from normal metabolism. However, further studies with well-defined
groups of patients presenting specific symptoms or diseases, are
warranted in order to test the ability of this method to
discriminate between normal and pathological values.
References
|
1
|
Astarita G and Langridge J: An emerging
role for metabolomics in nutrition science. J Nutrigenet
Nutrigenomics. 6:181–200. 2013. View Article : Google Scholar : PubMed/NCBI
|
|
2
|
Baraldi E, Carraro S, Giordano G, Reniero
F, Perilongo G and Zacchello F: Metabolomics: Moving towards
personalized medicine. Ital J Pediatr. 35:302009. View Article : Google Scholar : PubMed/NCBI
|
|
3
|
Sun J, Beger DR and Schnackenberg KL:
Metabolomics as a tool for personalizing medicine: 2012 update. Per
Med. 10:149–161. 2013. View
Article : Google Scholar
|
|
4
|
McKillop AM and Flatt PR: Emerging
applications of metabolomic and genomic profiling in diabetic
clinical medicine. Diabetes Care. 34:2624–2630. 2011. View Article : Google Scholar : PubMed/NCBI
|
|
5
|
Tanaka K and Isselbacher KJ: Experimental
beta-hydroxyisovaleric aciduria induced by biotin deficiency.
Lancet. 2:930–931. 1970. View Article : Google Scholar : PubMed/NCBI
|
|
6
|
van der Greef J and Smilde AK: Symbiosis
of chemometrics and metabolomics: past, present, and future.
Chemometrics. 19:376–386. 2005. View
Article : Google Scholar
|
|
7
|
Shaw J: Fathoming Metabolism. The study of
metabolites does an end run around genomics to provide telling
clues to your future health. Harv Mag. 3:27–31. 2011.
|
|
8
|
Horning EC and Horning MG: Metabolic
profiles: gas-phase methods for analysis of metabolites. Clin Chem.
17:802–809. 1971.PubMed/NCBI
|
|
9
|
Pauling L, Robinson AB, Teranishi R and
Cary P: Quantitative analysis of urine vapor and breath by
gas-liquid partition chromatography. Proc Natl Acad Sci USA.
68:2374–2376. 1971. View Article : Google Scholar : PubMed/NCBI
|
|
10
|
Griffiths WJ and Wang Y: Mass
spectrometry: From proteomics to metabolomics and lipidomics. Chem
Soc Rev. 38:1882–1896. 2009. View
Article : Google Scholar : PubMed/NCBI
|
|
11
|
Wishart DS, Tzur D, Knox C, Eisner R, Guo
AC, Young N, Cheng D, Jewell K, Arndt D, Sawhney S, et al: HMDB:
The Human Metabolome Database. Nucleic Acids Res. 35(Database):
D521–D526. 2007. View Article : Google Scholar : PubMed/NCBI
|
|
12
|
Jones PM and Bennett MJ: Urine organic
acid analysis for inherited metabolic disease using gas
chromatography-mass spectrometry. Methods Mol Biol. 603:423–431.
2010. View Article : Google Scholar : PubMed/NCBI
|
|
13
|
Barshop BA: Metabolomic approaches to
mitochondrial disease: Correlation of urine organic acids.
Mitochondrion. 4:521–527. 2004. View Article : Google Scholar
|
|
14
|
Kumari C, Singh A, Ramji S, Shoemaker JD
and Kapoor S: Urinary Organic Acids Quantitated in a Healthy North
Indian Pediatric Population. Indian J Clin Biochem. 30:221–229.
2015. View Article : Google Scholar : PubMed/NCBI
|
|
15
|
Fiehn O and Spranger J: Use of
metabolomics to discover metabolic patterns associated with human
disease. Pulm Circ. 3:417–423. 2014.
|
|
16
|
Tanaka K, Hine DG, West-Dull A and Lynn
TB: Gas-chromatographic method of analysis for urinary organic
acids. I. Retention indices of 155 metabolically important
compounds. Clin Chem. 26:1839–1846. 1980.PubMed/NCBI
|
|
17
|
Applegarth DA and Ross PM: The
unsuitability of creatinine excretion as a basis for assessing the
excretion of other metabolites by infants and children. Clin Chim
Acta. 64:83–85. 1975. View Article : Google Scholar : PubMed/NCBI
|
|
18
|
Blau N, Duran M and Gibson KM: Laboratory
Guide to the Methods in Biochemical Genetics. Springer; Berlin
Heidelberg: pp. 7–22. 2008
|
|
19
|
Mitchell P: Possible molecular mechanisms
of the protonmotive function of cytochrome systems. J Theor Biol.
62:327–367. 1976. View Article : Google Scholar : PubMed/NCBI
|
|
20
|
Yousri NA, Mook-Kanamori DO, Selim MM,
Takiddin AH, Al-Homsi H, Al-Mahmoud KA, Karoly ED, Krumsiek J, Do
KT, Neumaier U, et al: A systems view of type 2 diabetes-associated
metabolic perturbations in saliva, blood and urine at different
timescales of glycaemic control. Diabetologia. 58:1855–1867. 2015.
View Article : Google Scholar : PubMed/NCBI
|
|
21
|
Miccheli A, Capuani G, Marini F, Tomassini
A, Praticò G, Ceccarelli S, Gnani D, Baviera G, Alisi A, Putignani
L, et al: Urinary (1)H-NMR-based metabolic profiling of children
with NAFLD undergoing VSL#3 treatment. Int J Obes. 39:1118–1125.
2015. View Article : Google Scholar
|
|
22
|
Legido A, Jethva R and Goldenthal MJ:
Mitochondrial dysfunction in autism. Semin Pediatr Neurol.
20:163–175. 2013. View Article : Google Scholar : PubMed/NCBI
|
|
23
|
Noto A, Fanos V, Barberini L, Grapov D,
Fattuoni C, Zaffanello M, Casanova A, Fenu G, De Giacomo A, De
Angelis M, et al: The urinary metabolomics profile of an Italian
autistic children population and their unaffected siblings. J
Matern Fetal Neonatal Med. 27(Suppl 2): 46–52. 2014. View Article : Google Scholar : PubMed/NCBI
|
|
24
|
Kałużna-Czaplińska J: Noninvasive urinary
organic acids test to assess biochemical and nutritional
individuality in autistic children. Clin Biochem. 44:686–691. 2011.
View Article : Google Scholar
|
|
25
|
Wu H, Jiang K, Gu G, Wu Y and Yu S: The
relationship of occupational stress and the level of some hormone
metabolites in urine. Zhonghua Lao Dong Wei Sheng Zhi Ye Bing Za
Zhi. 32:83–86. 2014.In Chinese. PubMed/NCBI
|
|
26
|
Mutsaers HA, Engelke UF, Wilmer MJ,
Wetzels JF, Wevers RA, van den Heuvel LP, Hoenderop JG and
Masereeuw R: Optimized metabolomic approach to identify uremic
solutes in plasma of stage 3–4 chronic kidney disease patients.
PLoS One. 8:e711992013. View Article : Google Scholar
|
|
27
|
Duranton F, Lundin U, Gayrard N, Mischak
H, Aparicio M, Mourad G, Daurès JP, Weinberger KM and Argilés A:
Plasma and urinary amino acid metabolomic profiling in patients
with different levels of kidney function. Clin J Am Soc Nephrol.
9:37–45. 2014. View Article : Google Scholar :
|
|
28
|
Shah VO, Townsend RR, Feldman HI, Pappan
KL, Kensicki E and Vander Jagt DL: Plasma metabolomic profiles in
different stages of CKD. Clin J Am Soc Nephrol. 8:363–370. 2013.
View Article : Google Scholar :
|
|
29
|
Chalmers RA, Valman HB and Liberman MM:
Measurement of 4-hydroxyphenylacetic aciduria as a screening test
for small-bowel disease. Clin Chem. 25:1791–1794. 1979.PubMed/NCBI
|
|
30
|
Li S, Todor A and Luo R: Blood
transcriptomics and metabolomics for personalized medicine. Comput
Struct Biotechnol J. 14:1–7. 2015. View Article : Google Scholar : PubMed/NCBI
|
|
31
|
Nagrath D, Caneba C, Karedath T and
Bellance N: Metabolomics for mitochondrial and cancer studies.
Biochim Biophys Acta. 1807:650–663. 2011. View Article : Google Scholar : PubMed/NCBI
|
|
32
|
Duez P, Kumps A and Mardens Y: GC-MS
profiling of urinary organic acids evaluated as a quantitative
method. Clin Chem. 42:1609–1615. 1996.PubMed/NCBI
|
|
33
|
Greter J and Jacobson CE: Urinary organic
acids: Isolation and quantification for routine metabolic
screening. Clin Chem. 33:473–480. 1987.PubMed/NCBI
|
|
34
|
Hoffmann G, Aramaki S, Blum-Hoffmann E,
Nyhan WL and Sweetman L: Quantitative analysis for organic acids in
biological samples: Batch isolation followed by gas
chromatographic-mass spectrometric analysis. Clin Chem. 35:587–595.
1989.PubMed/NCBI
|
|
35
|
Bouatra S, Aziat F, Mandal R, Guo AC,
Wilson MR, Knox C, Bjorndahl TC, Krishnamurthy R, Saleem F, Liu P,
et al: The human urine metabolome. PLoS One. 8:e730762013.
View Article : Google Scholar : PubMed/NCBI
|
|
36
|
Kiykim E, Zeybek CA, Zubarioglu T,
Cansever S, Yalcinkaya C, Soyucen E and Aydin A: Inherited
metabolic disorders in Turkish patients with autism spectrum
disorders. Autism Res. 9:217–223. 2016. View Article : Google Scholar
|
|
37
|
Boulat O, Gradwohl M, Matos V, Guignard JP
and Bachmann C: Organic acids in the second morning urine in a
healthy Swiss paediatric population. Clin Chem Lab Med.
41:1642–1658. 2003. View Article : Google Scholar
|