Introduction
All-trans retinoic acid (atRA) is a chemical
essential for the regulation of a wide range of biological
processes, such as organ development (1), regeneration, differentiation
(2) and cancer (3). It acts as a ligand for nuclear
retinoic acid receptors (RARs), which includes RARα, RARβ and RARγ,
leading to the alteration of gene transcription and subsequent
biological processes (4).
Endogenous atRA is generated via two steps of oxidation of vitamin
A (all-trans retinol), through an intermediate state,
all-trans retinal (1,5).
The second and irreversible step of retinoic acid synthesis is
catalyzed by enzymes, including aldehyde dehydrogenase 1 family
(ALDH1)A1 (6), ALDH1A2 (7,8)
and ALDH1A3 (9,10) (Fig.
1A).
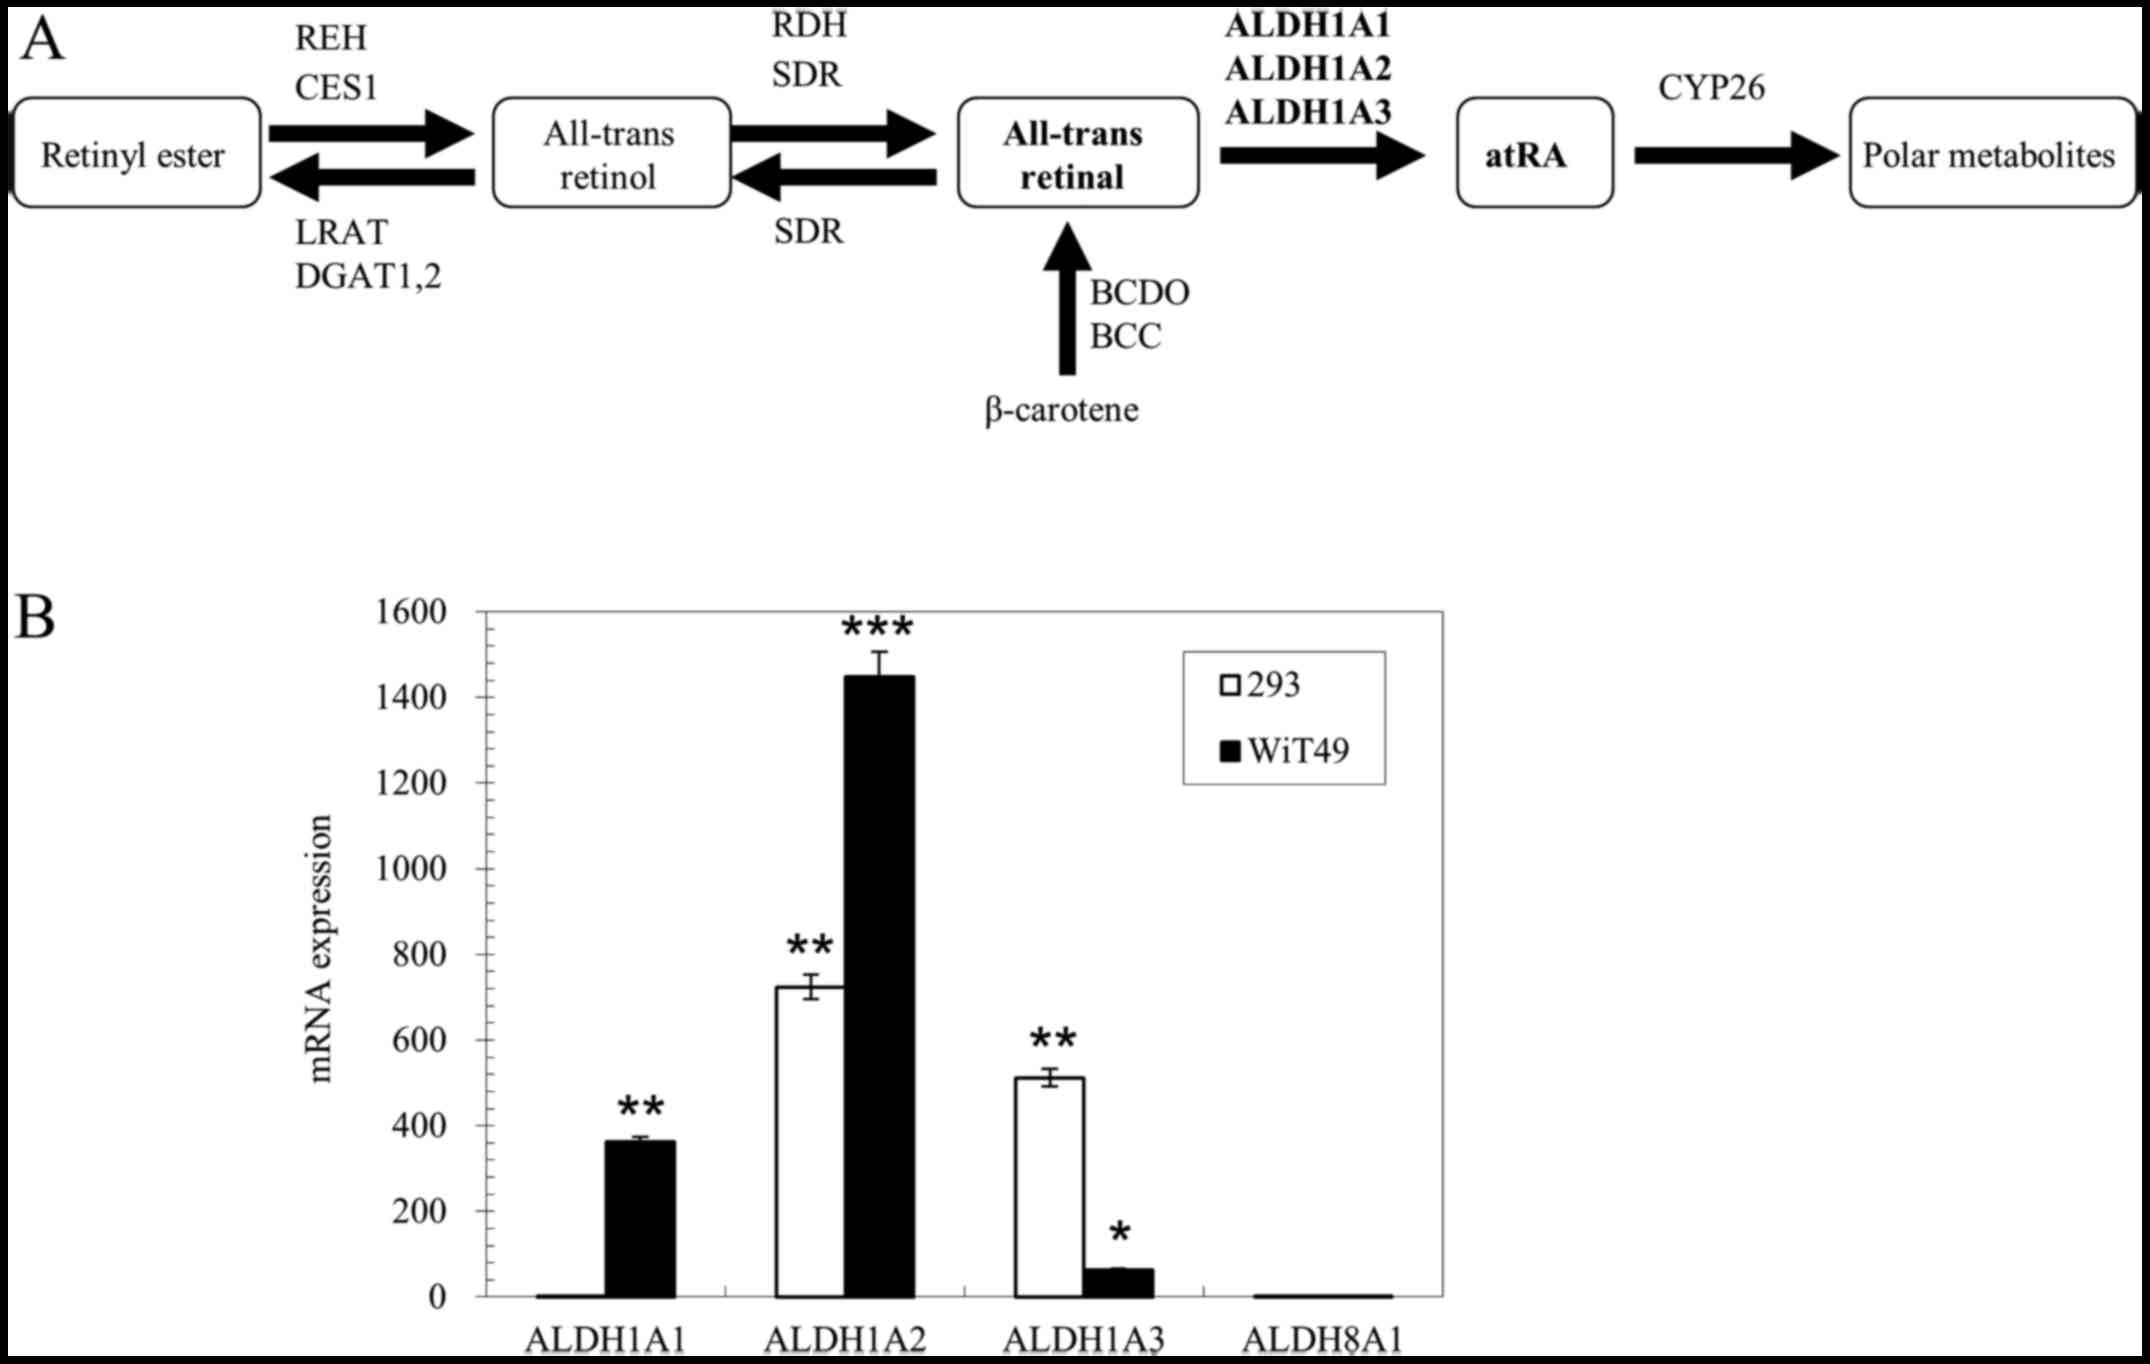 | Figure 1mRNA expression analysis of retinoic
acid synthetic enzymes in 293 cells and WiT49 cells. (A) Pathway of
retinoic acid synthesis and metabolism. (B) mRNA expression of
ALDH1A1, ALDH1A2, ALDH1A3 and ALDH8A1
relative to house-keeping gene TBP in 293 and WiT49 cells
measured by real-time PCR. Data are expressed as fold changes
relative to ALDH1A1 expression in 293 cells. Results are
representative of 3 separate experiments. Error bars show the range
of duplicate measurements; primer sequences are shown in Table I. REH, retinyl ester hydrolase;
CES1, carboxylesterase 1; LRAT, lecithin:retinol acyltransferase;
DGAT, diacylglycerol acyltransferase; RDH, retinol dehydrogenase;
SDR, short-chain dehydrogenase/reductase; ALDH1A1, aldehyde
dehydrogenase 1 family, member A1; ALDH1A2, aldehyde dehydrogenase
1 family, member A2; ALDH1A3, aldehyde dehydrogenase 1 family,
member A3; CYP26, cytochrome P450, family 26; BCDO,
carotene-15,15′-dioxygenase; BCC, β-carotene cleavage enzyme.
*P<0.05, **P<0.01 and
***P<0.001 vs. ALDH1A1 expression level in the 293
cells, calculated using the Student's t-test. |
The embryonic kidney develops through reciprocal
induction between the ureteric bud branched from the Wolffian duct
and its surrounding mesenchyme, which both derive from the
intermediate mesoderm. Wolffian duct extends caudally and interacts
with its adjacent mesenchyme to form pronephros, mesonephros and
metanephros. The former two structures are transient, while the
latter structure metanephros develops to form kidney seen in adult.
Metanephric mesenchyme is induced to form condensed mesenchyme (cap
mesenchyme) and then differentiates into different linages,
including epithelial cells (through sequential structures including
pretubular aggregate, renal vesicle, comma- and S-shaped bodies,
and renal nephrons, including podocytes on the renal vesicle layer
of the glomerulus, proximal convoluted tubule, loop of Henle and
distal convoluted tubule), stromal cells and endothelial cells.
Ureteric buds differentiate into the collecting duct, renal
calyces, pelvis and ureter (11,12).
Retinoic acid signaling is absolutely essential for
renal development, which has been shown by the double knockout of
RARα/β2, that leads to hypoplasia/agenesis of the kidney
(13). To date, one of the major
pathways mediating the effect of retinoic acid on renal development
is the upregulation of ret proto-oncogene (Ret) expressed on
the cell membrane of the ureter bud, which binds its ligand glial
cell line derived neurotrophic factor (Gdnf) secreted from
the differentiating mesenchyme (14,15). Retinoic acid synthesis, the
upstream regulatory point of retinoic acid signaling, is also
critical for renal development, demonstrated by
Aldh1a2−/− mutant mouse kidneys that exhibit a
significant reduction in ureteric buds and nephrons, and
Aldh1a2−/−/Aldh1a3−/− mutant
kidneys that exhibit a more severe pattern of abnormities (14). However, it has also been shown
that excessive retinoic acid can be teratogenic and an cause
hypoplastic and polycystic kidneys (16). These data suggest that the
deficiency or excess of retinoic acid signaling results in
abnormalities in renal development.
Furthermore, the timely and precise 'turning on and
off' of atRA production in specific zones of the developing kidney
is also critical. atRA, one of the major secreted signaling
molecules, contributes to the complex dynamics of epithelial cell
branching morphogenesis and nephron patterning (11). For example, evidence indicates
that retinoic acid controls the positioning and segmentation of
zebrafish pronephros (17).
Studies on the development of the hindbrain (18–20), paraxial mesoderm (21), and limb (22), suggest that atRA acts in a
diffusion (morphogen-like) gradient pattern to drive proper cell
differentiation and patterning in development. This pattern may
also be applied to renal development (21), by tightly control of retinoic acid
degradation enzymes CYP26 (18,19), or specific retinoic acid synthetic
enzymes.
The retinoic acid synthetic enzymes Aldh1a1,
Aldh1a2 and Aldh1a3 display a dynamic and complex
expression pattern in the course of kidney organogenesis and
nephron differentiation. Aldh1a1 and Aldh1a3 are
predominantly expressed in differentiating tubular structures
derived from S-shaped bodies or developing structure derived from
the ureter bud. The expression levels of Aldh1a1 and
Aldh1a3 are not detectable at different stages in the cell
lineage that differentiates into podocytes (14,23–25). Aldh1a2 expression is mainly
stromal. It is also weakly expressed in the proximal segment of
comma-shaped body, and strongly, but transiently expressed in the
glomerular anlagen in S-shaped body and visceral layer of
glomerulus in the stage III nephron, which then decreases sharply
in podocytes of the stage IV nephron. During E18-P4, it is also
expressed in collecting tubules (14,15,24,25). The absence of Aldh1a1 and
Aldh1a3 expression at different stages in the cell linage
that finally forms podocytes, together with the downregulation of
Aldh1a2 in podocytes, suggests that not yet identified
regulators may negatively regulate their expression in this
developing stem/progenitor cell population.
Wilms' tumor 1 (WT1) encodes a transcription
factor that can either upregulate or downregulate the expression of
the same gene in a different cellular context, which may be largely
due to the effects of its co-factors (26,27) and the 'chromatin flip-flop' effect
that involves CCCTC-binding factor (zinc finger protein) (CTCF) and
the protein complex cohesin for maintenance of the chromatin
insulating boundaries (28). WT1
has four major isoforms arising from alternative splicing by
combinatorial insertions of exon 5 and lysine, threonine and serine
(KTS) at the end of exon 9 (29),
in which the WT1(+/−) isoform (with exon 5, without KTS) primarily
acts as a transcription factor (30). WT1 expression begins on
embryonic day 9.5 (E9.5) within the urogenital ridge in mice.
During renal development, WT1 is lowly expressed in the
uninduced metanephric blastema, then it is limited in and increases
progressively in the condensed mesenchyme, renal vesicle, comma-
and S-shaped bodies, and glomerular podocyte (31,32). Wt1 is not expressed in the
ureteric bud and its derivatives (31). WT1 is one of the major regulators
of normal kidney development, demonstrated by evidence that the
Wt1 gene knockout leads to agenesis of the kidney in mice
(33).
Previous studies have suggested that Wt1 is a
positive regulator of Aldh1a2 and Aldh1a1 expression
in the development of the heart, liver and gonad. Wt1 null
mice exhibit the downregulation of Aldh1a2 in the developing
epicardium (34,35). It was later shown that Wt1
directly upregulates Aldh1a2 expression in the embryonic
epicardium (36). Coelomic cells
lining the liver in the Wt1 null embryo exhibit a decrease
or absence of Aldh1a2 expression (35). The Wt1 null mouse embryo
exhibits the loss of Aldh1a1 expression in the gonad
(37), indicating that Wt1 may
positively regulate Aldh1a1 expression in the gonad.
However, although Wt1 knockout is associated with the
decreased expression of Aldh1a1 in the developing gonad; the
same study also showed that Aldh1a1 was not expressed in the
differentiating renal vesicle lineage (37), where Wt1 is increasingly
expressed (31,32). In the developing kidney, it has
been reported that Aldh1a2 mRNA expression is strong in the mouse
mesenchyme at E11 (7), where
Wt1 expression is just beginning. Aldh1a2 is later
strongly expressed in the presumptive podocytes, but its expression
decreases markedly in more differentiated podocytes of the stage IV
nephron (25), in which
Wt1 is strongly expressed (31,32).
Thus, the rationales for this study are the
following: i) Aldh1a1 and Aldh1a3 expression are
negatively associated with Wt1 expression during renal
development; ii) Aldh1a2 is downregulated in podocytes of
the stage IV nephron where WT1 expression is progressively
increased; iii) WT1 is a positive regulator of Aldh1a2 and
Aldh1a1 expression in other organ development, but it can
regulate the same gene in both directions. Therefore, we propose
that WT1 may negatively regulate Aldh1a1, Aldh1a2 and
Aldh1a3 expression. In this study, we demonstrate that
ALDH1A2 and ALDH1A3 are both highly expressed in 293
cells. We demonstrate that WT1 represses the expression of
ALDH1A1, ALDH1A2 and ALDH1A3, leading to the
significant inhibition of retinoic acid synthesis in 293 cells. We
further demonstrate that the repression of ALDH1A1 by WT1
can be alleviated by histone deacetylase (HDAC) inhibitors, which
are potent regulators of kidney development and disease (38,39).
Materials and methods
Chemicals
5-Aza-2′-deoxycytidine (AZA) (A3656), which is an
epigenetic modifier resulting in DNA demethylation
(hypomethylation) and gene activation, was obtained from Sigma (St.
Louis, MO, USA). The HDAC inhibitors, MS-275 (13284), Chidamide
(13686) and SAHA (10009929), were from Cayman (Ann Arbor, MI, USA).
They were all dissolved in DMSO (MP Biomedicals, Santa Ana, CA,
USA) at a concentration of 10 mmol/l. MS-275 and chidamide belong
to the benzamide-type HDAC inhibitor, which mainly inhibits class I
HDACs (including HDAC1, HDAC2 and HDAC3). MS-275 at 5 µmol
primarily inhibits HDAC1 and HDAC3 (40). The chemical structure of chidamide
is highly similar to that of benzamide MS-275. Chidamide has been
previously shown to increase histone H3 acetylation in colon cancer
cells at 4 µmol/l (41).
SAHA belongs to the hydroxamate type HDAC inhibitors and can
inhibit class I and II HDACs at 5 µmol/l (42). All-trans retinol (R7632),
all-trans retinal (R2500), all-trans retinoic acid
(R2625) and retinyl acetate (46958) were from Sigma, and all were
prepared in DMSO at a concentration of 50 mmol/l.
Primers
The sequences of primers for reverse
transcription-quantitative PCR (RT-qPCR) and bisulfite PCR used in
this study are listed in Tables I
and II, respectively.
 | Table ISequences of primers used for
RT-qPCR. |
Table I
Sequences of primers used for
RT-qPCR.
| Genes detected | Primer names | Primer sequences
(5′ to 3′) |
|---|
| WT1 | WT1-RQF |
CCAGCCCGCTATTCGCAATCA |
| WT1-RQR |
CTCATGCTTGAATGAGTGGTTGGG |
| AREG | AREG-RQF |
GCACCTGGAAGCAGTAACATGCAA |
| AREG-RQR |
GATCACAGCAGACATAAAGGCAGC |
| ALDH1A1 | ALDH1A1-QF2 |
ACTGCTCTCCACGTGGCATCTTTA |
| ALDH1A1-QR2 |
TGCCAACCTCTGTTGATCCTGTGA |
| ALDH1A2 | ALDH1A2-QF2 |
GGGCAGTTCTTGCAACCATGGAAT |
| ALDH1A2-QF2 |
TTTGATGACGCCCTGCAAATCCAC |
| ALDH1A3 | ALDH1A3-QF1 |
GCATGAGCCCATTGGTGTCT |
| ALDH1A3-QR1 |
CGCAGGCTTCAGGACCAT |
| ALDH8A1 | ALDH8A1-QF1 |
AAAGTCGGCATTCCCTCTGATCCA |
| ALDH8A1-QR1 |
ACCGTGGGAAGCATAAAGTAGCCT |
| TBP | TBPRQF |
GCCCGAAACGCCGAATAT |
| TBPRQR |
CCGTGGTTCGTGGCTCTCT |
| Table IISequences of primers used for
PCR. |
Table II
Sequences of primers used for
PCR.
| Bisulfite PCR
fragment labels | Primer names | Primer sequences
(5′ to 3′) |
|---|
| ALDH1A1 BS1 | ALDH1A1-BSF1 |
ATGTTGGAGTATTGGTTTTTTAAGG |
| ALDH1A1-BSR1 |
TCAAAACAAAAAATAAAAATTTTACTCAC |
| ALDH1A2 BS0 | ALDH1A2-BSF0 |
AGTTTGAGTGAAGGAGTGAGATTTT |
| ALDH1A2-BSR0 |
CCAAACCTTAAACTCATTTTACTATCC |
| ALDH1A2 BS1 | ALDH1A2-BSF1 |
ATAGTAAAATGAGTTTAAGGTTTGG |
| ALDH1A2-BSR1 |
AAAAAACCAAAAAAATCCAAACTAC |
| ALDH1A2 BS2 | ALDH1A2-BSF2 |
GTAGTTTGGATTTTTTTGGTTTTTT |
| ALDH1A2-BSR2 |
CAAACTAAAACTCTTCTTATTAAAC |
| ALDH1A2 BS3 | ALDH1A2-BSF3 |
TTTAGTTTGATATTTGTTTATATATAGG |
| ALDH1A2-BSR3 |
AACAAACAAAAAATCCCTCTACTAC |
| ALDH1A3 BS1 | ALDH1A3-BSF1 |
AGTAGTAAAGGTTTTATGTGTTTTTT |
| ALDH1A3-BSR1 |
TACCCTACTCTTAAATCCAACC |
| ALDH1A3 BS2.1 | ALDH1A3-BSF2 |
GGTTGGATTTAAGAGTAGGGTA |
| ALDH1A3-BSR2-2 |
CACCTTAATAAACTTAACCTCCAA |
| ALDH1A3 BS2.2 |
ALDH1A3-BSF2-TG2 |
GTTTATAGGTAGTTTTTGGGG |
|
ALDH1A3-BSF2-CG2 |
GTTTATAGGTAGTTTTCGGGG |
| ALDH1A3-BSR2 |
TTAATAAACTTAACCTCCAAATTAC |
| ALDH1A3 BS3 | ALDH1A3-BSF3 |
GTAATTTGGAGGTTAAGTTTATTAA |
| ALDH1A3-BSR3 |
AAAAAAACTCCCCAAAACCAA |
Plasmids
The WT1(+/−) isoform was originally cloned from a
normal Chinese liver tissue. WT1(+/−) cDNA was cloned into the
pcDNA3.1(+) vector using EcoRI/NotI restriction
enzyme sites, resulting in the pcDNA3.1-WT1 vector. The human
ALDH1A2 mammalian expression vector, pReceiver-M67-ALDH1A2,
and the negative control, pReceiver-M67 empty vector, were
purchased from GeneCopoeia (Guangzhou, China). Open reading frame
sequences of these vectors were confirmed by dideoxy sequencing at
BGI Tech (Guangzhou, China).
Cell culture and transfection
The 293 cells (adenovirus transformed cells)
(43) were obtained from the Cell
Bank of Type Culture Collection of Chinese Academy of Sciences
(Shanghai, China) (WFCC registered no. 793). The WiT49 cells were
kindly provided by Dr Herman Yeger. It is a Wilms' tumor (WT) cell
line derived from the first-generation xenograft of a human WT lung
metastasis (44). The 293 cells
were cultured in Dulbecco's modified Eagle's medium (DMEM)
(HyClone, Logan, UT, USA) supplemented with 10% fetal bovine serum
(FBS) (Gibco, Grand Island, NY, USA), 2 mmol/l L-glutamine (Sigma),
100 U/ml penicillin and 100 µg/ml streptomycin (Gibco). The
WiT49 cells were cultured in DMEM supplemented with 15% FBS
(Gibco), 2 mmol/l L-glutamine (Sigma), 100 U/ml penicillin, 100
µg/ml streptomycin (Gibco), 0.5 ml/500 ml 2-mercaptoethanol
(x1,000) (Invitrogen, Carlsbad, CA, USA) and 6 mg/500 ml insulin
(44). The pcDNA3.1-WT1 or the
control vector pcDNA3.1 (Invitrogen) was transfected into the 293
cells in a 6-well plate separately at an amount of 1 µg/well
using FuGENE® HD Transfection Reagent (Promega, Madison,
WI, USA). The 293 cells that were transfected with pcDNA3.1-WT1 or
pcDNA3.1 were selected using 800 µg/ml G418 (Amresco, Solon,
OH, USA) for a week, resulting in cells named 293pc and 293pcWT1,
respectively. The 293pcWT1 cells were further subcloned and
293pcWT1-9 and 293pcWT1-69 cell lines with high WT1
expression were used in the rest of the experiments.
Cell treatment
293pcWT1-9 and 293pcWT1-69 cells were treated with
AZA at a final concentration of 5 µmol/l or the solvent DMSO
as a negative control for 48 and 72 h. 293pc, 293pcWT1-9 and
293pcWT1-69 cells were treated with chidamide, MS-275 and SAHA,
each at a final concentration of 5 µmol/l, for 24, 48 or 72
h, respectively, along with their solvent DMSO control.
RT-qPCR
RNA was extracted using TRIzol reagent (Invitrogen)
and its concentration and purity were measured at 260/280 nm using
a NanoDrop spectrophometer (Thermo Thermo Fisher Scientific,
Waltham, MA, USA). Total RNA (1 µg) was reverse-transcribed
with oligo(dT)20 at 50°C for 1 h using the ThermoScript
RT-PCR system (Invitrogen). Comparative quantitative (real-time)
PCR was performed using SYBR-Green qPCR SuperMix universal
(Invitrogen) on ABI 7500 Fast Real-Time PCR System (Applied
Biosystems, Foster City, CA, USA). The reaction mixture was
composed of 10 µl Fast SYBR-Green Master Mix (Invitrogen),
50 nmol/l ROX reference dye, 0.2 µmol/l forward primer, 0.2
µmol/l reverse primer and 5 µl of 1:10 diluted cDNA
template. PCR cycling was carried out as follows: 50°C for 2 min, a
denaturation step of 95°C for 10 min, followed by 40 cycles of 95°C
for 15 sec, 58°C for 30 sec and 72°C for 30 sec. Gene expression
levels were quantified using the comparative Ct method, normalizing
to the housekeeping gene, TATA box binding protein (TBP).
Assays were carried out in duplicate.
Western blot analysis
Western blot analysis was carried out using
antibodies to WT1 C19, β-actin C4 (both from Santa Cruz
Biotechnology, Inc., Santa Cruz, CA, USA), glyceraldehyde
3-phosphate dehydrogenase (GAPDH) (Goodhere, Hangzhou, China),
ALDH1A1, ALDH1A2 and ALDH1A3 (all from Abcam, Cambridge, UK).
Secondary antibodies, including anti-rabbit IgG (whole
molecule)-peroxidase antibody and anti-mouse IgG (whole
molecule)-peroxidase antibody, were from Sigma. Briefly,
1×10⁶ cells were lysed in 150 µl 1X cell lysis
buffer (Cell Signaling Technology, Beverly, MA, USA), plus
EDTA-free protease inhibitor cocktail (Roche, Indianapolis, IN,
USA). Protein concentrations were determined using the DC Protein
assay kit (Bio-Rad, Hercules, CA, USA). For each lane, 30 µg
proteins were lysed in 30 µl sample buffer [60 mmol/l Tris
pH 6.8, 10% glycerol, 2% sodium dodecyl sulfate (SDS), 5%
mercaptoethanol], followed by incubation at 100°C for 5 min and
cooling on ice to denature proteins. Protein samples were loaded
for electrophoresis and transferred onto Immobilon-P transfer
membranes (Millipore, Billerica, MA, USA) with a wet transfer
apparatus (Bio-Rad). The Immobilon-P membranes were blocked with 1%
bovine serum albumin (BSA) (Sigma) in phosphate-buffered saline
(PBS) for 2 h at room temperature. The membranes were then probed
with primary antibodies overnight at 4°C at a dilution of 1:200 or
1:1,000, followed by incubation with secondary antibody at room
temperature for 1.5 h. Protein bands were visualized with ECL™
Prime Western Blotting detection reagent (Amersham, GE Healthcare,
Buckinghamshire, UK). Images were acquired using the MiniChemi
professional machine (SageCreation Science Co., Ltd., Beijing,
China).
High-performance liquid chromatography
(HPLC)
Treatment of the cells and the extraction of
retinoids were performed as previously described with some
modifications (45,46). Briefly, the cells were seeded in a
3×10⁶/T25 flask in 5 ml DMEM supplemented with 3% FBS.
At 24 h post-seeding, the cells were incubated with 10
µmol/l all-trans retinal (Sigma) as a substrate for 4
h. DMEM (5 ml) was harvested to a disposable glass tube (16×150
mm). The cells were then lysed with 530 ml 1X SDS lysis buffer
(Promega, Madison, WI, USA) and collected to the glass tube
containing 5 ml DMEM, followed by addition of 1 µl 50 mmol/l
retinol acetate in DMSO as an internal standard (IS) (47). Two mililiters 0.025 mol/l KOH in
ethanol was added and mixed. Subsequently, 4 ml hexane were added
and mixed thoroughly, followed by centrifugation at 1,500 rpm for 5
min for phase separation. The hexane phase on the top layer which
contains neutral lipids, retinol and retinyl esters was transferred
to a new disposable glass tube. This was followed by the addition
of 600 µl 4 mol/l HCL to the original tube and mixed, and by
the addition of 4 ml of hexane and mixing thoroughly. The mixture
was spun at 1,500 rpm for 5 min. The hexane phase on the top layer
containing retinoic acid was transferred and combined with the
previous hexane phase. The hexane solvent from the first and second
extraction was evaporated under a stream of nitrogen with heating
at 30°C in the dark. Residues were dissolved in 1 ml acetonitrile
for each tube. Resuspended samples were analyzed immediately by
HPLC using conditions as previously described (47,48). Briefly, HPLC was carried out on
the Shimadzu LC solution system with Inertsil® ODS-SP
column (5 µm, 4.6×150 mm) and mobile phase comprising 30
mmol/l ammonium acetate/acetonitrile (15:85, v/v). Retinoids were
monitored at 340 nm. The approximate retention times for atRA,
retinol, retinal and retinyl esters were 3.9, 6.4, 7.7 and 10.9 min
at a flow rate of 1 ml/min. The recovery of atRA was determined to
monitor extraction efficiency of atRA. The average recovery (± SEM)
of atRA is 80%±2 (n=3), at a similar level as reported previously
(46).
Methylation analysis
Genomic DNA was bisulfite-converted using the EZ DNA
Methylation-Gold kit™ (Zymo Research, Irvine, CA, USA). Bisulfite
PCR was performed using the HotStarTaq Plus DNA polymerase (Qiagen,
Hilden, Germany) on the PTC-200 Peltiler Thermal Cycler (Bio-Rad).
PCR products were ligated to the pGEMT-Easy vector (Promega),
followed by transformation into DH5α E. coli competent
cells. A total of 8-12 clones for each bisulfite PCR product were
dideoxy sequenced at BGI Tech.
Software
Primers were designed using the PrimerQuest Design
Tool (http://www.idtdna.com/primerquest/Home/Index). Primers
for bisulfite PCR were designed using the MethPrimer program
(49). Bisulfite sequencing
figures were produced using CpGviewer software (50). Histograms were plotted using
Microsoft Excel software (Microsoft, Redmond, WA, USA). The western
blot analysis data were analyzed using ImageJ software (51).
Statistical analysis
Statistical analysis was performed using Microsoft
Excel 2010 software (Microsoft). The Student's t-test was used to
determine whether two sets of data were significantly different
from each other. Representative data are expressed as the means ±
range of duplicate measurements from 3 independent experiments. A
value of P<0.05 was considered to indicate a statistically
significant difference.
Results
Expression of ALDH1A1, ALDH1A2 and
ALDH1A3 in 293 and WiT49 cells
WT arises from the developing kidney as the
metanephric blastema fails to undergo its normal developmental
pathway (52). The WT cell line,
WiT49, has features of undifferentiated fetal kidney cells
(44). Therefore, we performed
RT-qPCR to examine the expression levels of ALDH1A1,
ALDH1A2 and ALDH1A3 in 293 and Wit49 cells.
ALDH1A2 and ALDH1A3 were found to be highly expressed
in the 293 cells, 724- and 512-fold higher compared to
ALDH1A1 expression, respectively. The ALDH1A1 and
ALDH8A1 expression levels were both extremely low in the 293
cells. ALDH8A1 expression was 2-fold higher compared to
ALDH1A1 expression in the 293 cells (Fig. 1B). The ALDH1A2,
ALDH1A1 and ALDH1A3 expression levels in the WiT49
cells were relatively high, 1448-, 362- and 64-fold higher compared
to ALDH1A1 expression in the 293 cells, respectively.
However, ALDH8A1 expression in the WiT49 cells was also low,
which was 0.5-fold higher compared to ALDH1A1 expression in
the 293 cells (Fig. 1B). ALDH8A1
is a human analogue of mouse retinal dehydrogenase 4 (Raldh4),
which can catalyze the synthesis of 9-cis-retinoic acid
(9,53) and 13-cis-retinoic acid
(9).
Stable transfection of WT1 into 293 cells
leads to the suppression of ALDH1A1, ALDH1A2 and ALDH1A3
Amphiregulin (AREG) has previously been shown
to be a target of WT1 (54). In
this study, in order to examine the effectiveness of pcDNA3.1-WT1
on gene regulation, this plasmid or its empty vector, pcDNA3.1, was
transiently transfected into 293 cells, which were then cultured
for 4 days. In the pcDNA3.1-WT1-transfected 293 cells, as WT1 mRNA
was upregulated 7,747-fold, AREG mRNA expression was upregulated
9.54-fold, compared to that of the pcDNA3.1-tranfected 293 cells,
as measured by RT-qPCR (Fig. 2A).
The upregulation of WT1 protein in the pcDNA3.1-WT1-transfected 293
cells compared to the pcDNA3.1-tranfected 293 cells was also
examined by western blot analysis (Fig. 2B).
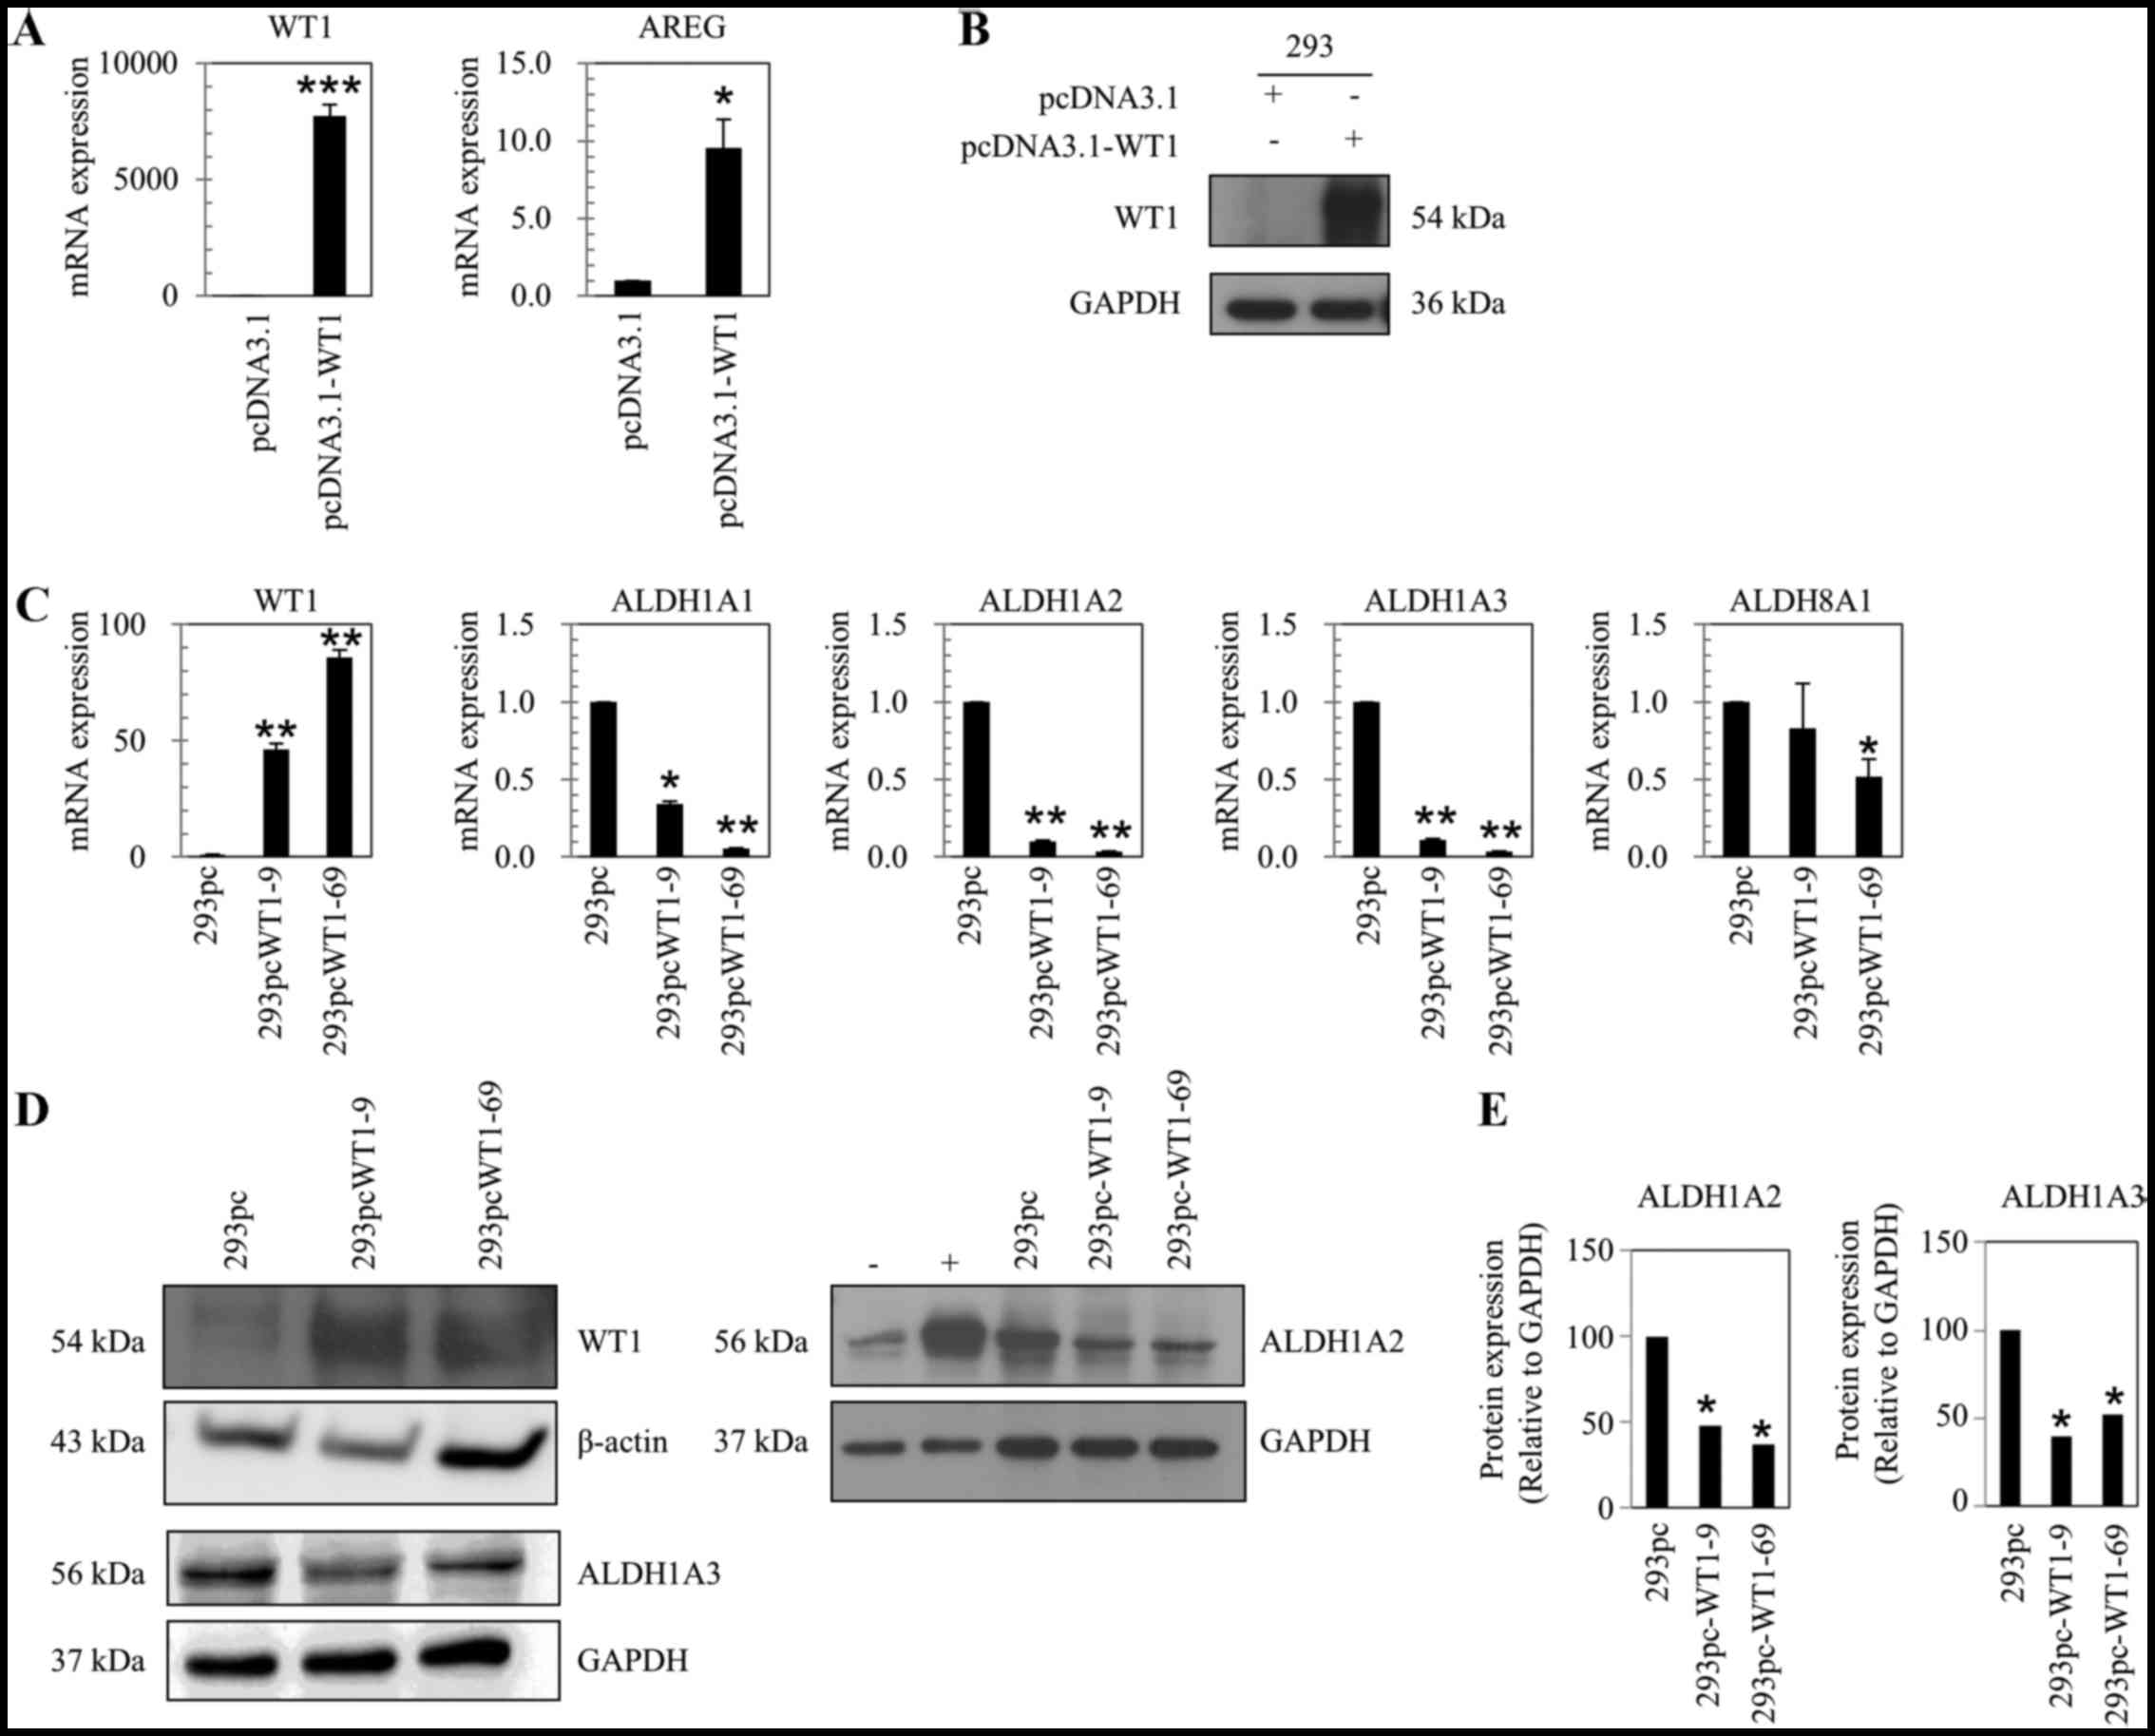 | Figure 2Suppressive effect of WT1 on the
expression levels of ALDH1A1, ALDH1A2 and
ALDH1A3. (A) WT1 and AREG mRNA expression relative to TBP in
293 cells transiently transfected with pcDNA3.1 or pcDNA3.1-WT1 and
harvested 4 days post-transfection, measured by real-time PCR. (B)
WT1 protein expression in 293 cells transiently transfected with
pcDNA3.1 or pcDNA3.1-WT1, measured by western blot analysis. (C)
mRNA expression of WT1, ALDH1A1, ALDH1A2,
ALDH1A3, ALDH8A1 relative to house-keeping gene
TBP in 293pc, 293pcWT1-9 and 293pcWT1-69 cells, measured by
real-time PCR. (D) Protein expression of WT1, ALDH1A2
and ALDH1A3 in 293pc, 293pcWT1-9 and 293pcWT1-69 cells,
measured by western blot analysis. β-actin and GAPDH are used as
loading control. (E) Semi-quantitative measurement of ALDH1A2 and
ALDH1A3 protein expression in (D) using ImageJ. Numbers on bars
show the relative expression value of ALDH1A2 and ALDH1A3 proteins.
293pcWT1-9 and 293pcWT1-69 cells are clones of cell lines from 293
cells stably transfected with pcDNA3.1-WT1 vector. 293pc is a cell
line from 293 cells stably transfected with pcDNA3.1 negative
control vector. RT-qPCR data are expressed as fold changes. Results
are representative of 3 separate experiments. Error bars show the
range of duplicate measurements; primer sequences are shown in
Table I. +, ALDH1A2 protein
positive control by transfection of mammalian expression vector
pReceiver-M67-ALDH1A2 to 293 cells. -, ALDH1A2 protein negative
control by transfection of pReceiver-M67 empty vector. ALDH1A1,
aldehyde dehydrogenase 1 family, member A1. *P<0.05,
**P<0.01 and ***P<0.001, compared with
their respective controls, calculated using the Student's
t-test. |
Subsequently, the 293 cells transfected with
pcDNA3.1 or pcDNA3.1-WT1 were selected with G418, resulting in
293pc and 293pcWT1 cells, respectively. The 293 cells transfected
with pcDNA3.1-WT1 were then subcloned. Two subclones of the
293pcWT1 cells with a high expression of WT1, the 293pcWT1-9 and
293pcWT1-69 cell lines, were used in the subsequent experiments.
RT-qPCR revealed that in the 293pcWT1-9 and 293pcWT1-69 cells, when
WT1 was upregulated 46.3- and 85.9-fold, ALDH1A1,
ALDH1A2, ALDH1A3 and ALDH8A1 were all
suppressed to different levels, compared to those of the control
cell line, 293pc (Fig. 2C). The
suppression fold changes in the 293pcWT1-9 and 293pcWT1-69 cells
compared to those of 293pc cells were as follows: ALDH1A1
(0.34- and 0.06-fold), ALDH1A2 (0.10- and 0.04-fold),
ALDH1A3 (0.11- and 0.04-fold) and ALDH8A1 (0.83- and
0.52-fold) (Fig. 2C).
In the 293 cells, the ALDH1A1 and
ALDH8A1 mRNA expression levels were very low and their
proteins were not detectable by western blot analysis. Therefore,
we focused on the measurement of ALDH1A2 and ALDH1A3 protein
levels. Western blot analysis revealed that when WT1 protein was
upregulated in the 293pcWT1-9 and 293pcWT1-69 cells, the protein
expression levles of both ALDH1A2 and ALDH1A3 were
suppressed, compared to the level of the control cell line, 293pc
(Fig. 2D and E).
Although WT1 mRNA expression was increased 46.3-
and 85.9-fold in the 293pcWT1-9 and 293pcWT1-69 cells, the increase
in WT1 protein expression was not proportionate with the mRNA
expression. According to the semi-quantificaton of the results of
western blot analysis using ImageJ software, the increase in WT1
protein expression was approximately 5.54- and 2.10-fold in the
293pcWT1-9 and 293pcWT1-69 cells, compared to the 293pc cells.
Thus, the overexpression of WT1 in the stable lines,
293pcWT1-9 and 293pcWT1-69, was moderate.
Conversion of all-trans retinal to atRA
is significantly inhibited by WT1
To determine whether WT1 may have an effect on
all-trans retinal to atRA conversion in the cells, HPLC was
performed. The substrate all-trans retinal at a final
concentration of 10 µmol/l was incubated for 4 h with the
negative control (with only culture medium but without cells),
293pc, 293pcWT1-9 and 293pcWT1-69, respectively. The resulting
products and remaining substrate in the culture media and cell
lysates were extracted with hexane and subjected to HPLC analysis.
The result revealed that all-trans retinal was efficiently
converted into all-trans retinol and atRA in the 293pc cells
at 4 h post-incubation (Fig. 3A and
C). The conversion of all-trans retinal into atRA was
significantly inhibited (Fig.
3A), as shown by the relative quantities of atRA, 0.0169
(19.1%) and 0.0074 (8.4%) in the 293pcWT1-9 and 293pcWT1-69 cells,
compared to 0.0884 (100%) in the 293pc cells, respectively
(Fig. 3B). The all-trans
retinal into all-trans retinol conversion in the 293pcWT1-9
and 293pcWT1-69 cells was not significantly altered compared to
that in the 293pc cells. In the no cell negative control, there was
no obvious reduction or oxidation in the substrate all-trans
retinal (Fig. 3A and B).
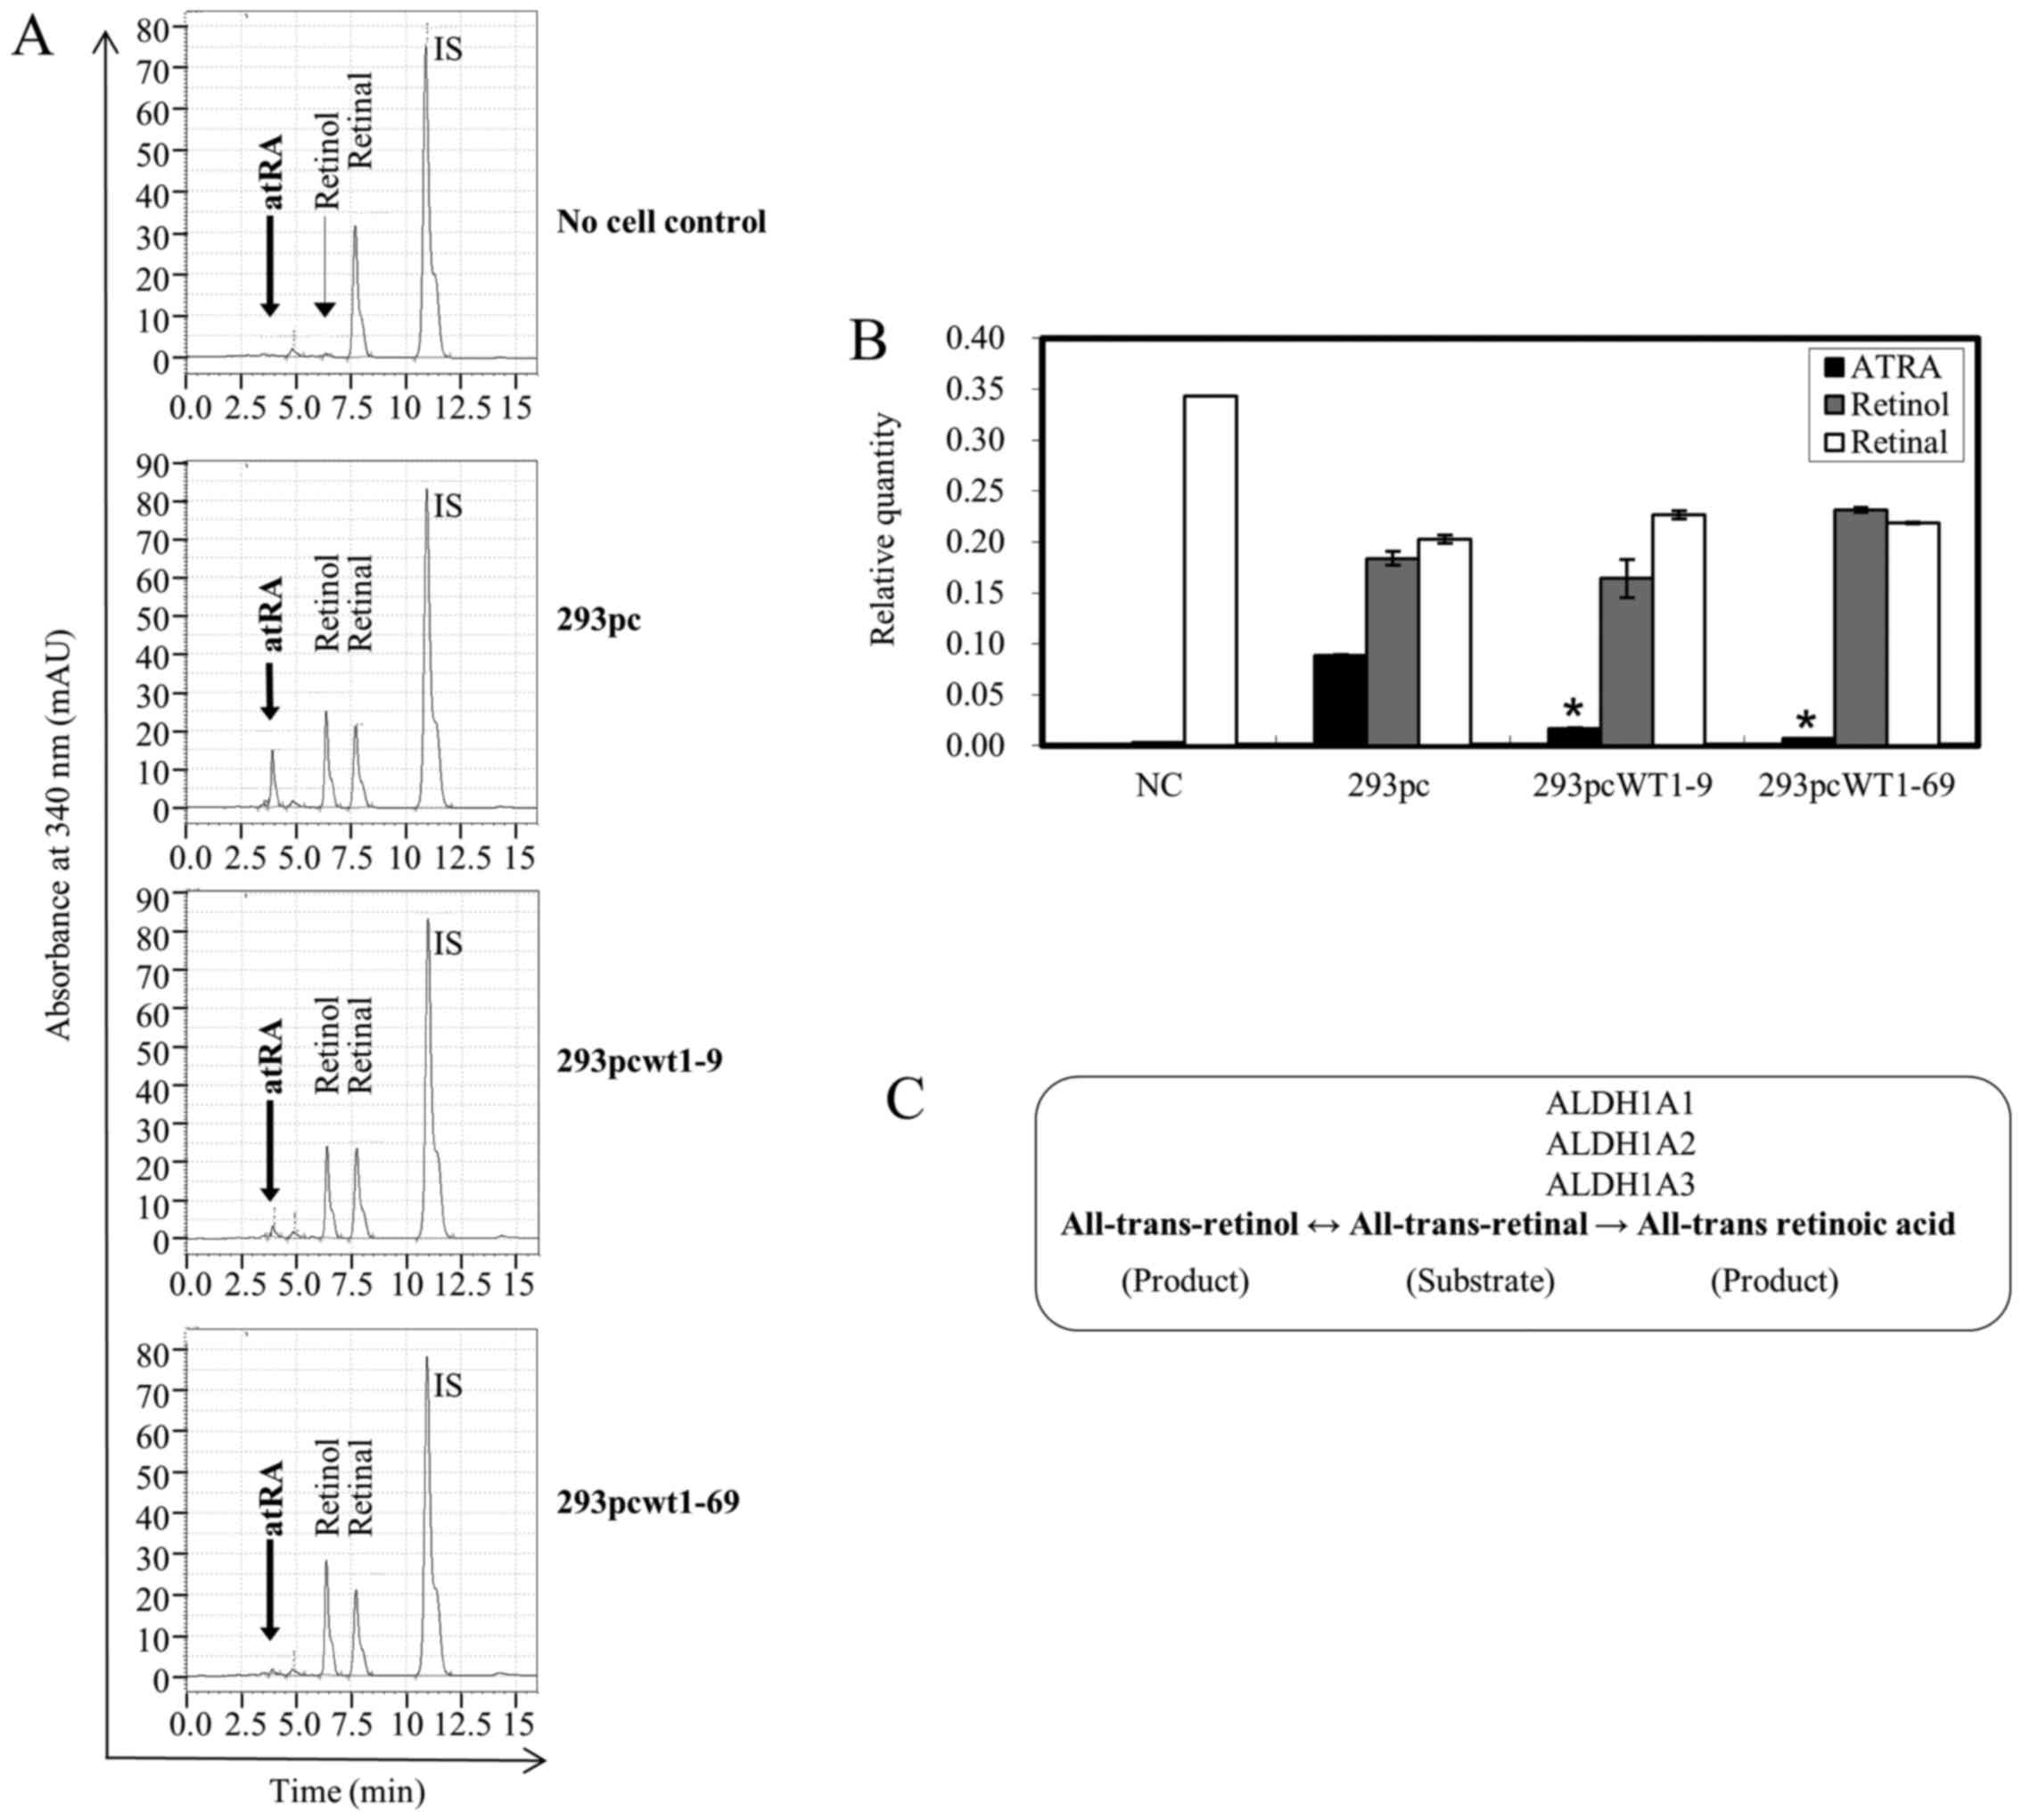 | Figure 3WT1 blocks the conversion of
all-trans retinal to all-trans retinoic acid (atRA)
analyzed by HPLC. (A) The substrate all-trans retinal at a
final concentration of 10 µmol/l was incubated for 4 h with
no cell control, 293pc control cell line, and WT1 expressing
cell lines 293pcWT1-9 and 293pcWT1-69, respectively. The substrate
and resulting products were extracted and analyzed using HPLC. The
retention time of atRA, all-trans retinol, all-trans
retinal and internal standard (IS) retinyl acetate are ~3.9, 6.4,
7.7 and 10.9 min, respectively. Results are representative of 3
separate experiments. (B) Quantitative comparison of atRA,
all-trans retinol and all-trans retinal relative to
IS according to area of each peak as shown in (A). Error bars show
the range of two separate experiments. *P<0.05 vs.
ATRA level of the 293pc cells group, calculated using the Student's
t-test. (C) atRA synthesis pathway and enzymes responsible for the
all-trans retinal to atRA conversion. |
Analysis of ALDH1A1, ALDH1A2 and ALDH1A3
promoter DNA CpG methylation
Previous studies have shown that WT1 can suppress
gene expression via an increase in DNA methylation (55) and other epigenetic mechanisms
(28,56). Promoter hypermethylation has been
observed in ALDH1A2 (57)
and ALDH1A3 (58-60). These observations led us to
hypothesize that the WT1 regulation of ALDH1A2 and
ALDH1A3 may be related to changes in promoter methylation.
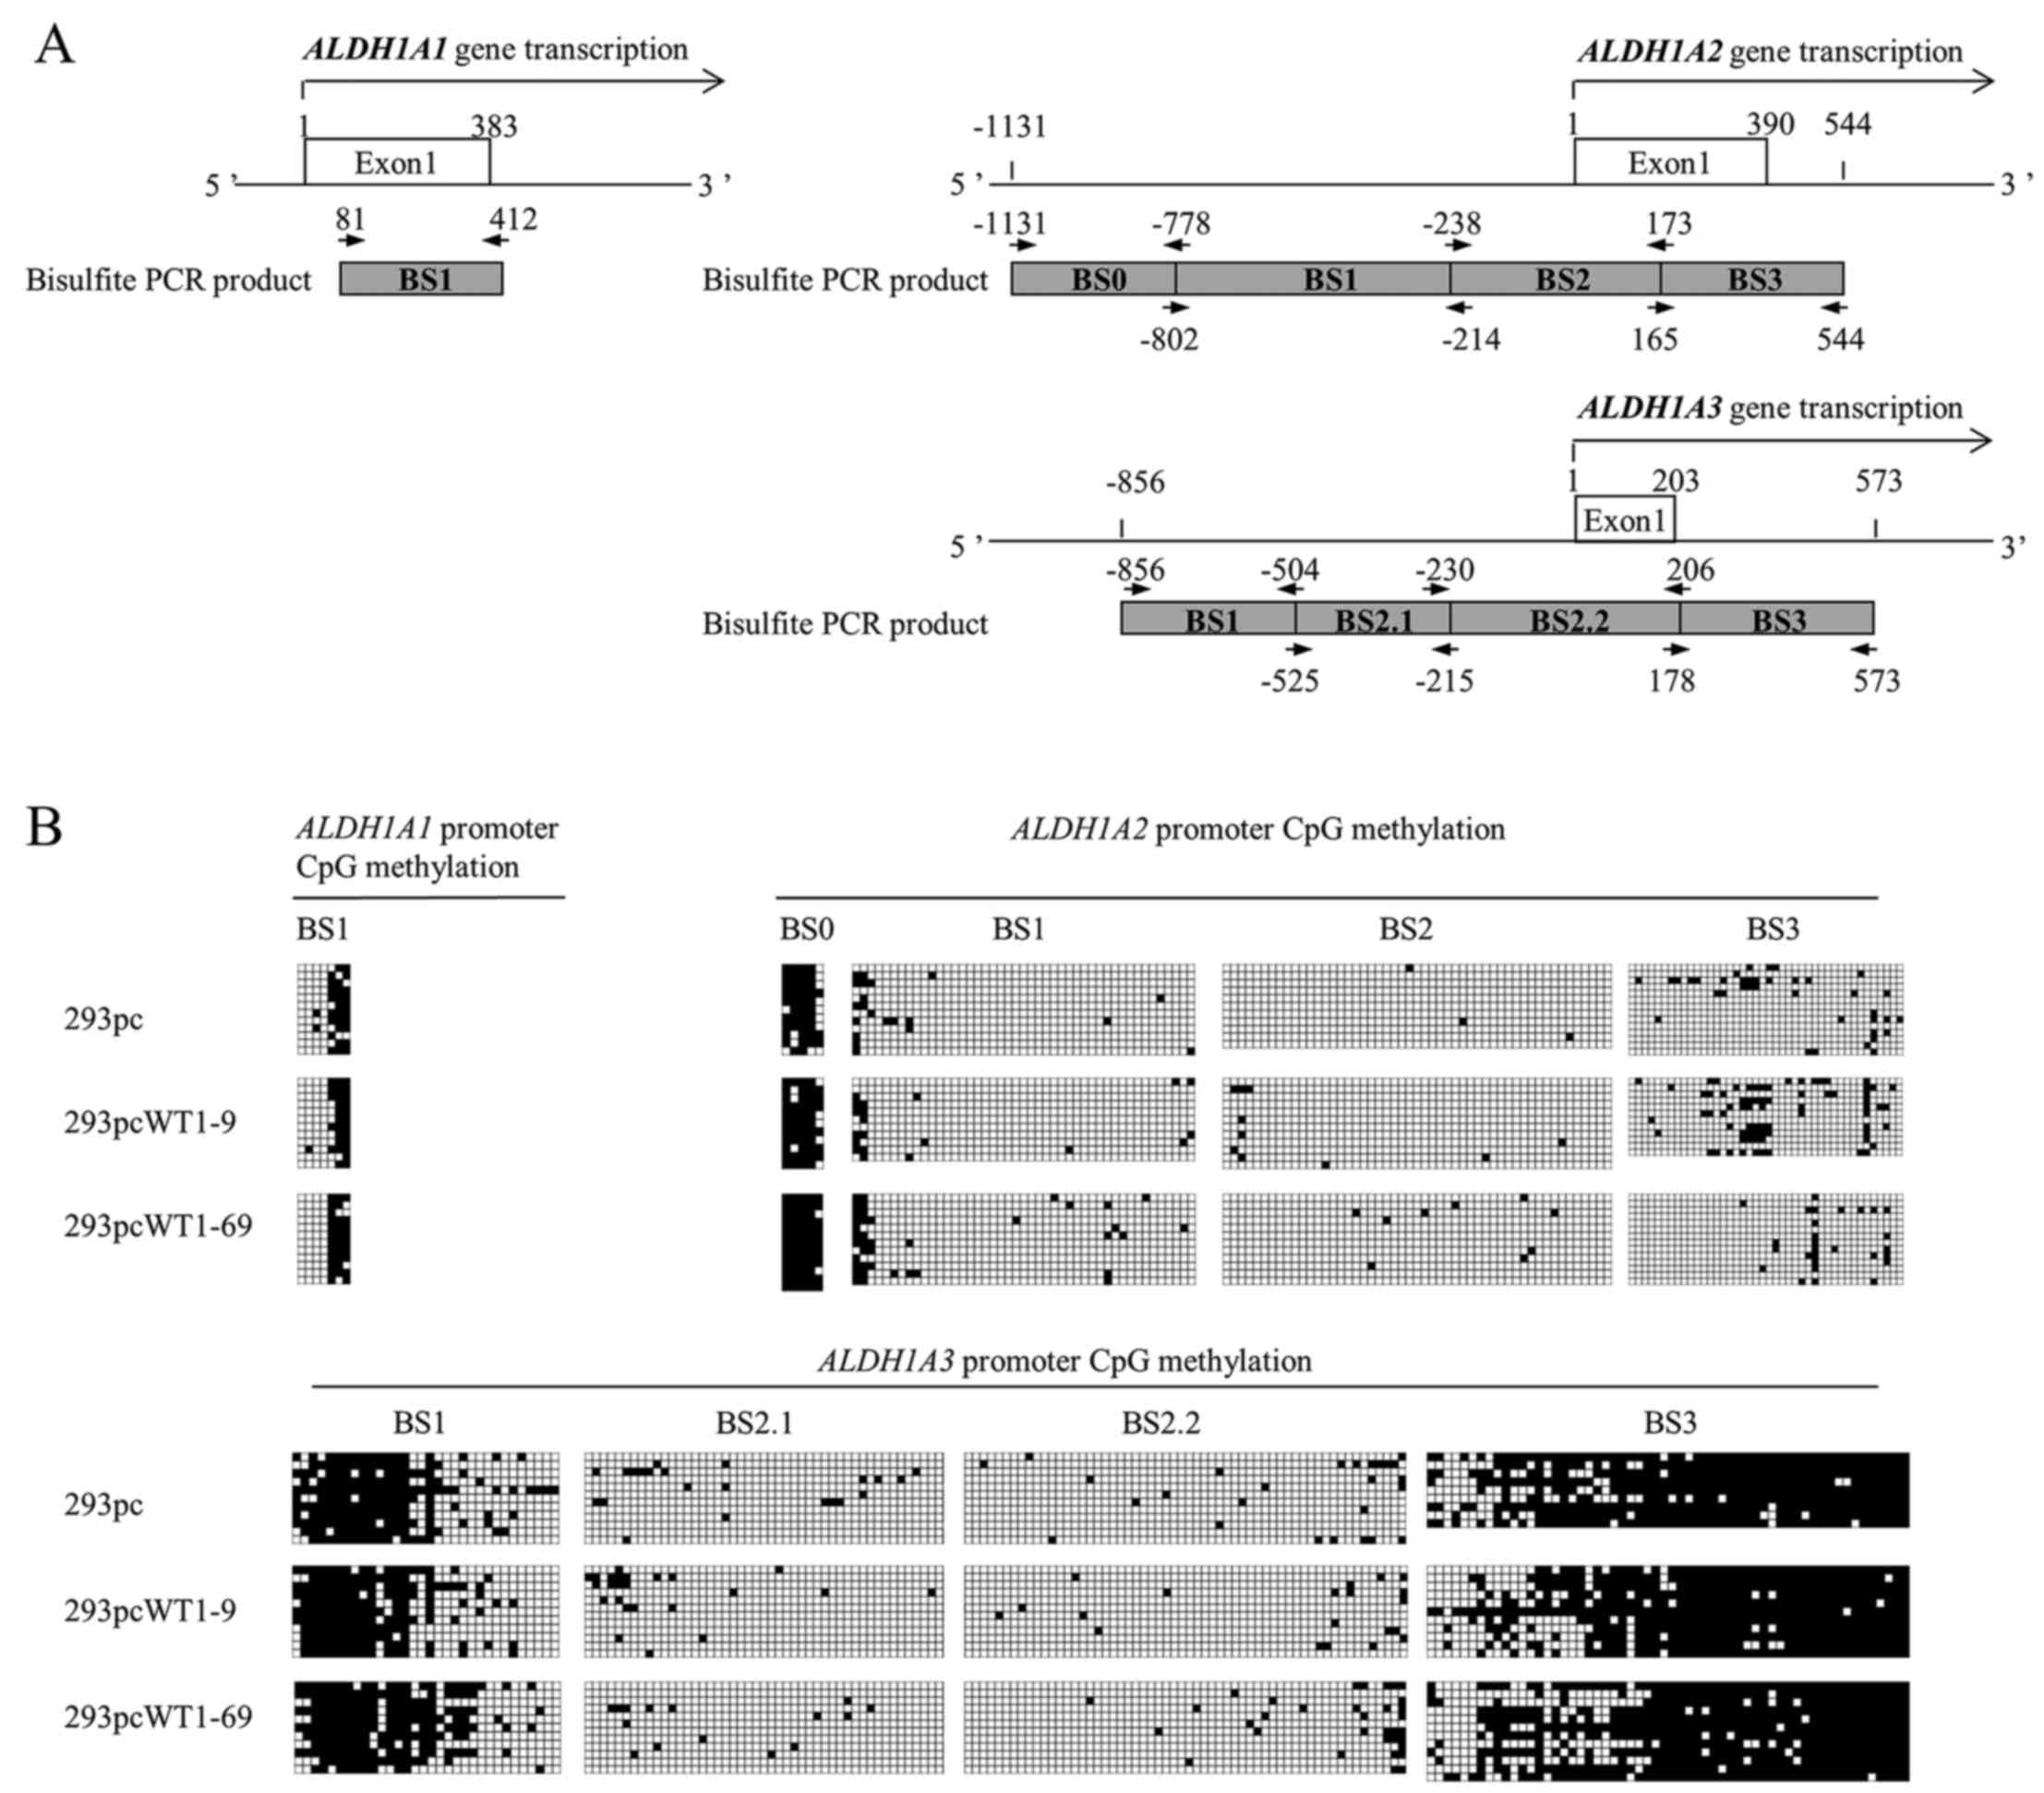
Therefore, we performed bisulfite sequencing on the promoter
regions of ALDH1A1, ALDH1A2 and ALDH1A3 in the
293pc, 293pcWT1-9 and 293pcWT1-69 cells. The results revealed that
in the core region of the ALDH1A2 promoter (ALDH1A2 BS1, BS2
and BS3), CpGs were not heavily methylated in the 293pc, 293pcWT1-9
and 293pcWT1-69 cells (Fig. 4).
This also applied to ALDH1A3, whose core promoter region
(ALDH1A3 BS2.1, BS2.2) also showed very little methylation
(Fig. 4). the ALDH1A1
promoter is not GC rich and contains no CpG island. However, a
previous study demonstrated that DNA methylation can also silence
non-CpG island promoter (61);
therefore we still included a region of the ALDH1A1 promoter
(ALDH1A1 BS1) containing more CpGs (7 CpGs) than other regions of
the promoter for CpG methylation analysis. The results revealed
that 4 CpGs at 5′ end were less methylated, and 3 CpGs at 3′ end is
heavily methylated (Fig. 4B).
However, there were no marked changes in CpG methylation in the
promoters of ALDH1A1, ALDH1A2 and ALDH1A3 in
the 293pcWT1-9 and 293pcWT1-69 cells, compared to the 293pc cells
(Fig. 4B).
ALDH1A1 is upregulated by treatment with
AZA
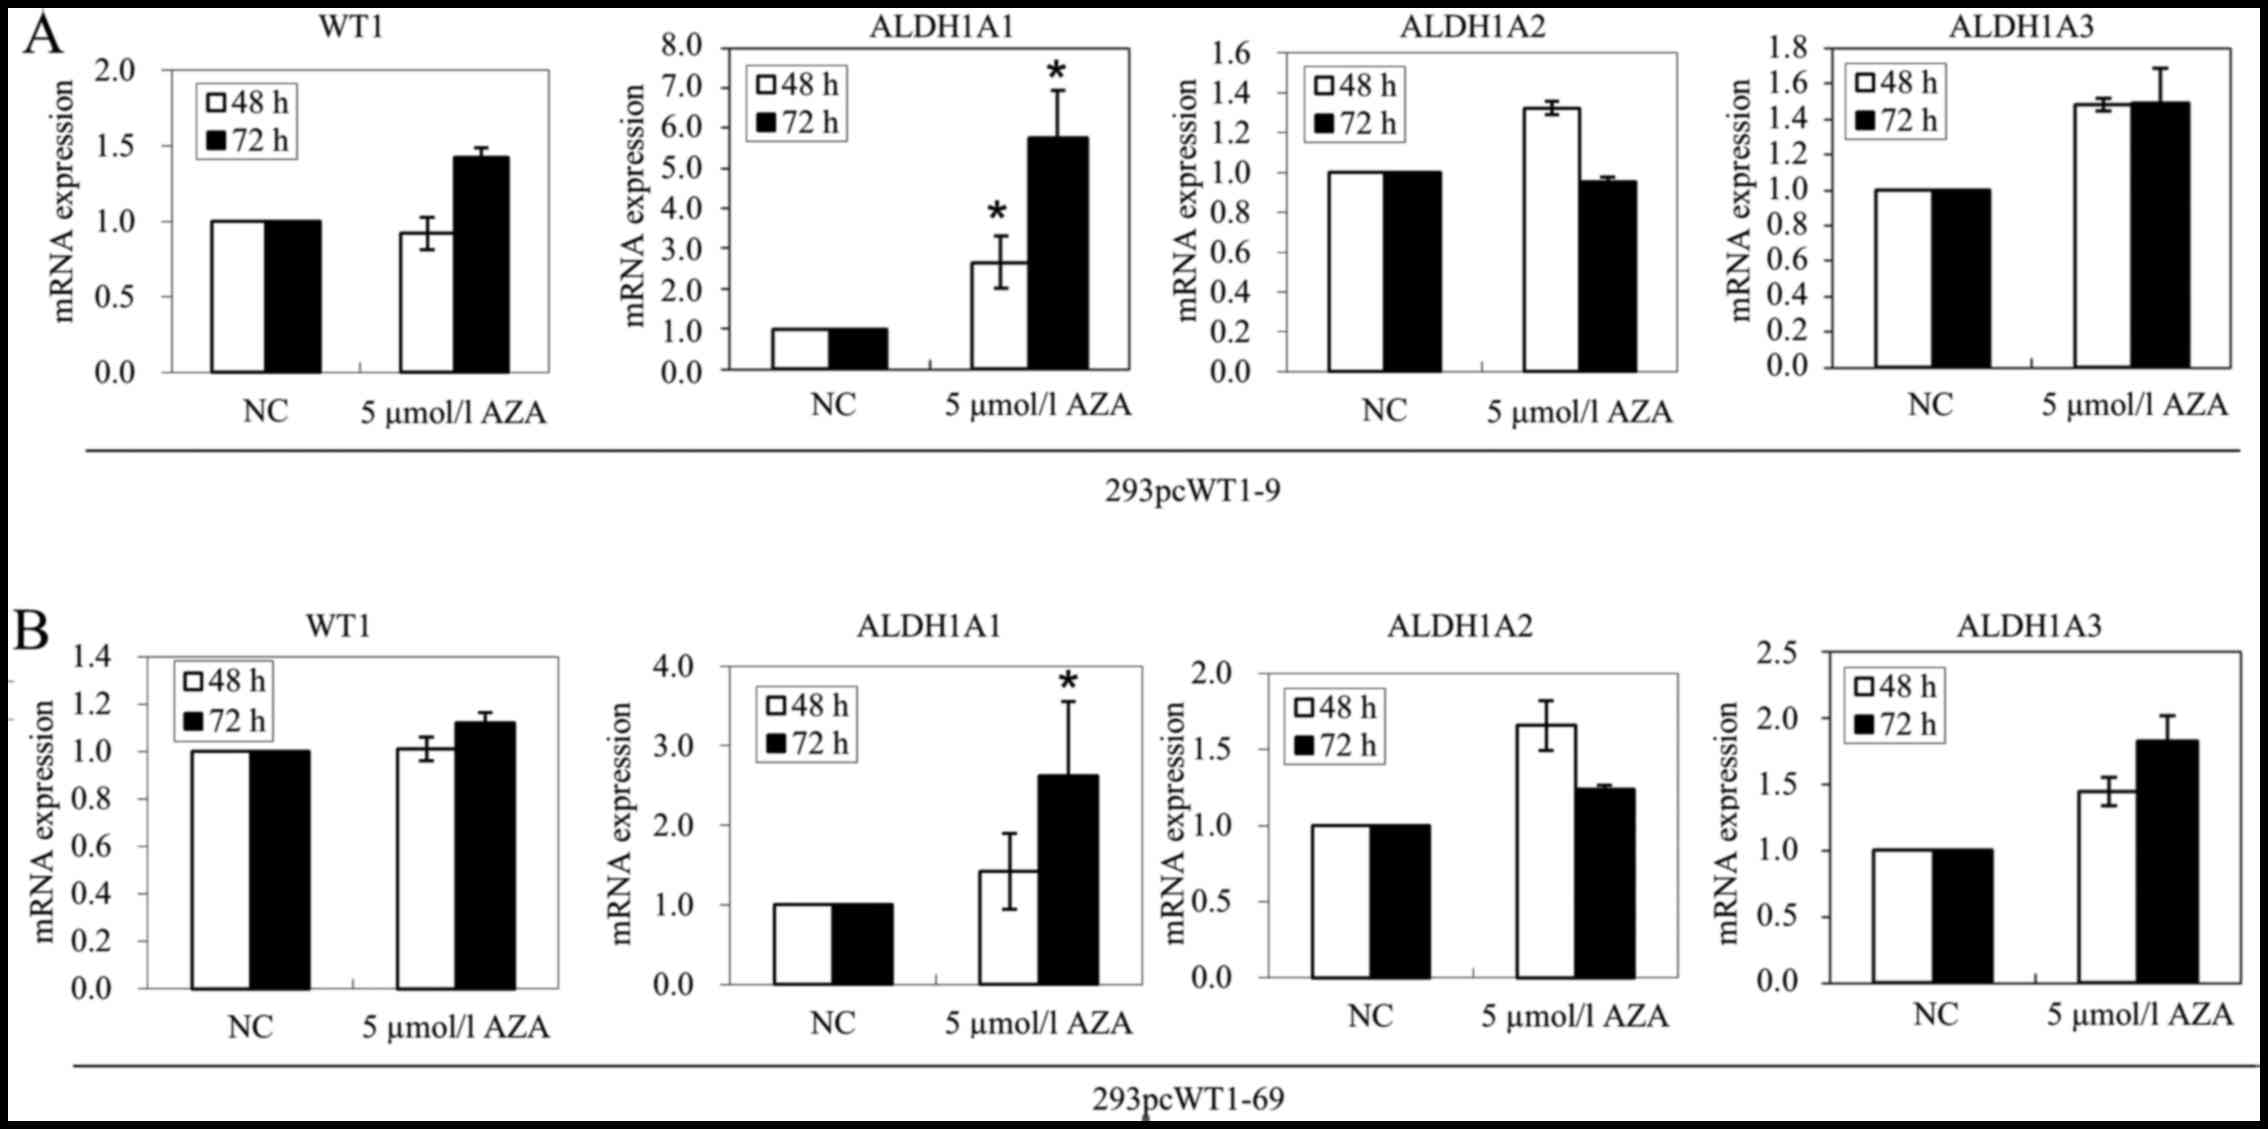
We then wished to further determine whether DNA
methylation may indeed not be related to ALDH1A1,
ALDH1A2 and ALDH1A3 suppression by WT1. We treated
the 293pcWT1-9 and 293pcWT1-69 cells with 5 µmol/l AZA or
negative control DMSO for 48 and 72 h. The results of RT-qPCR
revealed that in the 293pcWT1-9 cells treated with AZA, ALDH1A1
mRNA expression was upregulated 2.66- and 5.76-fold at 48 and 72 h,
compared to that in the DMSO control, respectively (Fig. 5A). In the 293pcWT1-69 cells
treated with AZA, ALDH1A1 mRNA expression was upregulated 1.42- and
2.63-fold at 48 and 72 h, compared to the DMSO control,
respectively (Fig. 5B). However,
treatment with 5 µmol/l AZA for 48 and 72 h had little
effect on the expression of WT1, ALDH1A2 and
ALDH1A3 in both the 293pcWT1-9 and 293pcWT1-69 cells (an
upregulation of >2-fold was considered significant) (Fig. 5).
Upregulation of ALDH1A1 by HDAC
inhibitors
HDACs are enzymes that regulate chromatin
architecture and gene expression by the removal of acetyl groups
from histone tails. Previous studies have indicated that HDACs are
potent regulators in kidney development (38,39) and are involved in the regulation
of retinoic acid signaling (62).
Therefore, we examined whether HDAC inhibitors may alleviate the
suppression of ALDH1A1, ALDH1A2 and ALDH1A3 by
WT1. The results of RT-qPCR revealed that ALDH1A1 was
markedly upregulated 142- and 200-fold in the 293pcWT1-9 cells
treated with 5 µmol/l of the HDAC inhibitor, chidamide, for
48 and 72 h, compared to that in the DMSO control, respectively
(Fig. 6A). However, chidamide had
a minor effect on the gene expression of ALDH1A2 and
ALDH1A3, in which the minor upregulation of ALDH1A2
(2.75-fold) and ALDH1A3 (1.49-fold) in 293pcWT1-9 and
293pcWT1-69 at 48 h compared to that in 293pc, was reversed to
1.97- and 1-fold at 72 h, respectively (Fig. 6A).
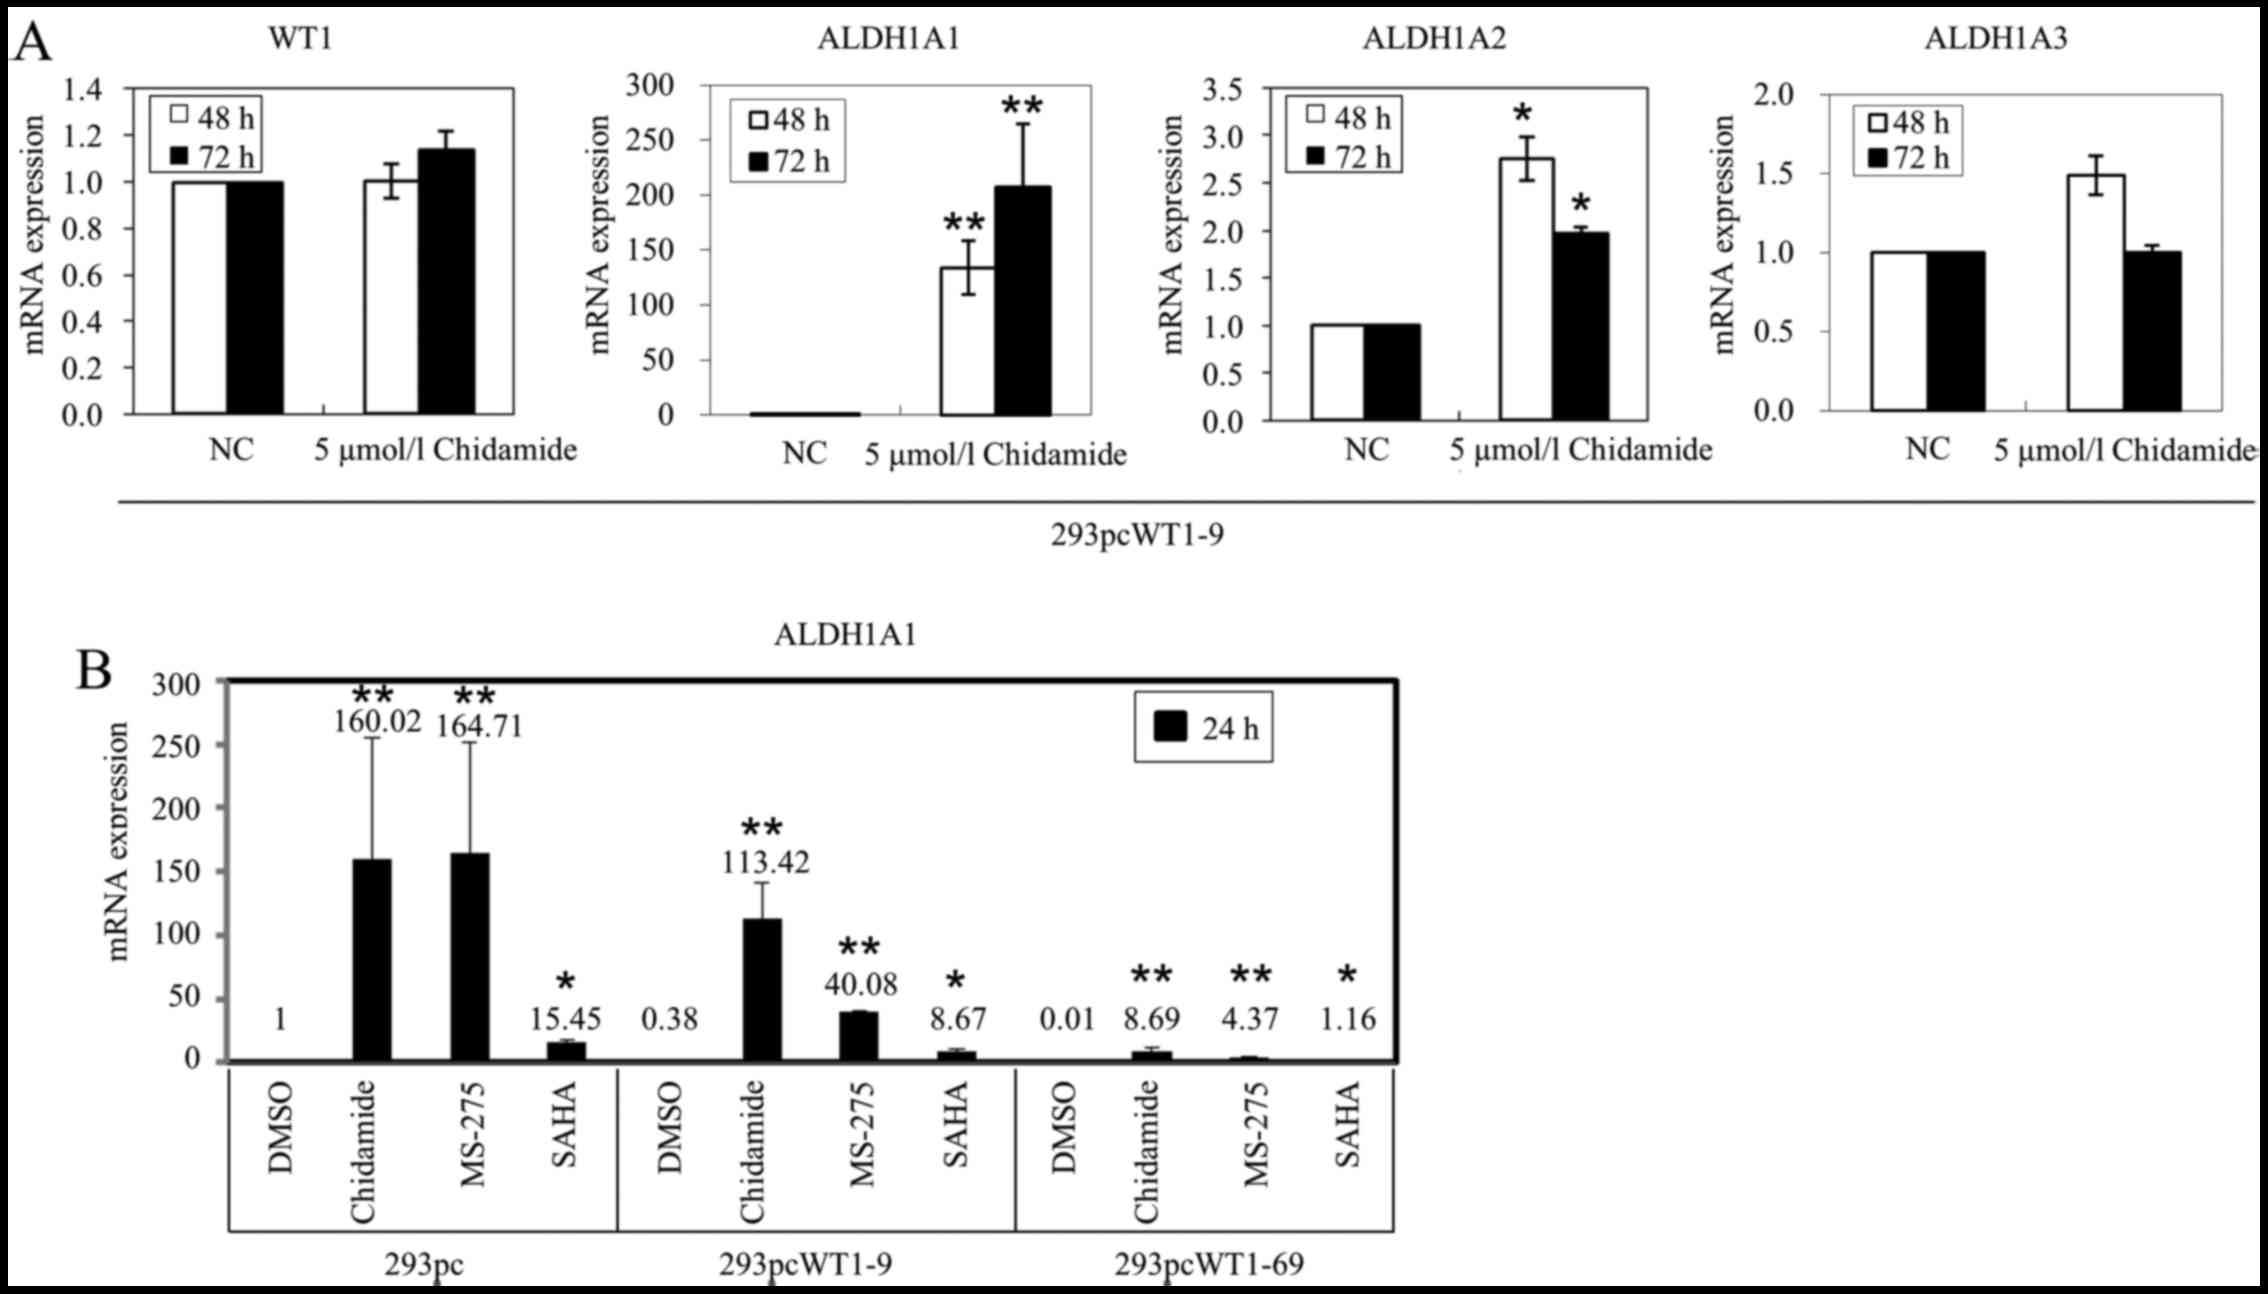 | Figure 6Effects of histone deacetylase (HDAC)
inhibitors on ALDH1A1 expression. (A) mRNA expression of
WT1, ALDH1A1, ALDH1A2 and ALDH1A3 in
293pcWT1-9 cells treated with 5 µmol/l chidamide or negative
control (NC) DMSO for 48 and 72 h, measured by real-time PCR. (B)
RT-qPCR analysis of ALDH1A1 mRNA expression in 293pc,
293pcWT1-9 and 293pcWT1-69 cells, which were treated with DMSO,
chidamide, MS-275 and SAHA (5 µmol/l each) for 24 h,
respectively. All RT-qPCR data are relative to the housekeeping
gene, TBP. Data are expressed as fold change relative to
gene expression in negative control treated with DMSO. Numbers on
each bar shows the average fold change. Results are representative
of 3 separate experiments. Error bars show the range of duplicate
measurements; primer sequences are shown in Table I. ALDH1A1, aldehyde
dehydrogenase 1 family, member A1. *P<0.05 and
**P<0.01, compared with their respective controls,
calculated using the Student's t-test. |
We then examined whether the other HDAC inhibitors,
MS-275 and SAHA, may have an effect on the regulation of
ALDH1A1 expression. Indeed, MS-275 and SAHA also strongly
activated ALDH1A1 expression in the 293pc, 293pcWT1-9 and
293pcWT1-69 cells, compared to that of each cell line treated with
DMSO, respectively (Fig. 6B).
Discussion
In this study, we demonstrated that WT1 suppressed
ALDH1A1, ALDH1A2 and ALDH1A3 expression,
leading to a marked reduction in retinoic acid synthesis. The
suppression of ALDH1A1, ALDH1A2 and ALDH1A3 by
WT1 was not related to promoter DNA CpG methylation. Furthermore,
HDAC inhibitors and AZA alleviated the suppression of
ALDH1A1 by WT1.
Previous studies have been more interested in
looking at the presence or upregulation of retinoic acid synthetic
enzymes, probably due to the indispensible roles of atRA signaling
in renal development. However, the limitation of atRA
concentrations at certain segment during renal development may also
be important, as the excess of atRA is teratogenic and can cause
hypoplastic and polycystic kidney. Gradient RA production has been
observed to be required in development of paraxial mesoderm
(21), intestine, hindbrain
(20) and limb (22). The uneven distribution of retinoic
acid can be achieved by the expression of atRA degradation CYP26
enzymes (18,19). In the present study, we provide
evidence to indicate that WT1 overexpression suppresses the
expression of ALDH1A1, ALDH1A2 and ALDH1A3 in
293 cells in vitro, and present data to indicate that HDACs
suppress ALDH1A1, proposing an additional candidate
mechanism that may limit atRA overproduction.
The result that WT1 can suppress ALDH1A2
expression in 293 cells is in contrast to that of previous studies,
showing that Wt1 upregulates Aldh1a2 in the embryonic
epicardium (36) and coelomic
cells lining the embryonic liver (35). The suppression of ALDH1A1
by WT1 is also in contrast to the findings of a previous study,
showing that the knockout of Wt1 leads to the downregulation
of Aldh1a1 in the developing gonad (37). These data suggest that
ALDH1A2 and ALDH1A1 regulation by WT1 is cell
context-dependent. It is not known whether WT1 cofactors or
'chromatin flip-flop' effect may be involved in the difference of
WT1 regulation of ALDH1A2 and ALDH1A1.
It has been shown that WT1 directly upregulated
ALDH1A2 expression (36),
but the biochemical net output of atRA production regulated by WT1
has not been shown. In this study, we demonstrate that WT1
stable expression leads to the suppression of retinal to atRA
conversion demonstrated by HPLC. To the best of our knowledge, this
is the first direct evidence showing that WT1 can regulate atRA
generation.
We did not find any significant changes in the
methylation status of ALDH1A2 and ALDH1A3 promoters
in the 293 cells transfected with WT1. However, we observed
that ALDH1A3 promoter was more methylated in regions
flanking its core promoter in 293 cells (Fig. 4B), while its core region of
promoter was not heavily methylated (Fig. 4B), which is in accordance with its
expression state in 293 cells (Fig.
1B and D). Although the promoter methylation of ALDH1A2
(57) and ALDH1A3
(58–60) occurs in cancers, the WT1
regulation of ALDH1A2 and ALDH1A3 in 293 cells is not
dependent on the promoter DNA methylation pathway, suggesting that
DNA methylation machinery may not be involved in the control of
ALDH1A2 and ALDH1A3 expression by WT1. This was
further examined by AZA treatment, which did not significantly
alter ALDH1A2 and ALDH1A3 expression in 293pcWT1-9
and 293pcWT1-69 cells (Fig. 5).
The ALDH1A1 promoter is not GC rich and has no CpG island.
We demonstrated that ALDH1A1 promoter methylation exhibited
little change in WT1-transfected 293 cells (Fig. 4B). However it is intriguing to
note that ALDH1A1 expression was upregulated by AZA
treatment at 48 and 72 h, suggesting that epigenetic related
mechanisms may still be involved in ALDH1A1 expression in
293 cells.
In this study, although we did not find evidence
that the WT1 regulation of ALDH1A1, ALDH1A2 and
ALDH1A3 was associated with DNA hypermethylation, we
observed that histone deacetylation was a strong regulator of
ALDH1A1 expression. We also demonstrated that ALDH1A1
expression in the 293pcWT1-9 and 293pcWT1-69 cells treated with
HDAC inhibitors was higher than that in the cells treated with DMSO
control (Fig. 6), suggesting that
the suppressive effect of WT1 on ALDH1A1 expression can be
abrogated by HDAC inhibitors. HDAC inhibitors markedly activated
ALDH1A1 expression in 293 cells with or without WT1 stable
expression (Fig. 6B), suggesting
that a high level of histone deacetylase alone may be a major
epigenetic regulator responsible for the very low expression of
ALDH1A1 in 293 cells, which may reflect the lack of
Aldh1a1 expression in the developing metanephric mesenchyme
cell lineage that finally differentiates into glomerular podocytes.
It has been shown that HDAC inhibitors are strong regulators of
kidney development and disease (38,39). In a previous study, kidney
rudiments treated with the HDAC inhibitors, trichostatin A (TSA),
scriptaid or MS-275 exhibited stunted ureteric bud branching
(39). HDAC1, HDAC2 and HDAC3
proteins are all expressed in mouse kidneys on embryonic day 17
(E17) and post-natal day 1 (P1) and decline as the mouse matures.
HDAC1 and HDAC2 proteins are enriched in less differentiated
nephron structures (39). The
HDAC3 expression pattern is similar to that of HDAC1 and HDAC2,
except that it is also localized in glomerular podocytes (39,63,64). Proteins of acetylated histone 3
and acetylated histone 4 are expressed in mouse kidneys on E17, P1,
P20 and adults (39). These data
suggest that HDACs play a key role in renal development. Of note,
the inhibition of HDACs by TSA in articular chondrocytes cells
derived from new born rats has been shown to increase the retinoic
acid signal, which suppresses Sox9 transcription (62). It is not known in the fetal kidney
context, whether HDAC inhibitors may also result in an increase in
RA signaling, which may due to ALDH1A1 upregulation and more
production of atRA. Future studies need to address whether
ALDH1A1 may be a crucial target that mediates the roles of
HDACs and its inhibitors in kidney development and disease.
The regulation of ALDH1A2 in fetal kidney
cells is complex and is very likely to involve more than one
regulatory factor. For example, the transient and strong expression
of ALDH1A2 in the visceral layer of the glomerulus of the
stage III nephron may due to the effect of other unknown
transcription factors or the activation effect of WT1. The result
that ALDH1A2 was suppressed by WT1 in the 293 cells may be
relevant to the downregulation of Aldh1a2 in podocytes of
the stage IV nephron, in which Wt1 is progressively
upregulated.
Acknowledgments
We would like to thank Dr Herman Yeger (Hospital
for Sick Children, Toronto, Canada) for allowing us to use the
WiT49 cell line. We would also like to thank Drs Mei-Hong LI and
Fernando Ferrer (Center for Vascular Biology, University of
Connecticut Health Center, Farmington, CT, USA) for shipping us
this cell line. This study was funded by the National Natural
Science Foundation of China (no. 31100943), the Shenzhen City
Science and Technology Project (no. 201102136) and the Shenzhen
Nanshan Science and Technology Research Funds (nos. 2010012 and
2014009).
References
|
1
|
Duester G: Retinoic acid synthesis and
signaling during early organogenesis. Cell. 134:921–931. 2008.
View Article : Google Scholar : PubMed/NCBI
|
|
2
|
Gudas LJ: Emerging roles for retinoids in
regeneration and differentiation in normal and disease states.
Biochim Biophys Acta. 1821:213–221. 2012. View Article : Google Scholar
|
|
3
|
Tang XH and Gudas LJ: Retinoids, retinoic
acid receptors, and cancer. Annu Rev Pathol. 6:345–364. 2011.
View Article : Google Scholar
|
|
4
|
Dollé P: Developmental expression of
retinoic acid receptors (RARs). Nucl Recept Signal.
7:e0062009.PubMed/NCBI
|
|
5
|
Napoli JL: Physiological insights into
all-trans-retinoic acid biosynthesis. Biochim Biophys Acta.
1821:152–167. 2012. View Article : Google Scholar
|
|
6
|
Fan X, Molotkov A, Manabe S, Donmoyer CM,
Deltour L, Foglio MH, Cuenca AE, Blaner WS, Lipton SA and Duester
G: Targeted disruption of Aldh1a1 (Raldh1) provides evidence for a
complex mechanism of retinoic acid synthesis in the developing
retina. Mol Cell Biol. 23:4637–4648. 2003. View Article : Google Scholar : PubMed/NCBI
|
|
7
|
Zhao D, McCaffery P, Ivins KJ, Neve RL,
Hogan P, Chin WW and Dräger UC: Molecular identification of a major
retinoic-acid-synthesizing enzyme, a retinaldehyde-specific
dehydrogenase. Eur J Biochem. 240:15–22. 1996. View Article : Google Scholar : PubMed/NCBI
|
|
8
|
Wang X, Penzes P and Napoli JL: Cloning of
a cDNA encoding an aldehyde dehydrogenase and its expression in
Escherichia coli. Recognition of retinal as substrate. J Biol Chem.
271:16288–16293. 1996. View Article : Google Scholar : PubMed/NCBI
|
|
9
|
Sima A, Parisotto M, Mader S and Bhat PV:
Kinetic characterization of recombinant mouse retinal dehydrogenase
types 3 and 4 for retinal substrates. Biochim Biophys Acta.
1790:1660–1664. 2009. View Article : Google Scholar : PubMed/NCBI
|
|
10
|
Grün F, Hirose Y, Kawauchi S, Ogura T and
Umesono K: Aldehyde dehydrogenase 6, a cytosolic retinaldehyde
dehydrogenase prominently expressed in sensory neuroepithelia
during development. J Biol Chem. 275:41210–41218. 2000. View Article : Google Scholar : PubMed/NCBI
|
|
11
|
Dressler GR: Advances in early kidney
specification, development and patterning. Development.
136:3863–3874. 2009. View Article : Google Scholar : PubMed/NCBI
|
|
12
|
Davidson A: Mouse kidney development.
StemBook. 2008. View Article : Google Scholar
|
|
13
|
Mendelsohn C, Batourina E, Fung S, Gilbert
T and Dodd J: Stromal cells mediate retinoid-dependent functions
essential for renal development. Development. 126:1139–1148.
1999.PubMed/NCBI
|
|
14
|
Rosselot C, Spraggon L, Chia I, Batourina
E, Riccio P, Lu B, Niederreither K, Dolle P, Duester G, Chambon P,
et al: Non-cell-autonomous retinoid signaling is crucial for renal
development. Development. 137:283–292. 2010. View Article : Google Scholar :
|
|
15
|
Batourina E, Gim S, Bello N, Shy M,
Clagett-Dame M, Srinivas S, Costantini F and Mendelsohn C: Vitamin
A controls epithelial/mesenchymal interactions through Ret
expression. Nat Genet. 27:74–78. 2001. View
Article : Google Scholar : PubMed/NCBI
|
|
16
|
Lee LM, Leung CY, Tang WW, Choi HL, Leung
YC, McCaffery PJ, Wang CC, Woolf AS and Shum AS: A paradoxical
teratogenic mechanism for retinoic acid. Proc Natl Acad Sci USA.
109:13668–13673. 2012. View Article : Google Scholar : PubMed/NCBI
|
|
17
|
Wingert RA, Selleck R, Yu J, Song HD, Chen
Z, Song A, Zhou Y, Thisse B, Thisse C, McMahon AP, et al: The cdx
genes and retinoic acid control the positioning and segmentation of
the zebrafish pronephros. PLoS Genet. 3:1922–1938. 2007. View Article : Google Scholar : PubMed/NCBI
|
|
18
|
Abu-Abed S, Dollé P, Metzger D, Beckett B,
Chambon P and Petkovich M: The retinoic acid-metabolizing enzyme,
CYP26A1, is essential for normal hindbrain patterning, vertebral
identity, and development of posterior structures. Genes Dev.
15:226–240. 2001. View Article : Google Scholar : PubMed/NCBI
|
|
19
|
Hernandez RE, Putzke AP, Myers JP,
Margaretha L and Moens CB: Cyp26 enzymes generate the retinoic acid
response pattern necessary for hindbrain development. Development.
134:177–187. 2007. View Article : Google Scholar :
|
|
20
|
Godsave SF, Koster CH, Getahun A, Mathu M,
Hooiveld M, van der Wees J, Hendriks J and Durston AJ: Graded
retinoid responses in the developing hindbrain. Dev Dyn. 213:39–49.
1998. View Article : Google Scholar : PubMed/NCBI
|
|
21
|
Rhinn M and Dollé P: Retinoic acid
signalling during development. Development. 139:843–858. 2012.
View Article : Google Scholar : PubMed/NCBI
|
|
22
|
Yashiro K, Zhao X, Uehara M, Yamashita K,
Nishijima M, Nishino J, Saijoh Y, Sakai Y and Hamada H: Regulation
of retinoic acid distribution is required for proximodistal
patterning and outgrowth of the developing mouse limb. Dev Cell.
6:411–422. 2004. View Article : Google Scholar : PubMed/NCBI
|
|
23
|
Haselbeck RJ, Hoffmann I and Duester G:
Distinct functions for Aldh1 and Raldh2 in the control of ligand
production for embryonic retinoid signaling pathways. Dev Genet.
25:353–364. 1999. View Article : Google Scholar : PubMed/NCBI
|
|
24
|
Niederreither K, Fraulob V, Garnier JM,
Chambon P and Dollé P: Differential expression of retinoic
acid-synthesizing (RALDH) enzymes during fetal development and
organ differentiation in the mouse. Mech Dev. 110:165–171. 2002.
View Article : Google Scholar
|
|
25
|
Marlier A and Gilbert T: Expression of
retinoic acid-synthesizing and -metabolizing enzymes during
nephrogenesis in the rat. Gene Expr Patterns. 5:179–185. 2004.
View Article : Google Scholar : PubMed/NCBI
|
|
26
|
Hohenstein P and Hastie ND: The many
facets of the Wilms' tumour gene, WT1. Hum Mol Genet. 15:R196–R201.
2006. View Article : Google Scholar : PubMed/NCBI
|
|
27
|
Roberts SGE: Transcriptional regulation by
WT1 in development. Curr Opin Genet Dev. 15:542–547. 2005.
View Article : Google Scholar : PubMed/NCBI
|
|
28
|
Essafi A, Webb A, Berry RL, Slight J, Burn
SF, Spraggon L, Velecela V, Martinez-Estrada OM, Wiltshire JH,
Roberts SG, et al: A wt1-controlled chromatin switching mechanism
underpins tissue-specific wnt4 activation and repression. Dev Cell.
21:559–574. 2011. View Article : Google Scholar : PubMed/NCBI
|
|
29
|
Haber DA, Sohn RL, Buckler AJ, Pelletier
J, Call KM and Housman DE: Alternative splicing and genomic
structure of the Wilms tumor gene WT1. Proc Natl Acad Sci USA.
88:9618–9622. 1991. View Article : Google Scholar : PubMed/NCBI
|
|
30
|
Larsson SH, Charlieu JP, Miyagawa K,
Engelkamp D, Rassoulzadegan M, Ross A, Cuzin F, van Heyningen V and
Hastie ND: Subnuclear localization of WT1 in splicing or
transcription factor domains is regulated by alternative splicing.
Cell. 81:391–401. 1995. View Article : Google Scholar : PubMed/NCBI
|
|
31
|
Armstrong JF, Pritchard-Jones K, Bickmore
WA, Hastie ND and Bard JB: The expression of the Wilms' tumour
gene, WT1, in the developing mammalian embryo. Mech Dev. 40:85–97.
1993. View Article : Google Scholar : PubMed/NCBI
|
|
32
|
Pritchard-Jones K, Fleming S, Davidson D,
Bickmore W, Porteous D, Gosden C, Bard J, Buckler A, Pelletier J,
Housman D, et al: The candidate Wilms' tumour gene is involved in
genitourinary development. Nature. 346:194–197. 1990. View Article : Google Scholar : PubMed/NCBI
|
|
33
|
Kreidberg JA, Sariola H, Loring JM, Maeda
M, Pelletier J, Housman D and Jaenisch R: WT-1 is required for
early kidney development. Cell. 74:679–691. 1993. View Article : Google Scholar : PubMed/NCBI
|
|
34
|
von Gise A, Zhou B, Honor LB, Ma Q, Petryk
A and Pu WT: WT1 regulates epicardial epithelial to mesenchymal
transition through β-catenin and retinoic acid signaling pathways.
Dev Biol. 356:421–431. 2011. View Article : Google Scholar : PubMed/NCBI
|
|
35
|
Norden J, Grieskamp T, Lausch E, van Wijk
B, van den Hoff MJ, Englert C, Petry M, Mommersteeg MT,
Christoffels VM, Niederreither K, et al: Wt1 and retinoic acid
signaling in the subcoelomic mesenchyme control the development of
the pleuropericardial membranes and the sinus horns. Circ Res.
106:1212–1220. 2010. View Article : Google Scholar : PubMed/NCBI
|
|
36
|
Guadix JA, Ruiz-Villalba A, Lettice L,
Velecela V, Muñoz-Chápuli R, Hastie ND, Pérez-Pomares JM and
Martínez-Estrada OM: Wt1 controls retinoic acid signalling in
embryonic epicardium through transcriptional activation of Raldh2.
Development. 138:1093–1097. 2011. View Article : Google Scholar : PubMed/NCBI
|
|
37
|
Klattig J, Sierig R, Kruspe D, Makki MS
and Englert C: WT1-mediated gene regulation in early urogenital
ridge development. Sex Dev. 1:238–254. 2007. View Article : Google Scholar
|
|
38
|
Brilli LL, Swanhart LM, de Caestecker MP
and Hukriede NA: HDAC inhibitors in kidney development and disease.
Pediatr Nephrol. 28:1909–1921. 2013. View Article : Google Scholar :
|
|
39
|
Chen S, Bellew C, Yao X, Stefkova J, Dipp
S, Saifudeen Z, Bachvarov D and El-Dahr SS: Histone deacetylase
(HDAC) activity is critical for embryonic kidney gene expression,
growth, and differentiation. J Biol Chem. 286:32775–32789. 2011.
View Article : Google Scholar : PubMed/NCBI
|
|
40
|
Hu E, Dul E, Sung CM, Chen Z, Kirkpatrick
R, Zhang GF, Johanson K, Liu R, Lago A, Hofmann G, et al:
Identification of novel isoform-selective inhibitors within class I
histone deacetylases. J Pharmacol Exp Ther. 307:720–728. 2003.
View Article : Google Scholar : PubMed/NCBI
|
|
41
|
Liu L, Chen B, Qin S, Li S, He X, Qiu S,
Zhao W and Zhao H: A novel histone deacetylase inhibitor Chidamide
induces apoptosis of human colon cancer cells. Biochem Biophys Res
Commun. 392:190–195. 2010. View Article : Google Scholar : PubMed/NCBI
|
|
42
|
Khan O and La Thangue NB: HDAC inhibitors
in cancer biology: Emerging mechanisms and clinical applications.
Immunol Cell Biol. 90:85–94. 2012. View Article : Google Scholar
|
|
43
|
Graham FL, Smiley J, Russell WC and Nairn
R: Characteristics of a human cell line transformed by DNA from
human adenovirus type 5. J Gen Virol. 36:59–74. 1977. View Article : Google Scholar : PubMed/NCBI
|
|
44
|
Alami J, Williams BR and Yeger H:
Derivation and characterization of a Wilms' tumour cell line, WiT
49. Int J Cancer. 107:365–374. 2003. View Article : Google Scholar : PubMed/NCBI
|
|
45
|
Wang C, Kane MA and Napoli JL: Multiple
retinol and retinal dehydrogenases catalyze all-trans-retinoic acid
biosynthesis in astrocytes. J Biol Chem. 286:6542–6553. 2011.
View Article : Google Scholar
|
|
46
|
Kane MA, Chen N, Sparks S and Napoli JL:
Quantification of endogenous retinoic acid in limited biological
samples by LC/MS/MS. Biochem J. 388:363–369. 2005. View Article : Google Scholar : PubMed/NCBI
|
|
47
|
Huang DY and Ichikawa Y: Purification and
characterization of a novel cytosolic NADP(H)-dependent retinol
oxidoreductase from rabbit liver. Biochim Biophys Acta. 1338:47–59.
1997. View Article : Google Scholar : PubMed/NCBI
|
|
48
|
Yang YM, Huang DY, Liu GF, Zhong JC, Du K,
Li YF and Song XH: Effects of 2,3,7,8-tetrachlorodibenzo-p-dioxin
on vitamin A metabolism in mice. J Biochem Mol Toxicol. 19:327–335.
2005. View Article : Google Scholar : PubMed/NCBI
|
|
49
|
Li LC and Dahiya R: MethPrimer: Designing
primers for methylation PCRs. Bioinformatics. 18:1427–1431. 2002.
View Article : Google Scholar : PubMed/NCBI
|
|
50
|
Carr IM, Valleley EM, Cordery SF, Markham
AF and Bonthron DT: Sequence analysis and editing for bisulphite
genomic sequencing projects. Nucleic Acids Res. 35:e792007.
View Article : Google Scholar : PubMed/NCBI
|
|
51
|
Schneider CA, Rasband WS and Eliceiri KW:
NIH Image to ImageJ: 25 years of image analysis. Nat Methods.
9:671–675. 2012. View Article : Google Scholar : PubMed/NCBI
|
|
52
|
Brown KW and Malik KT: The molecular
biology of Wilms tumour. Expert Rev Mol Med. 2001:1–16. 2001.
|
|
53
|
Lin M, Zhang M, Abraham M, Smith SM and
Napoli JL: Mouse retinal dehydrogenase 4 (RALDH4), molecular
cloning, cellular expression, and activity in 9-cis-retinoic acid
biosynthesis in intact cells. J Biol Chem. 278:9856–9861. 2003.
View Article : Google Scholar : PubMed/NCBI
|
|
54
|
Lee SB, Huang K, Palmer R, Truong VB,
Herzlinger D, Kolquist KA, Wong J, Paulding C, Yoon SK, Gerald W,
et al: The Wilms tumor suppressor WT1 encodes a transcriptional
activator of amphiregulin. Cell. 98:663–673. 1999. View Article : Google Scholar : PubMed/NCBI
|
|
55
|
Szemes M, Dallosso AR, Melegh Z, Curry T,
Li Y, Rivers C, Uney J, Mägdefrau AS, Schwiderski K, Park JH, et
al: Control of epigenetic states by WT1 via regulation of de novo
DNA methyltransferase 3A. Hum Mol Genet. 22:74–83. 2013. View Article : Google Scholar
|
|
56
|
Xu B, Zeng DQ, Wu Y, Zheng R, Gu L, Lin X,
Hua X and Jin GH: Tumor suppressor menin represses paired box gene
2 expression via Wilms tumor suppressor protein-polycomb group
complex. J Biol Chem. 286:13937–13944. 2011. View Article : Google Scholar : PubMed/NCBI
|
|
57
|
Kim H, Lapointe J, Kaygusuz G, Ong DE, Li
C, van de Rijn M, Brooks JD and Pollack JR: The retinoic acid
synthesis gene ALDH1a2 is a candidate tumor suppressor in prostate
cancer. Cancer Res. 65:8118–8124. 2005. View Article : Google Scholar : PubMed/NCBI
|
|
58
|
Zhang W, Yan W, You G, Bao Z, Wang Y, Liu
Y, You Y and Jiang T: Genome-wide DNA methylation profiling
identifies ALDH1A3 promoter methylation as a prognostic predictor
in G-CIMP-primary glioblastoma. Cancer Lett. 328:120–125. 2013.
View Article : Google Scholar
|
|
59
|
Kim YJ, Yoon HY, Kim JS, Kang HW, Min BD,
Kim SK, Ha YS, Kim IY, Ryu KH, Lee SC, et al: HOXA9, ISL1 and
ALDH1A3 methylation patterns as prognostic markers for nonmuscle
invasive bladder cancer: Array-based DNA methylation and expression
profiling. Int J Cancer. 133:1135–1142. 2013. View Article : Google Scholar : PubMed/NCBI
|
|
60
|
Shames DS, Girard L, Gao B, Sato M, Lewis
CM, Shivapurkar N, Jiang A, Perou CM, Kim YH, Pollack JR, et al: A
genome-wide screen for promoter methylation in lung cancer
identifies novel methylation markers for multiple malignancies.
PLoS Med. 3:e4862006. View Article : Google Scholar : PubMed/NCBI
|
|
61
|
Han H, Cortez CC, Yang X, Nichols PW,
Jones PA and Liang G: DNA methylation directly silences genes with
non-CpG island promoters and establishes a nucleosome occupied
promoter. Hum Mol Genet. 20:4299–4310. 2011. View Article : Google Scholar : PubMed/NCBI
|
|
62
|
Weston AD, Chandraratna RA, Torchia J and
Underhill TM: Requirement for RAR-mediated gene repression in
skeletal progenitor differentiation. J Cell Biol. 158:39–51. 2002.
View Article : Google Scholar : PubMed/NCBI
|
|
63
|
Sharma M, Brantley JG, Vassmer D,
Chaturvedi G, Baas J and Vanden Heuvel GB: The homeodomain protein
Cux1 interacts with Grg4 to repress p27 kip1 expression during
kidney development. Gene. 439:87–94. 2009. View Article : Google Scholar : PubMed/NCBI
|
|
64
|
Chen S and El-Dahr SS: Histone
deacetylases in kidney development: Implications for disease and
therapy. Pediatr Nephrol. 28:689–698. 2013. View Article : Google Scholar
|