Introduction
Obesity contributes to the etiology of a variety of
comorbid conditions, such as type 2 diabetes, hypertension and
cardiovascular disease (1).
Inflammation and metabolism in adipose and non-adipose tissues are
affected by a variety of adipokines secreted by adipose tissues.
Modulating the endocrine functions of adipose tissue contributes to
chronic inflammation, which can cause associated disorders,
specifically insulin resistance (2). The incidence of obesity associated
with metabolic syndrome has increased worldwide and is likely the
result of high-calorie diets and limited physical inactivity
(3). Estimates suggest that this
population may double to >300 million by the year 2025 (4). An increase in the regional
distribution of body fat, i.e., abdominal obesity, can cause
obesity (5). It results in the
clustering of atherogenic risk factors, i.e., dyslipidemia,
hypertension, inflammatory cytokine profiles, alterations in
coagulation and hyperinsulinemic insulin resistance.
The morbidity and mortality rates from
cardiovascular disease have increased (6). The accumulation of triglycerides
(TGs) in many tissues is caused by the excessive intake of fatty
acids, i.e., lipolysis caused by the accumulation of fat tissues.
An increased circulation of fatty acids increases the risk of
lipolysis in adipocytes and insulin resistance, resulting in a
plethora of fatty acids stored in non-adipose tissues, such as the
liver, pancreas and muscle. Increased levels of fatty acid binding
and transport proteins in adipose and non-adipose tissues
facilitate promote insulin resistance. The high availability of
free fatty acids (FFAs) and their deposition in muscle induces a
negative loop of insulin-mediated muscle insulin signaling and
glucose utilization. The continued exposure of the pancreas to FFAs
can impair insulin release through a lipotoxic mechanism (7). High FFA concentrations contribute to
resistance to insulin action in the liver by enhancing hepatic
glucose output (8). Non-alcoholic
fatty liver disease (NAFLD) can be caused by the accumulation of
TGs in the liver. NAFLD damages the liver, the main glucose
metabolizing organ, and can cause hepatocellular necrosis
steatosis, fibrosis and steatohepatitis (9). A balance between hepatic lipolysis
and lipogenesis is important to prevent insulin resistance and
NAFLD, which are characteristics of metabolic syndrome (10).
However, currently available pharmacological means
for the treatment of metabolic syndrome have a number of
limitations, i.e., high rates of secondary failure and adverse
effects (11). Therefore,
physicians are increasingly considering complementary and
alternative approaches for patients with metabolic syndrome
(12,13).
Simvastatin is a lipid-lowering statins that
inhibits HMG-CoA reductase (14,15). Although simvastatin does not or
only slightly increases blood insulin and glucose levels in animals
and humans (16,17), it has been used in the treatment
of dyslipidemia and in the prevention of cardiovascular disease in
patients with diabetes (18,19) and has beens hown to exert
favorable antioxidant effects on high-fat diet (HFD)-fed rats
(20,21). However, simvastatin can cause
various side-effects, including joint pain, memory loss and
myopathies (22,23). Simvastatin (10 mg/kg) was selected
as a reference drug in this study, at a dose level based on our
previous HFD-fed mouse studies (12,13).
Bioactive proteins are small amino acid sequences
derived from food proteins having potential physiological
properties (24). Fish
hydrolysates are another beneficial protein supplement that is
useful for the treatment of a variety of clinical conditions
(24,25). Fish hydrolysates have
anti-proliferative, anti-microbial and antioxidant effects
(26). In particular, some
protein hydrolysates have been shown to have anti-obesity and
hypolipidemic effects in HFD-fed obese animals (27–30). The yellow(head) catfish or Korean
bullhead (Tachysurus fulvidraco) is a bagrid catfish that
inhabits Eastern Asia from Siberia to China, Korea, Vietnam and
Laos, where it can be found in lakes and river channels. This
catfish reaches a maximum weight of 3 kg and a length of 34.5 cm,
although it is much more commonly found in lengths of 8 cm. It is a
minor edible component in commercial fisheries (31,32).
In the present study, we reported that yellow
catfish protein hydrolysate (YPh) exerts anti-obesity effects,
attenuating related complications in obese mice with mild diabetes
fed a 45% kcal HFD (12,33–35).
Materials and methods
Animals and husbandry
Female specific pathogen-free ICR mice (age, 6 weeks
at receipt; OrientBio, Seungnam, Korea) were used following a 7-day
acclimatization period. The animals were allocated 4–5 per
polycarbonate cage in a temperature (20–25°C)- and humidity
(40–45%)-controlled room. The light:dark cycle was 12:12 h, and
commercial rodent feed (Samyang Feed, Seoul, Korea) and water were
supplied ad libitum. Animals that had completed a 1-week
adaption period prior to being fed the HFD were allocated to 1 of 6
groups (n=8/group, a total of 48 HFD-fed mice and normal diet fed
mice) based on body weight (intact control: mean, 29.26±1.95 g;
range, 26.00–32.20 g; HFD-fed group: mean, 32.07±1.45 g; range,
29.70–35.80 g). All laboratory animals were treated according to
the national regulations of the usage and welfare of laboratory
animals, and approved by the Institutional Animal Care and Use
Committee in Daegu Haany University (Gyeongsan, Gyeongbuk, Korea)
(approval no. DHU2015-016).
Preparation and administration of test
substances
The yellow catfish were kindly provided by an
aquaculture farm (Gimje-si, Jeollabuk-do, Korea). They were placed
in sterilized polyethylene bags (vacuum-packed; 450×650 mm)
securely packed in polystyrene containers, and transported to Silla
University (Busan, Korea) at 5°C using frozen ice packs within 4 h.
The light yellow-colored YPh powder was prepared as follows:
briefly, fish tissues were warmed to 50°C for 10 min, mixed with a
5-fold volume of distilled water, and reacted with Alcalase (E/S,
3.6 AU/g) at 50°C for 10 min (100 rpm shaking). The enzyme
activities were then inhibited by heating in a water bath for 15
min. Finally, the mixture was centrifuged at 4,000 rpm for 10 min,
and the supernatant was completely lyophilized. The YPh was stored
at −20°C to protect it from light and humidity until use.
Simvastatin (Bicon Ltd., Bangalore, India) was used as a
recommended reference drug. YPh (500, 250 and 125 mg/kg) was
dissolved in distilled water and orally administered once daily for
84 days beginning 7 days after the acclimatization to the HFD.
Simvastatin (10 mg/kg) was also orally administered. Equal volumes
of distilled water were orally administered to an intact vehicle
and HFD-fed control mice (Fig.
1). The doses of YPh (500, 250 and 125 mg/kg) were selected
based on in vivo efficacy tests of other protein
hydrolysates in HFD-fed obese animals performed by other
investigators (27–30).
HFD
The mice were adapted to the 45%/kcal HFD (Research
Diet, New Brunswick, NJ, USA) (Table
I) for 7 days and fed this diet during the experiment. A normal
pelleted diet (Superfeed Co., Seoul, Korea) was supplied to the
intact controls.
 | Table IFormulas of normal and high-fat diets
used in this study. |
Table I
Formulas of normal and high-fat diets
used in this study.
| Compositions | Normal pellet diets
(g/kg diet) | High fat diets
(g/kg diet)a |
|---|
| Ingredient | | |
| Casein | 200 | 200 |
| L-Cystein | 3 | 3 |
| Corn starch | 150 | 72.8 |
| Sucrose | 500 | 172.8 |
| Cellulose | 50 | 50 |
| Soybean oil | 50 | 25 |
| Lard | 0 | 177.5 |
| Mineral
mixture | 35 | 10 |
| Vitamin
mixture | 10 | 10 |
| Choline
bitartrate | 2 | 2 |
| Energy
(kcal/g) | 0.21 | 4.73 |
| Protein (%
kcal/kg) | 13.3 | 20 |
| Carbohydrate (%
kcal/kg) | 47.4 | 35 |
| Fat (%
kcal/kg) | 8.0 | 45 |
| Fiber (%
kcal/kg) | 8.0 | 8.0 |
Changes in body weight
Changes in the body weight of the mice were measured
after 8 days (immediately before the commencement of the HFD
feeding), 1 day prior to the administration of YPh and simvastatin
(10 mg/kg), and weekly until termination using an automatic
electronic balance (Precisa Instrument, Dietikon, Switzerland). All
experimental animals were fasted overnight (no water for 12 h) at
the beginning and end of the feeding trial to reduce differences in
the measured values from feeding. Body weight gain was calculated
during the adoption (days 8-0 prior to the trial) and
administration periods (days 0–84 of the test substance
administration), as described below in equation [1] and equation [2]:
Body weight gain(g)during the7-day adaptation period=[body weight at administration−body weight when fed the HFD(from0–8days before the test substance administration)]
Body weight gain(g)during the84-day administration period=[body weight at termination−body weight at administration(from0–84days of the test article administration)]
Mean daily food consumption
A 150 g food/cage was supplied and the quantity
remaining in each cage was measured after 24 h using an automatic
electronic balance. The individual mean daily food consumption by
the mice (g/day/mice) was determined using equation [3] as follows:
Mean daily food consumption(g/day/mice)=Quantity of diet supplied(150g)−Quantity of remaining diet after24h(Reared head of mice)
Measurements were taken once a week during the 84-day
administration period.
Measurement of body fat density: Total
and abdominal fat mass (%)
Mean whole body and abdominal fat densities were
measured in all mice using dual-energy X-ray absorptiometry (DXA;
InAlyzer, Medikors, Seungnam, Korea) once after the 84-day test
substance treatment was completed (Fig. 2).
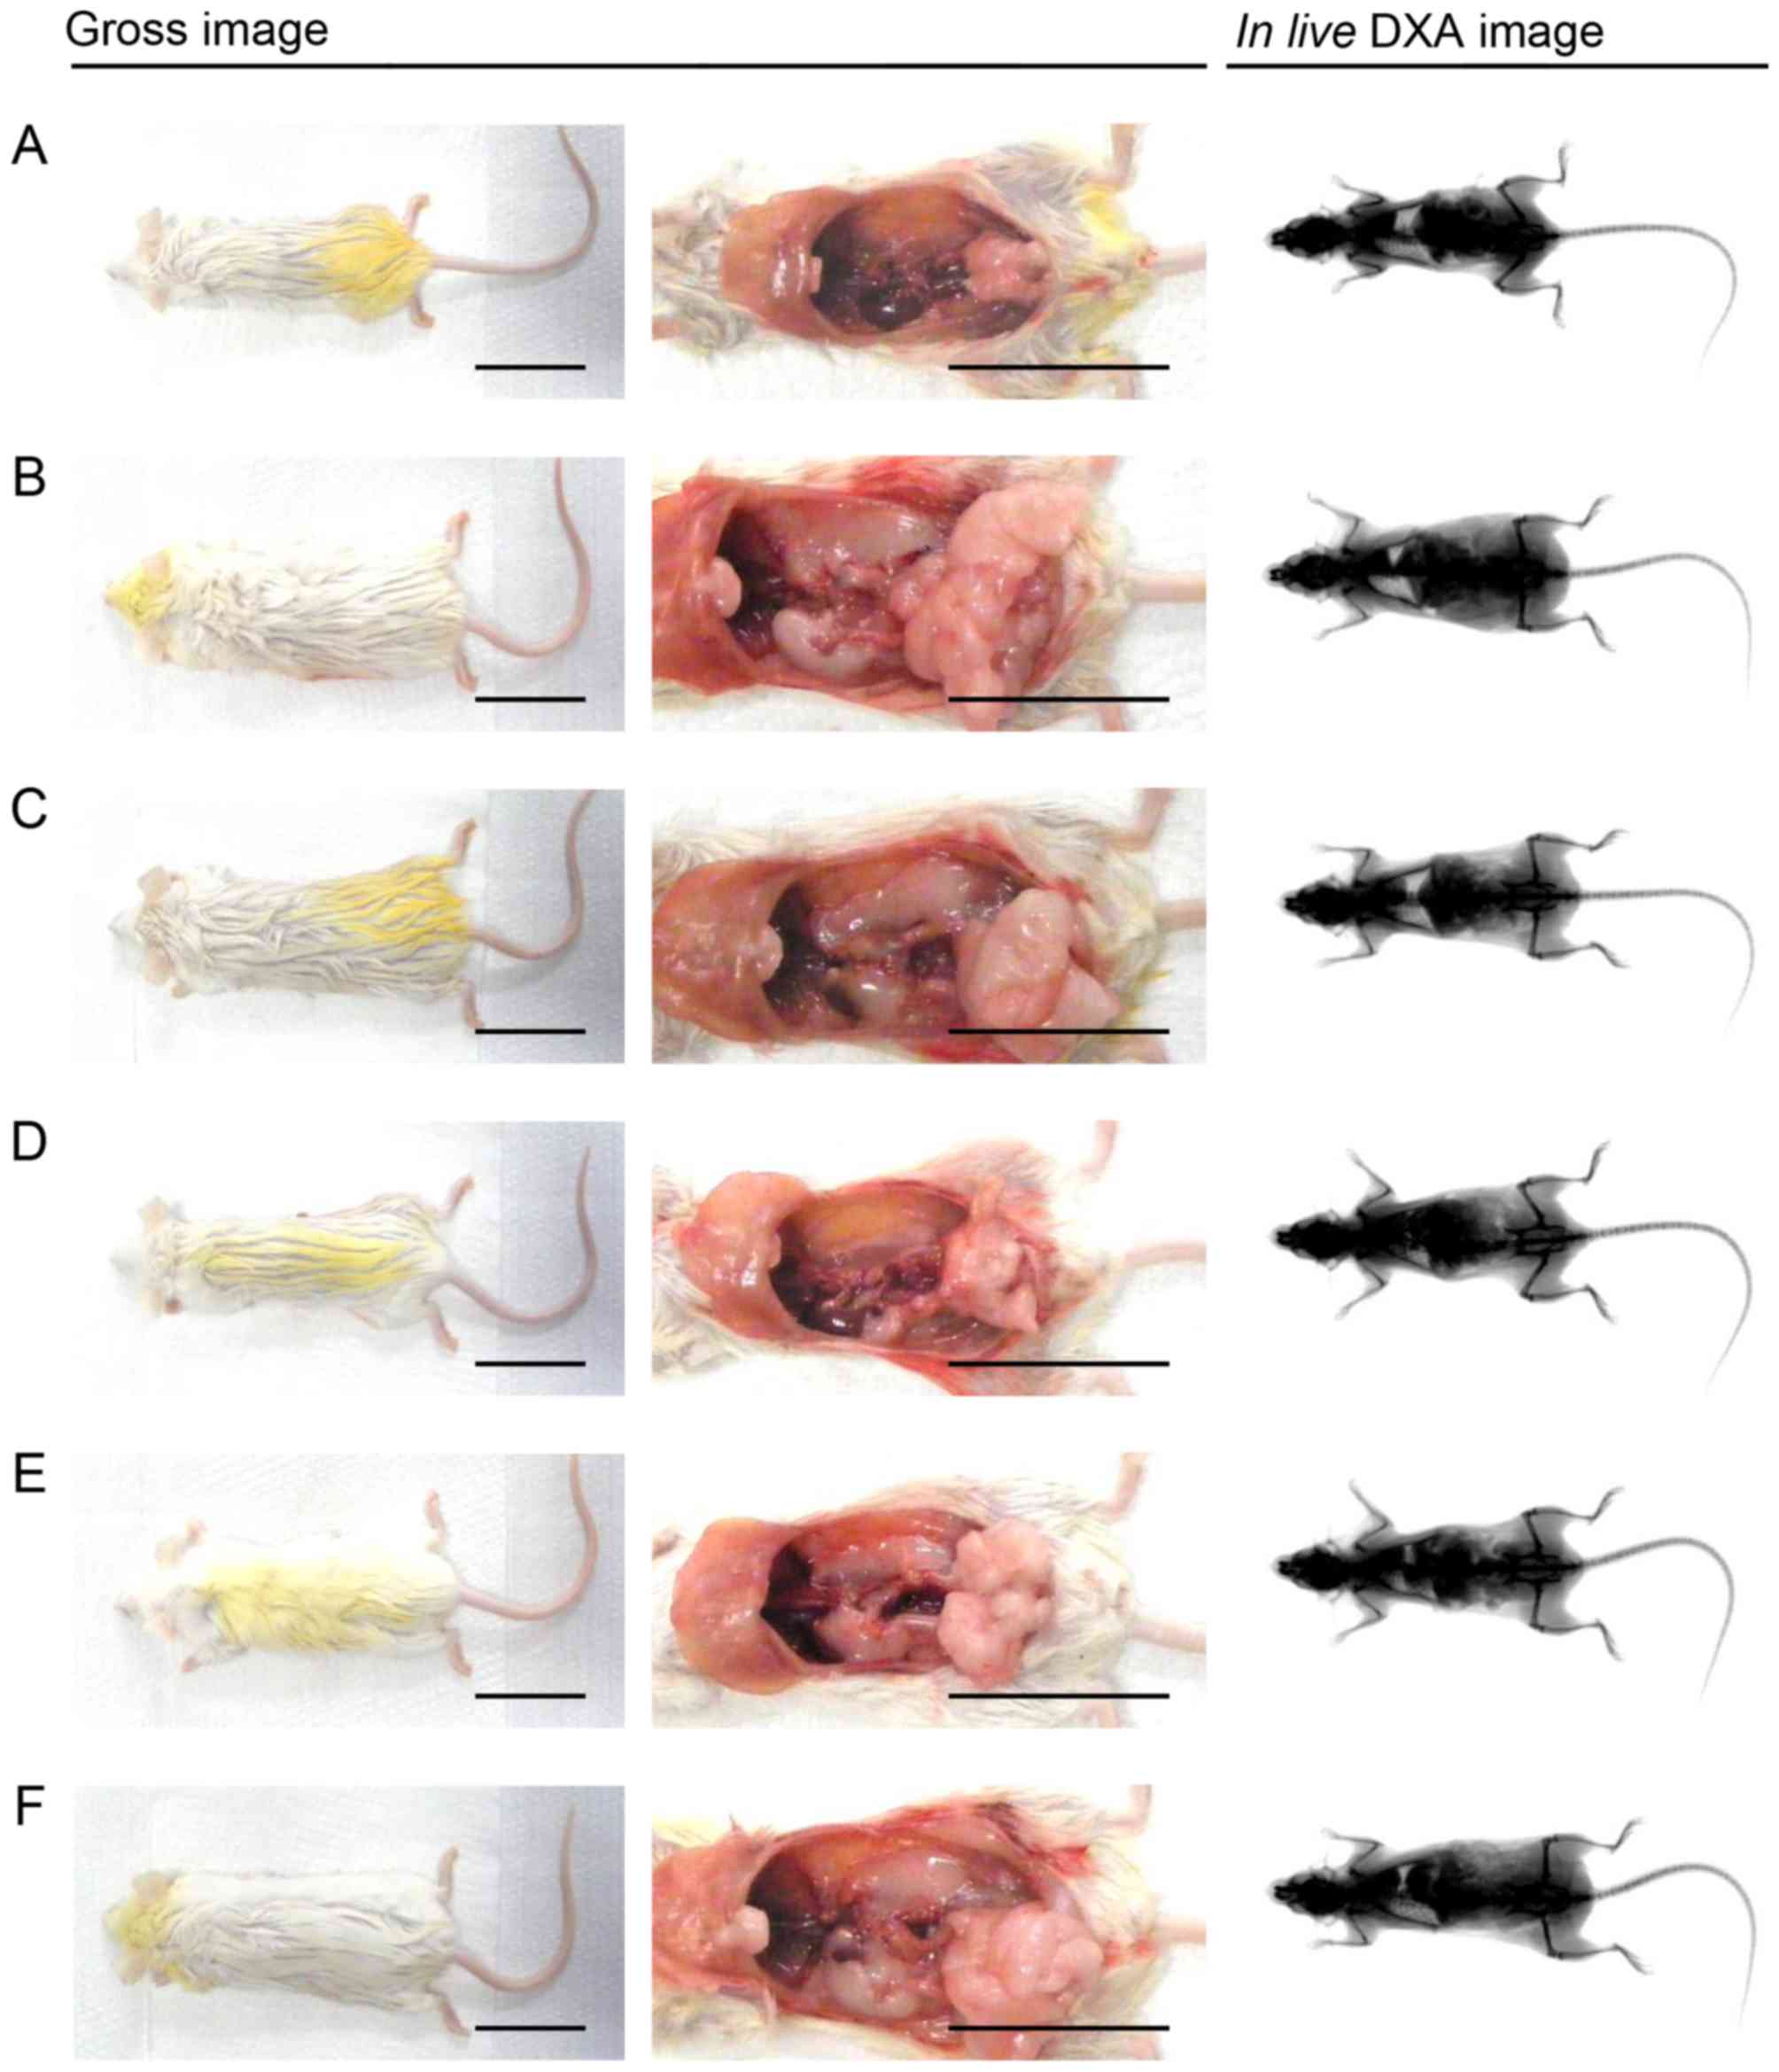 | Figure 2Representative gross body mass and
abdominal fat pads with the whole body DXA images taken from NFD-
or HFD-fed mice. HFD-induced obesity, led to a marked increase in
body mass and related fat accumulation in the HFD-fed control mice
as compared with the NFD-fed intact mice. However, a marked
inhibition of body mass and fat deposition increase was detected in
the mice treated with all test substances, including YPh 125
mg/kg, at the analysis of gross inspections and in live
DXA images, in our results. (A) Intact control: normal pellet
diet-fed vehicle control mice; administered 10 ml/kg of distilled
water orally. (B) HFD (vehicle) control, 10 ml/kg of distilled
water administered orally with HFD supply. (C) Simvastatin, 10
mg/kg of simvastatin administered with HFD supply. (D) YPh 500, 500
mg/kg of YPh administered orally with HFD supply. (E) YPh 250, 250
mg/kg of YPh administered orally with HFD supply. (F) YPh 125, 125
mg/kg of YPh administered orally with HFD supply; NFD, normal fat
pellet die; HFD, 45% kcal high-fat diet; YPh, yellow(head) catfish
or Korean bullhead (Tachysurus fulvidraco) protein
hydrolysates, test material; DXA, dual-energy X-ray absorptiometry.
Scale bar, 35 mm. |
Serum biochemistry
Blood was collected from the caudal vena cava after
the 84 days of treatment, placed in clotting activated serum tubes,
and centrifuged at 15,000 rpm for 10 min at room temperature. The
serum was collected for the later analyses of alanine
aminotransferase (ALT), aspartate aminotransferase (AST), blood
urea nitrogen (BUN), total cholesterol (TC), creatinine,
low-density lipoprotein (LDL), TG, high-density lipoprotein (HDL)
and creatinine levels. Serum BUN, ALT, creatinine, AST, TG and TC
levels were measured using an automated blood analyzer (Hemagen
Analyst; Hemagen Diagnostic, Columbia, MD, USA) and serum LDL and
HDL levels were detected using another type of automated blood
analyzer (AU400; Olympus, Tokyo, Japan).
Measurement of organ weight
The weights of the pancreas, liver, left periovarian
fat pads, left kidney and abdominal wall-deposited fat pads
attached to the muscularis quadratus lumborum were measured
individually at sacrifice at day 84, and relative weights (% body
weight) were calculated using body weight at sacrifice and absolute
weight to decrease differences among individual body weights.
Measurement of fecal lipid
composition
Lipids were extracted from feces collected after 8 h
of the last test substance administration, according to the method
of Folch et al (36).
Fecal TG and TC concentrations were measured using a commercial
enzyme kit (Asan Pharmaceutical Co., Seoul, Korea) based on a
modification of the lipase-glycerol phosphate oxidase method
(37–39).
Liver lipid peroxidation and antioxidant
defense systems
The glutathione (GSH) and malondialdehyde (MDA)
contents, as well as the superoxide dismutase (SOD) and catalase
(CAT) activities, were assessed in mouse hepatic tissues. Separate
liver tissues were weighed and homogenized in ice-cold 0.01 M
Tris-HCl (pH 7.4) and centrifuged at 12,000 × g for 15 min as
previously described by Kavutcu et al (40). The degree of liver lipid
peroxidation was measured by estimating the MDA content using the
thiobarbituric acid test at an absorbance of 525 nm (nM MDA/mg
tissue) (41). Total protein
contents were measured using a previously reported method (42), with bovine serum albumin
(Invitrogen, Carlsbad, CA, USA) as the internal standard. The
homogenates were mixed with 0.1 ml 25% trichloroacetic acid (Merck,
San Francisco, CA, USA) and centrifuged at 4,200 rpm for 40 min at
4°C. The GSH contents were measured at an absorbance of 412 nm
using 2-nitrobenzoic acid (Sigma-Aldrich, St. Louis, MO, USA) and
reported as µM/mg tissue (43). The decomposition of
H2O2 in the presence of CAT was monitored at
240 nm (44). CAT activity was
defined as the amount of enzyme required to decompose 1 nM of
H2O2 per min at 25°C and pH 7.8. The results
were expressed as U/mg tissue. SOD activity was measured as
previously described by Sun et al (45). SOD estimates were based on the
generation of superoxide radicals produced by xanthine and xanthine
oxidase, which react with nitro tetrazolium blue to form a blue
formazan dye. SOD activity was measured at 560 nm based on the
degree of inhibition of this reaction and was expressed as U/mg
tissue. One unit of SOD enzymatic activity was equal to the amount
of enzyme that diminishes the initial absorbance of nitroblue
tetrazolium by 50% over 1 min.
Histopathological examination
The left kidney and the left lateral lobe of the
liver, the left periovarian fat pads, the splenic lobe of the
pancreas and the abdominal wall-deposited fat pads attached to the
muscularis quadratus lumborum were fixed in 10% neutral buffered
formalin. After embedding in paraffin, 3–4 µm-thick serial
sections were prepared and stained with hematoxylin and eosin
(H&E) for light microscopic examination. The histological
profiles of individual organs were described. Portions of the liver
that had been dehydrated in 30% sucrose were sectioned by cryostat
for Oil Red O staining (39,46). To observe more details of the
histopathological changes, the steatohepatitis region and mean
hepatocyte diameters (by H&E staining) were calculated using an
automated imaging analysis program (iSolution FL ver. 9.1;
IMT i-Solution Inc., Vancouver, QC, Canada) according to
previously reported methods (12,13,39,46). The regions of steatohepatitis and
percentage of fat-deposited regions in the hepatic parenchyma were
calculated as percentages of lipid deposited regions
(%/mm2 of hepatic parenchyma). The sections were cut
using a cryostat, stained with Oil Red O, and mean hepatocyte
diameters were calculated using an automated image analysis
process; at least 10 hepatocytes per liver field of view were
considered. In addition, the mean number of lipid droplets
deposited in vacuolated renal tubules was calculated using an
automated image analysis process among 100 tubules (number/100
tubules in one field/sample). The mean diameter of white adipocytes
in the fat pads was calculated using an automated image analysis
process; at least 10 white adipocytes per fat pad were considered.
Mean area occupied by zymogen granules (%/mm2 of
pancreatic parenchyma), thicknesses of the periovarian and
abdominal wall fat pad (mm) deposits, diameters of pancreatic
islets and number of pancreatic islets (islets/10 mm2 of
pancreatic parenchyma) were measured according to our previously
established methods (12,13,39). The histopathologist was blinded to
the group distribution.
Immunohistochemistry
Other serially prepared sectioned pancreatic tissues
were immunostained using the avidin-biotin-peroxidase (ABC) method
as previously described by Kang et al (39), with guinea pig polyclonal insulin
(dilution 1:2,000) or rabbit polyclonal glucagon (dilution 1:2,000)
(both from DiaSorin, Stillwater, MN, USA) antiserum. Briefly,
endogenous peroxidase activity was blocked by incubation in
methanol and 0.3% H2O2 for 30 min.
Non-specific immunoglobulin binding was blocked with a normal horse
serum blocking solution (dilution 1:100; Vector Laboratories,
Burlingame, CA, USA) for 1 h in a humidity chamber. The primary
antiserum was incubated overnight at 4°C in a humidity chamber and
then incubated with the biotinylated universal secondary antibody
(dilution 1:50; cat. no. PK-6200; Vectastain Elite ABC kit) and ABC
reagents (Vectastain Elite ABC kit; dilution 1:50) (both from
Vector Laboratories) for 1 h at room temperature in a humidity
chamber. Finally, the tissues were subjected to a peroxidase
substrate kit (Vector Laboratories) for 3 min at room temperature.
All sections were rinsed 3 times between steps in 0.01 M
phosphate-buffered saline (PBS). Cells with >20%
immunoreactivity were regarded as positive compared with other
naïve cells, and the mean numbers of insulin- and glucagon-
immunoreactive cells dispersed in the pancreatic parenchyma were
counted using an automated image analysis process, as previously
described (39,47) and the ratio was calculated using
equation [4] as follows:
InsulinGlucagoncells(ratio)=Mean number of insulin−immunoreactive cellsMean number of glucagon immunoreactive cells
Statistical analyses
All numerical values were expressed as the means ±
standard deviation of 8 mice. The results of the different dose
groups were analyzed using a multiple comparison tests. The
variance was examined using the Levene test (48). If the Levene test indicated no
significant deviations from homogeneity, the data were analyzed by
a one-way analysis of variance followed by a least significant
difference (LSD) multi-comparison test to determine which pairs
were significantly different. The non-parametric Kruskal-Wallis H
test was conducted when the variance was heterogeneous as indicated
by significant deviations from observed values on the Levene test.
When a significant difference was observed in the Kruskal-Wallis H
test, The Mann-Whitney U test was conducted to determine the
specific pairs that were significantly different. Statistical
analyses were conducted using SPSS version 14 (SPSS Inc., Chicago,
IL, USA) (49). In addition, the
percentage changes were calculated and compared with the HFD-fed
control to examine the efficacy of the test substances, and the
percentage changes between the intact and HFD-fed controls were
calculated to observe disease, as described below using equation [5] and [6] according to our previous study
(39).
Percentage change compared with intact control(%)=HFD control data−Intact control dataIntact control data×100
Percentage change compared with HFD control(%)=Test substance administered mice data−HFD control dataHFD control data×100
Results
Effects on obesity
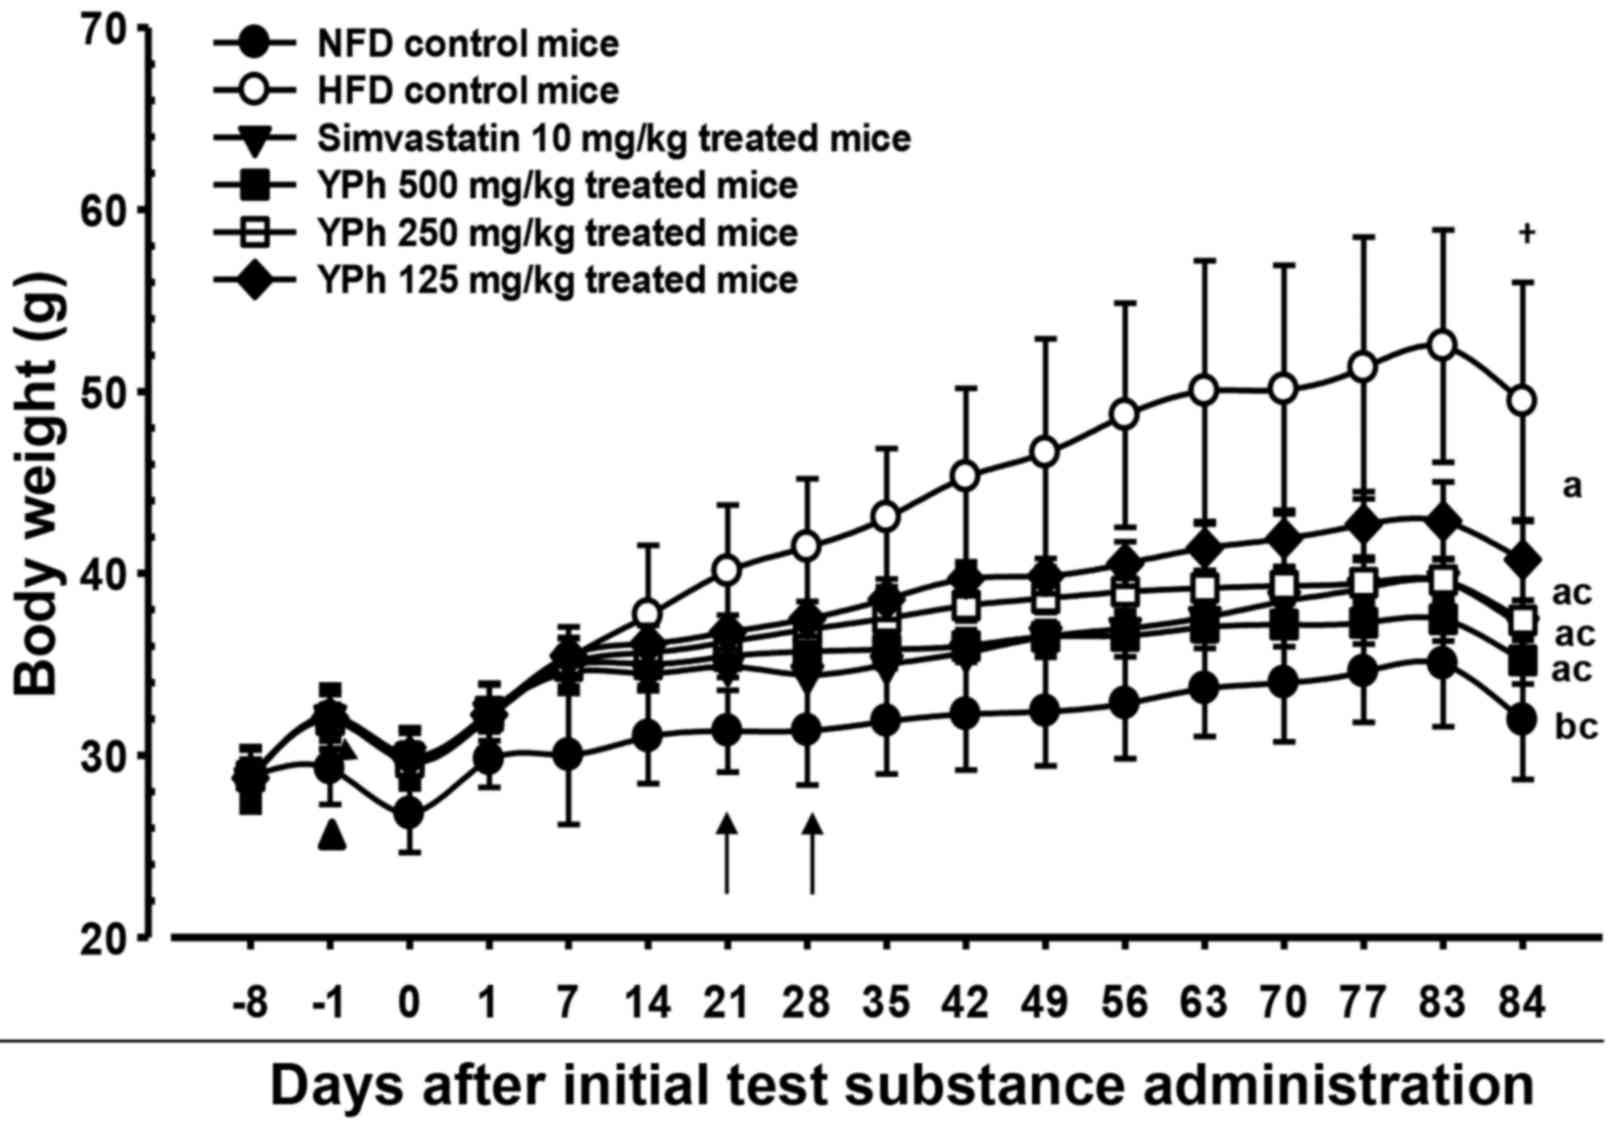
Changes in body weight
The body weights of the HFD-fed control mice
increased significantly (p<0.01) as compared with the intact
mice (fed the normal diet) after 1 week. Accordingly, body weight
gain increased significantly (p<0.01) from 7 days after adapting
to the HFD through day 84 of administration compared with the
intact control group. However, a significant (p<0.01 or
p<0.05) decrease in body weight was detected in the 10 mg/kg
simvastatin- and 500 and 250 mg/kg YPh-treated mice beginning at 21
days after the administration began compared with the HFD untreated
control. Thus, the body weight gain during the 84-day
administration period decreased significantly (p<0.01) in these
groups compared with the HFD-fed control. In addition, the 125
mg/kg YPh-treated mice also lost a significant (p<0.01 or
p<0.05) amount of body weight beginning 28 days after the
initial administration and experienced a significant (p<0.01)
decrease in body weight gain during the 84-day administration
period, compared with HFD-fed control mice (Fig. 1 and Table II).
| Table IIChanges in body weight gain and mean
daily food consumption in NFD- or HFD-fed mice. |
Table II
Changes in body weight gain and mean
daily food consumption in NFD- or HFD-fed mice.
| Groups | Body weight (g) at
days after initial test substance administration
| Body weight gain
during administration period [C-D] | Mean daily food
consumption (g) |
|---|
8 days
before
[A] | 1 day
before
[B] | 0 daya
[C] | 84 daysa
[D] |
|---|
| Controls |
| Intact | 28.83±1.65 | 29.26±1.95 | 26.79±2.13 | 31.93±3.25 | 5.14±1.76 | 5.28±0.62 |
| HFD | 28.68±1.79 | 32.08±1.79b | 29.84±1.69b | 49.44±6.59c | 19.60±7.23c | 4.10±0.56c |
| Reference |
| Simvastatin | 28.74±1.30 | 32.16±1.78b | 29.95±2.11b | 37.06±1.69c,e | 7.11±1.40d,e | 4.08±0.40c |
| YPh-treated |
| 500 mg/kg | 28.85±1.44 | 31.98±1.60b | 29.88±1.59b | 35.21±1.29d,e | 5.34±1.27e | 4.05±0.71c |
| 250 mg/kg | 28.85±0.87 | 31.94±0.88b | 29.60±1.07b | 37.41±1.10c,e | 7.81±1.34c,e | 4.17±0.53c |
| 125 mg/kg | 28.75±1.04 | 32.08±1.28b | 29.93±1.28b | 40.75±2.21c,e | 10.83±2.24c,e | 4.13±0.50c |
Effects on food consumption
Mean daily food consumption decreased significantly
(p<0.01) in all HFD-fed mice compared with the intact control;
however, no changes in mean daily food consumption were detected in
any of the test substance-administered groups compared with the
HFD-fed control (Table II).
Effects on body fat density: total and
abdominal fat mass (%)
Total body and abdominal fat density increased
significantly (p<0.01) in the HFD-fed control compared with the
intact control groups. By contrast, total body and abdominal fat
mass decreased significantly (p<0.01) in the 10 mg/kg
simvastatin- and YPh, 125, 250 and 500 mg/kg-treated mice compared
with the HFD-fed control mice according to the DXA results
(Figs. 2 and 3).
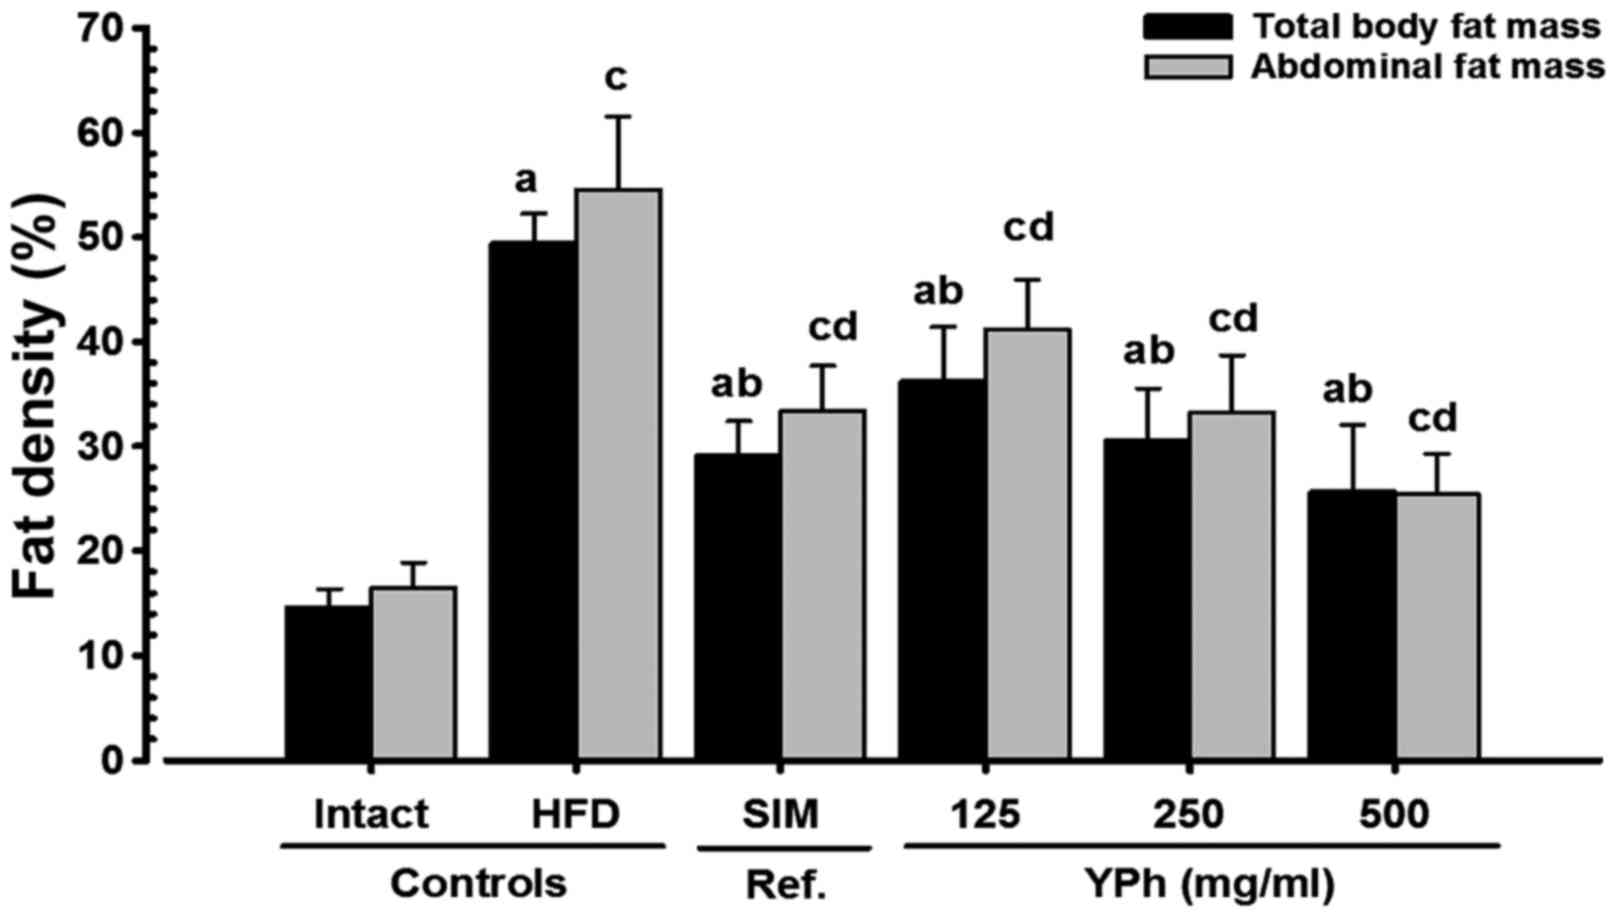 | Figure 3Total body and abdominal fat
densities in NFD- or HFD-fed mice. A significant (p<0.01)
increase in total body and abdominal fat density was detected in
the HFD-fed controls as compared with the intact controls. On the
contrary, a significant (p<0.01) decrease in total body and
abdominal fat mass was detected in the mice treated with
simvastatin 10 mg/kg, and YPh 500, 250 and 125 mg/kg as compared
with the HFD-fed control mice, at the analysis by DXA. Values are
expressed as the means ± SD of 8 mice. NFD, normal fat pellet die;
HFD, 45% kcal high-fat diet; SIM, simvastatin; YPh, yellow(head)
catfish or Korean bullhead (Tachysurus fulvidraco) protein
hydrolysates, test material; DXA, dual-energy X-ray absorptiometry.
Simvastatin (SIM) was administrated at dose levels of 10
mg/kg1. ap<0.01 as compared with the
intact control as shown by the LSD test; bp<0.01 as
compared with the HFD-fed control as shown by the LSD test;
cp<0.01 as compared with the intact control as shown
by the Mann-Whitney U test; dp<0.01 as compared with
the HFD control as shown by the Mann-Whitney U test. |
Effects on periovarian-deposited fat
pad weight
Periovarian-deposited fat pad weight increased
significantly (p<0.01) in the HFD-fed control group compared
with the intact control group. However, the increase (p<0.01) in
absolute and relative weight decreased significantly in response to
all test substances, including 500 mg/kg YPh (Table III and Fig. 2).
| Table IIIChanges in absolute and relative
organ weight in NFD- or HFD-fed mice. |
Table III
Changes in absolute and relative
organ weight in NFD- or HFD-fed mice.
| Groups | Absolute organ
weight (g)
| Relative organ
weight (% of body weight)
|
|---|
| Pancreas | Liver | Kidney | Periovarian fat
pads | Abdominal wall fat
pads | Pancreas | Liver | Kidney | Periovarian fat
pads | Abdominal wall fat
pads |
|---|
| Controls |
| Intact | 0.199±0.023 | 1.153±0.084 | 0.178±0.009 | 0.036±0.017 | 0.059±0.020 | 0.626±0.077 | 3.634±0.358 | 0.564±0.061 | 0.111±0.044 | 0.183±0.048 |
| HFD | 0.191±0.019 | 1.712±0.111a | 0.241±0.009a | 0.742±0.157d | 0.524±0.134d | 0.392±0.071d | 3.503±0.401 | 0.493±0.062 | 1.511±0.335d | 1.057±0.215a |
| Reference |
| Simvastatin | 0.193±0.021 | 1.196±0.113c | 0.188±0.012c | 0.191±0.012d,f | 0.211±0.046d,f | 0.522±0.067d,f | 3.229±0.310b | 0.507±0.035 | 0.514±0.026d,f | 0.570±0.125a,c |
| YPh-treated |
| 500 mg/kg | 0.201±0.013 | 1.135±0.088c | 0.181±0.008c | 0.088±0.013d,f | 0.148±0.041d,f | 0.571±0.049f | 3.231±0.319b | 0.513±0.021 | 0.251±0.035d,f | 0.423±0.127a,c |
| 250 mg/kg | 0.195±0.006 | 1.241±0.059b,c | 0.190±0.008b,c | 0.220±0.040d,f | 0.245±0.062d,f | 0.521±0.021d,f | 3.318±0.158 | 0.509±0.027 | 0.586±0.092d,f | 0.659±0.178a,c |
| 125 mg/kg | 0.196±0.014 | 1.347±0.053a,c | 0.200±0.009a,c | 0.302±0.081d,f | 0.319±0.054d,f | 0.481±0.032d,f | 3.315±0.251b | 0.493±0.029e | 0.748±0.221d,f | 0.785±0.136a,c |
Effects on abdominal wall-deposited
fat pad weight
The absolute and relative weight of the abdominal
wall-deposited fat pads increased significantly (p<0.01) in the
HFD-fed control mice compared with the intact controls. However,
the increase in abdominal wall-deposited fat pad weight decreased
significantly (p<0.01) in response to all test substances
(Table III and Fig. 2).
Effects on adipocyte histopathology in
periovarian- and abdominal wall-deposited fat pads
Periovarian and abdominal white adipocyte diameters
and fat pad thickness increased significantly (p<0.01) in the
HFD-fed control mice compared with the intact controls. However,
adipocyte hypertrophy and the fat deposits were significantly
(p<0.01) inhibited by all test substances, including 10 mg/kg
simvastatin, compared to the HFD-fed control group (Table IV and Fig. 4).
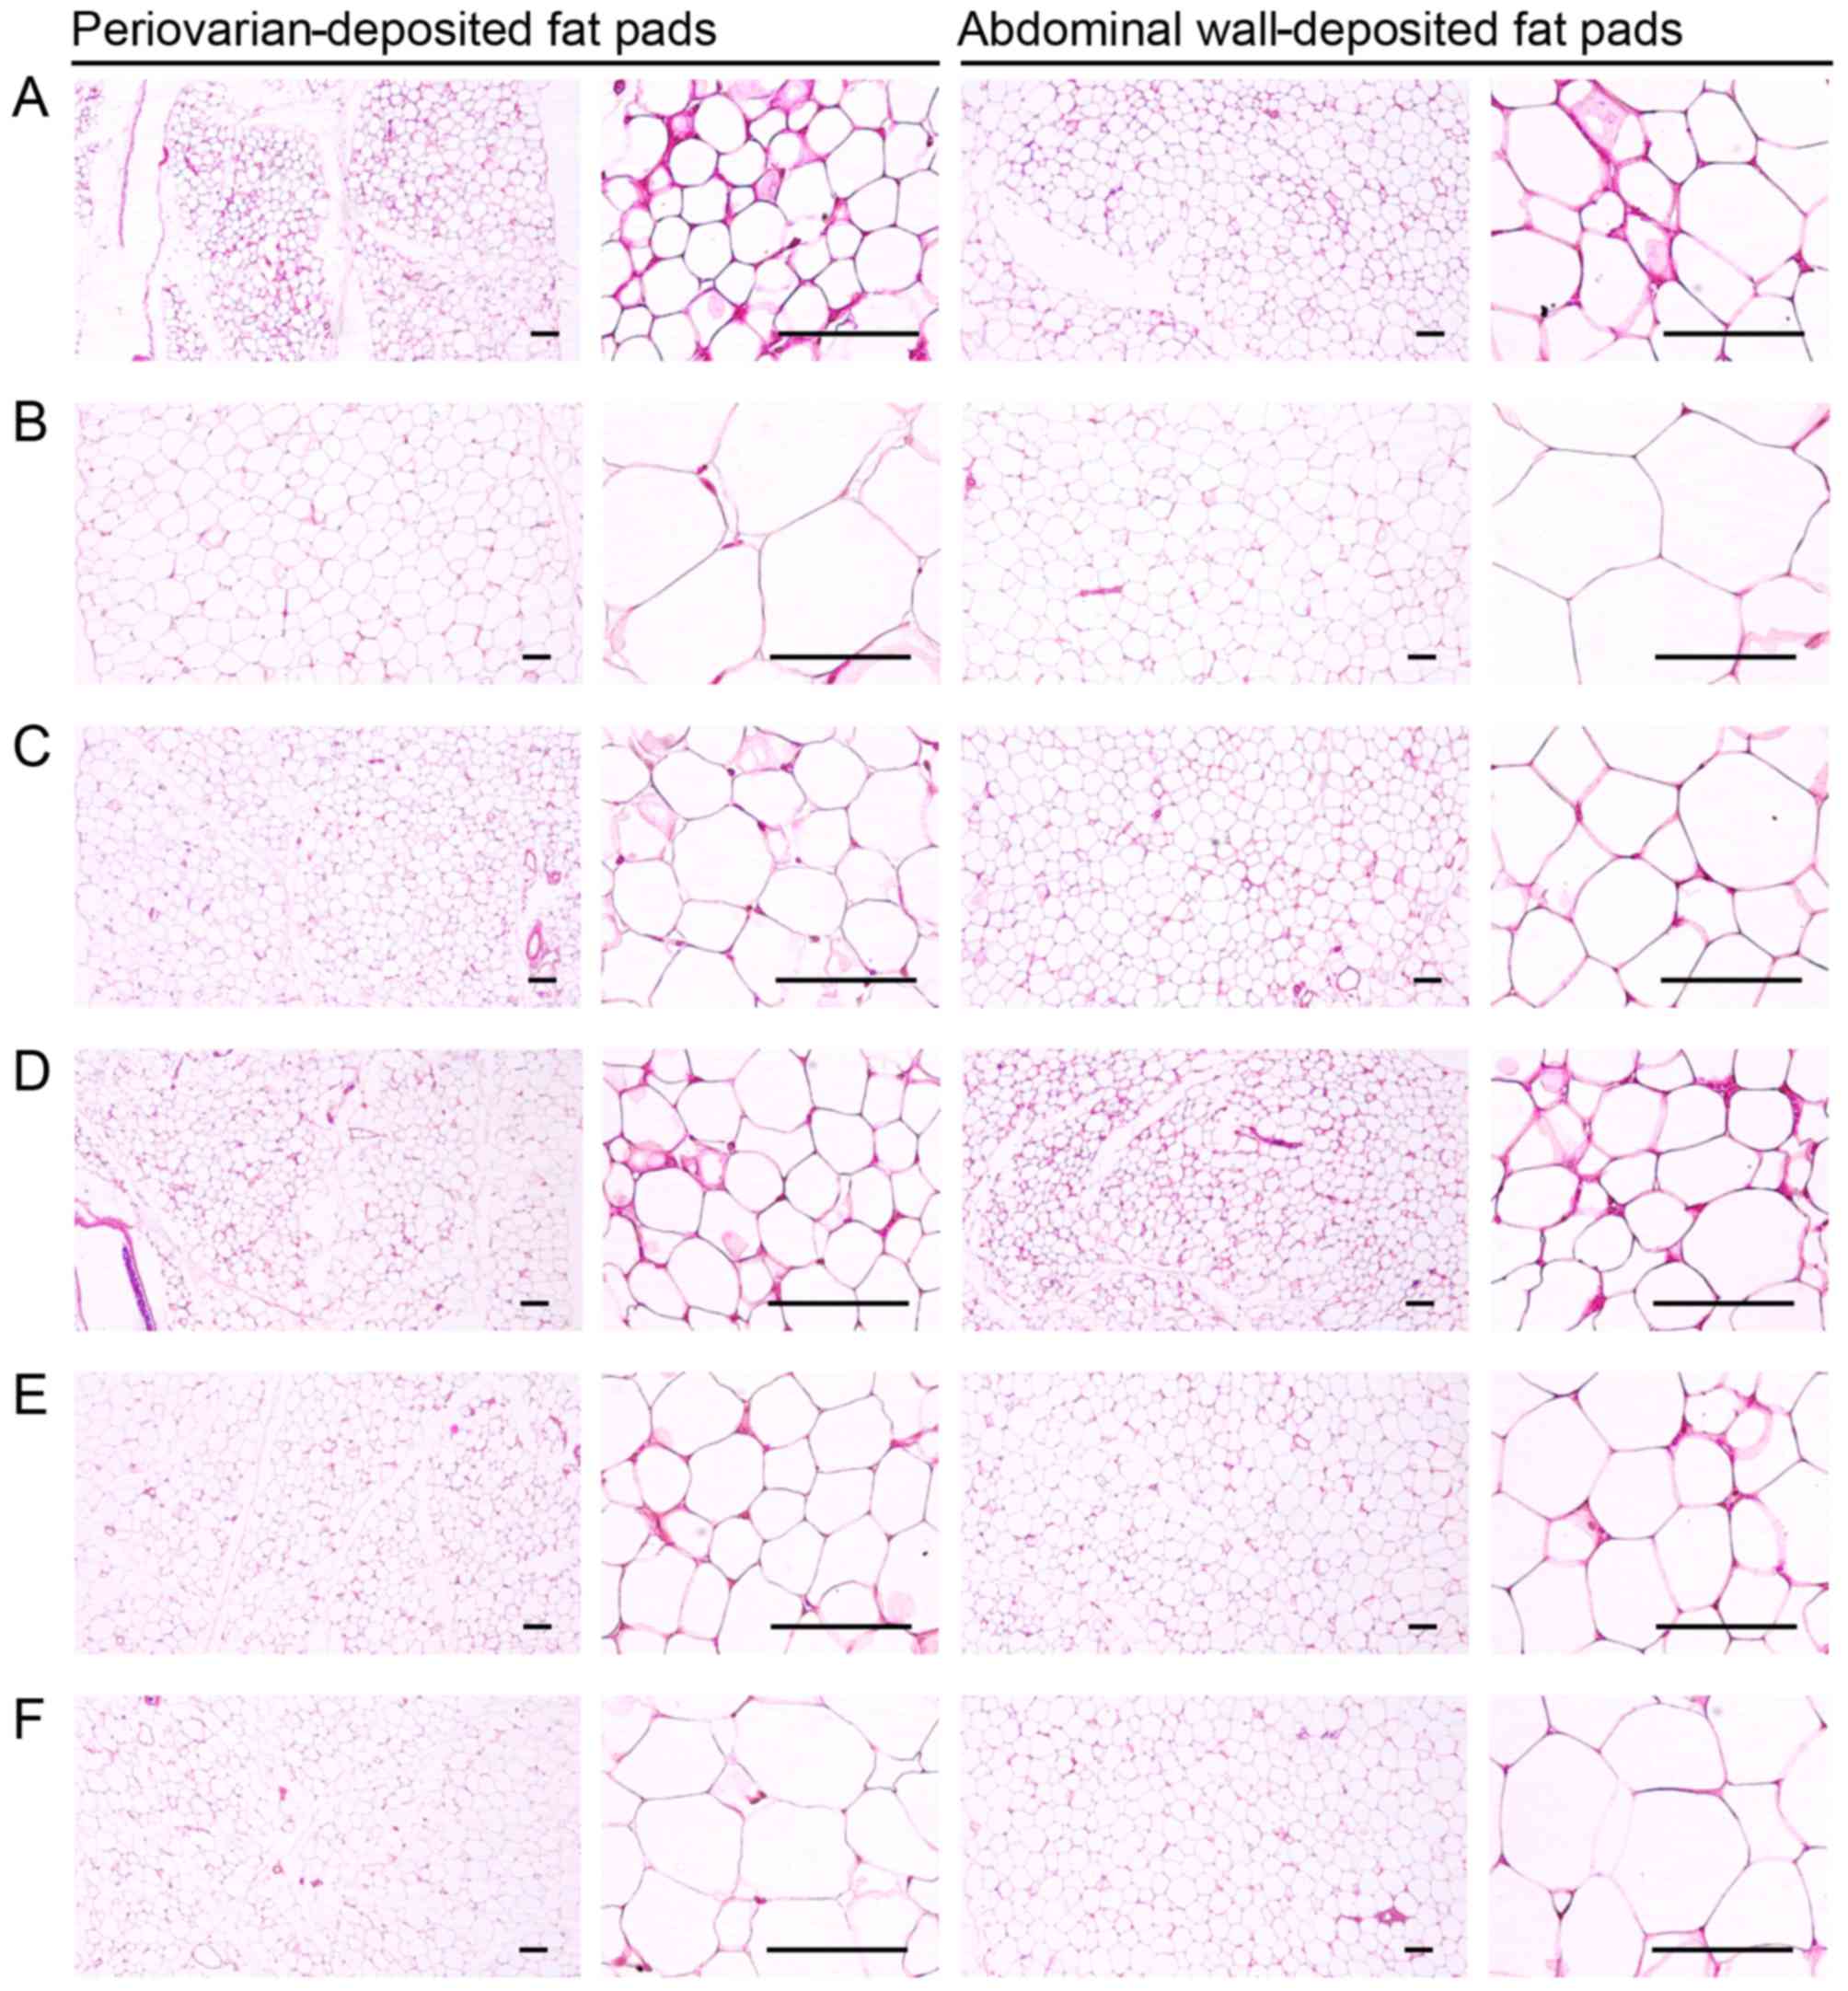 | Figure 4Representative histological images of
the adipocytes, taken from NFD- or HFD-fed mice; the periovarian-
and abdominal wall-deposited fat pads are shown. A significant
increase in periovarian and abdominal white adipocyte diameters and
thickness of each deposited fat pads was detected in the HFD-fed
controls as compared with the intact controls. However, these
hypertrophic changes in adipocytes and fat depositions were
significantly inhibited by treatment with all test substances as
compared with the HFD-fed controls. (A) Intact control: normal
pellet diet-fed vehicle control mice; administered 10 ml/kg of
distilled water orally. (B) HFD (vehicle) control, 10 ml/kg of
distilled water administered orally with HFD supply. (C)
Simvastatin, 10 mg/kg of simvastatin administered with HFD supply.
(D) YPh 500, 500 mg/kg of YPh administered orally with HFD supply.
(E) YPh 250, 250 mg/kg of YPh administered orally with HFD supply.
(F) YPh 125, 125 mg/kg of YPh administered orally with HFD supply;
NFD, normal fat pellet die; HFD, 45% kcal high-fat diet; YPh,
yellow(head) catfish or Korean bullhead (Tachysurus
fulvidraco) protein hydrolysates, test material. All images
show hematoxylin and eosin staining. Scale bars, 80 µm. |
| Table IVChanges in the
histopathology-histomorphometry of the periovarian- and abdominal
wall-deposited fat pads in NFD- or HFD-fed mice. |
Table IV
Changes in the
histopathology-histomorphometry of the periovarian- and abdominal
wall-deposited fat pads in NFD- or HFD-fed mice.
| Groups | Periovarian fat
pads
| Abdominal wall fat
pads
|
|---|
| Thickness (mm) | Adipocyte diameters
(µm) | Thickness | Adipocyte diameters
(µm) |
|---|
| Controls |
| Intact | 1.60±0.54 | 36.46±11.29 | 1.99±0.35 | 44.02±12.37 |
| HFD | 5.57±1.00a |
131.14±24.68c | 6.21±0.74c |
126.26±18.18a |
| Reference |
| Simvastatin | 2.81±0.59a,b | 54.42±12.72d,e | 2.89±0.59c,e | 64.60±15.07a,b |
| YPh-treated |
| 500 mg/kg | 2.56±0.45a,b | 51.08±7.28d,e | 2.49±0.46c,e | 50.21±9.17b |
| 250 mg/kg | 3.08±0.50a,b | 60.05±7.46c,e | 3.12±0.31c,e | 68.10±10.28a,b |
| 125 mg/kg | 3.81±0.79a,b | 77.72±19.23c,e | 4.71±0.80c,e | 87.73±14.28a,b |
Effects on the pancreas
Effects on pancreatic weight
Relative pancreatic weight decreased significantly
(p<0.01) in the HFD-fed control mice compared with the intact
control mice; however, relative pancreatic weight increased
significantly (p<0.01) in the mice treated with 10 mg/kg
simvastatin and 500, 250 and 125 mg/kg YPh compared with the
HFD-fed control mice. No changes in absolute pancreatic weight were
detected in any of the experimental HFD-fed mice, including the
control mice compared with the intact controls (Table III).
Effects on exocrine pancreas zymogen
granule content
The exocrine pancreas zymogen granule content
decreased significantly (p<0.01) in the HFD-fed controls
compared with the intact controls fed the NFD, resulting from the
release of zymogen granules. However, the exocrine pancreas zymogen
granule content increased significantly (p<0.01) in all test
drug-treated mice compared to the HFD-fed control, apart from the
10 mg/kg simvastatin-treated mice, in which the percentage of
exocrine pancreas occupied by zymogen granules only increased
slightly compared to the HFD-fed control mice (Table V and Fig. 5).
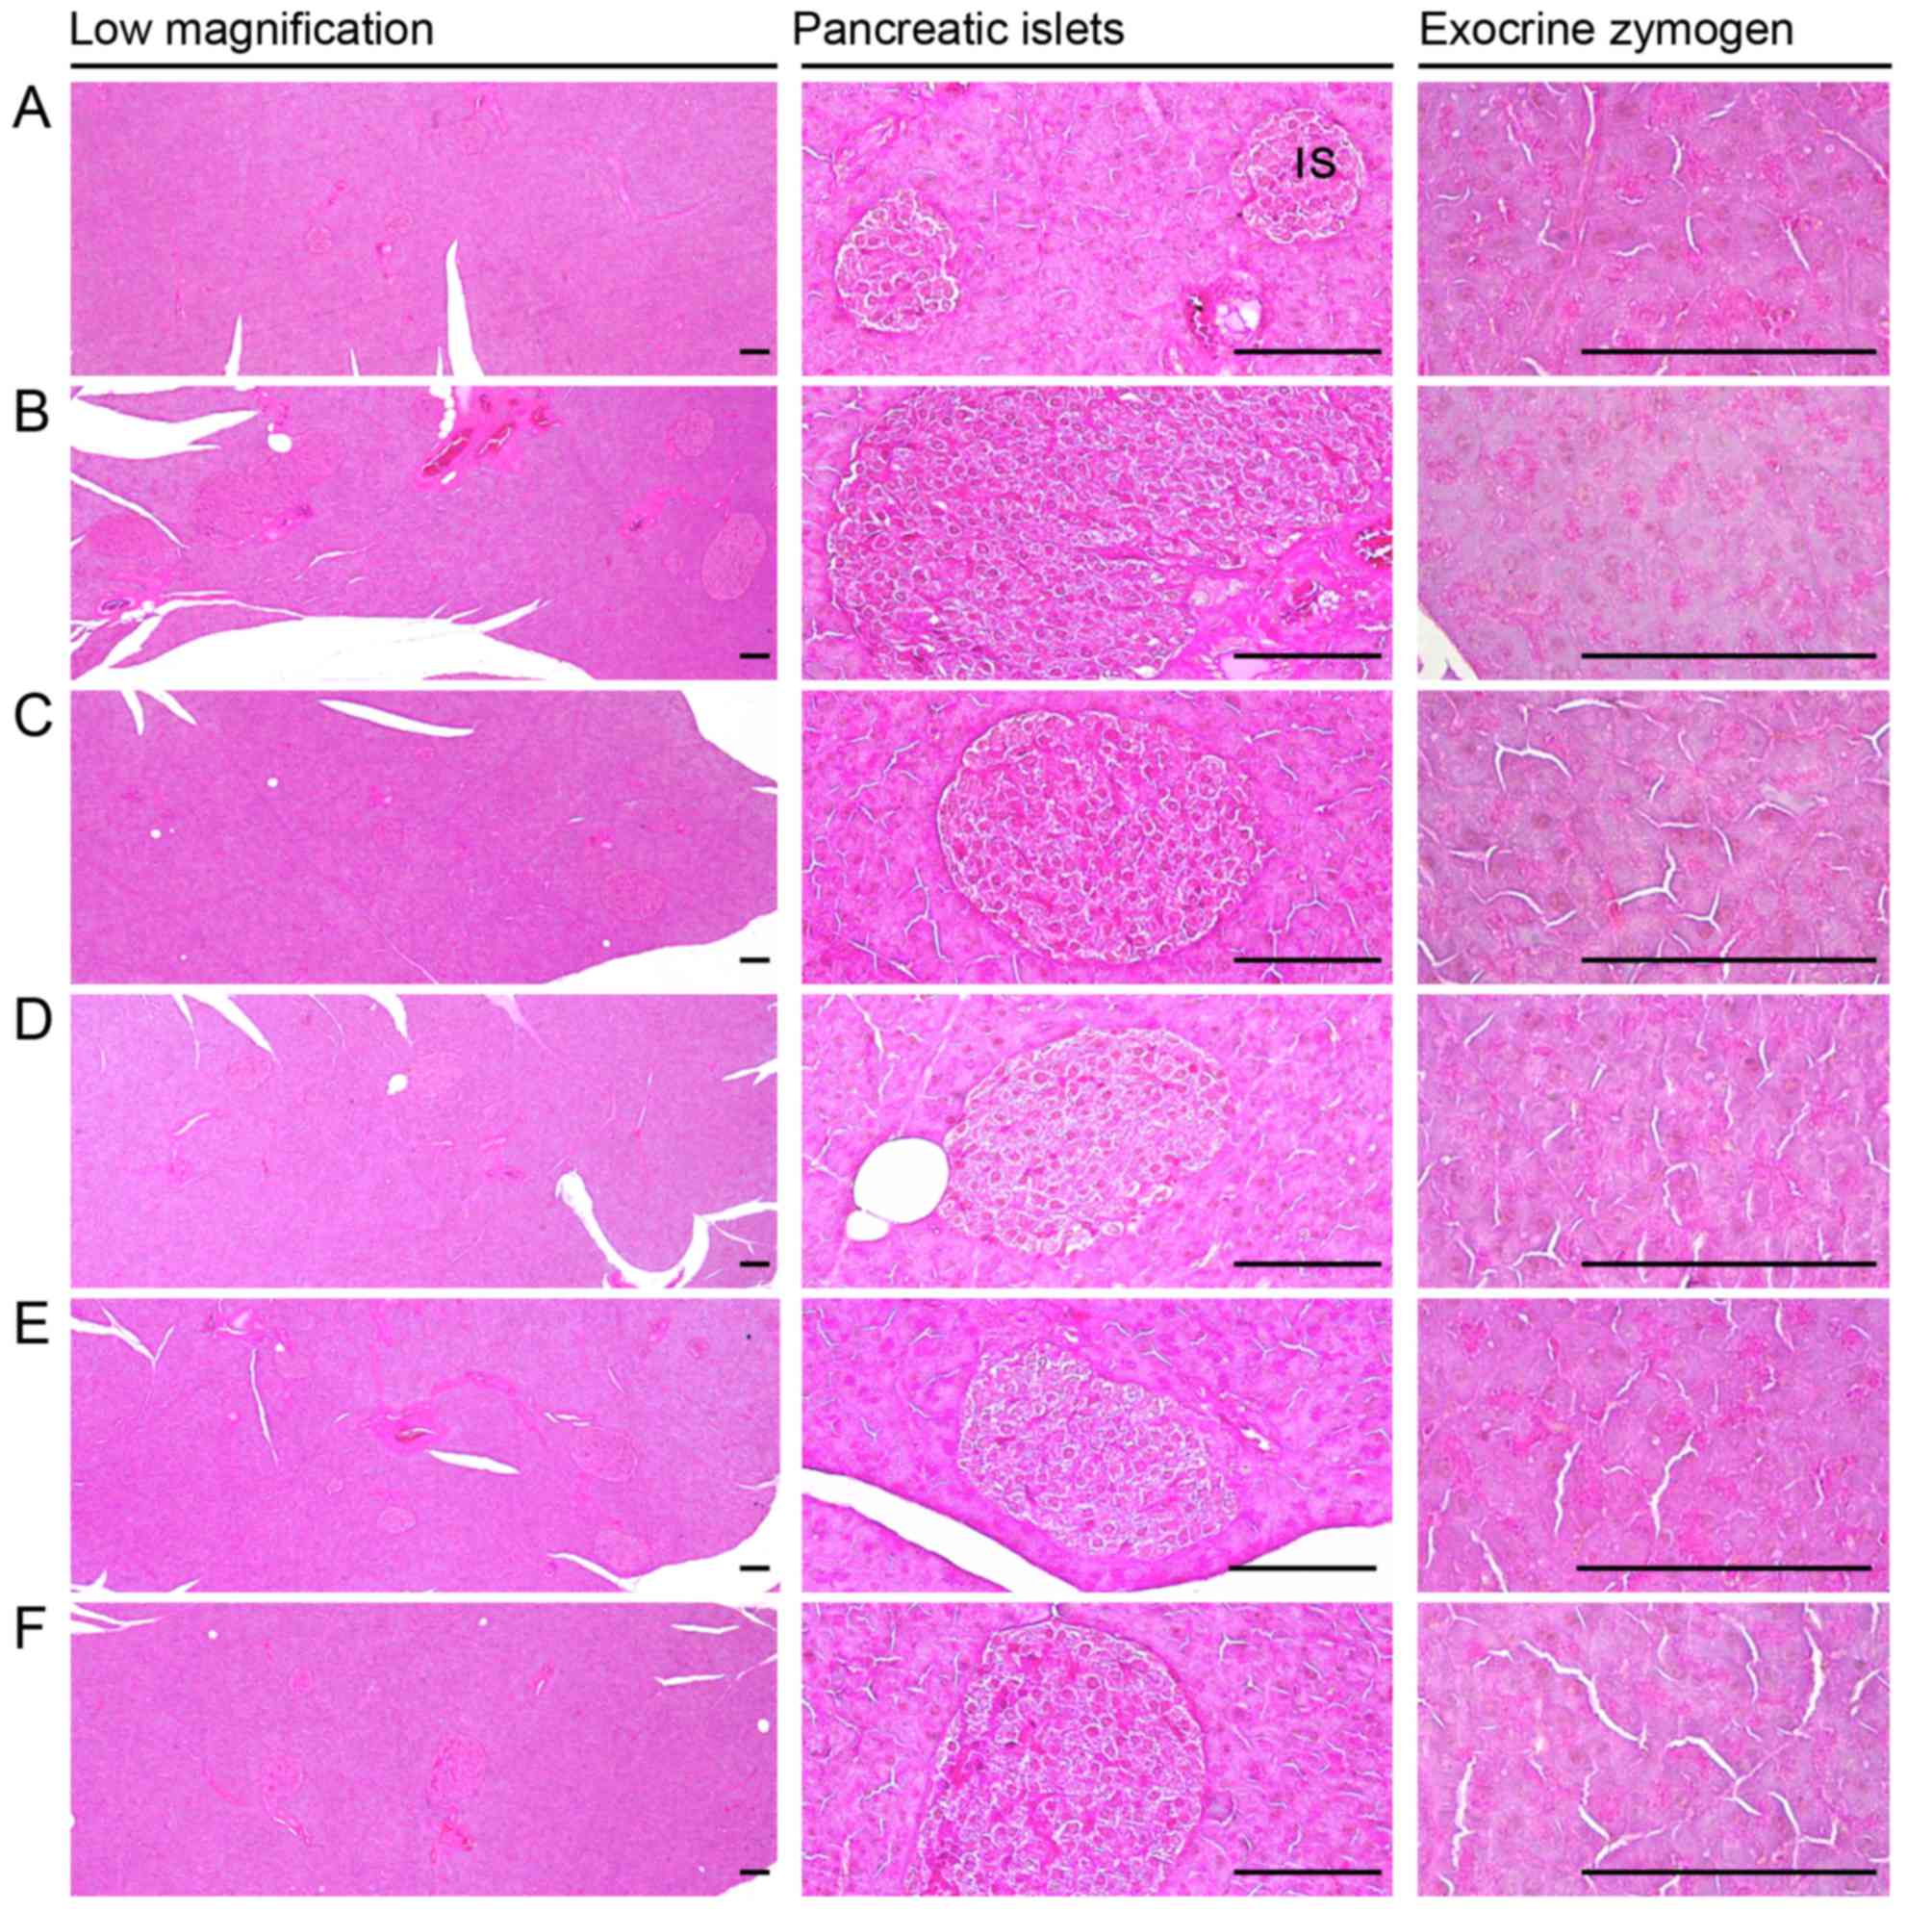 | Figure 5Representative general histological
images of the pancreas, taken from NFD- or HFD-fed mice. Note that
a marked decrease in exocrine pancreas zymogen granule contents
(the percentages of exocrine pancreas occupied by zymogen granules)
may be the result of the release of zymogen granules, and the
increase in pancreatic islet numbers and mean diameters results
from marked hyperplasia of the pancreatic islet itself or component
endocrine cells that were detected in the HFD-fed controls as
compared with intact controls. However, exocrine pancreas zymogen
granule contents were markedly increased in the mice treated with
all test substances as compared with the HFD-fed controls, apart
from the simvastatin 10 mg/kg-treated mice, in which the
percentages of exocrine pancreas occupied by zymogen granules were
non-significantly altered as compared to those of the HFD-fed
control mice. In addition, the expansion of pancreatic islets was
also inhibited by treatment with all test substances. (A) Intact
control: normal pellet diet-fed vehicle control mice; administered
10 ml/kg of distilled water orally. (B) HFD (vehicle) control, 10
ml/kg of distilled water administered orally with HFD supply. (C)
Simvastatin, 10 mg/kg of simvastatin administered with HFD supply.
(D) YPh 500, 500 mg/kg of YPh administered orally with HFD supply.
(E) YPh 250, 250 mg/kg of YPh administered orally with HFD supply.
(F) YPh 125, 125 mg/kg of YPh administered orally with HFD supply;
NFD, normal fat pellet die; HFD, 45% kcal high-fat diet; YPh,
yellow(head) catfish or Korean bullhead (Tachysurus
fulvidraco) protein hydrolysates, test material; IS, pancreatic
islet. PD, pancreatic secretory duct. All images show hematoxylin
and eosin staining. Scale bars, 80 µm. |
| Table VChanges in
histopathology-histomorphometry of the pancreas, liver and kidneys
in the NFD-fed or HFD-fed mice. |
Table V
Changes in
histopathology-histomorphometry of the pancreas, liver and kidneys
in the NFD-fed or HFD-fed mice.
| Groups | Zymogen granules
(%/mm2 of exocrine) | Liver steatosis
(%/mm2 of hepatic tissues) | Mean hepatocyte
diameters (µm/cell) | Degenerative renal
tubule numbers (%) |
|---|
| Controls |
| Intact | 53.64±10.09 | 7.27±2.36 | 17.72±1.91 | 3.13±1.64 |
| HFD |
13.46±3.28c | 76.36±9.61a | 53.45±12.48a | 73.88±14.66a |
| Reference |
| Simvastatin |
16.23±5.42c | 32.45±10.25a,b | 22.46±3.28a,b | 35.75±14.44a,b |
| YPh-treated |
| 500 mg/kg |
43.90±6.85d,e | 19.95±4.89a,b | 21.29±2.36a,b |
19.00±7.65a,b |
| 250 mg/kg |
36.69±5.93c,e | 31.99±10.05a,b | 25.79±3.75a,b | 39.25±11.62a,b |
| 125 mg/kg |
29.91±7.28c,e | 50.50±11.60a,b | 32.36±6.36a,b | 44.38±12.15a,b |
Effects on hyperlipidemia
Effects on serum TC levels
A significant (p<0.01) increase in serum TC
levels was detected in the HFD-fed controls compared to the intact
controls. However, the serum TC levels decreased significantly
(p<0.01) in all the test substance-treated groups, including the
mice treated with 500 mg/kg YPh, compared to the HFD-fed controls
(Table VI).
| Table VIChanges on serum lipid contents in
NFD- or HFD-fed mice. |
Table VI
Changes on serum lipid contents in
NFD- or HFD-fed mice.
| Groups | Total cholesterol
(mg/dl) | Triglyceride
(mg/dl) | Low-density
lipoprotein (mg/dl) | High-density
lipoprotein (mg/dl) |
|---|
| Controls |
| Intact | 113.88±21.26 | 50.63±18.52 | 16.13±1.64 | 105.00±22.61 |
| HFD |
279.13±36.98a |
215.13±23.42a | 49.13±9.49d | 23.50±10.25a |
| Reference |
| Simvastatin |
172.13±36.21a,c |
119.25±34.51a,c | 22.63±4.37d,e | 74.38±10.64a,c |
| YPh treated |
| 500 mg/kg |
158.75±27.75b,c |
100.88±24.33a,c | 20.75±1.91d,e | 83.13±13.73a,c |
| 250 mg/kg |
192.13±37.31a,c |
131.13±23.90a,c | 24.88±3.68d,e | 68.50±16.96a,c |
| 125 mg/kg |
213.75±33.40a,c |
162.25±37.09a,c | 31.75±7.09d,e | 49.75±14.20a,c |
Effects on serum TG levels
A significant (p<0.01) increase in serum TG
levels was detected in the HFD-fed controls compared to the intact
controls. However, the serum TG levels decreased significantly
(p<0.01) in all of the test substance-treated groups, including
the 250 mg/kg YPh-treated mice, compared to the HFD-fed controls
(Table VI).
Effects on serum LDL levels
A significant (p<0.01) increase in serum LDL
levels was observed in the HFD-fed controls compared to the intact
controls. However, the serum LDL levels decreased significantly
(p<0.01) in all the test substance-treated mice, including the
mice that received 10 mg/kg simvastatin compared to the HFD-fed
controls (Table VI).
Effects on serum HDL levels
A significant (p<0.01) decrease in serum HDL
levels was detected in the HFD-fed controls compared to the intact
controls. However, the serum HDL levels increased significantly
(p<0.01) in all test substance-treated HFD-fed mice compared
with the HFD-fed control mice (Table
VI).
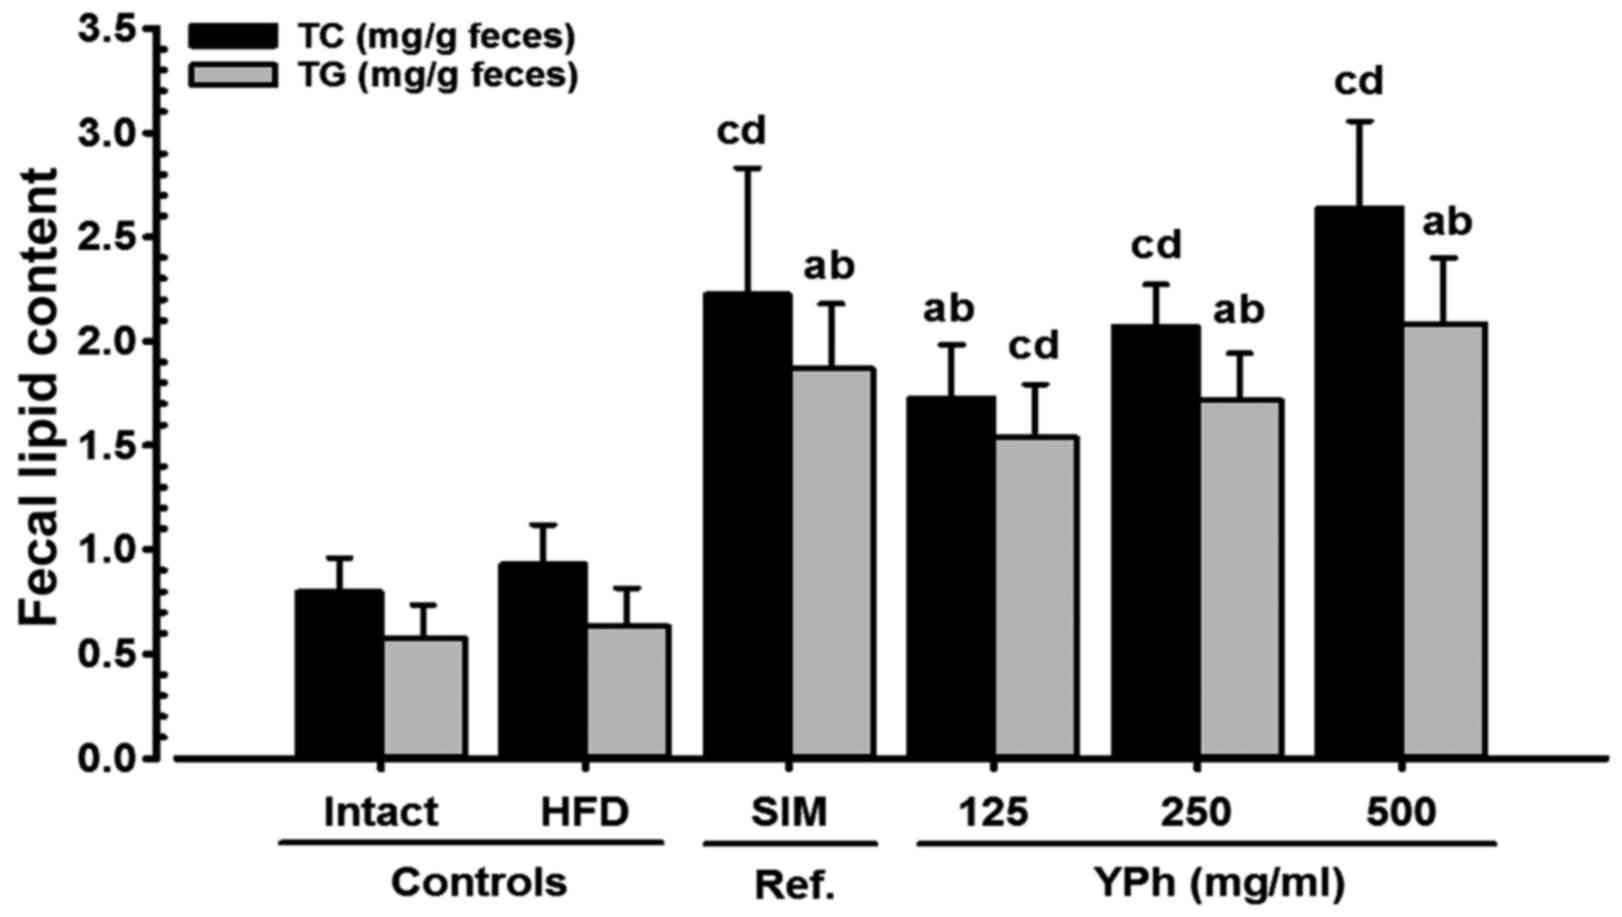
Effects on fecal TG and TC
contents
Although a slight increase in the fecal TG and TC
contents was detected in the HFD-fed controls compared with the
intact controls fed the NFD, the fecal TG and TC contents in all
the test substance-treated mice, including those treated with 500
mg/kg YPh, increased significantly (p<0.01) compared to HFD-fed
control mice (Fig. 6).
Effects on hepatopathy
Effects on liver weight
A significant (p<0.01) increase in absolute liver
weight was detected in the HFD-fed controls compared to the intact
controls. However, this increase was significantly (p<0.01)
normalized by treatment with all the test substances compared to
the HFD-fed control mice. No changes in relative liver weight were
observed in the HFD-fed control mice compared to the intact control
mice, and no changes in relative liver weight were observed in any
of the test substance-treated mice compared with the HFD-fed
control mice (Table III).
Effects on serum AST levels
A significant (p<0.01) increase in serum AST
levels was detected in the HFD-fed controls compared with the
intact controls. However, the serum AST levels decreased
significantly (p<0.01) in all the test substance-treated mice
compared with the HFD-fed controls (Table VII).
| Table VIIChanges in serum AST, ALT, BUN and
creatine levels in NFD- or HFD-fed mice. |
Table VII
Changes in serum AST, ALT, BUN and
creatine levels in NFD- or HFD-fed mice.
| Groups | AST (IU/l) | ALT (IU/l) | BUN (mg/dl) | Creatinine
(mg/dl) |
|---|
| Controls |
| Intact | 74.50±14.19 | 33.50±11.41 | 34.75±10.39 | 0.66±0.21 |
| HFD |
226.75±23.23d |
169.00±18.67a | 97.38±16.05a | 2.19±0.24d |
| Reference |
| Simvastatin |
121.50±30.34d,f | 77.00±18.55a,c | 61.25±9.22a,c | 1.20±0.08d,f |
| YPh-treated |
| 500 mg/kg | 96.50±16.20e,f | 61.38±21.25a,c | 50.00±11.90b,c | 0.96±0.25e,f |
| 250 mg/kg |
127.50±18.75d,f | 87.50±14.52a,c | 63.13±10.41a,c | 1.34±0.23d,f |
| 125 mg/kg |
167.00±22.46d,f |
111.88±11.93a,c | 74.13±10.11a,c | 1.60±0.26d,f |
Effects on serum ALT levels
A significant (p<0.01) increase in the serum ALT
levels was detected in the HFD-fed controls compared with the
intact controls. However, the serum ALT levels decreased
significantly (p<0.01) in all the test substance-treated mice,
including those treated with 10 mg/kg simvastatin, compared with
the HFD-fed controls (Table
VII).
Effects on steatohepatitis
A significant (p<0.01) increase in
steatohepatitis (percentage of fat-affected regions in the liver
parenchyma) was detected in the HFD-fed controls compared with the
intact controls, resulting from the severe hypertrophy of
hepatocytes related to intracellular lipid deposition. However,
steatohepatitis was significantly (p<0.01) normalized following
treatment of the mice with the test substances (Table V and Fig. 7).
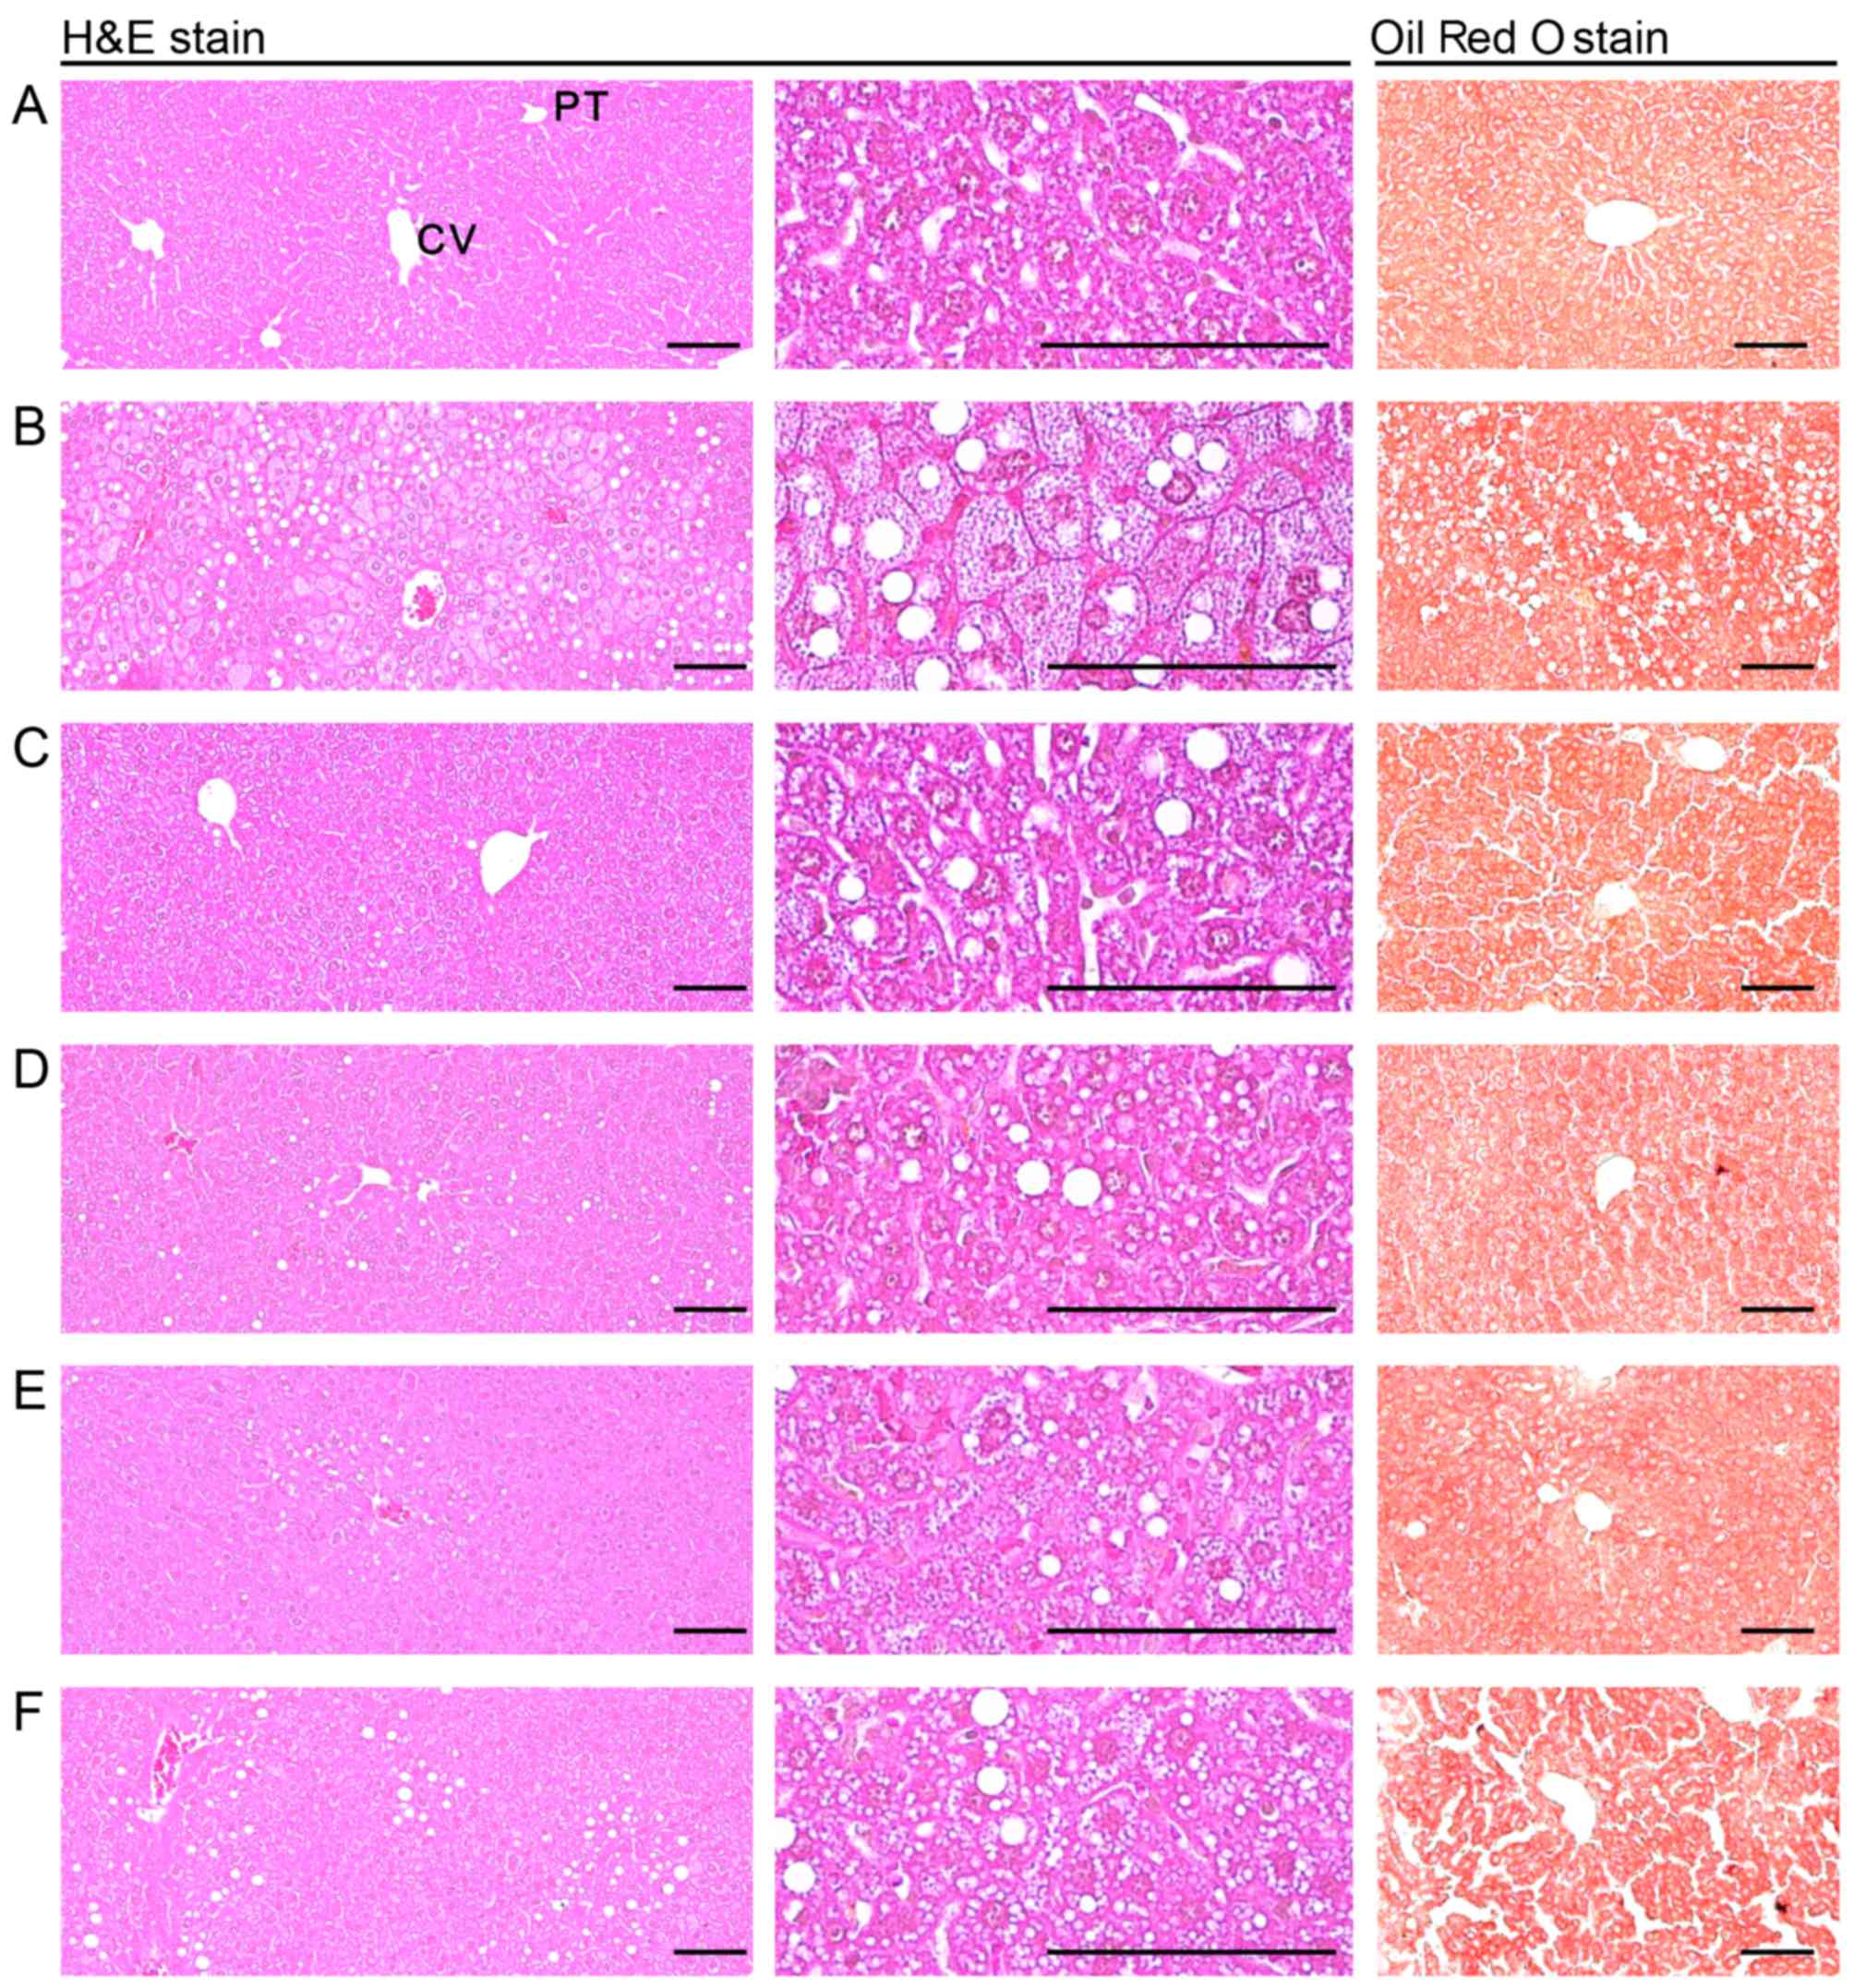 | Figure 7Representative histological images of
the liver, taken from NFD- or HFD-fed mice. Note that a marked
increase in steatohepatitis, the percentage of fatty-altered
regions in the liver parenchyma, was detected in the HFD-fed
controls as compared with the intact controls, resulting from
severe hypertrophy of hepatocyte-related to intracellular lipid
depositions. However, steatohepatitis was normalized by treatment
with all test substances, including YPh 250 mg/kg. In particular,
the YPh 500, 250 and 125 mg/kg-treated HFD-fed mice also exhibited
a noticeable decrease in the steatohepatitis-affected regions and
related hepatocyte hypertrophy as compared with the HFD-fed mice.
(A) Intact control: normal pellet diet-fed vehicle control mice;
administered 10 ml/kg of distilled water orally. (B) HFD (vehicle)
control, 10 ml/kg of distilled water administered orally with HFD
supply. (C) Simvastatin, 10 mg/kg of simvastatin administered with
HFD supply. (D) YPh 500, 500 mg/kg of YPh administered orally with
HFD supply. (E) YPh 250, 250 mg/kg of YPh administered orally with
HFD supply. (F) YPh 125, 125 mg/kg of YPh administered orally with
HFD supply; NFD, normal fat pellet die; HFD, 45% kcal high-fat
diet; YPh, yellow(head) catfish or Korean bullhead (Tachysurus
fulvidraco) protein hydrolysates, test material; CV, central
vein; PT, portal triad. Scale bars, 80 µm. |
Effects on hepatocyte hypertrophy
A significant (p<0.01) increase in mean
hepatocyte diameter (hypertrophy) was detected in the HFD-fed
controls compared with the intact controls. However, hypertrophy
decreased significantly (p<0.01) in all test substance-treated
mice compared with the HFD-fed controls (Table V and Fig. 7).
Effects on nephropathy
Effects on kidney weight
A significant (p<0.01) increase in absolute
kidney weight was detected in the HFD-fed control mice compared
with the intact controls; however, these effects were significantly
(p<0.01) normalized following treatment with all of the
substances compared to HFD-fed mice. No changes in relative kidney
weight were observed in the HFD-fed control mice compared with the
intact control mice, and no changes in relative kidney weight were
observed in any of the test substance-treated mice compared with
the HFD-fed control mice (Table
III).
Effects on serum BUN levels
A significant (p<0.01) increase in serum BUN
levels was detected in the HFD-fed controls compared with the
intact controls fed the NFD. However, the serum BUN levels
decreased significantly (p<0.01) in all test substance-treated
mice compared with the HFD-fed controls (Table VII).
Effects on serum creatinine
levels
A significant (p<0.01) increase in serum
creatinine levels was detected in the HFD-fed controls compared
with the intact controls. However, the serum creatinine levels
decreased significantly (p<0.01) in all the test
substance-treated HFD-fed mice compared with the HFD-fed control
mice (Table VII).
Effects on kidney histopathology
A significant (p<0.01) increase in the number of
degenerative vacuolated renal tubules was detected in the HFD-fed
controls compared with the intact controls, resulting from lipid
droplet-deposited diabetic nephropathy; however, these
nephropathies were significantly (p<0.01) normalized by
treatment with all of the test substances, including 10 mg/kg
simvastatin, compared with the HFD-fed controls (Table V and Fig. 8).
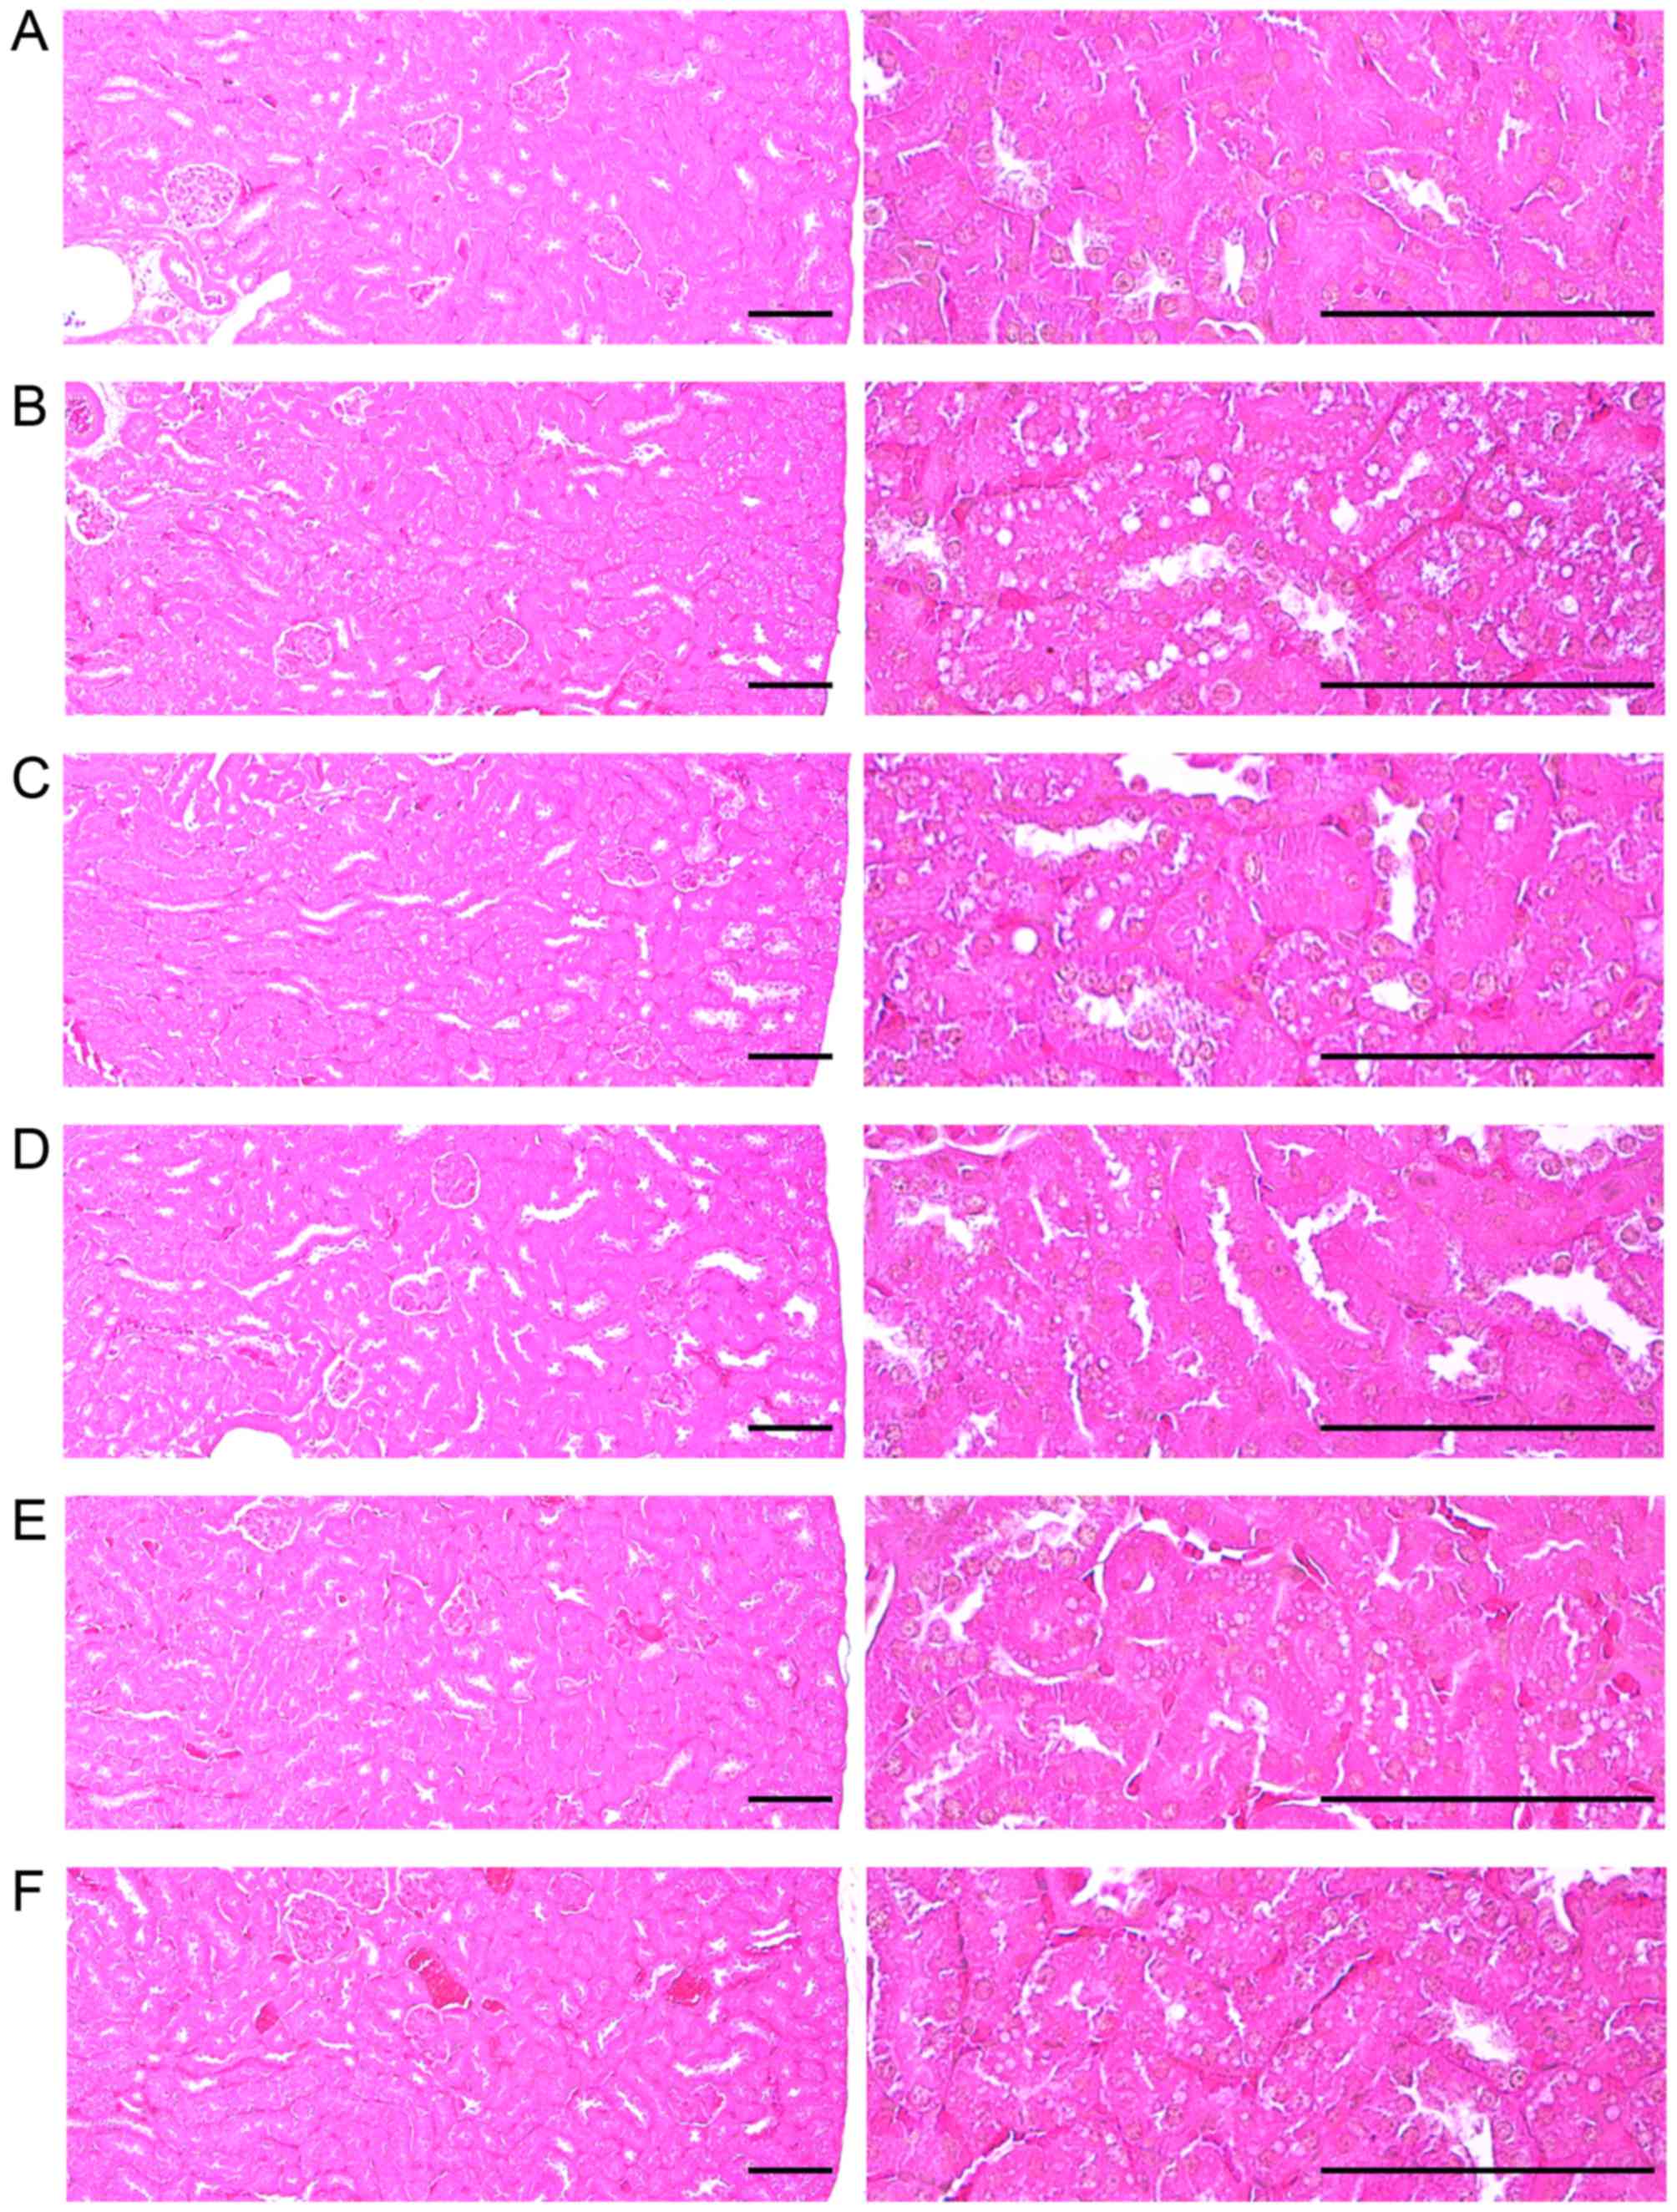 | Figure 8Representative histological images of
the kidneys, taken from NFD- or HFD-fed mice. Note that a
significant increase in degenerative vacuolated renal tubules was
detected in the HFD-fed controls as compared with the intact
controls, resulting from lipid droplet deposited nephropathies;
however, these effects were significantly normalized by treatment
with all test substances, including simvastatin 10 mg/kg as
compared with the HFD-fed controls. (A) Intact control: normal
pellet diet-fed vehicle control mice; administered 10 ml/kg of
distilled water orally. (B) HFD (vehicle) control, 10 ml/kg of
distilled water administered orally with HFD supply. (C)
Simvastatin, 10 mg/kg of simvastatin administered with HFD supply.
(D) YPh 500, 500 mg/kg of YPh administered orally with HFD supply.
(E) YPh 250, 250 mg/kg of YPh administered orally with HFD supply.
(F) YPh 125, 125 mg/kg of YPh administered orally with HFD supply;
NFD, normal fat pellet die; HFD, 45% kcal high-fat diet; YPh,
yellow(head) catfish or Korean bullhead (Tachysurus
fulvidraco) protein hydrolysates, test material. All images
shown hematoxylin and eosin staining. Scale bars, 80 µm. |
Effects on liver lipid peroxidation and
the antioxidant defense system
Effects on liver lipid
peroxidation
A significant (p<0.01) increase in liver lipid
peroxidation (MDA content) was detected in the HFD-fed controls
compared with the intact controls; however, these effects were
significantly (p<0.01) normalized by treatment with all of the
test substances, including 10 mg/kg simvastatin, compared with
HFD-fed control mice (Table
VIII).
| Table VIIIChanges on the liver lipid
peroxidation and antioxidant defense systems in NFD- or HFD-fed
mice. |
Table VIII
Changes on the liver lipid
peroxidation and antioxidant defense systems in NFD- or HFD-fed
mice.
| Groups | Lipid peroxidation
| Antioxidant defense
system
|
|---|
| Malondialdehyde
(nM/mg tissue) | Glutathione
(µM/mg tissue) | Catalase (U/mg
tissue) | SOD (U/mg
tissue) |
|---|
| Controls |
| Intact | 11.57±1.89 | 35.91±6.38 | 30.81±7.18 | 3.31±1.02 |
| HFD | 31.14±7.01a | 10.99±2.29d | 10.33±2.51d | 0.87±0.13d |
| Reference |
| Simvastatin | 19.59±3.90a,c | 22.31±3.52d,f | 18.64±1.77d,f | 2.03±0.35d,f |
| YPh-treated |
| 500 mg/kg | 16.63±3.09b,c | 30.65±6.50f | 22.56±3.93d,f | 2.29±0.49e,f |
| 250 mg/kg | 21.20±3.16a,c | 21.86±2.94d,f | 17.83±2.85d,f | 1.97±0.13d,f |
| 125 mg/kg | 22.64±3.27a,c | 16.26±3.03d,f | 16.16±1.53d,f | 1.62±0.39d,f |
Effects on hepatic GSH content
A significant (p<0.01) decrease in the content
of hepatic GSH, a representative endogenous antioxidant, was
detected in the HFD-fed controls compared with the intact controls.
However, the hepatic GSH content (p<0.01) increased
significantly in all test substance-treated HFD-fed mice, including
the 10 mg/kg simvastatin-treated mice, compared with the HFD-fed
control mice (Table VIII).
Effects on hepatic CAT activity
A significant (p<0.01) decrease in the activity
of hepatic CAT, a representative endogenous antioxidant enzyme, was
detected in the HFD-fed controls compared with the intact controls;
however, this decreased activity of CAT was significantly
(p<0.01) normalized by treatment with the test substances
compared with the HFD-fed controls (Table VIII).
Effects on hepatic SOD activity
A significant (p<0.01) decrease in the activity
of hepatic SOD, another representative endogenous antioxidant
enzyme, was detected in the HFD-fed controls compared with the
intact controls; however, this effect was significantly (p<0.01)
normalized by treatment with all of the test substances, including
10 mg/kg simvastatin, compared with HFD-fed control mice (Table VIII).
Discussion
In the present study, we observed the true
pharmacological activities of YPh in obese mice with mild diabetes
fed a HFD, as previously described (12,33–35). Simvastatin (10 mg/kg) is a
lipid-lowering medication (14,15) used in the treatment of
dyslipidemia and for the prevention of cardiovascular disease in
patients with diabetes (12,13,18,19). The YPh doses in the present study
were selected based on in vivo efficacy tests of individual
herbal extracts by other investigators. The readily adapted mice to
the HFD were selected after a 7-day adaption period and were
divided into 6 groups. At the end of 12 weeks of continuous orally
administered YPh (500, 250 and 125 mg/kg) or 10 mg/kg simvastatin,
the hepatoprotective, hypolipidemic, nephroprotective and
anti-obesity effects were analyzed separately.
Obesity in mice develops by feeding on a HFD,
having the characteristics of hypolipidemia and hepatic steatosis
(12,13,33,34,50,51). On the other hand, animals fed a
HFD develop hyperglycemia and mild obesity and can be used to
identify agents that could be used to prevent metabolic syndrome
(52). In this study, we only
selected mice that were adapted to the HFD and exhibited a regular
increase in body weight compared with the intact controls (normal
diet) during the first 7 days of feeding (Table I). The HFD-fed control mice
exhibited a significant increase in body weight compared with the
intact mice, beginning the first 7 days after the HFD feeding
began, and body weight gains during the 7 days of adapting to HFD
and the 84 days of administration also increased significantly
compared with those of the intact controls (Table II and Fig. 1). However, the increase in body
mass and weight was significantly and dose-dependently inhibited by
treatment with simvastatin and YPh (Table II and Fig. 1). Obesity is mainly characterized
by an increase in fat deposition in the body and the expansion in
the intra-abdominal adipose tissues in rodents is caused by
cellular hypertrophy (12,13,39,53,54).
Adipose tissue is not simply an energy storage organ, but also an
endocrine and secretory organ (55). Adipokines are secreted by the
adipose tissues, and changes in the action, secretion and
expression of adipokines are involved in the development of various
syndromes, including insulin resistance (39,55,56). In the present study, treatment
with YPh significantly and dose-dependently inhibited the
accumulation of fat and adipocyte hypertrophy (Table III), providing direct evidence
that YPh has clear anti-obesity effects in HFD-fed mice. In this
study, the 10 mg/kg simvastatin-treated mice also exhibited a
noticeable decrease in fat accumulation and mean white adipocyte
diameter according to the DXA and histopathological analyses
(Table VI and Figs. 2 and 4).
The decrease in mean daily food consumption in all
HFD-fed mice compared with those fed the normal diet was not
unexpected in our study as the energy content of the HFD (4.73
kcal/g) was much higher (approximately 20-fold) (Table I) than that of the normal diet
(0.21 kcal/g). A similar decrease in daily food consumption in the
HFD-fed mice has been reported (13,39). In the present study, no changes in
mean daily food consumption were detected among all the test
substance-administered groups compared with the HFD-fed control
(Table II), suggesting that it
was difficult to use the pharmacological effects of the test
substances to consider the effects of lower food consumption.
Obese subjects often develop acinar cell atrophy,
pancreatic steatosis and the number of zymogen granules decreases
(39,57,58). An increase in the number of
zymogen granules in exocrine pancreatic acinar cells directs the
production of lipid and protein digestive enzymes (59). In the present study, a decrease in
the number of pancreatic zymogen granules was also noted in the
HFD-fed control mice as compared with the intact controls. However,
the decrease in zymogen deposits in the exocrine pancreas was
dose-dependently inhibited by YPh treatment, but not by treatment
with 10 mg/kg simvastatin (Table
V and Fig. 5). The findings
revealed that YPh exerted anti-obesity effects in HFD-fed mice that
may be intervened by inhibiting lipid digestion and decreasing
pancreatic enzyme production or release. Simvastatin (10 mg/kg) did
not affect the zymogen granule-occupied regions in the exocrine
pancreas compared with HFD-fed control mice (Table V and Fig. 5).
We could not completely exclude the possibility
that YPh increased digestive tract motility; thus, more detailed
mechanistic studies are warranted in the future. The rise in
digestive tract motility also increases excretion, resulting in a
decrease in body weight (60–62). In this study, we observed a
substantial increase in the fecal TG and TC contents in response to
all YPh treatments and 10 mg/kg simvastatin (Fig. 6). The slight increase in fecal TG
and TC contents noted in the HFD-fed control mice in this study was
considered to be the secondary effects of consuming the HFD.
Hyperlipidemia generally occurs during the chronic
progression of diabetes in HFD-fed mice (63). As the most critical issue in
hyperlipidemia is increased serum TC, TG and LDL levels and
decreased HDL levels (12,13,64),
the efficacy of hypolipidemic agents is generally evaluated based
on the decrease in serum TC, TG and LDL levels as HDL levels
increase (12,13,39,65). In the present study, all 3 doses
of YPh (500, 250 and 125 mg/kg) effectively and dose-dependently
decreased serum TC, TG and LDL levels, but favorably increased
serum HDL levels compared with those in the HFD-fed control mice,
suggesting that YPh has favorable hypolipidemic effects in HFD-fed
mice, which may be mediated by inhibiting lipid digestion due to
the decrease in pancreatic enzyme production or release in this
experiment (Table VI). In
particular, 250 mg/kg YPh exerted comparable hypolipidemic effects
to those of 10 mg/kg simvastatin in HFD-fed mice (Table VI). These hypolipidemic
properties of the test substances were also due to decreased lipid
absorption and elimination of lipids in feces.
As obesity progresses, liver weight increases due
to abnormal glycosylation and fibrosis related to hepatocyte
hypertrophy and hepatosteatosis, due to lipid deposition in the
cytoplasm along with increased serum ALT and AST levels (13,39,66). The attenuation of these
abnormalities depicts attenuated hepatopathy (66). AST is detectable in numerous body
tissues, but is principally high in striated muscle and the liver.
Elevated serum AST activity and no increase in ALT levels indicate
muscle necrosis, but AST activity increases more slowly than that
of ALT with liver damage. This indicates complete cellular
disruption as ALT leaks only from necrotic cells (67). ALT is present in large quantities
in the cytoplasm of hepatocytes and it enters the blood when liver
cells are destroyed or damaged. This enzyme is a sensitive
indicator of active liver damage, but does not indicate the cause
or reversibility of the damage (67). In the present study, all 3
different YPh doses effectively attenuated hepatopathy compared
with the HFD-fed control mice, suggesting that YPh has favorable
hepatoprotective effects in HFD-fed mice. Simvastatin also exerted
favorable inhibitory effects on the increased liver weight
(Table III), serum ALT and AST
(Table VII), and related
hepatocyte hypertrophic and histopathological steatohepatitis
induced by feeding the HFD (Table
V and Fig. 6).
As obesity progresses, kidney weight also increases
due to swelling, inflammation and necrosis along with the elevation
of serum creatinine and BUN levels, or so-called nephropathy. The
attenuation in these abnormalities is direct evidence of attenuated
nephropathy (13,39). BUN is the amount of urea nitrogen
(protein metabolic product) in the blood. High BUN levels generally
cause renal disease. Creatinine is a non-protein nitrogenous
product of muscle metabolism, and serum creatinine levels increase
with conditions that reduce glomerular filtration (67). In this study, HFD-fed mice
exhibited a marked increase in absolute kidney weight and increased
creatinine and serum BUN levels with lipid droplet deposition
related to vacuolation of the renal tubules, suggesting a mild
nephropathy, but they were normalized by all 3 YPh doses and
simvastatin, indicating that they have favorable nephroprotective
effects (Tables III and
VII and Fig. 8).
Considerable evidence indicates a role for free
radicals in the altered antioxidant defense in the etiology of
diabetes (68). Diabetes mellitus
from its genesis to the development of microvascular complications
is affected by oxidative stress. Free radicals are generated by
hyperglycemia due to glucose autooxidation. Glycosylated proteins
are a source of reactive oxygen species (ROS) (39,69). Oxidative stress is linked to a
decrease in the antioxidant status (70) which could alter the deleterious
effects of free radicals. ROS-related oxidative stress plays an
important role in the etiology of complications from obesity
(71). Various toxic substances
generated from lipid peroxidation have been demonstrated in HFD-fed
mice, where they act as a potent redox cycler by generating harmful
ROS and damage organs (73,74). GSH is a representative endogenous
antioxidant that inhibits tissue damage by maintaining ROS at low
levels and is a protective antioxidant in tissues (75).
CAT catalyzes the conversion of
H2O2 to H2O and SOD is an
antioxidant enzyme that contributes to enzymatic defense mechanisms
(76). Decreased endogenous
antioxidants, GSH content and increased lipid peroxidation,
antioxidant enzymes, CAT and SOD activities occur in damaged liver
tissues, and as a secondary role help to combat obesity and various
related complications (77,78). In this study, a marked depleted
GSH content, elevation of hepatic lipid peroxidation, and decreased
CAT and SOD activities were noted in the HFD-fed control mice,
which was similar to other reported HFD-fed mice studies (79,80). In the present study, all 3 YPh
concentrations dose-dependently inhibited the deterioration in the
hepatic antioxidant defense system compared with the HFD=−fed
control mice, suggesting favorable antioxidant effects of YPh on
HFD mice. Simvastatin also exerted favorable antioxidant effects
(Table VIII).
In conclusion, the results of this study suggest
that YPh exerts potent anti-obesity and complication-ameliorating
effects in HFD-fed mice by enhancing the modulating effects of
hepatic glucose enzyme and antioxidant activities, as well as
pancreatic lipid digestive enzymes. The overall effects of 250
mg/kg YPh on HFD-induced diabetes and related complications were
similar or more potent than those of 10 mg/kg simvastatin in this
study. Accordingly, YPh is a promising novel medicinal ingredient
which may has potential for use in the treatment of obesity and
related complications.
Acknowledgments
This study was a component of the project (no.
20130285) entitled 'Development of high value material and
bioactive components from freshwater fish', funded by the Ministry
of Oceans and Fisheries, Korea.
References
|
1
|
Wendel AA, Purushotham A, Liu LF and
Belury MA: Conjugated linoleic acid fails to worsen insulin
resistance but induces hepatic steatosis in the presence of leptin
in ob/ob mice. J Lipid Res. 49:98–106. 2008. View Article : Google Scholar
|
|
2
|
Tilg H and Moschen AR: Adipocytokines:
Mediators linking adipose tissue, inflammation and immunity. Nat
Rev Immunol. 6:772–783. 2006. View Article : Google Scholar : PubMed/NCBI
|
|
3
|
James PT, Leach R, Kalamara E and Shayeghi
M: The worldwide obesity epidemic. Obes Res. 9(Suppl 4): 228S–233S.
2001. View Article : Google Scholar : PubMed/NCBI
|
|
4
|
Zimmet P: The burden of type 2 diabetes:
are we doing enough? Diabetes Metab. 29:6S9–6S18. 2003. View Article : Google Scholar : PubMed/NCBI
|
|
5
|
Kunitomi M, Wada J, Takahashi K,
Tsuchiyama Y, Mimura Y, Hida K, Miyatake N, Fujii M, Kira S,
Shikata K, et al: Relationship between reduced serum IGF-I levels
and accumulation of visceral fat in Japanese men. Int J Obes Relat
Metab Disord. 26:361–369. 2002. View Article : Google Scholar : PubMed/NCBI
|
|
6
|
Hida K, Wada J, Eguchi J, Zhang H, Baba M,
Seida A, Hashimoto I, Okada T, Yasuhara A, Nakatsuka A, et al:
Visceral adipose tissue-derived serine protease inhibitor: A unique
insulin-sensitizing adipocytokine in obesity. Proc Natl Acad Sci
USA. 102:10610–10615. 2005. View Article : Google Scholar : PubMed/NCBI
|
|
7
|
Lebovitz HE: Insulin resistance:
Definition and consequences. Exp Clin Endocrinol Diabetes.
109(Suppl 2): S135–S148. 2001. View Article : Google Scholar : PubMed/NCBI
|
|
8
|
Goldstein BJ: Insulin resistance as the
core defect in type 2 diabetes mellitus. Am J Cardiol. 90:3G–10G.
2002. View Article : Google Scholar : PubMed/NCBI
|
|
9
|
Angulo P: Nonalcoholic fatty liver
disease. N Engl J Med. 346:1221–1231. 2002. View Article : Google Scholar : PubMed/NCBI
|
|
10
|
Kadowaki T and Yamauchi T: Adiponectin and
adiponectin receptors. Endocr Rev. 26:439–451. 2005. View Article : Google Scholar : PubMed/NCBI
|
|
11
|
Inzucchi SE: Oral antihyperglycemic
therapy for type 2 diabetes: Scientific review. JAMA. 287:360–372.
2002. View Article : Google Scholar : PubMed/NCBI
|
|
12
|
Jung YM, Lee SH, Lee DS, You MJ, Chung IK,
Cheon WH, Kwon YS, Lee YJ and Ku SK: Fermented garlic protects
diabetic, obese mice when fed a high-fat diet by antioxidant
effects. Nutr Res. 31:387–396. 2011. View Article : Google Scholar : PubMed/NCBI
|
|
13
|
Kim CM, Yi SJ, Cho IJ and Ku SK: Red-koji
fermented red ginseng ameliorates high fat diet-induced metabolic
disorders in mice. Nutrients. 5:4316–4332. 2013. View Article : Google Scholar : PubMed/NCBI
|
|
14
|
Föger B: Lipid lowering therapy in type 2
diabetes. Wien Med Wochenschr. 161:289–296. 2011. View Article : Google Scholar : PubMed/NCBI
|
|
15
|
Desai CS, Martin SS and Blumenthal RS:
Non-cardiovascular effects associated with statins. BMJ.
349:g37432014. View Article : Google Scholar : PubMed/NCBI
|
|
16
|
Wei P, Grimm PR, Settles DC, Balwanz CR,
Padanilam BJ and Sansom SC: Simvastatin reverses podocyte injury
but not mesangial expansion in early stage type 2 diabetes
mellitus. Ren Fail. 31:503–513. 2009. View Article : Google Scholar : PubMed/NCBI
|
|
17
|
Wang L, Duan G, Lu Y, Pang S, Huang X,
Jiang Q and Dang N: The effect of simvastatin on glucose
homeostasis in streptozotocin induced type 2 diabetic rats. J
Diabetes Res. 2013:2749862013. View Article : Google Scholar : PubMed/NCBI
|
|
18
|
American Diabetes Association: Management
of dyslipidemia in adults with diabetes. Diabetes Care. 25:S74–S77.
2002. View Article : Google Scholar
|
|
19
|
Wald NJ and Law MR: A strategy to reduce
cardiovascular disease by more than 80%. BMJ. 326:14192003.
View Article : Google Scholar : PubMed/NCBI
|
|
20
|
Abbas AM and Sakr HF: Simvastatin and
vitamin E effects on cardiac and hepatic oxidative stress in rats
fed on high fat diet. J Physiol Biochem. 69:737–750. 2013.
View Article : Google Scholar : PubMed/NCBI
|
|
21
|
Cui B, Liu S, Lin X, Wang J and Li S, Wang
Q and Li S: Effects of Lycium barbarum aqueous and ethanol extracts
on high-fat-diet induced oxidative stress in rat liver tissue.
Molecules. 16:9116–9128. 2011. View Article : Google Scholar : PubMed/NCBI
|
|
22
|
Simsek Ozek N, Bal IB, Sara Y, Onur R and
Severcan F: Structural and functional characterization of
simvastatin-induced myotoxicity in different skeletal muscles.
Biochim Biophys Acta. 1840:406–415. 2014. View Article : Google Scholar
|
|
23
|
Magni P, Macchi C, Morlotti B, Sirtori CR
and Ruscica M: Risk identification and possible countermeasures for
muscle adverse effects during statin therapy. Eur J Intern Med.
26:82–88. 2015. View Article : Google Scholar : PubMed/NCBI
|
|
24
|
López-Barrios L, Gutiérrez-Uribe JA and
Serna-Saldívar SO: Bioactive peptides and hydrolysates from pulses
and their potential use as functional ingredients. J Food Sci.
79:R273–R283. 2014. View Article : Google Scholar : PubMed/NCBI
|
|
25
|
Nesse KO, Nagalakshmi AP, Marimuthu P and
Singh M: Efficacy of a fish protein hydrolysate in malnourished
children. Indian J Clin Biochem. 26:360–365. 2011. View Article : Google Scholar :
|
|
26
|
Ryan JT, Ross RP, Bolton D, Fitzgerald GF
and Stanton C: Bioactive peptides from muscle sources: Meat and
fish. Nutrients. 3:765–791. 2011. View Article : Google Scholar
|
|
27
|
Kim KM, Chang UJ, Kang DH, Kim JM, Choi YM
and Suh HJ: Yeast hydrolysate reduces body fat of dietary obese
rats. Phytother Res. 18:950–953. 2004. View Article : Google Scholar : PubMed/NCBI
|
|
28
|
Wergedahl H, Gudbrandsen OA, Røst TH and
Berge RK: Combination of fish oil and fish protein hydrolysate
reduces the plasma cholesterol level with a concurrent increase in
hepatic cholesterol level in high-fat-fed Wistar rats. Nutrition.
25:98–104. 2009. View Article : Google Scholar
|
|
29
|
Liu X, Zhang M, Zhang C and Liu C:
Angiotensin converting enzyme (ACE) inhibitory, antihypertensive
and antihyperlipidaemic activities of protein hydrolysates from
Rhopilema esculentum. Food Chem. 134:2134–2140. 2012. View Article : Google Scholar
|
|
30
|
Mun JM, Ok HM and Kwon O: Corn gluten
hydrolysate and capsaicin have complimentary actions on body weight
reduction and lipid-related genes in diet-induced obese rats. Nutr
Res. 34:458–465. 2014. View Article : Google Scholar : PubMed/NCBI
|
|
31
|
Gu Z, Wang J, Li M, Zhang J, Ke X and Gong
X: Morphological and genetic differences of Trypanosoma in some
Chinese freshwater fishes: Difficulties of species identification.
Parasitol Res. 101:723–730. 2007. View Article : Google Scholar : PubMed/NCBI
|
|
32
|
Chen QL, Luo Z, Zheng JL, Li XD, Liu CX,
Zhao YH and Gong Y: Protective effects of calcium on copper
toxicity in Pelteobagrus fulvidraco: Copper accumulation, enzymatic
activities, histology. Ecotoxicol Environ Saf. 76:126–134. 2012.
View Article : Google Scholar
|
|
33
|
Yun SN, Moon SJ, Ko SK, Im BO and Chung
SH: Wild ginseng prevents the onset of high-fat diet induced
hyperglycemia and obesity in ICR mice. Arch Pharm Res. 27:790–796.
2004. View Article : Google Scholar : PubMed/NCBI
|
|
34
|
Lee JW, Lee KW, Lee SW, Kim IH and Rhee C:
Selective increase in pinolenic acid (all-cis-5,9,12-18::3) in
Korean pine nut oil by crystallization and its effect on
LDL-receptor activity. Lipids. 39:383–387. 2004. View Article : Google Scholar : PubMed/NCBI
|
|
35
|
Kim UH, Yoon JH, Li H, Kang JH, Ji HS,
Park KH, Shin DH, Park HY and Jeong TS: Pterocarpan-enriched soy
leaf extract ameliorates insulin sensitivity and pancreatic β-cell
proliferation in type 2 diabetic mice. Molecules. 19:18493–18510.
2014. View Article : Google Scholar : PubMed/NCBI
|
|
36
|
Folch J, Lees M and Sloane Stanley GH: A
simple method for the isolation and purification of total lipides
from animal tissues. J Biol Chem. 226:497–509. 1957.PubMed/NCBI
|
|
37
|
Allain CC, Poon LS, Chan CSG, Richmond W
and Fu PC: Enzymatic determination of total serum cholesterol. Clin
Chem. 20:470–475. 1974.PubMed/NCBI
|
|
38
|
McGowan MW, Artiss JD, Strandbergh DR and
Zak B: A peroxidase-coupled method for the colorimetric
determination of serum triglycerides. Clin Chem. 29:538–542.
1983.PubMed/NCBI
|
|
39
|
Kang SJ, Lee JE, Lee EK, Jung DH, Song CH,
Park SJ, Choi SH, Han CH, Ku SK and Lee YJ: Fermentation with
Aquilariae Lignum enhances the anti-diabetic activity of green tea
in type II diabetic db/db mouse. Nutrients. 6:3536–3571. 2014.
View Article : Google Scholar : PubMed/NCBI
|
|
40
|
Kavutcu M, Canbolat O, Oztürk S, Olcay E,
Ulutepe S, Ekinci C, Gökhun IH and Durak I: Reduced enzymatic
antioxidant defense mechanism in kidney tissues from
gentamicin-treated guinea pigs: Effects of vitamins E and C.
Nephron. 72:269–274. 1996. View Article : Google Scholar : PubMed/NCBI
|
|
41
|
Jamall IS and Smith JC: Effects of cadmium
on glutathione peroxidase, superoxide dismutase, and lipid
peroxidation in the rat heart: A possible mechanism of cadmium
cardiotoxicity. Toxicol Appl Pharmacol. 80:33–42. 1985. View Article : Google Scholar : PubMed/NCBI
|
|
42
|
Lowry OH, Rosebrough NJ, Farr AL and
Randall RJ: Protein measurement with the Folin phenol reagent. J
Biol Chem. 193:265–275. 1951.PubMed/NCBI
|
|
43
|
Sedlak J and Lindsay RH: Estimation of
total, protein-bound, and nonprotein sulfhydryl groups in tissue
with Ellman's reagent. Anal Biochem. 25:192–205. 1968. View Article : Google Scholar : PubMed/NCBI
|
|
44
|
Aebi H: Catalase. Methods in Enzymatic
Analysis. Bergmeyer HU: Academic Press; New York: pp. 673–686.
1974, View Article : Google Scholar
|
|
45
|
Sun Y, Oberley LW and Li Y: A simple
method for clinical assay of superoxide dismutase. Clin Chem.
34:497–500. 1988.PubMed/NCBI
|
|
46
|
Kawakami S, Han KH, Nakamura Y, Shimada K,
Kitano T, Aritsuka T, Nagura T, Ohba K, Nakamura K and Fukushima M:
Effects of dietary supplementation with betaine on a nonalcoholic
steatohepatitis (NASH) mouse model. J Nutr Sci Vitaminol (Tokyo).
58:371–375. 2012. View Article : Google Scholar
|
|
47
|
Lee HS, Chang JH and Ku SK: An
immunohistochemical study of the pancreatic endocrine cells of the
ddN mouse. Folia Histochem Cytobiol. 48:387–393. 2010. View Article : Google Scholar : PubMed/NCBI
|
|
48
|
Levene A: Pathological factors influencing
excision of tumours in the head and neck. Part I. Clin Otolaryngol
Allied Sci. 6:145–151. 1981. View Article : Google Scholar : PubMed/NCBI
|
|
49
|
Ludbrook J: Update: Microcomputer
statistics packages. A personal view. Clin Exp Pharmacol Physiol.
24:294–296. 1997. View Article : Google Scholar : PubMed/NCBI
|
|
50
|
Surwit RS, Kuhn CM, Cochrane C, McCubbin
JA and Feinglos MN: Diet-induced type II diabetes in C57BL/6J mice.
Diabetes. 37:1163–1167. 1988. View Article : Google Scholar : PubMed/NCBI
|
|
51
|
Thupari JN, Kim EK, Moran TH, Ronnett GV
and Kuhajda FP: Chronic C75 treatment of diet-induced obese mice
increases fat oxidation and reduces food intake to reduce adipose
mass. Am J Physiol Endocrinol Metab. 287:E97–E104. 2004. View Article : Google Scholar : PubMed/NCBI
|
|
52
|
Park SH, Ko SK and Chung SH: Euonymus
alatus prevents the hyperglycemia and hyperlipidemia induced by
high-fat diet in ICR mice. J Ethnopharmacol. 102:326–335. 2005.
View Article : Google Scholar : PubMed/NCBI
|
|
53
|
DiGirolamo M, Fine JB, Tagra K and
Rossmanith R: Qualitative regional differences in adipose tissue
growth and cellularity in male Wistar rats fed ad libitum. Am J
Physiol. 274:R1460–R1467. 1998.PubMed/NCBI
|
|
54
|
Morange PE, Lijnen HR, Alessi MC, Kopp F,
Collen D and Juhan-Vague I: Influence of PAI-1 on adipose tissue
growth and metabolic parameters in a murine model of diet-induced
obesity. Arterioscler Thromb Vasc Biol. 20:1150–1154. 2000.
View Article : Google Scholar : PubMed/NCBI
|
|
55
|
Fujita H, Fujishima H, Koshimura J, Hosoba
M, Yoshioka N, Shimotomai T, Morii T, Narita T, Kakei M and Ito S:
Effects of anti-diabetic treatment with metformin and insulin on
serum and adipose tissue adiponectin levels in db/db mice. Endocr
J. 52:427–433. 2005. View Article : Google Scholar : PubMed/NCBI
|
|
56
|
Mitchell M, Armstrong DT, Robker RL and
Norman RJ: Adipokines: Implications for female fertility and
obesity. Reproduction. 130:583–597. 2005. View Article : Google Scholar : PubMed/NCBI
|
|
57
|
Tasso F, Clop J and Sarles H: The
interaction of ethanol, dietary lipids and proteins on the rat
pancreas. II. Ultrastructural study. Digestion. 4:23–34. 1971.
View Article : Google Scholar : PubMed/NCBI
|
|
58
|
Wilson JS, Korsten MA, Leo MA and Lieber
CS: Combined effects of protein deficiency and chronic ethanol
consumption on rat pancreas. Dig Dis Sci. 33:1250–1259. 1988.
View Article : Google Scholar : PubMed/NCBI
|
|
59
|
Gartner LP and Hiatt JL: Color Textbook of
Histology. 3rd edition. Saunders; Philadelphia: pp. 417–422.
2007
|
|
60
|
Hyland NP, Rybicka JM, Ho W, Pittman QJ,
Macnaughton WK and Sharkey KA: Adaptation of intestinal
secretomotor function and nutrient absorption in response to
diet-induced obesity. Neurogastroenterol Motil. 22:602–e171. 2010.
View Article : Google Scholar : PubMed/NCBI
|
|
61
|
Bertrand RL, Senadheera S, Markus I, Liu
L, Howitt L, Chen H, Murphy TV, Sandow SL and Bertrand PP: A
Western diet increases serotonin availability in rat small
intestine. Endocrinology. 152:36–47. 2011. View Article : Google Scholar
|
|
62
|
Snedeker SM and Hay AG: Do interactions
between gut ecology and environmental chemicals contribute to
obesity and diabetes? Environ Health Perspect. 120:332–339. 2012.
View Article : Google Scholar :
|
|
63
|
Chen X, Osborne MC, Rybczynski PJ, Zeck R,
Yang M, Xu J, Zhou L, Cryan E, Tang Y and Demarest KT:
Pharmacological profile of a novel, non-TZD PPARgamma agonist.
Diabetes Obes Metab. 7:536–546. 2005. View Article : Google Scholar : PubMed/NCBI
|
|
64
|
Kamada T, Hata J, Kusunoki H, Ito M,
Tanaka S, Kawamura Y, Chayama K and Haruma K: Eradication of
Helicobacter pylori increases the incidence of hyperlipidaemia and
obesity in peptic ulcer patients. Dig Liver Dis. 37:39–43. 2005.
View Article : Google Scholar : PubMed/NCBI
|
|
65
|
Zdrenghea D, Gligor E, Ossian V and Pop D:
The effect of simvastatin associated with ranitidine and alcohol
upon serum lipids. Rom J Intern Med. 42:143–148. 2004.PubMed/NCBI
|
|
66
|
Quine SD and Raghu PS: Effects of
(−)-epicatechin, a flavonoid on lipid peroxidation and antioxidants
in streptozotocin-induced diabetic liver, kidney and heart.
Pharmacol Rep. 57:610–615. 2005.PubMed/NCBI
|
|
67
|
Sodikoff CH: Laboratory profiles of small
animal diseases. A guide to laboratory diagnosis. 2nd edition.
Mosby Inc; St Louise: pp. 1–36. 1995
|
|
68
|
Garg MC, Singh KP and Bansal DD: Effect of
vitamin C supplementation on oxidative stress in experimental
diabetes. Indian J Exp Biol. 35:264–266. 1997.PubMed/NCBI
|
|
69
|
Ceriello A, Quatraro A and Giugliano D:
New insights on non-enzymatic glycosylation may lead to therapeutic
approaches for the prevention of diabetic complications. Diabet
Med. 9:297–299. 1992. View Article : Google Scholar : PubMed/NCBI
|
|
70
|
Collier A, Wilson R, Bradley H, Thomson JA
and Small M: Free radical activity in type 2 diabetes. Diabet Med.
7:27–30. 1990. View Article : Google Scholar : PubMed/NCBI
|
|
71
|
Giugliano D, Ceriello A and Paolisso G:
Oxidative stress and diabetic vascular complications. Diabetes
Care. 19:257–267. 1996. View Article : Google Scholar : PubMed/NCBI
|
|
72
|
Comporti M: Lipid peroxidation and
cellular damage in toxic liver injury. Lab Invest. 53:599–623.
1985.PubMed/NCBI
|
|
73
|
Lee YM, Gweon OC, Seo YJ, Im J, Kang MJ,
Kim MJ and Kim JI: Antioxidant effect of garlic and aged black
garlic in animal model of type 2 diabetes mellitus. Nutr Res Pract.
3:156–161. 2009. View Article : Google Scholar : PubMed/NCBI
|
|
74
|
Jung UJ, Park YB, Kim SR and Choi MS:
Supplementation of persimmon leaf ameliorates hyperglycemia,
dyslipidemia and hepatic fat accumulation in type 2 diabetic mice.
PLoS One. 7:e490302012. View Article : Google Scholar : PubMed/NCBI
|
|
75
|
Odabasoglu F, Cakir A, Suleyman H, Aslan
A, Bayir Y, Halici M and Kazaz C: Gastroprotective and antioxidant
effects of usnic acid on indomethacin-induced gastric ulcer in
rats. J Ethnopharmacol. 103:59–65. 2006. View Article : Google Scholar
|
|
76
|
Cheeseman KH and Slater TF: An
introduction to free radical biochemistry. Br Med Bull. 49:481–493.
1993. View Article : Google Scholar : PubMed/NCBI
|
|
77
|
Erejuwa OO, Sulaiman SA, Wahab MS, Salam
SK, Salleh MS and Gurtu S: Comparison of antioxidant effects of
honey, glibenclamide, metformin, and their combinations in the
kidneys of streptozotocin-induced diabetic rats. Int J Mol Sci.
12:829–843. 2011. View Article : Google Scholar : PubMed/NCBI
|
|
78
|
Wu D, Wen W, Qi CL, Zhao RX, Lü JH, Zhong
CY and Chen YY: Ameliorative effect of berberine on renal damage in
rats with diabetes induced by high-fat diet and streptozotocin.
Phytomedicine. 19:712–718. 2012. View Article : Google Scholar : PubMed/NCBI
|
|
79
|
Chung SI, Rico CW and Kang MY: Comparative
study on the hypoglycemic and antioxidative effects of fermented
paste (doenjang) prepared from soybean and brown rice mixed with
rice bran or red ginseng marc in mice fed with high fat diet.
Nutrients. 6:4610–4624. 2014. View Article : Google Scholar : PubMed/NCBI
|
|
80
|
Wu D, Zheng N, Qi K, Cheng H, Sun Z, Gao
B, Zhang Y, Pang W, Huangfu C, Ji S, et al: Exogenous hydrogen
sulfide mitigates the fatty liver in obese mice through improving
lipid metabolism and antioxidant potential. Med Gas Res. 5:12015.
View Article : Google Scholar : PubMed/NCBI
|