Introduction
Even though gastric cancer (GC) incidence and
mortality have has markedly decreased over the past decades
(1), GC remains the third leading
cause of cancer-related mortality in China and worldwide, with
>300,000 deaths annually (2).
Depending on the effectiveness of diagnostic and treatment
strategies, excellent long-term survival results can be obtained
for early GC; however, the prognosis of patients with advanced GC
remains poor (3); thus, the
identification of cancer-related genes is of great importance in
the treatment of cancer (4).
To date, numerous genes have been found to be
involved in GC tumorigenesis. Among the reported GC-related genes,
most of them can also be found in other types of cancer. In this
study, using cDNA microarray and bioinformatics methods to
characterize cancer-related genes from GC tissue samples, we
identified 10 upregulated and 10 downregulated genes in GC tissues.
We selected the most upregulated gene, histone deacetylase 3
(HDAC3), for an in depth investigation in order to obtain a better
understanding of its molecular mechanisms of action within GC
tumorigenesis.
It is well known that the post-transcriptional
expression of gene can be mediated by microRNAs (miRNAs or miRs),
which is a class of endogenous, non-coding, single-stranded RNA
molecules of approximately 22 nucleotides in length (5). miRNAs mediate gene expression
through base pairing with the 3′ untranslated region (3′UTR) of
target messenger RNAs (mRNAs), resulting in the regulation of
cellular processes, such as cell differentiation, proliferation,
migration and apoptosis. miRNAs function as either tumor
suppressors or oncogenes (5–8).
Many oncogenes have been reported to be targeted by miRNAs this
leads to alterations in gene or protein levels (9). Therefore, the combination of
cancer-related gene expression profiles with targeted miRNA
expression profiles may help us to obtain more accurate molecular
information for predicting and controlling tumorigenesis. CHD5
belongs to a group of SWI/SNF proteins known as chromodomain
helicase DNA binding (CHD) proteins, which was first identified in
neuroblastomas on 1p36 in a region of most deletion (10). Previous studies have demonstrated
that CHD5 acts as tumor suppressor gene in various types of cancer,
including neuroblastoma, laryngeal squamouscell carcinoma, colon
cancer, lung cancer and GC (4,11–15). Thus, in this study, we identified
the tumor-promoting role of HDAC3, as well as its target miRNA and
downstream molecul. We demonstrate that HDAC3 is associated with GC
cell growth via the miR-454-mediated targeting of CHD5. Our
findings may enhance our understanding of the molecular mechanisms
of GC tumorigenesis.
Materials and methods
Human samples
A total of 60 samples of GC and matching non-tumor
adjacent tissues (non-tumor tissues) were collected from patients
who received surgery at the People's Hospital of Pudong (Shanghai,
China). All the patients provided written informed consent prior to
obtaining the samples. The dissected samples were frozen
immediately after surgery and stored at −80°C until use. All
procedures were approved by the Ethics Committee of the People's
Hospital of Pudong.
Cell culture
The human GC cell lines AGS, SGC-7901, MGC-803,
BGC-823, and the normal gastric cell line, GES-1, were obtained
from the Cell Bank of the Shanghai Institute of Biochemistry and
Cell Biology, Chinese Academy of Sciences (Shanghai, China). The
cells were cultured in Dulbecco's modified Eagle's medium (DMEM),
supplemented with 10% fetal bovine serum (FBS) under an atmosphere
of 5% CO2 at 37°C. Normal human cells were grown in
100-mm plastic dish.
RNA preparation
Total RNA was extracted using TRIzol reagent. The
NanoDrop ND-1000 spectrophotometer (NanoDrop Technologies Inc.,
Wilmington, DE, USA) was used to measure the amount of RNA sample.
Only samples with an A260/A280 ratio between 1.8 and 2.2 were
selected for use.
Low-density cDNA microarray
The total RNA was extracted from GC tissues and then
digested with RNase-free DNase I (Nippon Gene Co., Tokyo, Japan).
RNA amplifications, preparations of cDNA probes, hybridization,
washing and scanning were carried out as previously described
(16). The low-density cDNA
microarray was prepared by printing targets onto the amino slides
using Micro Grind II genechip spotting equipment (BioRobotics Ltd.,
Cambridge, UK).
Plasmid construction, small interfering
RNA and oligonucleotide systhesis
AdHDAC3 viral DNA (HDAC1) and the corresponding
control vector (Vector) were purchased from GeneChem (Shanghai,
China). The resulting viral particles were generated and amplified
in SGC-7901 cells according to standard procedures. Lentiviral
particles were produced as previously described (17). In brief, the SGC-7901 cells were
transfected with the lentiviral vector and the packaging plasmids
using FuGENE 6 (Roche, Indianapolis, IN, USA). For miR-454
depletion, small interfering RNA (siRNA) was synthesized and
purified by RiboBio Co., Ltd. (Guangzhou, China) and then used for
transfection. For HDAC3 knockdown in vitro, sh-HDAC3 and the
scramble vector (sh-cont) were purchased from GeneChem. Cell
transfection was performed using Lipofectamine 2000 (Sigma-Aldrich,
St. Louis, MO, USA) according to the manufacturer's
instructions.
Cell viability assay
The MTS kit (CellTiter 96 AQ; Promega, Madison, WI,
USA) was used to determine cell viability. The cells were seeded in
96-well plates at a density of 3–7×10³ cells/well.
Twelve hours later, the fresh mixture of MTS and PMS was added
followed by incubation for 2–4 h at 37°C. To measure the absorbance
at 450 nm, a MR7000 microplate reader (Dynatech, Carson, NV, USA)
was used.
Colony formation assay
The cells were trypsinized and plated on 6-well
plates and cultured for 2 weeks. The colonies were fixed with 4%
paraformaldehyde for 30 min, followed by staining with 1% crystal
violet (Sigma-Aldrich) for 30 sec. Finally, the number of colonies
was counted under a light microscope (Olympus Optical Ltd., London,
UK).
Low-density miRNA arrays
The low-density miRNA Taqman array was used to
obtain miRNA expression profiles. For each cDNA sample, small RNAs
were profiled. The cycling conditions and the calculation method of
raw Cq values were as previously described (18).
RNA expression
For mRNA expression analysis, mRNAs were quantified
by RT-qPCR and normalized to glyceraldehyde 3-phosphate
dehydrogenase (GAPDH). Briefly, 2 mg total RNA was reverse
transcribed using an OmniScript RT kit (Qiagen, Valencia, CA, USA),
and qPCR was conducted in a 10 ml reaction containing cDNA (20 ng),
SYBR-Green mix and primers. The samples were subjected to 45 cycles
of 95°C for 20 sec and 60°C for 1 min. The relative gene expression
values were determined using the 2−ΔΔCT method.
Bioinformatics analysis
The public web-based prediction site TargetScan
(http://www.targetscan.org) was used to
predict the potential miRNA-targeted gene transcripts.
Luciferase activity assay
Using the Dual-Luciferase Reporter Assay system
(Promega), the luciferase reporter gene assay was carried out. The
cells were seeded in 96-well plates, and wild-type or mutant
reporter constructs (termed wild or mut) were co-transfected into
the SGC-7901 cells with 100 nmol/l miR-454 or 100 nmol/l miR-NC and
Renilla plasmid using Lipofectamine 2000 (Invitrogen Life
Technologies Carlsbad, CA, USA). Reporter gene assays were
performed at 24 h post-transfection using the Dual-Luciferase Assay
system (Promega). Firefly luciferase activity was normalized for
transfection efficiency using the corresponding Renilla
luciferase activity.
Western blot analysis
Western blot analysis was carried out to detect the
protein levels. Protein was collected from tissues or cells that
were lysed in radioimmunoprecipitation (RIPA) buffer containing
protease inhibitors at 4°C for 30 min. Cell lysates were prepared
with a RIPA lysis buffer kit (Santa Cruz Biotechnology, Inc., Santa
Cruz, CA, USA), and the protein concentrations were quantified by
Bio-Rad protein assay (Bio-Rad Laboratories, Inc., Hercules, CA,
USA). Proteins (30 µg) were separated by 8% SDS-PAGE and
transferred onto polyvinylidene difluoride membranes (Amersham/GE
Healthcare, Chicago, IL, USA). The membranes were blocked in 5%
non-fat milk (Merck KGaA, Darmstadt, Germany) overnight at 4°C.
Transferred membranes were then stained with the following primary
antibodies: anti-HDAC3 (1:5,000; cat. no. ab32369), anti-CHD5
(1:2,000; cat. no. ab114095), and anti-GAPDH (1:500; cat. no.
ab8245) (all from Abcam, La Jolla, California, USA) overnight at
4°C. Subsequently, protein bands were detected by incubation with a
horseradish peroxidase-conjugated secondary antibody (1:1,000; cat.
no. A50-106P; Beijing Zhongshan Golden Bridge Biotechnology Co.,
Ltd., Beijing, China) at room temperature for 1 h. Signals were
detected using an enhanced chemiluminescence kit (cat. no.
orb90504; Wuhan Booute Biotechnology Co., Ltd, Wuhan, China) and
exposed to Kodak X-OMAT film (Kodak, Rochester, NY, USA). Each
experiment was performed at least 3 times and the results were
analyzed using Alpha View Analysis tools (AlphaView SA software,
version 3.2.2, ProteinSimple, Santa Clara, CA, USA).
GC xenograft model
The present study was approved by the Ethics
Committee of People's Hospital of Pudong. BALB/c male nude mice (6
weeks old, weighing 18–20 g) were purchased from the Shanghai
Laboratory Animal Center, Chinese Academy of Sciences (Shanghai,
China) and housed in polystyrene cages (2 mice per cage) with free
access to food and water, a 12/12 h light-darkness cycle, and an
ambient temperature of 20–25°C. Tumors were established by the
subcutaneous injection of 2×10⁶ cells transfected with
sh-cont or cells transfected with sh-HDAC3 into the right flank of
the mice (n=12 in each group). Since not every mouse developed
tumors after the inoculation of the cells, only those with visible
tumors (>50 mm3 in volume; approximately 8 weeks
after inoculation) were used in the subsequent experiments. At the
end of the experiments, the tumor weight was evaluated.
Statistical analysis
Data are presented as the means ± SEM. The Student's
t-test and one-way analysis of variance (ANOVA) were employed to
analyze the differences between sets of data. A value of p<0.05
was considered to indicate a statistically significant difference.
The association between the HDAC3 level and miR-454 level was
examined using Spearman's rank correlation, and this method was
also used to analyze the correlation between miR-454 expression and
the CHD5 level. The probability of overall survival was ascertained
using the Kaplan-Meier method, with a log-rank test to probe for
significance. Univariate and multivariate regression was performed
to analyze the effect of clinicopathological parameters on patient
survival, and the results are expressed as a hazard ratio (HR) with
95% confidence interval (CI).
Results
HDAC3 identified as the most
significantly upregulated gene in GC tissues
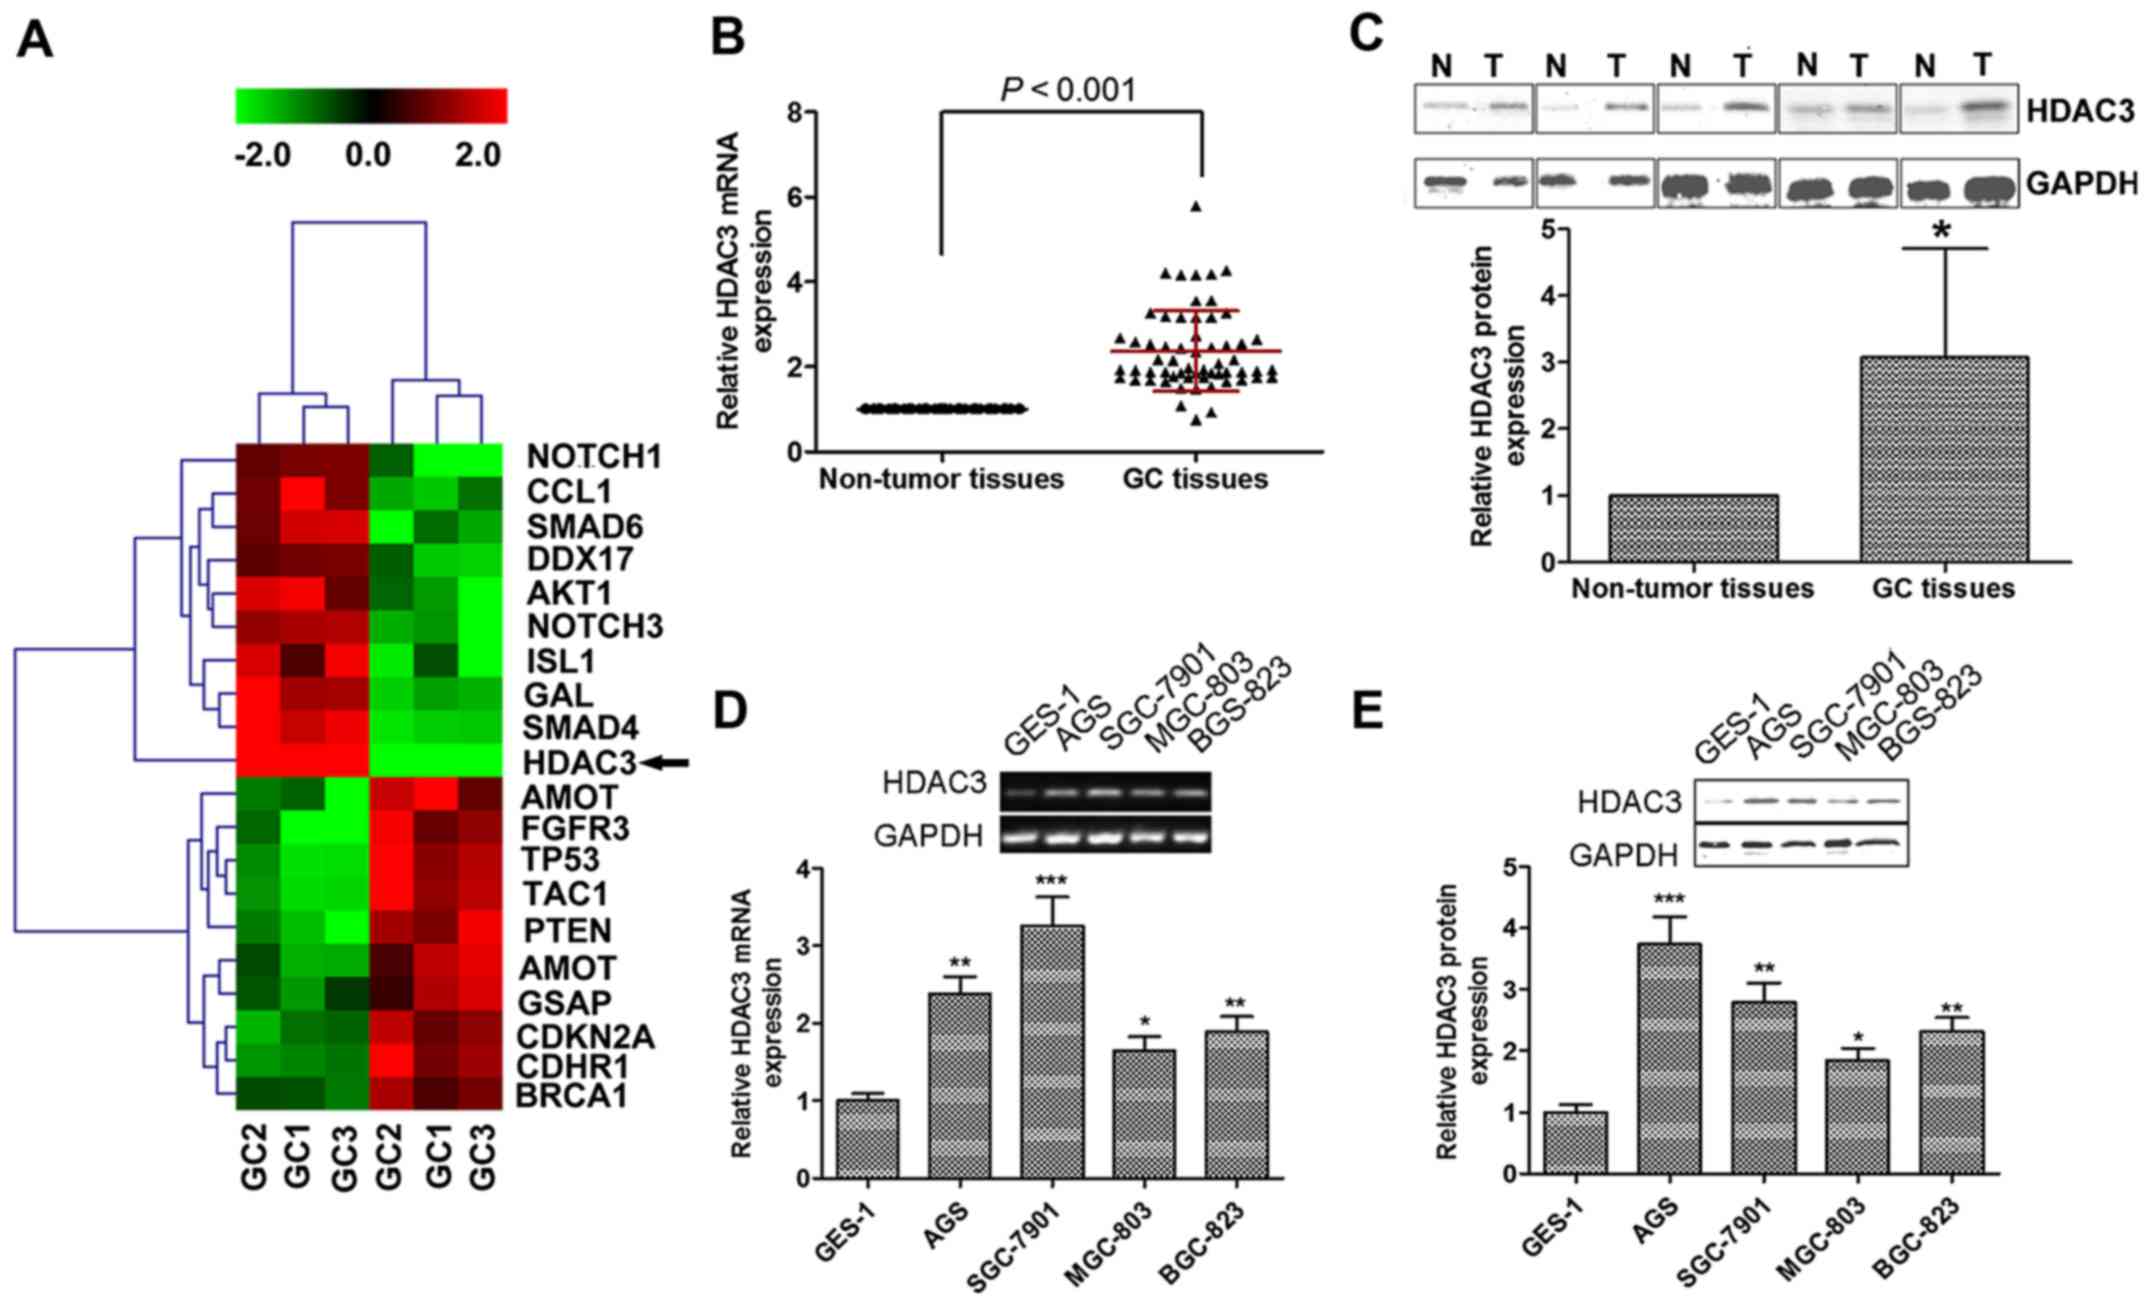
We analyzed the differential expression patterns
using low-density cDNA microarrays for GC and non-tumor tissues
samples. Based on the similarity in the expression pattern of
genes, unsupervised hierarchical clustering was analyzed. As
expected, the samples were separated into 2 groups, the normal
cluster and the GC cluster. Each distinctive gene cluster was
identified by delineation using a hierarchical clustering
dendrogram (Fig. 1A). Cluster I,
including genes upregulated in GC cells, consisted of the
tumor-related genes Notch homolog 1, translocation-associated
(Drosophila) (NOTCH1), C-C motif chemokine ligand 1 (CCL1),
SMAD6, DEAD-box helicase 17 (DDX17), AKT1, NOTCH3, ISL LIM homeobox
1 (ISL1), galanin (GAL), SMAD4 and HDAC3 (19–28). Cluster II consisted of genes
downregulated in GC cells, which were mainly tumor suppressor
genes, including angiomotin (AMOT), fibroblast growth factor
receptor 3 (FGFR3), tumor protein p53 (TP53), tachykinin precursor
1 (TAC1), phosphatase and tensin homolog (PTEN), cyclin-dependent
kinase inhibitor 2A (CDKN2A) and BRCA1 (29–35). In addition, gamma-secretase
activating protein (GSAP) and cadherin-related family member 1
(CDHR1) were also classified into cluster II; however, their role
in tumor development is unknown. The genes with differential
expression could also be classified into 5 subclusters, and the
most striking subcluster was HDAC3, showing surprisingly
differences between GC and normal cells.
HDAC3 is upregulated in GC tissues and
cell lines
We then examined HDAC3 expression in GC
tumorigenesis, utilizing 60 paired GC/non-tumor samples. HDAC3 mRNA
expression was significantly upregulated in human GC tissues
compared with non-tumor tissues (Fig.
1B). Similarly, the protein expression of HDAC3 was increased
by almost 2-fold in the GC tissues compared with the non-tumor
tissues (Fig. 1C).
We then compared the mRNA and protein levels of
HDAC3 in normal epithelial cells (GES-1) and GC cell lines (AGS,
SGS-7901, MGC-803 and BGC-823). As shown in Fig. 1D and E, HDAC3 was also upregulated
in the GC cell lines, and its expression was markedly higher in the
GC cells than in the GES-1 normal cells. Taken together, our
findings indicate that both HDAC3 mRNA and protein expression is
upregulated in human GC tissues and cells.
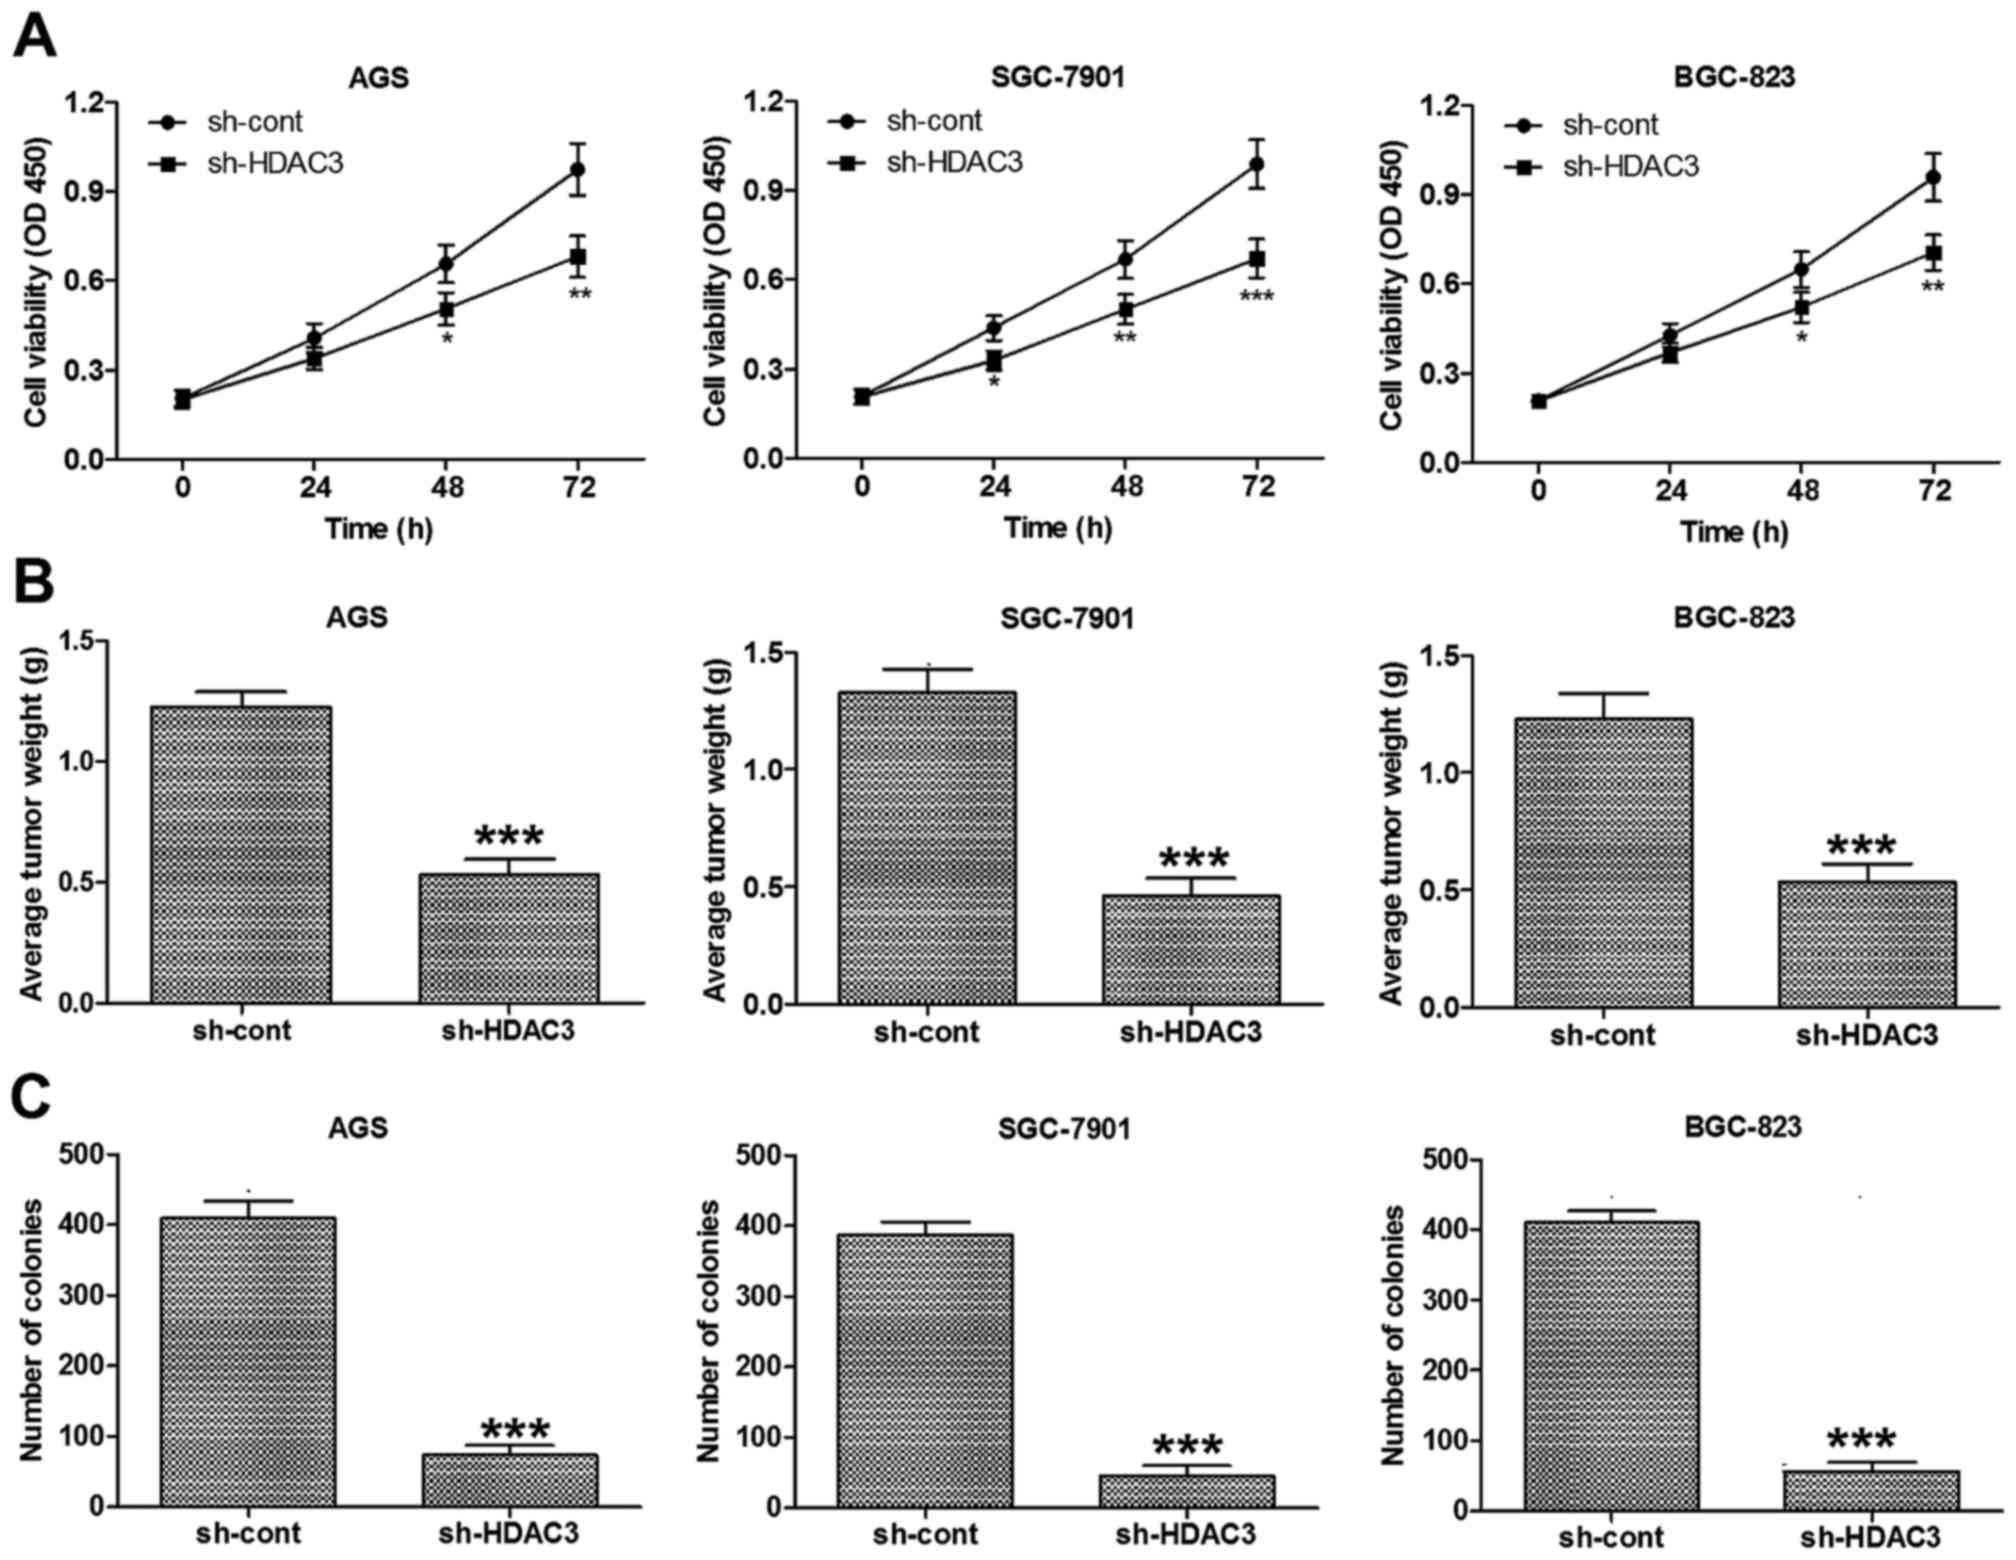
HDAC3 knockdown suppresses the growth of
GC cells
In order to determine whether HDAC3 participates in
the regulation of GC cell growth, HDAC3 was knocked down in the
human GC cell lines, AGS, SGS-7901 and BGC-823. Cell viability
assay revealed that HDAC3 knockdown significantly decreased the
viability of the AGS, SGS-7901 and BGC-823 cells in vitro
(Fig. 2A).
In addition, to examine whether HDAC3 knockdown
affects the growth of GC cells in vivo, we created a GC
tumor xenograft mouse model using GC cells (AGS, SGS-7901 and
BGC-823). The mice were injected with control cells or
with-HDAC3-transfected cells. The results demonstrated that the
mice injected with the cells in which HDAC3 was knocked down had
markedly decreased tumor weights (Fig. 2B).
Colony formation assay was also carried out to
examine the effects of HDAC3 knockdown on GC cells and the results
revealed that HDAC3 knockdown markedly attenuated the colony
formation capacity of the AGS, SGS-7901 and BGC-823 cells (Fig. 2C). Accordingly, these findings
demonstrate that HDAC3 regulates the in vitro and in
vivo growth of GC cells.
HDAC3 overexpression upregulates miR-454
expression
We then used HDAC3 overexpression (by transfection
of cells with HDAC3 overexpression plasmid) to modify miRNA
patterns in SGC-7901 cells in order to identify novel HDAC3
therapeutic targets. Microarray analysis revealed differentially
expressed miRNAs in the cells transfected with HDAC3 overexpression
plasmid. In total, 19 miRNAs were upregulated and 11 miRNAs were
downregulated. We selected to perfrome further experiments on
miR-454, which was the most significantly upregulated miRNA
(Fig. 3A).
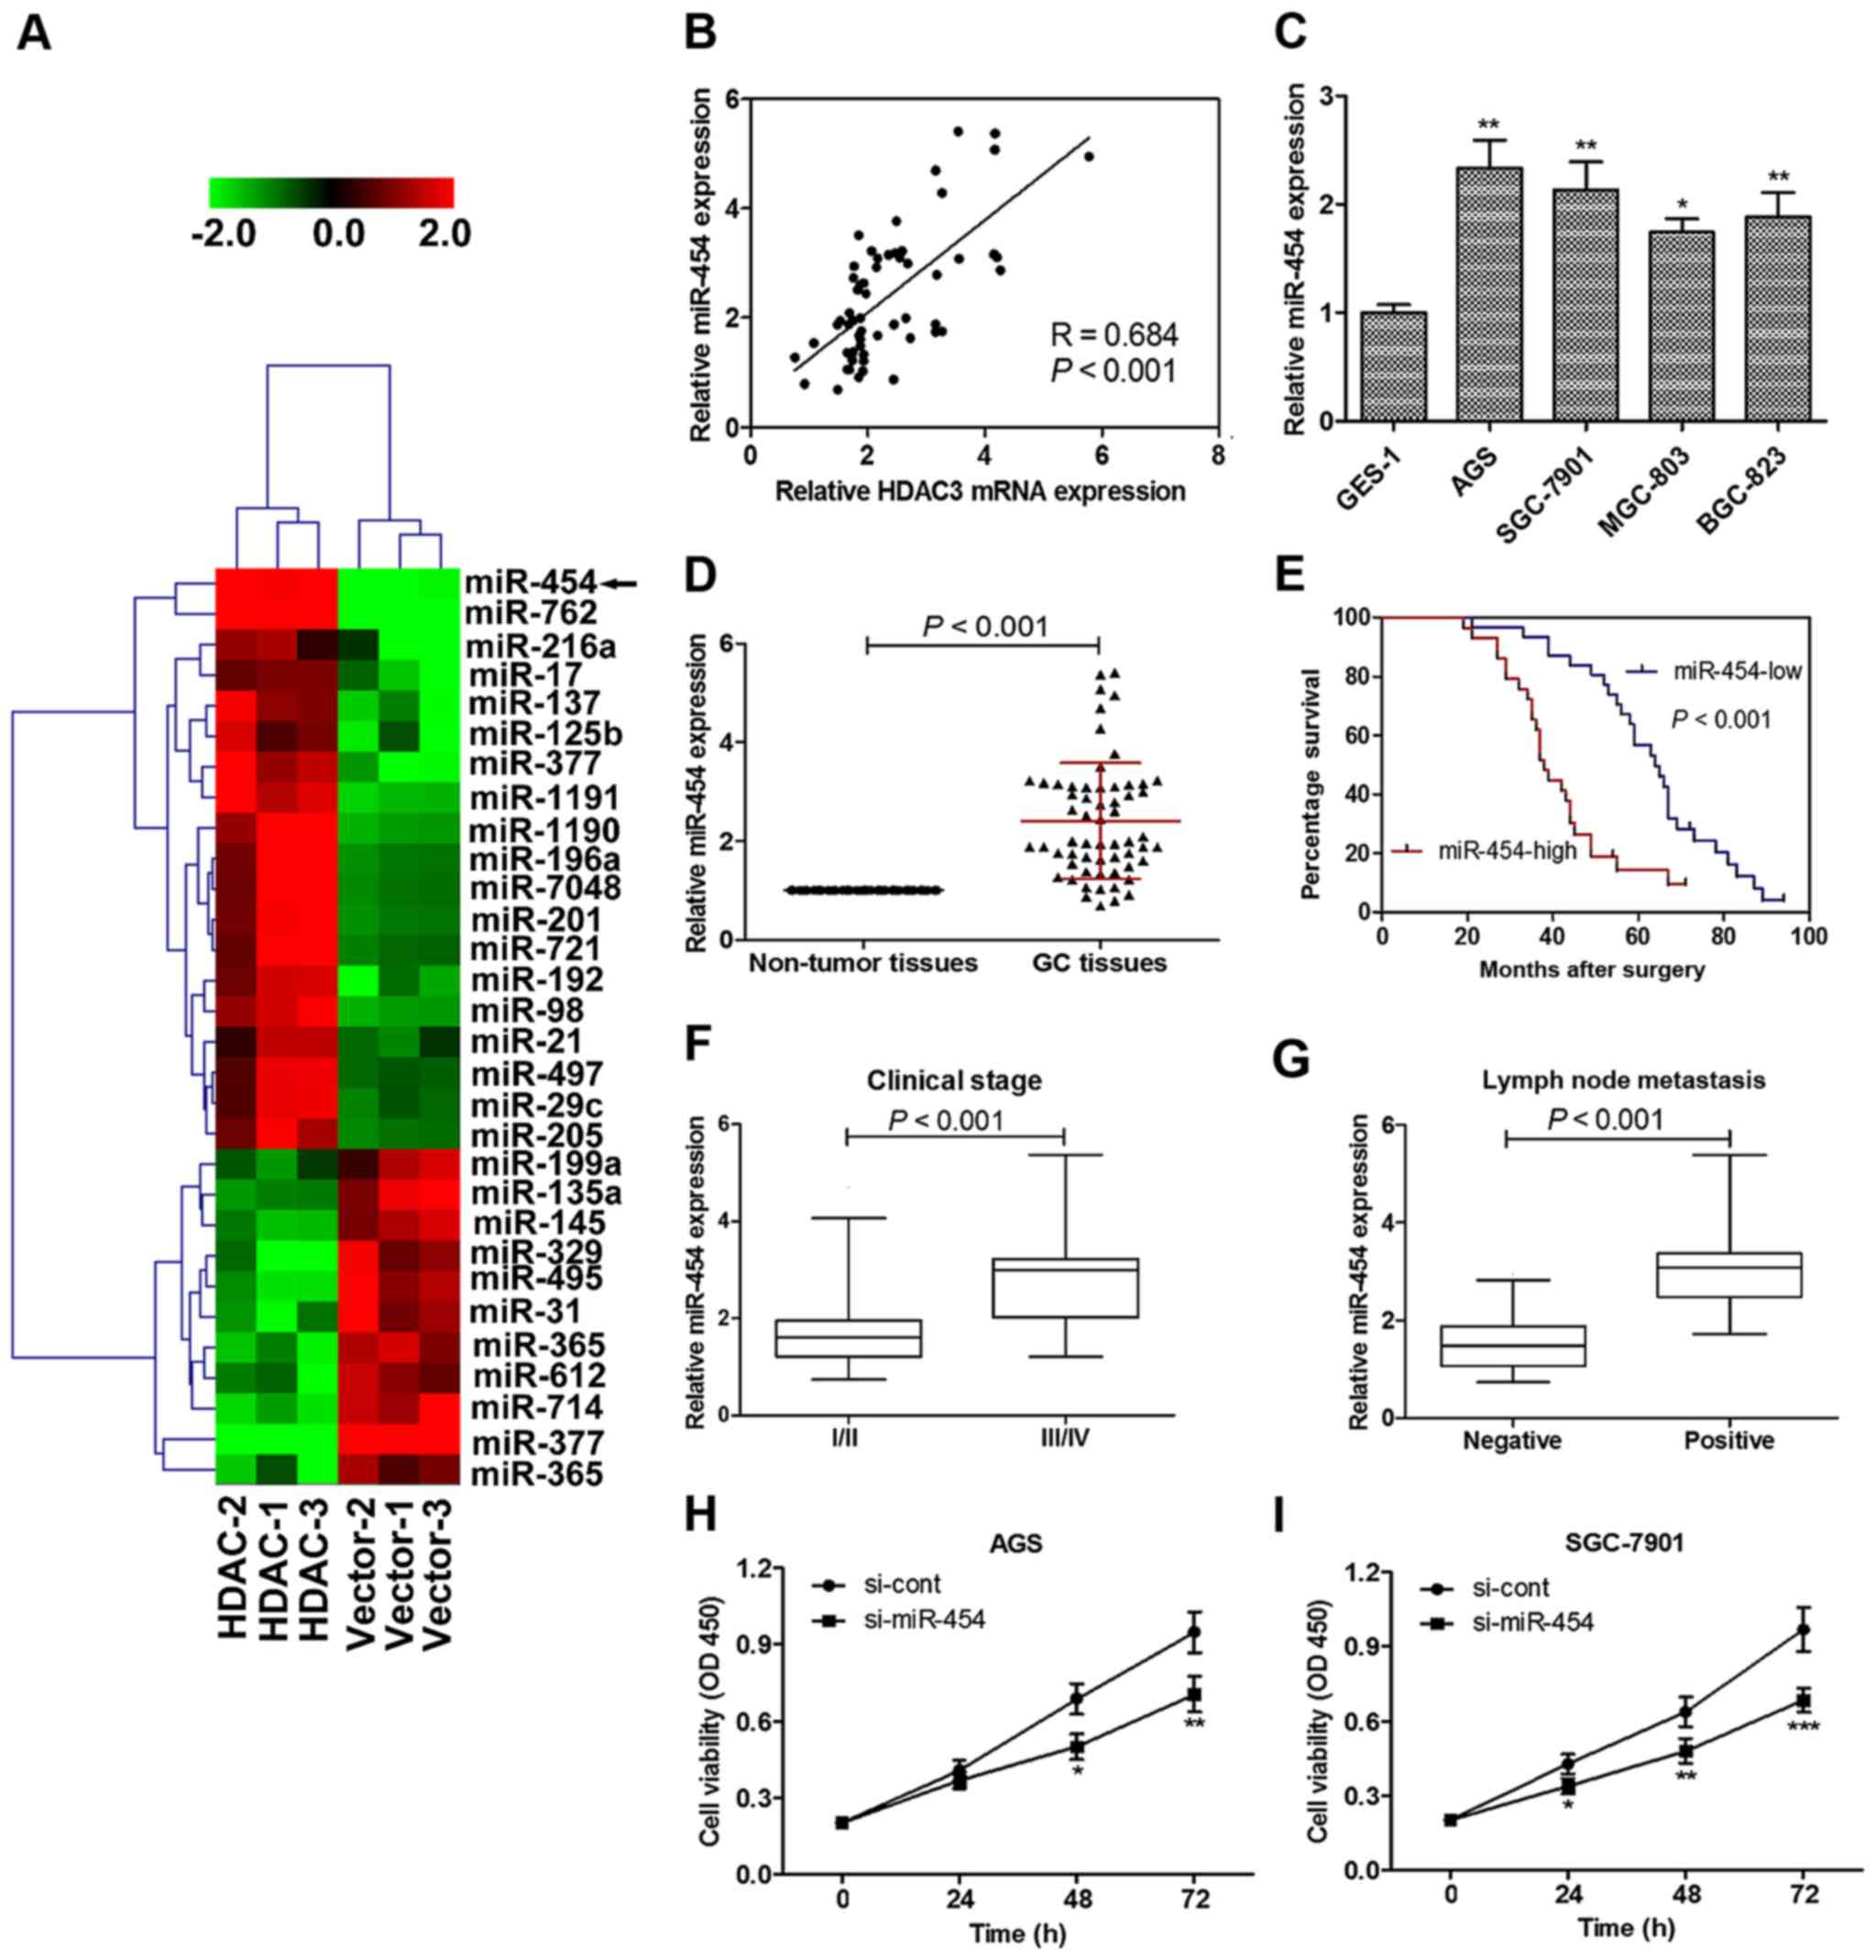 | Figure 3Histone deacetylase 3 (HDAC3)
regulates miR-454 expression and the role of miR-454 in gastric
cancer (GC) tumorgeneisis. (A) HDAC3 overexpression upregulated
miR-454 expression by microarray analysis. HDAC1-1, HDAC1-2 and
HDAC1-3; Vector-1, Vector-2 and Vector-3 refer to the cDNA
microarray results of triplicate experiments. Green and red color
intensity refers to downregulation and upregulation, respectively.
(B) Linear regression analysis revealed that the miR-454 level
significantly and positively correlated with HDAC3 expression.
miR-454 mRNA expression was significantly upregulated (C) in GC
cell lines and (D) tissues compared with normal cell/non-tumor
tissues. (E) Patients with a high expression of miR-454 had a
markedly worse survival percentage compared to those with a low
miR-454 level. (F) In 33 cases presenting advanced disease (stages
of III and IV), 21 (63.64%) of the cases had a high level miR-454
expression in GC tissue; whereas in 27 cases with early stage
disease (stages I and II), only 8 (29.63%) presented high levels of
miR-454 expression. (G) In the 33 cases of GC with lymph node
metastasis, 24 (72.73%) presented a high miR-454 expression, while
only 5 (18.52%) of 27 cases of BC without lymph node metastasis
present high level miR-454 expression. (H) miR-454 knockdown
significantly inhibited the viability of (H) AGS and (I) SGC-7901
cells. Cell viability was detected in GC cell lines following
culture for 0, 24, 48 and 72 h. Optical density was measured at a
wavelength of 450 nm. Data are presented as the means ± SEM.
*p<0.05, **p<0.01 and
***p<0.001 vs. normal cells or si-cont. |
Linear regression analysis was performed in order to
examine the correlation between HDAC3 expression and the miR-454
level. Indeed, our results revealed that the miR-454 level
significantly and positively correlated with the HDAC3 level in GC
tissues (Fig. 3B), indicating
that HDAC3 may regulate miR-454 expression in GC. These findings
indicate a strong association between the HDAC3 level and miR-454
expression in GC.
miR-454 is upregulated in GC tissue and
cell lines, and predicts a poor survival percentage
Consistent with the microarray data, miR-454
expression was significantly upregulated in the GC cell lines
compared with the normal cells (Fig.
3C). Significantly higher levels of miR-454 expression were
also found in the GC tissues compared with the non-tumor tissues
(Fig. 3D).
To explore the association between the miR-454 level
and patient prognosis, according to protein expression, we divided
the patients into the miR-454 low (n=31) and miR-454 high (n=29)
groups. Subsequently, the log-rank test was performed to determine
the correlation between miR-454 expresssion and patient survival
percentage. Patients with a high expression of miR-454 had a
significantly worse survival percentage compared to those with a
low miR-454 level (Fig. 3E;
Table I).
 | Table IUnivariate and multivariate
regression analyses of parameters associated with the prognosis of
patients with GC. |
Table I
Univariate and multivariate
regression analyses of parameters associated with the prognosis of
patients with GC.
|
Characteristics | Subset | Univariate analysis
| Multivariate
analysis
|
|---|
| HR (95% CI) | P-value | HR (95% CI) | P-value |
|---|
| Sex | Male/female | 1.215
(0.762–1.974) | 0.693 | | |
| Age (years) | <60/≥60 | 1.103
(0.828–1.981) | 0.741 | | |
| Tumor size
(cm) | <3/≥3 | 1.425
(0.915–2.183) | 0.516 | | |
| TNM stages | I–II/III–IV | 2.691
(1.592–5.176) | 0.001 | 2.045
(1.127–3.316) | 0.011 |
| Lymph nodes
metastasis | N/P | 3.321
(1.815–5.943) | 0.001 | 2.315
(1.272–4.018) | 0.003 |
| miR-454 | High/low | 2.437
(1.397–4.735) | 0.001 | 1.819
(1.012–3.027) | 0.034 |
Association between miR-454 expression
and clinicopathological characteristics of GC
The association between the miR-454 expression level
and clinicopathologic characteristics of GC was analyzed as shown
in Table II. The miR-454
expression level showed a statistically significant association
with the clinical stage or metastasis of GC. In 33 cases of
advanced disease (stages III and IV), 21 (63.64%) of cases
presented high levels of miR-454 expression, while in 27 cases
presenting early stage disease (stages I and II), only 8 (29.63%)
had high levels of miR-454 expression (Fig. 3F and Table II). In the 33 cases of GC with
lymph node metastasis, 24 (72.73%) presented a high miR-454
expression, while only 5 (18.52%) of the 27 cases of GC without
lymph node metastasis presented a high level miR-454 expression
(Fig. 3G and Table II). No significant association
was observed between the miR-454 level and gender, age or tumor
size. Thus, our data indicate that a high level of miR-454 is
significantly associated with an advanced clinical stage, lymph
node metastases and a poor prognosis of patients with GC.
| Table IIAssociation between
clinicopathological factors and miR-454 expression levels in
patients with GC. |
Table II
Association between
clinicopathological factors and miR-454 expression levels in
patients with GC.
| Variables | No. of
patients | miR-454
| P-value |
|---|
| Low | High |
|---|
| Sex | | | | 0.857 |
| Male | 39 | 19 | 20 | |
| Female | 21 | 12 | 9 | |
| Age (years) | | | | 0.471 |
| <60 | 18 | 7 | 11 | |
| ≥60 | 42 | 24 | 18 | |
| Tumor size
(cm) | | | | 0.114 |
| <3 | 36 | 22 | 14 | |
| ≥3 | 24 | 11 | 13 | |
| TNM stages | | | | 0.012 |
| I-II | 27 | 19 | 8 | |
| III-IV | 33 | 12 | 21 | |
| Lymph nodes
metastasis | | | | 0.001 |
| Negative (N) | 27 | 22 | 5 | |
| Positive (P) | 33 | 9 | 24 | |
Knockdown of miR-454 inhibits GC cell
viability
Furthermore, miR-454 was knocked down in to examine
whether its expression affects GC cell growth. In accordance with
our speculation, miR-454 knockdown significantly inhibited the
viability of AGS and SGC-7901 cells, as compared to the cells that
were transfected with si-cont (Fig.
3H and I). Of note, these results were similar to those
observed with the silencing of HDAC3.
CHD5 is a direct target of miR-454
Since miR-454 has been found to function as an
oncogene by inhibiting CHD5 in hepatocellular carcinoma (36), the correlation between CHD5 and
miR-454 was analyzed in GC cells. Following the suppression of
miR-454, CHD5 expression was significantly increased compared with
the si-cont or cont groups in the AGS and SGC-7901 cells (Fig. 4A). In addition, the expression
level of miR-454 was found to inversely correlate with the
expression of CHD5 in GC (Fig.
4B).
Furthermore, CHD5 was proven to be a putative target
gene of miR-454 using the database TargetScan (Fig. 4C). The direct effect of miR-454 on
the regulation of the CHD5 level was measured by luciferase
reporter assay in SGC-7901 cells (Fig. 4D). Compared to the cells
transfected with the 3′UTR of CHD5 luciferase reporter vector
alone, the fluorescence activity of the cells that were
co-transfected with the miR-454 mimic and the 3′UTR of CHD5 mRNA
luciferase reporter vector decreased by >50%.
CHD5 is downregulated in GC and predicts
a poor survival percentage
CHD5 expression was detected, and the mRNA and
protein expression levels of CHD5 were found to be downregulated in
GC tissues compared with the non-tumor tissues (Fig. 4E and F). We also found that CHD5
mRNA and protein expression levels were also downregulated in GC
cell lines (Fig. 4G and H).
Moreover, patients with a low expression of CHD5 had a markedly
worse survival percentage compared to those with a high CHD5 level
(Fig. 4I).
Discussion
In recent years, through expression profiling of
human tumors with microarray technology, signatures related to
diagnosis, progression, staging, prognosis and response to
treatment have been identified (9,37).
Our study demonstrated that HDAC3 was the most significantly
upregulated gene in GC tissues compared with other cancer-related
genes by microarray. In accordance with this, HDAC3 expression was
upregulated in GC cell lines/tissues compared with normal cell line
and non-tumor tissue. Moreover, the knockdown of HDAC3 inhibited GC
cell viability, downregulated tumor weight and reduced the colony
formation number. To explore the underlying mechanisms, the cells
were transfected with an HDAC3 overexpression vector, followed by
miRNA microarray, and we identified miR-454 as the most markedly
upregulated miRNA. Accordingly, miR-454 expression was upregulated
in GC cell lines/tissues and a high level of miR-454 indicated a
high HDAC3 level in GC tissues and reduced cell viability. In
addition, high levels of miR-454 significantly correlated with an
advanced clinical stage, lymph node metastases and a poor prognosis
of the patients with GC. Moreover, CHD5 was identified as a direct
target of miR-454. CHD5 was downregulated in GC tissues/cell lines
and the expression of CHD5 inversely correlated with the level of
miR-454 in GC tissues. Taken together, those observations indicate
that HDAC3 is associated with GC cell growth via the
miR-454-mediated targeting of CHD5.
HDACs are well known as a major enzyme in the
epigenetic regulation of gene expression through catalyzing the
removal of acetyl groups, modeling the structure of chromatin, as
well as inducing chromatin condensation and transcriptional
repression (38). This family
comprises four classes of proteins consisting of at least 18 HDAC
isoenzymes (39). Among these,
HDAC3 is highly expressed in colorectal carcinoma (40), classical Hodgkin's lymphoma
(41), renal cell cancer
(42), prostate cancer (43) and pancreatic cancer (44), which was also observed in our
study on GC. A previous study pointed out that the knockdown of
HDAC3 expression led to growth inhibition, an increase in apoptosis
and a decrease in the survival of colon cancer cell lines (27). HDAC3 has also been proven to play
important roles in ovarian carcinogenesis as the knockdown of HDAC3
reduces cell migration (45). In
addition, HDAC3 has been reported to be associated with a poor
prognosis in endometrioid subtypes of ovarian and endometrial
carcinomas (46). In our study,
the knockdown of HDAC3 affected GC cell growth by reducing cell
viability, decreasing tumor weight and decreasing the colony
formation number. Since the therapeutic application of HDAC
inhibitors for central nervous system disorders and stroke has been
reported (47,48), the possible therapeutic
application of HDAC for GC warrants further investigation.
The mechanisms underlying the tumor-prompting role
of HDAC3 was investigated in the present study. In this study,
HDAC3 overexpression led to the expression of 19 upregulated miRNAs
and miR-454 was identified as the most significantly upregulated
miRNA. miR-454 was proven to play critical role in GC tumorigenesis
by detecting the miR-454 expression level, evaluating the survival
rate, and analyzing related clinicopathological characteristics in
GC tissues or cell lines, along with the fact that suppression of
miR-454 inhibited the GC cell viability. The tumor-promoting role
of miR-454 has also been reported in colorectal cancer cells since
the overexpression of miR-454 promotes the proliferation and
anchorage-independent growth (49). However, another study reported
that miR-454 expression was suppressed in glioblastoma cancer and
osteosarcoma tissues, acting as a tumor suppressor gene (50,51). Therefore, our results support the
view that miR-454 mainly functions as an oncogenic miRNA in GC.
Since miRNAs usually regulate the expression of
target mRNAs to exert their functions, we further intended to
identify miR-454 target genes in GC. CHD5 was identified as a
critical downstream target using prediction algorithms and
luciferase reporter assays. The ectopic expression of CHD5 has been
reported to suppress cell proliferation, tumorigenicity and colony
formation and to lead to cellular senescence (52). In line with previous studies, we
demonstrated that the expression of CHD5 was downregulated in GC
cell lines and tissues and the expression of CHD5 inversely
correlated with the expression of miR-454 in GC tissues. Moreover,
a low CHD5 expression predicted a poor survival percentage.
The underlying mechanisms of the suppressive effects
of CHD5 on tumors are not yet fully investigated, which is one of
the limitations of this study. One potential mechanism may exist. A
previous study pointed out that CHD5 expression was downregulated
in all GC cell lines and the ectopic expression of CHD5 in GC cells
resulted in significant growth inhibition. CHD5 expression was
significantly restored after pharmacological demethylation.
Methylation of the CHD5 promoter was detected in all GC cell lines
and in the majority of primary gastric carcinoma tissues examined
(14). CHD5 is also frequently
downregulated through promoter hypermethylation in colon (10%),
breast (4.4%), glioma (17%) and ovarian (15%) tumors, suggesting
epigenetic silencing of CHD5 by methylation may contribute to
tumorigenesis in these tissues (53,54). This raises the possibility that
the tumor-suppressive effect of CHD5 on GC is due to the
methylation of its promoter.
In conclusion, the present study demonstrated that
HDAC3 and miR-454 functions as oncogenes and promote tumorigenesis
and the progression of GC. To the best of our knowledge, this study
provides the first evidence of the important role of HDAC3 in GC
and the underlying mechanisms. Our study suggests that HDAC3 may
serve as a valuable prognostic marker for GC patients and has
clinical significance in GC treatment.
References
|
1
|
Parkin DM, Pisani P and Ferlay J:
Estimates of the worldwide incidence of eighteen major cancers in
1985. Int J Cancer. 54:594–606. 1993. View Article : Google Scholar : PubMed/NCBI
|
|
2
|
Li G, Hu Y and Liu H: Current status of
randomized controlled trials for laparoscopic gastric surgery for
gastric cancer in China. Asian J Endosc Surg. 8:263–267. 2015.
View Article : Google Scholar : PubMed/NCBI
|
|
3
|
Kim JM, Sohn HY, Yoon SY, Oh JH, Yang JO,
Kim JH, Song KS, Rho SM, Yoo HS, Kim YS, et al: Identification of
gastric cancer-related genes using a cDNA microarray containing
novel expressed sequence tags expressed in gastric cancer cells.
Clin Cancer Res. 11:473–482. 2005.PubMed/NCBI
|
|
4
|
Cai C, Ashktorab H, Pang X, Zhao Y, Sha W,
Liu Y and Gu X: MicroRNA-211 expression promotes colorectal cancer
cell growth in vitro and in vivo by targeting tumor suppressor
CHD5. PLoS One. 7:e297502012. View Article : Google Scholar : PubMed/NCBI
|
|
5
|
Bartel DP: MicroRNAs: genomics,
biogenesis, mechanism, and function. Cell. 116:281–297. 2004.
View Article : Google Scholar : PubMed/NCBI
|
|
6
|
Di Leva G and Croce CM: Roles of small
RNAs in tumor formation. Trends Mol Med. 16:257–267. 2010.
View Article : Google Scholar : PubMed/NCBI
|
|
7
|
Ueda T, Volinia S, Okumura H, Shimizu M,
Taccioli C, Rossi S, Alder H, Liu CG, Oue N, Yasui W, et al:
Relation between microRNA expression and progression and prognosis
of gastric cancer: a microRNA expression analysis. Lancet Oncol.
11:136–146. 2010. View Article : Google Scholar
|
|
8
|
Ambros V: The functions of animal
microRNAs. Nature. 431:350–355. 2004. View Article : Google Scholar : PubMed/NCBI
|
|
9
|
Yan Z, Xiong Y, Xu W, Li M, Cheng Y, Chen
F, Ding S, Xu H and Zheng G: Identification of recurrence-related
genes by integrating microRNA and gene expression profiling of
gastric cancer. Int J Oncol. 41:2166–2174. 2012. View Article : Google Scholar : PubMed/NCBI
|
|
10
|
Kolla V, Zhuang T, Higashi M, Naraparaju K
and Brodeur GM: Role of CHD5 in human cancers: 10 years later.
Cancer Res. 74:652–658. 2014. View Article : Google Scholar : PubMed/NCBI
|
|
11
|
Li H, Xu W, Huang Y, Huang X, Xu L and Lv
Z: Genistein demethylates the promoter of CHD5 and inhibits
neuroblastoma growt in vivo. Int J Mol Med. 30:1081–1086. 2012.
View Article : Google Scholar : PubMed/NCBI
|
|
12
|
Zhao R, Yan Q, Lv J, Huang H, Zheng W,
Zhang B and Ma W: CHD5, a tumor suppressor that is epigenetically
silenced in lung cancer. Lung Cancer. 76:324–331. 2012. View Article : Google Scholar
|
|
13
|
Fatemi M, Paul TA, Brodeur GM, Shokrani B,
Brim H and Ashktorab H: Epigenetic silencing of CHD5, a novel
tumor-suppressor gene, occurs in early colorectal cancer stages.
Cancer. 120:172–180. 2014. View Article : Google Scholar
|
|
14
|
Wang X, Lau KK, So LK and Lam YW: CHD5 is
down-regulated through promoter hypermethylation in gastric cancer.
J Biomed Sci. 16:952009. View Article : Google Scholar : PubMed/NCBI
|
|
15
|
Wang J, Chen H, Fu S, Xu ZM, Sun KL and Fu
WN: The involvement of CHD5 hypermethylation in laryngeal squamous
cell carcinoma. Oral Oncol. 47:601–608. 2011. View Article : Google Scholar : PubMed/NCBI
|
|
16
|
de Longueville F, Atienzar FA, Marcq L,
Dufrane S, Evrard S, Wouters L, Leroux F, Bertholet V, Gerin B,
Whomsley R, et al: Use of a low-density microarray for studying
gene expression patterns induced by hepatotoxicants on primary
cultures of rat hepatocytes. Toxicol Sci. 75:378–392. 2003.
View Article : Google Scholar : PubMed/NCBI
|
|
17
|
Zampetaki A, Zeng L, Margariti A, Xiao Q,
Li H, Zhang Z, Pepe AE, Wang G, Habi O, deFalco E, et al: Histone
deacetylase 3 is critical in endothelial survival and
atherosclerosis development in response to disturbed flow.
Circulation. 121:132–142. 2010. View Article : Google Scholar
|
|
18
|
Mestdagh P, Feys T, Bernard N, Guenther S,
Chen C, Speleman F and Vandesompele J: High-throughput stem-loop
RT-qPCR miRNA expression profiling using minute amounts of input
RNA. Nucleic Acids Res. 36:e1432008. View Article : Google Scholar : PubMed/NCBI
|
|
19
|
Jiang L, Wu J, Chen Q, Hu X, Li W and Hu
G: Notch1 expression is upregulated in glioma and is associated
with tumor progression. J Clin Neurosci. 18:387–390. 2011.
View Article : Google Scholar : PubMed/NCBI
|
|
20
|
Yeh CR, Hsu I, Song W, Chang H, Miyamoto
H, Xiao GQ, Li L and Yeh S: Fibroblast ERα promotes bladder cancer
invasion via increasing the CCL1 and IL-6 signals in the tumor
microenvironment. Am J Cancer Res. 5:1146–1157. 2015.
|
|
21
|
Brosnan JA, Morgan R, White CM, Hong SM,
Yachida S, Goggins M, Edil B and Iacobuzio-Donahue CA: Smad6
upregulation provides an alternative mechanism for BMP inactivation
in SMAD4 wild type pancreatic cancers. Cancer Res. 73(Suppl 8):
40062013. View Article : Google Scholar
|
|
22
|
Janknecht R: Multi-talented DEAD-box
proteins and potential tumor promoters: p68 RNA helicase (DDX5) and
its paralog, p72 RNA helicase (DDX17). Am J Transl Res. 2:223–234.
2010.PubMed/NCBI
|
|
23
|
Ju X, Katiyar S, Wang C, Liu M, Jiao X, Li
S, Zhou J, Turner J, Lisanti MP, Russell RG, et al: Akt1 governs
breast cancer progression in vivo. Proc Natl Acad Sci USA.
104:7438–7443. 2007. View Article : Google Scholar : PubMed/NCBI
|
|
24
|
Dang TP, Gazdar AF, Virmani AK, Sepetavec
T, Hande KR, Minna JD, Roberts JR and Carbone DP: Chromosome 19
translocation, overexpression of Notch3, and human lung cancer. J
Natl Cancer Inst. 92:1355–1357. 2000. View Article : Google Scholar : PubMed/NCBI
|
|
25
|
Kim YJ, Yoon HY, Kim JS, Kang HW, Min BD,
Kim SK, Ha YS, Kim IY, Ryu KH, Lee SC, et al: HOXA9, ISL1 and
ALDH1A3 methylation patterns as prognostic markers for nonmuscle
invasive bladder cancer: array-based DNA methylation and expression
profiling. Int J Cancer. 133:1135–1142. 2013. View Article : Google Scholar : PubMed/NCBI
|
|
26
|
Saha D, Datta PK and Beauchamp RD:
Oncogenic ras represses transforming growth factor-β/Smad signaling
by degrading tumor suppressor Smad4. J Biol Chem. 276:29531–29537.
2001. View Article : Google Scholar : PubMed/NCBI
|
|
27
|
Wilson AJ, Byun DS, Popova N, Murray LB,
L'Italien K, Sowa Y, Arango D, Velcich A, Augenlicht LH and
Mariadason JM: Histone deacetylase 3 (HDAC3) and other class I
HDACs regulate colon cell maturation and p21 expression and are
deregulated in human colon cancer. J Biol Chem. 281:13548–13558.
2006. View Article : Google Scholar : PubMed/NCBI
|
|
28
|
Misawa K, Kanazawa T, Misawa Y, Uehara T,
Imai A, Takahashi G, Takebayashi S, Cole A, Carey TE and Mineta H:
Galanin has tumor suppressor activity and is frequently inactivated
by aberrant promoter methylation in head and neck cancer. Transl
Oncol. 6:338–346. 2013. View Article : Google Scholar : PubMed/NCBI
|
|
29
|
Ranahan WP, Han Z, Smith-Kinnaman W,
Nabinger SC, Heller B, Herbert BS, Chan R and Wells CD: The adaptor
protein AMOT promotes the proliferation of mammary epithelial cells
via the prolonged activation of the extracellular signal-regulated
kinases. Cancer Res. 71:2203–2211. 2011. View Article : Google Scholar : PubMed/NCBI
|
|
30
|
van Rhijn BW, Lurkin I, Radvanyi F,
Kirkels WJ, van der Kwast TH and Zwarthoff EC: The fibroblast
growth factor receptor 3 (FGFR3) mutation is a strong indicator of
superficial bladder cancer with low recurrence rate. Cancer Res.
61:1265–1268. 2001.PubMed/NCBI
|
|
31
|
Nahas GR, Murthy RG, Greco SJ and
Rameshwar P: The RNA-binding protein Musashi-1 stabilizes TAC1 mRNA
in breast cancer cells. Cancer Res. 73(Suppl 8): 31982013.
View Article : Google Scholar
|
|
32
|
Shih MC, Chen JY, Wu YC, Jan YH, Yang BM,
Lu PJ, Cheng HC, Huang MS, Yang CJ, Hsiao M, et al: TOPK/PBK
promotes cell migration via modulation of the I3K/PTEN/AKT pathway
and is associated with poor prognosis in lung cancer. Oncogene.
31:2389–2400. 2012. View Article : Google Scholar
|
|
33
|
Foulkes WD, Flanders TY, Pollock PM and
Hayward NK: The CDKN2A (16) gene and human cancer. Mol Med. 3:5–20.
1997.PubMed/NCBI
|
|
34
|
Iau PTC, Marafie M, Ali A, Sng JH,
Macmillan RD, Pinder S, Denley HE, Ellis IO, Wenzyck P, Scott N, et
al: Are medullary breast cancers an indication for BRCA1 mutation
screening? A mutation analysis of 42 cases of medullary breast
cancer. Breast Cancer Res Treat. 85:81–88. 2004. View Article : Google Scholar : PubMed/NCBI
|
|
35
|
Fritsche M, Haessler C and Brandner G:
Induction of nuclear accumulation of the tumor-suppressor protein
p53 by DNA-damaging agents. Oncogene. 8:307–318. 1993.PubMed/NCBI
|
|
36
|
Yu L, Gong X, Sun L, Yao H, Lu B and Zhu
L: miR-454 functions as an oncogene by inhibiting CHD5 in
hepatocellular carcinoma. Oncotarget. 6:39225–39234. 2015.
View Article : Google Scholar : PubMed/NCBI
|
|
37
|
Ralfkiaer U, Hagedorn PH, Bangsgaard N,
Løvendorf MB, Ahler CB, Svensson L, Kopp KL, Vennegaard MT,
Lauenborg B, Zibert JR, et al: Diagnostic microRNA profiling in
cutaneous T-cell lymphoma (CTCL). Blood. 118:5891–5900. 2011.
View Article : Google Scholar : PubMed/NCBI
|
|
38
|
Marks P, Rifkind RA, Richon VM, Breslow R,
Miller T and Kelly WK: Histone deacetylases and cancer: causes and
therapies. Nat Rev Cancer. 1:194–202. 2001. View Article : Google Scholar
|
|
39
|
Glozak MA and Seto E: Histone deacetylases
and cancer. Oncogene. 26:5420–5432. 2007. View Article : Google Scholar : PubMed/NCBI
|
|
40
|
Weichert W, Röske A, Niesporek S, Noske A,
Buckendahl AC, Dietel M, Gekeler V, Boehm M, Beckers T and Denkert
C: Class I histone deacetylase expression has independent
prognostic impact in human colorectal cancer: specific role of
class I histone deacet-ylases in vitro and in vivo. Clin Cancer
Res. 14:1669–1677. 2008. View Article : Google Scholar : PubMed/NCBI
|
|
41
|
Adams H, Fritzsche FR, Dirnhofer S,
Kristiansen G and Tzankov A: Class I histone deacetylases 12 and 3
are highly expressed in classical Hodgkin's lymphoma. Expert Opin
Ther Targets. 14:577–584. 2010. View Article : Google Scholar : PubMed/NCBI
|
|
42
|
Fritzsche FR, Weichert W, Röske A, Gekeler
V, Beckers T, Stephan C, Jung K, Scholman K, Denkert C, Dietel M,
et al: Class I histone deacetylases 1, 2 and 3 are highly expressed
in renal cell cancer. BMC Cancer. 8:3812008. View Article : Google Scholar : PubMed/NCBI
|
|
43
|
Weichert W, Röske A, Gekeler V, Beckers T,
Stephan C, Jung K, Fritzsche FR, Niesporek S, Denkert C, Dietel M,
et al: Histone deacetylases 1, 2 and 3 are highly expressed in
prostate cancer and HDAC2 expression is associated with shorter PSA
relapse time after radical prostatectomy. Br J Cancer. 98:604–610.
2008. View Article : Google Scholar : PubMed/NCBI
|
|
44
|
Lehmann A, Denkert C, Budczies J,
Buckendahl AC, Darb-Esfahani S, Noske A, Müller BM, Bahra M,
Neuhaus P, Dietel M, et al: High class I HDAC activity and
expression are associated with RelA/65 activation in pancreatic
cancer in vitro and in vivo. BMC Cancer. 9:3952009. View Article : Google Scholar
|
|
45
|
Hayashi A, Horiuchi A, Kikuchi N, Hayashi
T, Fuseya C, Suzuki A, Konishi I and Shiozawa T: Type-specific
roles of histone deacetylase (HDAC) overexpression in ovarian
carcinoma: HDAC1 enhances cell proliferation and HDAC3 stimulates
cell migration with downregulation of E-cadherin. Int J Cancer.
127:1332–1346. 2010. View Article : Google Scholar : PubMed/NCBI
|
|
46
|
Weichert W, Denkert C, Noske A,
Darb-Esfahani S, Dietel M, Kalloger SE, Huntsman DG and Köbel M:
Expression of class I histone deacetylases indicates poor prognosis
in endometrioid subtypes of ovarian and endometrial carcinomas.
Neoplasia. 10:1021–1027. 2008. View Article : Google Scholar : PubMed/NCBI
|
|
47
|
Kazantsev AG and Thompson LM: Therapeutic
application of histone deacetylase inhibitors for central nervous
system disorders. Nat Rev Drug Discov. 7:854–868. 2008. View Article : Google Scholar : PubMed/NCBI
|
|
48
|
Lv L, Tang YP, Han X, Wang X and Dong Q:
Therapeutic application of histone deacetylase inhibitors for
stroke. Cent Nerv Syst Agents Med Chem. 11:138–149. 2011.
View Article : Google Scholar : PubMed/NCBI
|
|
49
|
Liang HL, Hu AP, Li SL, Xie JP, Ma QZ and
Liu JY: miR-454 prompts cell proliferation of human colorectal
cancer cells by repressing CYLD expression. Asian Pac J Cancer
Prev. 16:2397–2402. 2015. View Article : Google Scholar : PubMed/NCBI
|
|
50
|
Niu G, Li B, Sun J and Sun L: miR-454 is
down-regulated in osteosarcomas and suppresses cell proliferation
and invasion by directly targeting c-Met. Cell Prolif. 48:348–355.
2015. View Article : Google Scholar : PubMed/NCBI
|
|
51
|
Fang B, Zhu J, Wang Y, Geng F and Li G:
miR-454 inhibited cell proliferation of human glioblastoma cells by
suppressing DK1 expression. Biomed Pharmacother. 75:148–152. 2015.
View Article : Google Scholar : PubMed/NCBI
|
|
52
|
Zhao R, Wang N, Huang H, Ma W and Yan Q:
CHD5 a tumour suppressor is epigenetically silenced in
hepatocellular carcinoma. Liver Int. 34:e151–e160. 2014. View Article : Google Scholar : PubMed/NCBI
|
|
53
|
Gorringe KL, Choong DY, Williams LH,
Ramakrishna M, Sridhar A, Qiu W, Bearfoot JL and Campbell IG:
Mutation and methylation analysis of the chromodomain-helicase-DNA
binding 5 gene in ovarian cancer. Neoplasia. 10:1253–1258. 2008.
View Article : Google Scholar : PubMed/NCBI
|
|
54
|
Mulero-Navarro S and Esteller M: Chromatin
remodeling factor CHD5 is silenced by promoter CpG island
hypermethylation in human cancer. Epigenetics. 3:210–215. 2008.
View Article : Google Scholar : PubMed/NCBI
|