Introduction
The incidence of malignant melanoma is increasing
rapidly worldwide (1). Despite
notable progress in melanoma research, treatment options for
advanced stages of the disease remain limited and the mortality
rate in advanced melanoma is significantly higher than in other
skin tumors (1).
The tumor stroma represents an important component
in the structure of malignant tumors. This microenvironment may
significantly influence their biological properties, including
metastatic potential (2). The
powerful effect of this microenvironment has also been observed in
malignant melanoma via convincing models, where melanoma cells
acquired properties of melanocyte precursors (neural crest cells)
following grafting to vertebrate embryos (3). The embryonic microenvironment here
eliminates their ability to form tumors (3). Intercellular crosstalk between
different cell types occurring in melanoma (4,5)
may be relevant for tumor biology in general.
As fibroblasts represent a fundamental component of
various tissues, they also have an indispensable role in cancer
(2). The broad biological
activity of melanoma-associated fibroblasts (MAFs) has been
described and notably, they are also able to stimulate other cancer
types than melanoma in vitro (4,6-9).
MAFs, as well as other cancer-associated fibroblasts, express
smooth muscle actin (SMA) (10,11) in the majority of tumor types
(2). The transition of
fibroblasts to SMA-expressing myofibroblasts is primarily
stimulated by transforming growth factor-β1 (TGF-β1), which is
frequently elevated in sera of melanoma patients. An additive
effect of endogenous lectin, galectin-1, has also been reported in
this context (10-12).
The present report details the comparison of MAFs
prepared from a cutaneous melanoma metastasis and autolo-gous
control fibroblasts (ACF) from non-cancerous skin of the same
patient. The former was isolated prior to therapy initiation, and
the latter was isolated during B-Raf inhibitor therapy, yet before
the onset of computed tomography (CT)-documented disease
progression. Such a matched pair of stromal fibroblasts of human
origin is notably rare for analysis. The data obtained from cell
cultures are compared with immunohistochemical analysis of sections
from the melanoma metastasis including the expression of TGF-β1.
The effect of this cytokine on normal dermal fibroblasts prepared
from the skin of healthy donors was also examined.
Material and methods
Case report, tissue collection and
processing
The patient, a 76 year-old Caucasian female who was
diagnosed with acrolentiginous melanoma of the left sole (Breslow,
4.0 mm; Clark, IV) (13) in 2004,
was recruited in January 2011 at the Department of Dermatology and
Venereology, First Faculty of Medicine, Charles University (Prague,
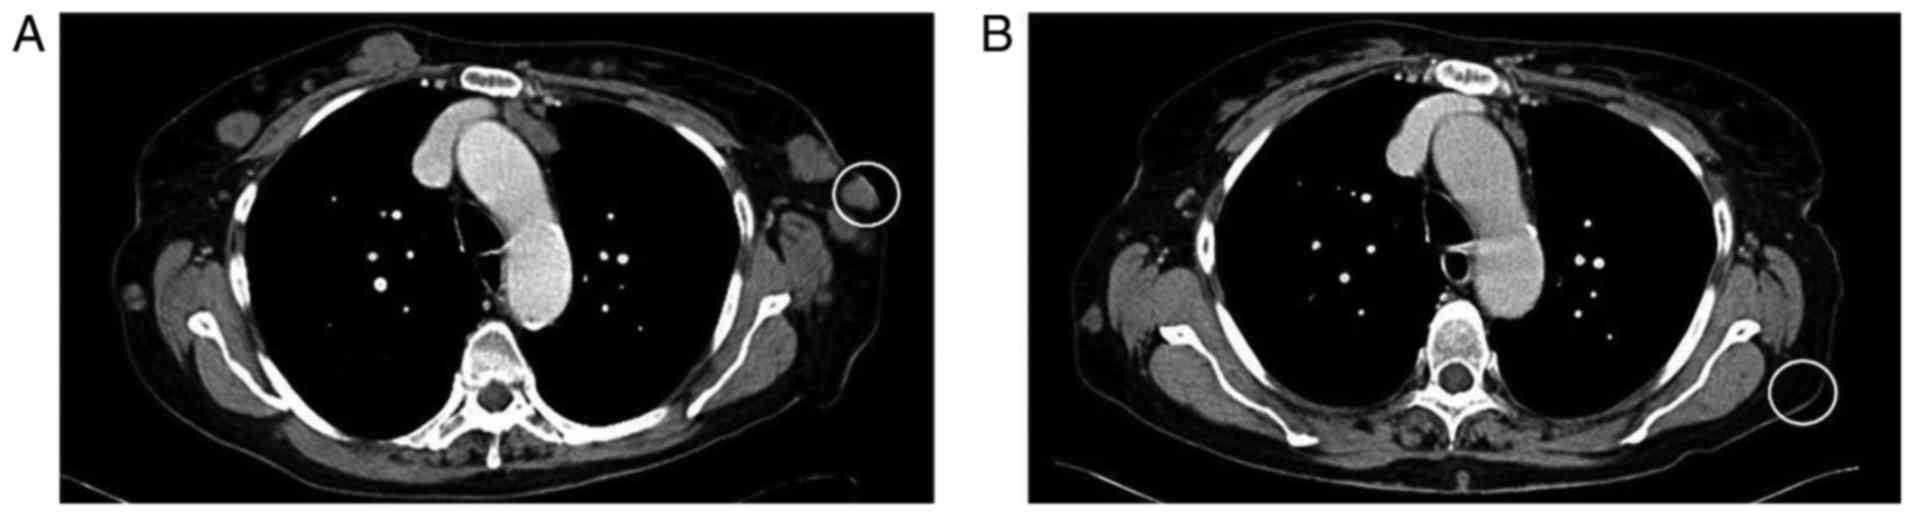
Czech Republic). CT scanning was used throughout observation of the
patient (Fig. 1), and 7 years
following wide surgical excision, multiple metastases were detected
on the lateral parts of the chest and in axillary lymph nodes
(Fig. 1A). One cutaneous
metastasis on the chest was surgically removed for histologic
confirmation (Figs. 1A and
2) of the disease relapse and
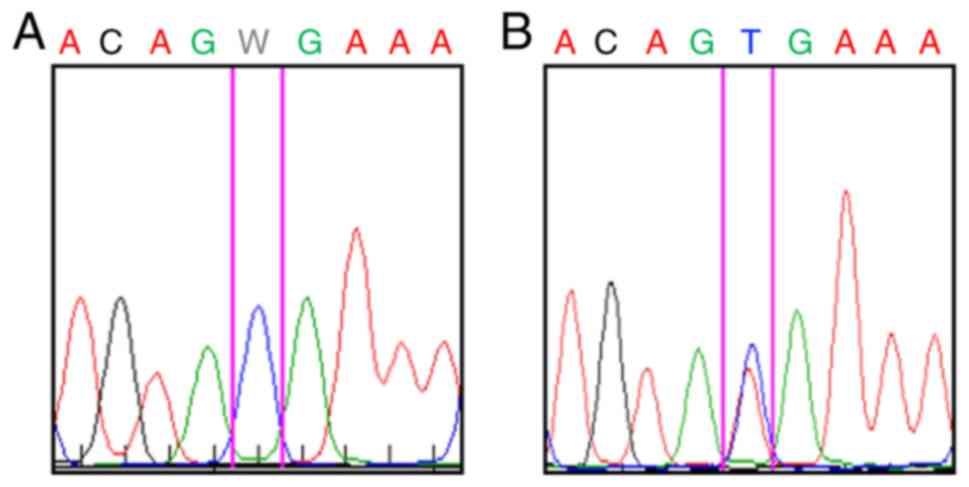
also for B-Raf V600E mutation screening. MAFs were isolated from
the same tumor mass using a previously described method (14,15). B-Raf V600E mutation was confirmed
(Fig. 3) and treatment with the
B-Raf inhibitor vemurafenib was initiated. Following 3 months of
vemurafenib therapy, unaffected skin from the anatomically
comparable site (Fig. 1B) was
harvested via punch biopsy to isolate ACFs. At this stage, partial
response was achieved using RECIST criteria (16). Following further 6 months, CT
documented rapid disease progression and the patient succumbed to
mortality 5 months later.
Control dermal fibroblasts (CDF) were prepared from
anatomically comparable chest skin of three healthy Caucasian women
donors (aged 35-42 years), undergoing aesthetic surgery (recruited
at the same department between March 2011 and September 2013). All
tissue samples used in the present study were obtained following
the provision of explicit written informed consent, with a protocol
reviewed by a local ethics committee (FWA 00003027; General
University Hospital, Prague, Czech Republic) with full respect to
the Declaration of Helsinki. Institutional consent for publication
and data maintenance was also issued.
Cell culture
MAFs, ACFs and CDFs were isolated from tissue
samples as described previously (14,15). Passage 3 or 4 cells were used in
the present study for analysis. For immunocytochemistry, RNA and
DNA studies, fibroblasts were cultured for 5 days before they
reached subconfluent monolayers in Dulbecco's modified Eagle's
medium containing 10% fetal bovine serum and antibiotics
(penicillin/streptomycin; 10.0 U/ml and 10.0 μg/ml,
respectively; all, Biochrom, Ltd., Cambridge, UK) at 37°C and 5%
CO2. To evaluate the induction of SMA in CDF, TGF-β1
(R&D Systems, Inc., Minneapolis, MN, USA) was supplemented to
the culture medium at 10 ng/ml (11).
B-Raf sequencing
For DNA extraction, paraffin-embedded formalin-fixed
(4% formaldehyde in PBS for 24-48 h at room temperature) tissue
sections (thickness, 5 μm) were deparaffinized using
sequential washes with xylene and absolute ethanol. Sections were
digested using proteinase K and DNA was extracted using NucleoSpin
FFPE DNA (both, Machery-Nagel GmbH, Düren, Germany), according to
the manufacturer's protocol. DNA extraction from fibroblasts was
performed using TRIzol reagent (Invitrogen; Thermo Fisher
Scientific, Inc., Waltham, MA, USA) according to the manufacturer's
protocol. The concentration of DNA was measured using a fluorometer
Qubit 2.0 (Invitrogen; Thermo Fisher Scientific, Inc.).
DNA extracted from MAFs was selectively amplified to
generate a 224-bp sequence of BRAF exon 15 using polymerase
chain reaction (PCR) with the following primers: Forward,
5′-TCATAATGCTTGCTCTGATAGGA-3′ and reverse,
5′-GGCCAAAAATTTAATCAGTGGA-3′ (15). A total of 30 ng DNA was amplified
with 0.1 μM each primer, 160 μM deoxynucleotide
triphosphates, 2 mM MgCl2, 0.3 U Gold AmpliTaq Perkin
Polymerase, and 1X PCR Buffer II (10 mM Tris-HCl pH 8.3, 50 mM KCl)
in a final volume of 15 μl (both from Thermo Fisher
Scientific, Inc). Cycling conditions were as follows: Denaturation
step at 94°C for 2 min and at 95°C for 20 sec followed by 5 cycles
of denaturation at 95°C for 20 sec, annealing at 62.5°C for 30 sec
and primer extension at 72°C for 1 min; 35 cycles of denaturation
at 95°C for 20 sec, annealing at 57.5°C for 30 sec and primer
extension at 72°C for 1 min; and one final run-off extension at
72°C for 10 min (16). PCR was
performed in a TGradient 96 thermocycler (Biometra GmbH, Göttingen,
Germany). PCR products were visualized via 1.5% agarose gel
electrophoresis in 0.5X Tris-borate-EDTA buffer (Thermo Fisher
Scientific, Inc). Subsequently, the PCR products were purified
using an Agencourt AMpure XP (Beckman Coulter, Inc., Brea, CA, USA)
and sequenced using forward primers of the PCR amplification and a
DTCS Quick Start kit according to the manufacturer's protocol
(Beckman Coulter, Inc). The cycle sequencing conditions consisted
of 30 cycles of 96°C for 20 sec, 50°C for 20 sec, and 60°C for 4
min. The PCR products were re-purified using an Agencourt CleanSEQ
kit (Beckman Coulter, Inc.) according to the manufacturer's
protocols, sequenced on a CEQ 8000 sequencing machine (Beckman
Coulter, Inc.), and analysed using CEQ 8000 sequencing software.
Sequence traces were compared with BRAF reference sequence
(NM_004333.4; https://www.ncbi.nlm.nih.gov/nuccore/NM_004333).
Immunohistochemistry and
immunocytochemistry
Immunohistochemistry was routinely performed using
the avidin-biotin complex method. Briefly, tissue was fixed for
24-48 h in 4% formaldehyde (in PBS) at room temperature and
embedded in paraffin. Tissue sections (5-um tick; rehydrated
through xylene and ethanol) were washed with PBS with 0.2%
Tween-20, and heat-induced epitope retrieval was performed in
citrate buffer (pH 6.0, in autoclave at 120°C for 3 min with slow
gradual cooling for 60 min. All chemicals for immunohistochemistry
were supplied by Sigma-Aldrich (Merck KGaA, Darmstadt, Germany).
Tissue sections were blocked using Protein Block system (Dako;
Agilent Technologies, Inc., Santa Clara, CA, USA; cat. no. X0909)
at room temperature for 10 min according to the manufacturer's
protocol, followed by 3% hydrogen peroxide (in PBS) treatment for
20 min (all from Sigma-Aldrich; Merck KGaA). Consequently sections
were incubated overnight at 4°C with biotinylated antibodies
directed against SMA (1:100; Dako; Agilent Technologies, Inc.; cat.
no. M0851; clone 1A4), and TGF-β1 (1:100, Bioss Antibodies, Inc.,
Woburn, MA, USA; cat. no. bs-0086). A Dako Streptavidin Peroxidase
kit (including 50X 3,3′-diaminobenzidine- horseradish peroxidase
substrate buffer) was used for visualization of immunohistochemical
reaction according to the manufacturer's protocol (Dako; Agilent
Technologies, Inc.; cat. no. K5001). Nuclei were counterstained
with hematoxylin and mounted in permanent mountant.
The cultured cells on coverslips were briefly fixed
in 2% paraformaldehyde in PBS for 5 min at room temperature and
permeabilized with Triton X-100 (Sigma-Aldrich; Merck KGaA).
Antibodies against SMA (1:100; mouse monoclonal; Dako; Agilent
Technologies, Inc., cat.no. M0851; clone 1A4) and fibronectin
(1:1,000; rabbit polyclonal; Dako; Agilent Technologies, Inc.; cat.
no. A0245) were used to detect protein levels, via incubations for
2 h at room temperature. Blocking was performed in 10% goat serum
for 30 min at room temperature. Results of immunocytochemical
reaction were visualized using tetramethylrhodamine-conjugated goat
anti-rabbit (cat. no. T5393; 1:250) and fluorescein
isothiocyanate-conjugated goat anti-mouse antibody (cat. no.
AP307F; 1:250; both, Sigma-Aldrich; Merck KGaA) for 60 min at room
temperature). Nuclei were counterstained with DAPI for 1 min at
room temperature (Sigma-Aldrich; Merck KGaA).
The negative control of all staining procedures was
performed by replacement of primary antibody with appropriate
isotype control (Universal Negative Control; mouse cat. no. N1698;
rabbit cat. no. N1699; Dako; Agilent Technologies, Inc.). Following
mounting in Vectashield (Vector Laboratories, Inc., Burlingame, CA,
USA) samples were analyzed at ×200 magnification using an
ECLIPSE-90i fluorescence microscope (Nikon Corp., Tokyo, Japan)
equipped with suitable filter blocks, a charge-couple device camera
(Vosskühler, Osnabrück, Germany) and a system for computer-assisted
image analysis (LUCIA 5.1, Laboratory Imaging s.r.o., Prague, Czech
Republic).
Transcriptome analysis
Total RNA was isolated from MAFs, ACFs and CDFs
using an RNeasy Micro kit (Qiagen Sciences, Inc., Gaithersburg, MD,
USA) according to the manufacturer's protocol. Quality and
concentration of RNA were measured with a NanoDrop 2000
spectrophotometer (Thermo Fisher Scientific, Inc.). RNA integrity
was analysed using an Agilent Bioanalyzer 2100 (Agilent
Technologies, Inc.). Only samples with an intact RNA profile were
used for expression profiling analyses (RNA Integrity Number
>9).
Illumina HumanHT-12 v4 Expression BeadChips
(Illumina, Inc., San Diego, CA, USA) were used for the microarray
analysis following the standard protocol. Briefly, 200 ng RNA was
amplified with the Illumina TotalPrep RNA Amplification kit
(Ambion; Thermo Fisher Scientific, Inc.) and 750 ng labelled RNA
was hybridized on the chip according to the manufacturer's
protocol. Analysis was performed in four (CDF, 2 donors) and two
(MAF and ACF) replicates per group. The raw data were preprocessed
using GenomeStudio software (version 1.9.0.24624; Illumina, Inc.)
and the limma package (19) of
Bioconductor (20), as described
previously (21). The
transcription profiles were background corrected using a
normal-exponential model, quantile normalized and variance
stabilized using base 2 logarithmic transformation. Moderated
t-test was used to detect differentially expressed transcripts
within limma (19). False
discovery rates (FDR) were used to select significantly
differentially transcribed genes (FDR <0.05), as presented in
Table I. Principal components
analysis (PCA) was performed using the made4 (22) package of the Bioconductor on
expression data of the genes that were found differentially
expressed in at least one of the comparisons.
 | Table ISignificantly deregulated genes that
are differentially expressed in comparisons of MAFs, ACFs and
CDFs. |
Table I
Significantly deregulated genes that
are differentially expressed in comparisons of MAFs, ACFs and
CDFs.
A, Upregulated
genes, MAF vs. CDF
|
|---|
| Entrez gene ID | EnsEMBL gene
ID | Symbol | Definition | Descriptive GO BP
term | FDR | CDF
log2-intensity | MAF
log2-intensity | ACF
log2-intensity |
|---|
| 3036 |
ENSG00000105509 | HAS1 | Hyaluronan synthase
1 | GO:0085029 | 8E-23 | 4.50 | 7.62 | 4.50 |
| 221303 |
ENSG00000183807 | FAM162B | Family with
sequence similarity 162, member B | – | 3E-22 | 4.48 | 7.85 | 5.10 |
| 3875 |
ENSG00000111057 | KRT18 | Keratin 18 | GO:0009653 | 2E-20 | 5.45 | 9.76 | 8.93 | |
| 894 | ENSG00000118971
CC | ND2 | Cyclin D2 | GO:0008284 | 2E-20 | 5.00 | 9.10 | 6.85 | |
| 8076 |
ENSG00000197614 | MFAP5 | Microfibrillar
associated protein 5 | GO:0030198a | 2E-19 | 7.73 | 12.06 | 12.24 |
| 11341 |
ENSG00000164106 | SCRG1 | Stimulator of
chondrogenesis 1 | GO:0007399 | 2E-19 | 4.55 | 8.26 | 7.07 |
| 5909 |
ENSG00000076864 | RAP1GAP | RAP1 GTPase
activating protein | GO:0043087 | 2E-19 | 4.50 | 7.59 | 5.10 |
| 353139 |
ENSG00000187173 | LCE2A | Late cornified
envelope 2A | GO:0030216 | 3E-19 | 4.96 | 7.77 | 5.34 |
| 1776 | ENSG00000163687
D | NASE1L3 | Deoxyribonuclease
I-like 3 | GO:0006309 | 7E-18 | 4.56 | 7.51 | 5.79 |
| 284085 |
ENSG00000265480 | KRT18P55 | Keratin 18
pseudogene 55 | – | 1E-17 | 4.68 | 8.37 | 7.04 |
| 3202 |
ENSG00000106004 | HOXA5 | Homeobox A5 | GO:0048704a | 2E-17 | 7.30 | 10.72 | 7.39 | |
| 1829 | ENSG00000046604
D | SG2 | Desmoglein 2 | GO:0007155 | 6E-17 | 4.65 | 7.78 | 4.92 | |
| 3887 |
ENSG00000205426 | KRT81 | keratin 81 | GO:0005198 | 7E-17 | 5.67 | 8.93 | 6.94 | |
B, Downregulated
genes, MAF vs. CDF
|
|---|
| Entrez gene ID | EnsEMBL gene
ID | Symbol | Definition | Descriptive GO BP
term | FDR | CDF
log2-intensity | MAF
log2-intensity | ACF
log2-intensity |
|---|
| 404266 |
ENSG00000233101 | HOXB-AS3 | HOXB cluster
antisense RNA 3 (non- protein coding) | – | 2E-21 | 9.54 | 5.92 | 9.78 |
| 8988 |
ENSG00000169271 | HSPB3 | Heat shock 27 kDa
protein 3 | GO:0006986 | 6E-18 | 10.12 | 5.73 | 9.35 |
| 6387 | ENSG00000107562
C | XCL12 | Chemokine (C-X-C
motif) ligand 12 | GO:0001666a | 9E-18 | 10.36 | 4.97 | 10.19 |
| 1396 | ENSG00000213145
C | RIP1 | Cysteine-rich
protein 1 (intestinal) | GO:0008283 | 1E-17 | 11.03 | 7.10 | 8.73 |
| 160364 |
ENSG00000172322 | CLEC12A | C-type lectin
domain family 12, member A | – | 2E-17 | 5.99 | 4.53 | 4.48 |
| 4147 |
ENSG00000132561 | MATN2 | Matrilin 2 | GO:0008347a | 5E-17 | 10.57 | 6.86 | 9.11 |
| 160364 |
ENSG00000172322 | CLEC12A | C-type lectin
domain family 12, member A, transcript variant 2 | – | 8E-17 | 6.64 | 4.51 | 4.55 |
C, Upregulated
genes, MAF vs. ACF
|
|---|
| Entrez gene ID | EnsEMBL gene
ID | Symbol | Definition | Descriptive GO BP
term | FDR | CDF
log2-intensity | MAF
log2-intensity | ACF
log2-intensity |
|---|
| 3036 |
ENSG00000105509 | HAS1 | Hyaluronan synthase
1 | GO:0085029 | 1E-22 | 4.50 | 7.62 | 4.50 |
| 221303 |
ENSG00000183807 | FAM162B | Family with
sequence similarity 162, member B | – | 3E-19 | 4.48 | 7.85 | 5.10 |
| 3202 |
ENSG00000106004 | HOXA5 | Homeobox A5 | GO:0048704a | 7E-17 | 7.30 | 10.72 | 7.39 |
| 353139 |
ENSG00000187173 | LCE2A | Late cornified
envelope 2A | GO:0030216 | 1E-16 | 4.96 | 7.77 | 5.34 |
| 5909 |
ENSG00000076864 | RAP1GAP | RAP1 GTPase
activating protein | GO:0043087 | 5E-16 | 4.50 | 7.59 | 5.15 |
| 1829 | ENSG00000046604
D | SG2 | Desmoglein 2 | GO:0007155 | 5E-15 | 4.65 | 7.78 | 4.92 |
| 55966 |
ENSG00000196581 | AJAP1 | Adherens junctions
associated protein 1 | GO:0007155 | 1E-13 | 4.60 | 6.16 | 4.37 |
| 1300 | ENSG00000123500
C | OL10A1 | Collagen, type X,
α1 | GO:0030198a | 2E-14 | 5.11 | 7.78 | 4.93 |
| 3778 |
ENSG00000156113 | KCNMA1 | Potassium large
conductance calcium- activated channel, subfamily M, α member
1 | GO:0001666a | 2E-14 | 9.64 | 9.46 | 6.95 |
| 794 | ENSG00000172137
C | ALB2 | Calbindin 2 | GO:0005509 | 8E-14 | 6.78 | 8.33 | 4.98 |
D, Downregulated
genes, MAF vs. ACF
|
|---|
| Entrez gene ID | EnsEMBL gene
ID | Symbol | Definition | Descriptive GO BP
term | FDR | CDF
log2-intensity | MAF
log2-intensity | ACF
log2-intensity |
|---|
| 404266 |
ENSG00000233101 | HOXB-AS3 | HOXB cluster
antisense RNA 3 (non-protein coding) | – | 3E-21 | 9.54 | 5.92 | 9.78 |
| 116154 |
ENSG00000087495 | PHACTR3 | Phosphatase and
actin regulator 3 | GO:0043086 | 2E-19 | 7.40 | 5.32 | 10.49 |
| 72 |
ENSG00000163017 | ACTG2 | Actin, γ2, smooth
muscle, enteric | GO:0090131 | 2E-18 | 4.84 | 4.58 | 12.18 |
| 70 |
ENSG00000159251 | ACTC1 | Actin, α, cardiac
muscle 1 | GO:0090131 | 7E-17 | 9.89 | 7.27 | 12.76 |
| 6387 | ENSG00000107562
C | XCL12 | Chemokine (C-X-C
motif) ligand 12 | GO:0001666a | 7E-17 | 10.36 | 4.97 | 10.19 |
| 154197 |
ENSG00000146453 | PNLDC1 | Poly(A)-specific
ribonuclease (PARN)-like domain containing 1 | – | 3E-16 | 4.49 | 4.45 | 5.51 |
| 8988 |
ENSG00000169271 | HSPB3 | Heat shock 27 kDa
protein 3 | GO:0006986 | 8E-15 | 10.12 | 5.73 | 9.35 |
| 90139 |
ENSG00000157570 | TSPAN18 | Tetraspanin 18 | GO:0030198 | 8E-15 | 5.69 | 4.90 | 8.26 |
| 668 |
ENSG00000183770 | FOXL2 | Forkhead box
L2 | GO:0030154 | 3E-14 | 7.66 | 4.79 | 8.16 |
| 5121 |
ENSG00000183036 | PCP4 | Purkinje cell
protein 4 | GO:0007417 | 1E-13 | 4.53 | 4.44 | 7.16 |
E, Upregulated
genes, ACF vs. CDF
|
|---|
| Entrez gene ID | EnsEMBL gene
ID | Symbol | Definition | Descriptive GO BP
term | FDR | CDF
log2-intensity | MAF
log2-intensity | ACF
log2-intensity |
|---|
| 8076 |
ENSG00000197614 | MFAP5 | Microfibrillar
associated protein 5 | GO:0030198a | 2E-18 | 7.73 | 12.06 | 12.24 |
| 72 |
ENSG00000163017 | ACTG2 | Actin, γ2, smooth
muscle, enteric | GO:0090131 | 4E-17 | 4.84 | 4.58 | 12.18 |
| 3875 |
ENSG00000111057 | KRT18 | Keratin 18 | GO:0009653 | 4E-16 | 5.45 | 9.76 | 8.93 |
| 85409 |
ENSG00000145506 | NKD2 | Naked cuticle
homolog 2 (Drosophila) | GO:0030178 | 7E-16 | 4.45 | 7.27 | 7.70 |
| 154197 |
ENSG00000146453 | PNLDC1 | Poly(A)-specific
ribonuclease (PARN)-like domain containing 1 | – | 2E-15 | 4.49 | 4.45 | 5.51 |
| 8322 |
ENSG00000174804 | FZD4 | Frizzled family
receptor 4 | GO:0060070 | 3E-15 | 6.85 | 8.31 | 9.66 |
| 64798 |
ENSG00000155792 | DEPTOR | DEP domain
containing MTOR-interacting protein | GO:0035556 | 1E-13 | 4.79 | 6.71 | 8.64 |
| 11341 |
ENSG00000164106 | SCRG1 | Stimulator of
chondrogenesis 1 | GO:0007399 | 2E-13 | 4.55 | 8.26 | 7.07 |
| 54518 |
ENSG00000077420 | APBB1IP | Amyloid beta (A4)
precursor protein-binding. family B, member 1 interacting
protein | GO:0045785a | 2E-13 | 7.60 | 9.39 | 9.57 |
| 157506 |
ENSG00000121039 | RDH10 | Retinol
dehydrogenase 10 (all-trans) | GO:0014032 | 3E-13 | 7.38 | 9.37 | 10.58 |
| 5121 |
ENSG00000183036 | PCP4 | Purkinje cell
protein 4 | GO:0007417 | 3E-13 | 4.53 | 4.44 | 7.16 |
| 3751 |
ENSG00000184408 | KCND2 | Potassium
voltage-gated channel. Shal-related subfamily, member 2 | GO:0071456 | 3E-13 | 4.42 | 6.28 | 6.14 |
F, Downregulated
genes, ACF vs. CDF
|
|---|
| Entrez gene ID | EnsEMBL gene
ID | Symbol | Definition | Descriptive GO BP
term | FDR | CDF
log2-intensity | MAF
log2-intensity | ACF
log2-intensity |
|---|
| 4885 |
ENSG00000106236 | NPTX2 | Neuronal pentraxin
II | – | 4E-17 | 9.10 | 6.41 | 5.30 |
| 100133941 |
ENSG00000272398 | CD24 | CD24 molecule | GO:0002237a | 3E-16 | 10.02 | 7.09 | 6.68 |
| 160364 |
ENSG00000172322 | CLEC12A | C-type lectin
domain family 12. member A | – | 4E-16 | 5.99 | 4.53 | 4.48 |
| 160364 |
ENSG00000172322 | CLEC12A | C-type lectin
domain family 12. member A. transcript variant 2 | – | 1E-15 | 6.64 | 4.51 | 4.55 |
| 3778 |
ENSG00000156113 | KCNMA1 | Potassium large
conductance calcium-activated channel. Subfamily M. α member 1 | GO:0001666a | 9E-15 | 9.64 | 9.46 | 6.95 |
| 84675 |
ENSG00000147573 | TRIM55 | Tripartite motif
containing 55 | GO:0007165 | 3E-13 | 6.31 | 4.70 | 4.47 |
| 6228 |
ENSG00000186468 | RPS23 | Ribosomal protein
S23 | GO:0005840 | 6E-13 | 11.47 | 8.85 | 8.83 |
| 85352 |
ENSG00000138944 | KIAA1644 | KIAA1644 | – | 7E-13 | 9.68 | 6.61 | 7.14 |
Genome methylation analysis
Genomic DNA was isolated using the aforementioned
standard techniques and purified using a Qiagen DNeasy kit (Qiagen
Sciences, Inc.) according to the manufacturer's protocol. Quality
and concentration of DNA were measured with a NanoDrop 1000
spectrophotometer (Thermo Fisher Scientific, Inc.). Bisulfite
conversion was performed using an EZ DNA Methylation kit (Zymo
Research Corp., Irvine, CA, USA).
Illumina Infinium HumanMethylation27 BeadChips
(Illumina, Inc.) were used for microarray analysis following the
manufacturer's protocol. In brief, 400 ng bisulphite-converted DNA
was amplified using an Infinium Methylation Assay kit (Illumina,
Inc.) and 750 ng of labelled DNA was hybridized on the chip
according to the manufacturer's procedure. The analysis was
performed in two replicates per group (MAF, ACF and CDF). The raw
data were preprocessed using GenomeStudio software to obtain
methylated and unmethylated probe intensities, and the Bioconductor
(20) package methylumi to
background correct and normalize the data, and to calculate
M-values according to the following formula:
M=log2((methylated_probe_intensity + 100)/(unmethylated_
probe_intensity + 100)). The positions of CpG islands were
previously retrieved in human genomic DNA by Wu et al
(23). CpG shores (and shelves)
were defined as 2-kbp regions that flanked CpG islands (or shores,
respectively).
Moderated t-test implemented in the limma package
(19) was used to detect
differentially methylated genomic regions (DMR) based on change in
M-value and false discovery rate (FDR<0.1, δM>1). PCA of the
methylation data was performed using the made4 package on M-values
of regions that were considered DMR in at least one comparison.
The MIAME compliant expression and methylation data
were subsequently deposited to the ArrayExpress database
(accessions E-MTAB-4964 and E-MTAB-4965; https://www.ebi.ac.uk/arrayexpress/browse.html).
Gene set enrichment analysis (GSEA)
GSEA was performed using Enrichr (24). Briefly, differentially expressed
genes and differentially methylated genomic regions, respectively,
that were specific for MAF or CDF were uploaded to the Enrichr web
interface (http://amp.pharm.mssm.edu/Enrichr/). The analysis was
performed with default parameters and with equal weight on each
gene (or genomic region, in cases of methylation). Analysis of
various gene set collections was performed, including the gene
ontology (GO) terms and KEGG pathways, only the analysis of the GO
terms, and in particular the biological process ontology, are
reported. Other analyses resulted in the identification of similar
gene sets. For expression data, the 20 best terms (i.e. those with
the greatest significance) for each comparison are reported in
Table II. The selection roughly
corresponds to the terms with an adjusted P-value of the enrichment
test of P<0.03. The analysis of DMRs did not result in any
significantly enriched GO terms.
| Table IIResults of gene set enrichment
analysis performed on differentially expressed genes and GO BP
terms. |
Table II
Results of gene set enrichment
analysis performed on differentially expressed genes and GO BP
terms.
A, (MAF and ACF)
vs. CDF
|
|---|
| GO BP ID | Term | Overlap | Adjusted
P-value |
|---|
| GO:0030198 | Extracellular
matrix organization | 35/359 | 0.00091 |
| GO:0043062 | Extracellular
structure organization | 35/360 | 0.00091 |
| GO:0001936 | Regulation of
endothelial cell proliferation | 15/88 | 0.00335 |
| GO:0010574 | Regulation of
vascular endothelial growth factor production | 8/27 | 0.01791 |
| GO:0002237 | Response to
molecule of bacterial origin | 24/243 | 0.01791 |
| GO:0009611 | Response to
wounding | 19/167 | 0.01791 |
| GO:0051272 | Positive regulation
of cellular component movement | 27/296 | 0.01791 |
| GO:0040017 | Positive regulation
of locomotion | 27/304 | 0.02116 |
| GO:2000147 | Positive regulation
of cell motility | 26/287 | 0.02116 |
| GO:0001503 | Ossification | 15/116 | 0.02116 |
| GO:0008347 | Glial cell
migration | 6/15 | 0.02116 |
| GO:0045765 | Regulation of
angiogenesis | 19/179 | 0.02490 |
| GO:0032496 | Response to
lipopolysaccharide | 22/228 | 0.02490 |
| GO:0030335 | Positive regulation
of cell migration | 25/280 | 0.02511 |
| GO:0030111 | Regulation of Wnt
signaling pathway | 21/214 | 0.02515 |
| GO:0060828 | Regulation of
canonical Wnt signaling pathway | 17/152 | 0.02544 |
| GO:0051894 | Positive regulation
of focal adhesion assembly | 6/18 | 0.02978 |
| GO:1901890 | Positive regulation
of cell junction assembly | 6/18 | 0.02978 |
| GO:0001937 | Negative regulation
of endothelial cell proliferation | 7/27 | 0.02978 |
B, (CDF and ACF)
vs. MAF
|
|---|
| GO BP ID | Term | Overlap | Adjusted
P-value |
|---|
| GO:0048729 | Tissue
morphogenesis | 44/358 | 0.00023 |
| GO:0051272 | Positive regulation
of cellular component movement | 39/296 | 0.00023 |
| GO:0030198 | Extracellular
matrix organization | 44/359 | 0.00023 |
| GO:0043062 | Extracellular
structure organization | 44/360 | 0.00023 |
| GO:2000147 | Positive regulation
of cell motility | 37/287 | 0.00055 |
| GO:0030335 | Positive regulation
of cell migration | 36/280 | 0.00068 |
| GO:0048598 | Embryonic
morphogenesis | 45/403 | 0.00094 |
| GO:0040017 | Positive regulation
of locomotion | 37/304 | 0.00118 |
| GO:0030155 | Regulation of cell
adhesion | 39/336 | 0.00158 |
| GO:0002009 | Morphogenesis of an
epithelium | 35/296 | 0.00312 |
| GO:0048562 | Embryonic organ
morphogenesis | 20/121 | 0.00400 |
| GO:0048704 | Embryonic skeletal
system morphogenesis | 16/81 | 0.00403 |
| GO:0045785 | Positive regulation
of cell adhesion | 24/171 | 0.00507 |
| GO:0036293 | Response to
decreased oxygen levels | 30/245 | 0.00507 |
| GO:0009887 | Organ
morphogenesis | 42/405 | 0.00507 |
| GO:0070482 | Response to oxygen
levels | 31/259 | 0.00516 |
| GO:0071294 | Cellular response
to zinc ion | 7/14 | 0.00770 |
| GO:0001666 | Response to
hypoxia | 29/241 | 0.00770 |
| GO:0022617 | Extracellular
matrix disassembly | 18/116 | 0.01315 |
| GO:0048705 | Skeletal system
morphogenesis | 17/106 | 0.01380 |
Results
Properties of fibroblasts isolated from
the patients
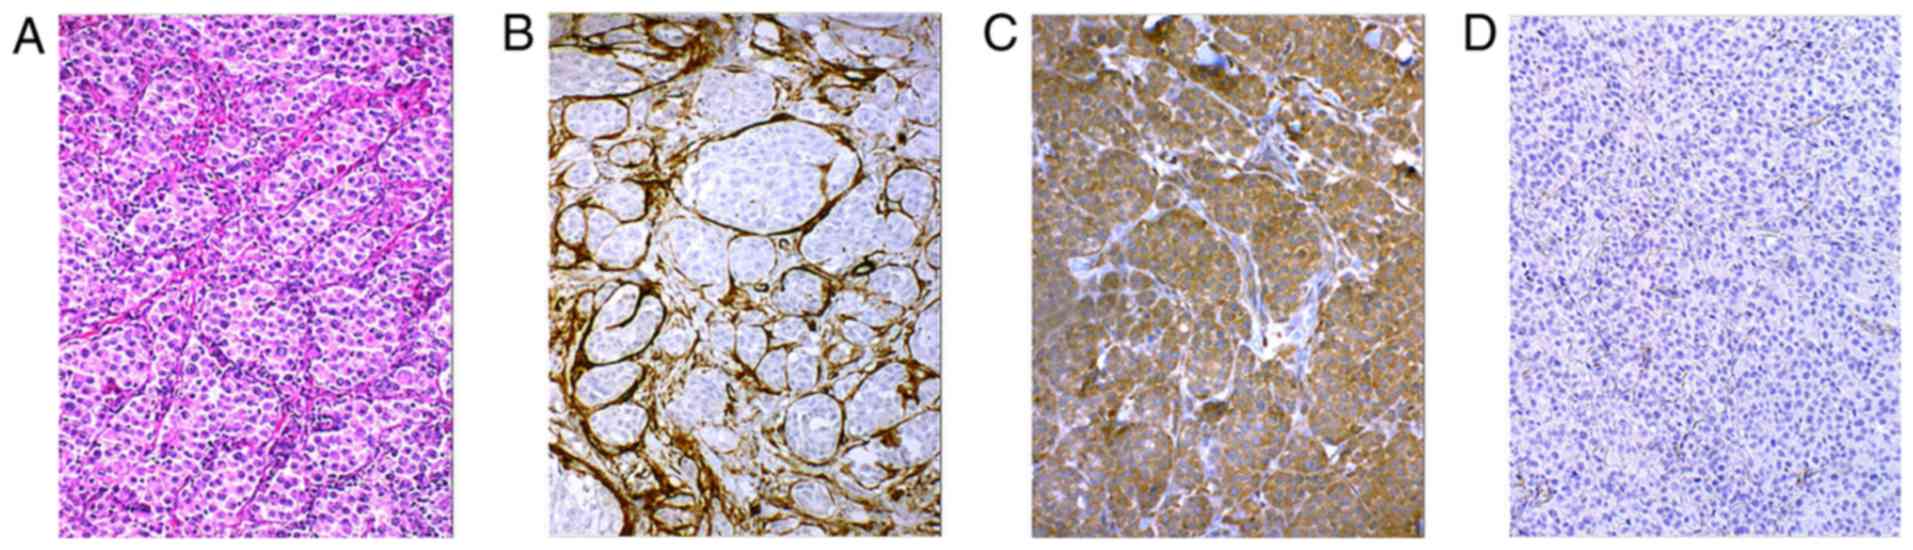
Fibroblasts in cutaneous metastasis (Fig. 2A) exhibited SMA (Fig. 2B) and immunohistochemistry also
revealed that melanoma cells in this metastasis were rich in TGF-β1
(Fig. 2C). MAFs isolated from
this metastasis were not harbouring the B-Raf V600E mutation
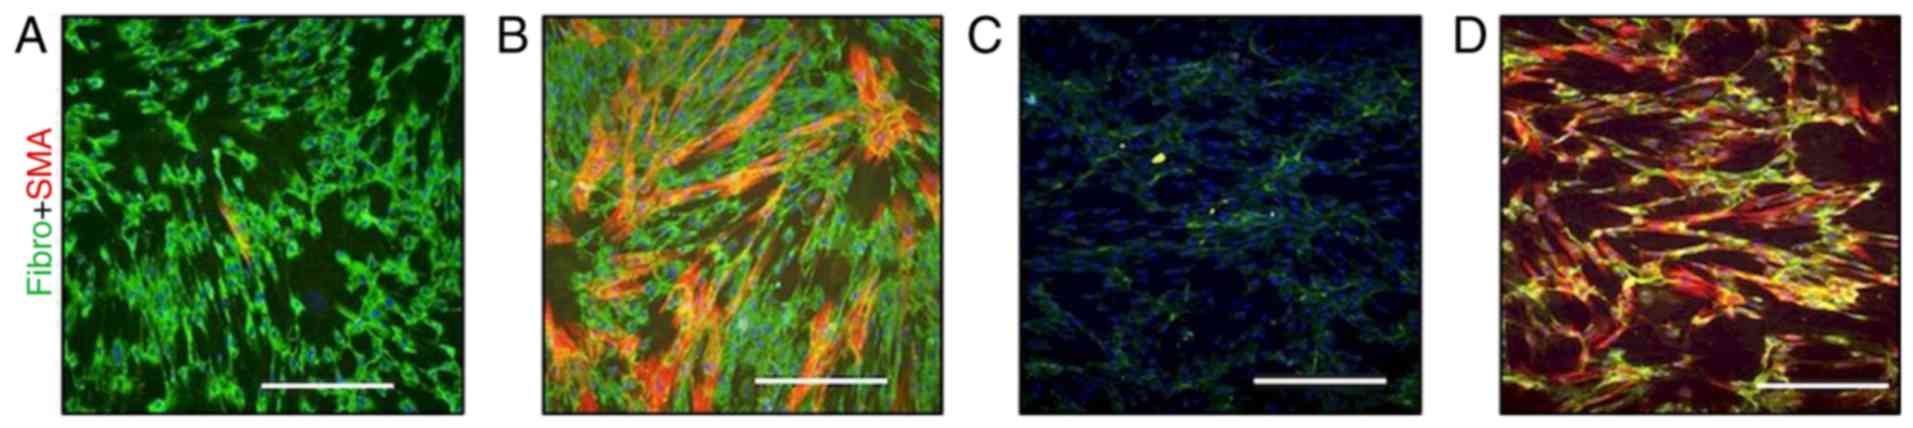
(Fig. 3A). The isolated MAFs in
culture exhibited a high cytoplasmic signal of fibronectin and were
also sporadically positive for SMA (Fig. 4A).
This observation was in contrast with ACFs isolated
from the normal skin of the same patient following 3 months on
vemurafenib, where numerous clusters of SMA-positive myofibroblasts
were present in vitro (Fig.
4B). The expression of fibronectin was similar in MAFs
(Fig. 4A) and ACFs (Fig. 4B).
In the control experiment performed with CDFs,
sparse extracellular fibres of fibronectin were observed, but no
myofibroblasts were detected (Fig.
4C). As TGF-β1 was detected in the melanoma metastasis and
because the elevation of TGF-β1 in sera of melanoma patients was
documented previously (10), the
effect of TGF-β1 on CDFs was assessed. TGF-β1 was able to markedly
stimulate the transition of fibroblasts to myofibro-blasts and also
increase fibronectin production (Fig.
4D).
Comparison of expression profiles of
MAFs, ACFs, and CDFs
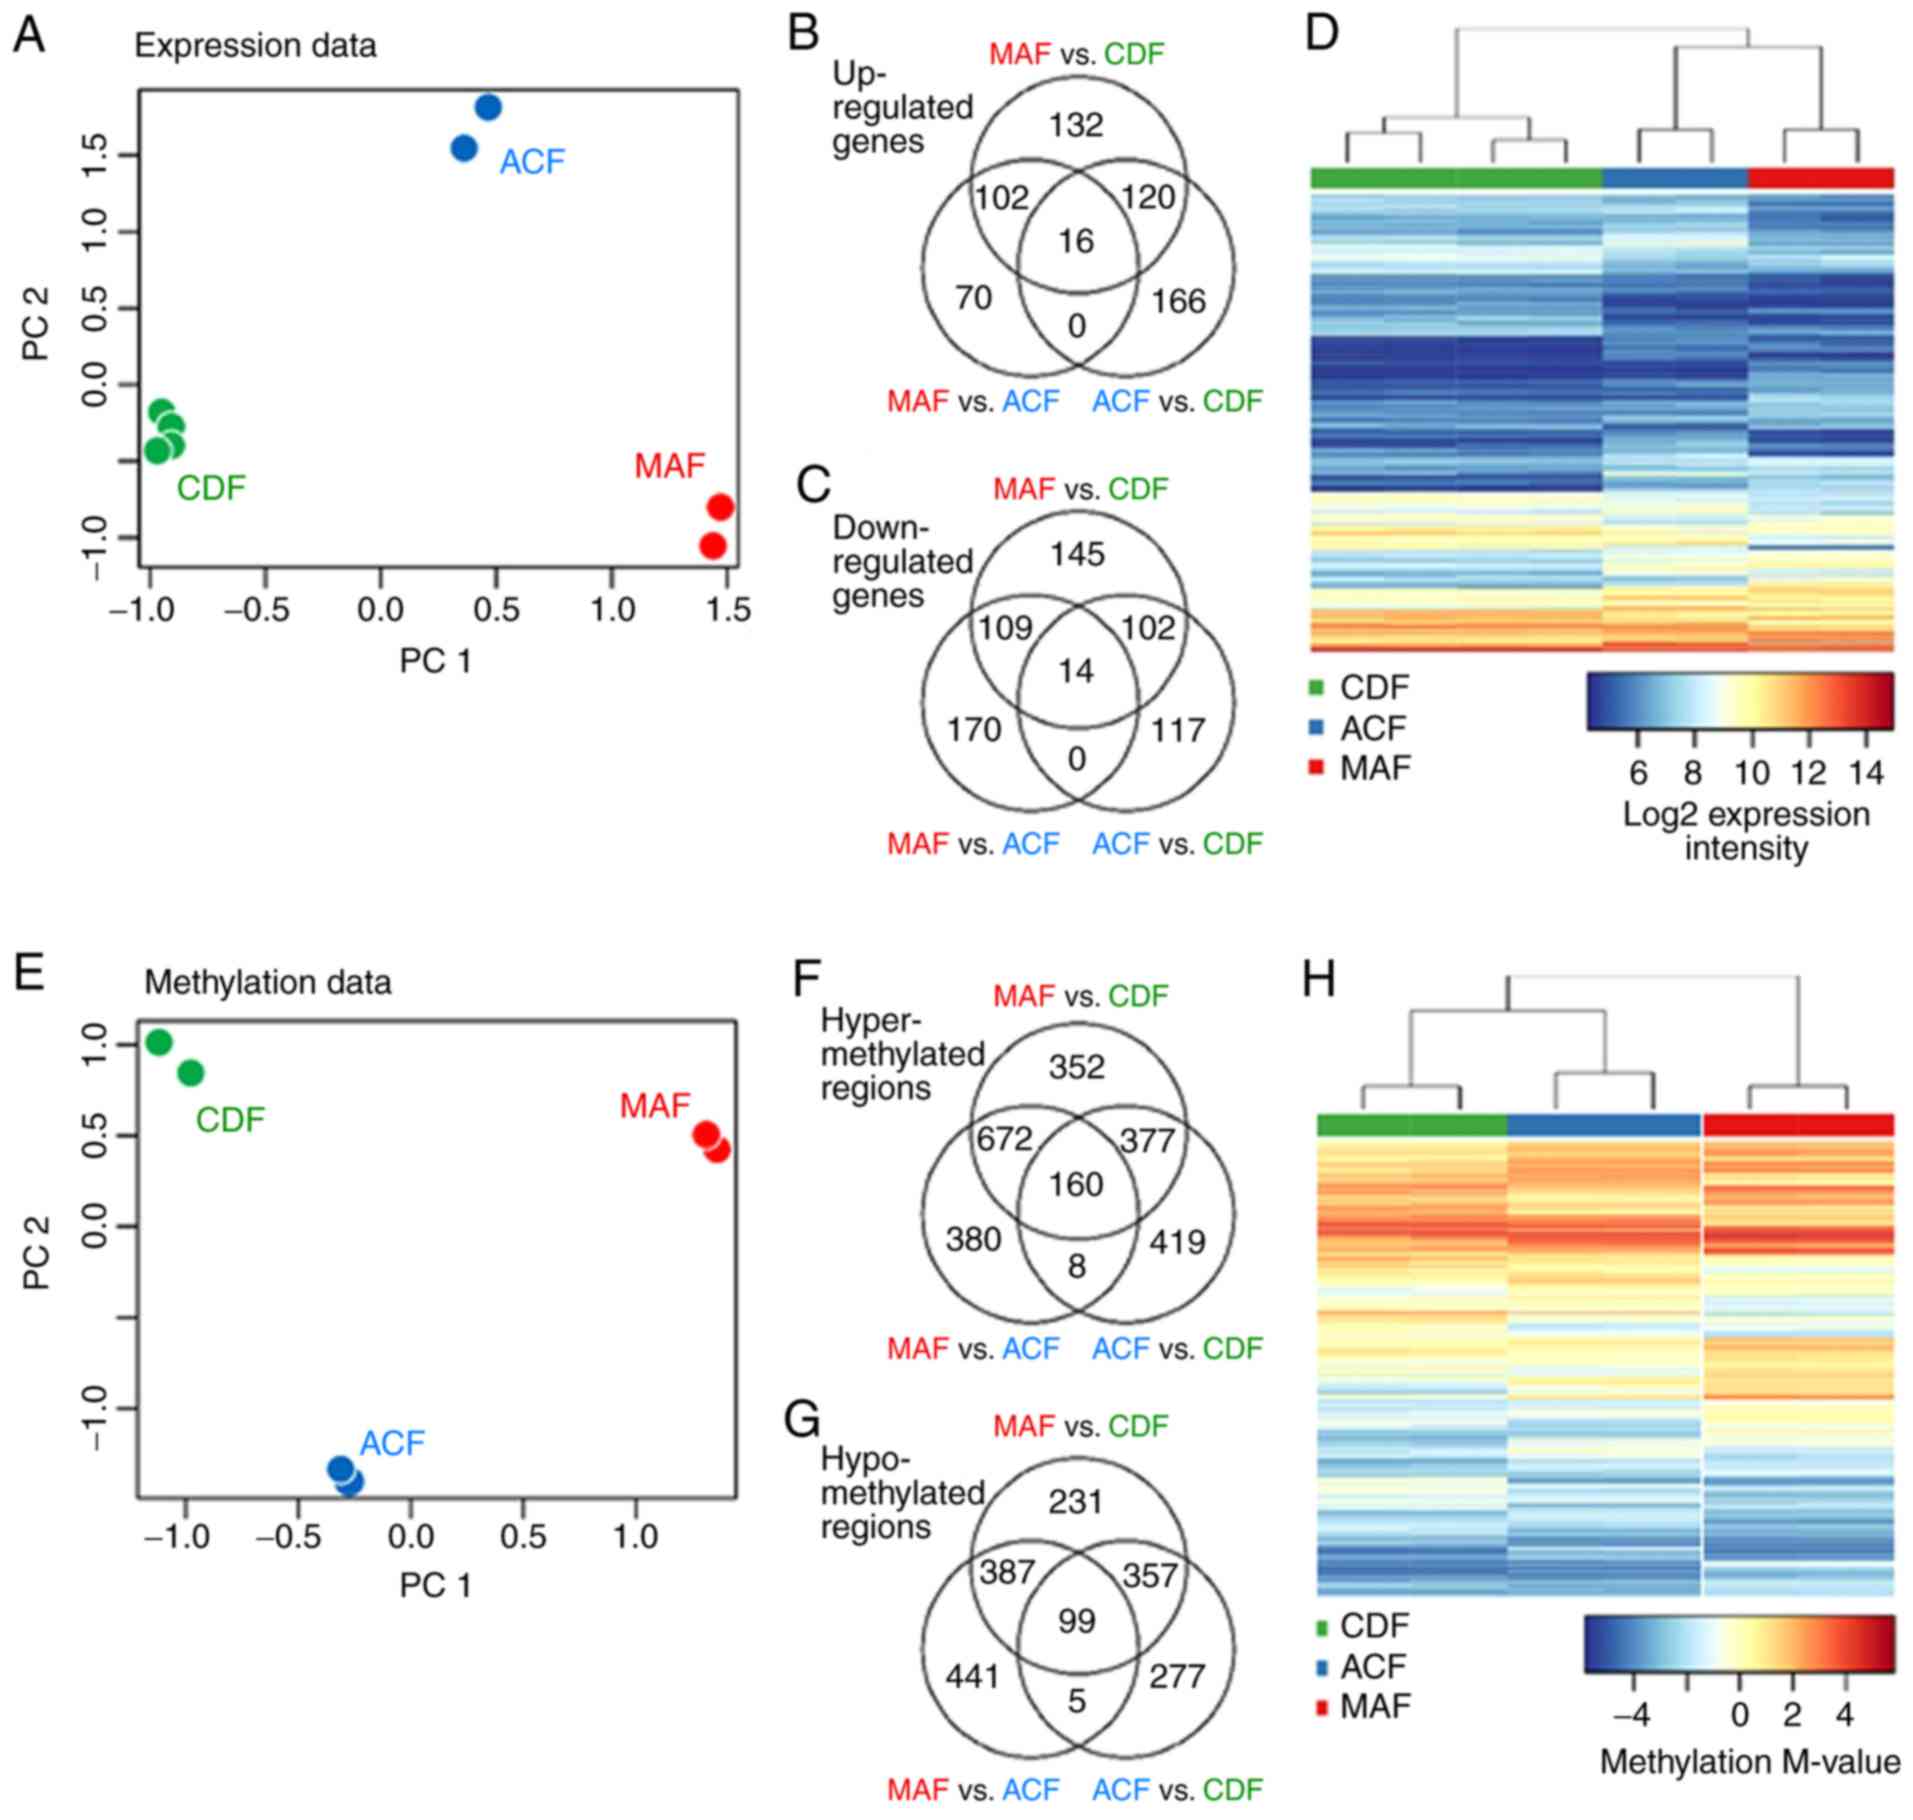
The expression profiles of MAFs, ACFs and CDFs were
compared using microarrays (Fig.
5A–D and Table I). The
expression profiles differed between MAFs and ACFs in the
expression of 1,800 genes, and between MAFs and CDFs there were
2,701 deregulated genes. Finally, there were 1,314 deregulated
genes between ACFs and CDFs (FDR<0.05). Among the genes
upregulated in the comparison of MAF and CDF cells, hyaluronan
synthase 1 and desmoglein 2, which are both associated with
extracellular matrix (ECM) formation, and cytokeratins 18 and 81
were identified. MAF cells exhibited decreased expression of
chemokine CXCL12. In comparison of MAFs with ACFs, upregulation of
hyaluronan synthase 1 and desmoglein 2 was observed, together with
another ECM component, COL10A1. ACF showed upregulation of CXCL12
and cardiac-muscle and smooth-muscle actins (ACTC1 and ACTG2).
ACTG2 was also upregulated in ACFs compared with CDFs, where the
upregulation of the following Wntsignalling pathway related genes
was also observed: Frizzled family receptor 4 and naked cuticle
homolog 2.
Principal component analysis was performed to
visualize associations between the analysed groups (Fig. 5A): The location of the groups in
the plot and the number of deregulated genes between the groups
demonstrated that ACFs differ greatly from CDFs. The association
between ACFs and other analysed groups were further analyzed
(Fig. 5B and C). Two sets of
deregulated genes were defined: a) Genes deregulated in both MAFs
and ACFs, and in both MAFs and CDFs; and b) genes deregulated in
both ACFs and CDFs, and in both MAFs and CDFs. To identify
biological processes deregulated in a) MAFs and b) ACFs and MAFs,
GSEA was performed on the respective sets (Table II).
Genes deregulated similarly in ACFs and in CDFs (in
comparison with MAFs; set a) participate in control of biological
processes related to cell migration and motility (GO:0051272,
2000147, 0030335 and 0048598), morphogenesis, ECM structure
(GO:0048729, 0030198 and 0043062), and response to stress factors,
including decreased oxygen level (GO:0070482, 0036293, 0071294 and
0001666). At the gene level, the activity of, e.g. CXCL12 and
FGF13, were upregulated and was CXCL5 downregulated in ACFs and
CDFs in comparison with MAFs.
ACFs share deregulated genes with MAFs (in
comparison with CDFs; gene set b), which are associated with
changes in angiogenesis and endothelial cell proliferation
(GO:0001525, 0001936, 0001936, 0045765, 0045765, and 0001937), ECM
structure (GO:0030198 and 0043062), response to wounding
(GO:0002237), positive regulation of cell motility and locomotion
(GO:2000147 and 0040017), ossification (GO:0001503), and regulation
of the Wnt signaling pathway (GO:0030111 and 0060828). At the gene
level, marked upregulation of interleukin (IL)6, VEGFA, and TGFB3
genes and downregulation of TGFA was observed in MAFs and ACFs as
compared to CDFs. The relevant differentially regulated genes were
consequently validated directly at the protein level, therefore
quantitative-PCR was not used for validation.
Changes in DNA methylation in MAFs, ACFs
and CDFs
To evaluate whether the changes in transcription
activity of differently expressed genes were associated with
epigenomic changes of the fibroblasts, differentially methylated
genomic regions (DMRs) were detected between the cultured
fibroblasts using microarray technology. A total of 2,300 DMRs were
detected between MAFs and ACFs (787 genes affected in CpG islands,
985 genes affected in CpG shores), between MAFs and CDFs there were
2,908 DMRs (966 genes affected in CpG islands, 1159 genes affected
in CpG shores), and finally there were 1,835 DMRs between ACFs and
CDFs (649 genes affected in CpG islands, 751 genes affected in CpG
shores; FDR<0.1, |logFC|>1; Fig. 5E–H; Table III). PCA analysis (Fig. 5E) distinguished ACF cells from
CDFs and indicated that they differ from either MAFs or CDFs,
respectively (Fig. 5H). MAFs
displayed hyper-methylation of genomic regions associated with an
SMA (ACTA2) and fibroblast growth factor binding protein 2
(FGFBP2). The latter was specifically hyper-methylated in MAF
cells. ACTA2 was hypo-methylated in normal CDF cells when compared
with both MAF and ACF cells.
| Table IIIDMRs between fibroblast groups. |
Table III
DMRs between fibroblast groups.
A, Hyper-methylated
genes in MAF vs. CDF
|
|---|
| RefSeq ID | Entrez Gene ID | Symbol | Definition | Descriptive GO BP
term | FDR | CDF M-value | MAF M-value | ACF M-value |
|---|
| NM_001141945 | 59 | ACTA2 | Actin, α2, smooth
muscle, aorta | GO:0090131 | 6.0E-07 | −3.48 | 3.43 | 1.72 |
| NM_006308 | 8988 | HSPB3 | Heat shock 27 kDa
protein 3 | – | 7.6E-07 | −3.32 | 3.07 | 2.09 |
| NM_001202233 | 3164 | NR4A1 | Nuclear receptor
subfamily 4. group A, member 1 | GO:0044344 | 7.6E-07 | 0.07 | 4.86 | 4.06 |
| NM_031950 | 83888 | FGFBP2 | Fibroblast growth
factor binding protein 2 | – | 7.6E-07 | −3.13 | 1.69 | −2.15 |
| NM_001307983 | 130013 | ACMSD |
Aminocarboxymuconate semialdehyde
decarboxylase | GO:1905004 | 7.6E-07 | −2.15 | 3.15 | 1.12 |
| NM_001256552 | 79661 | NEIL1 | Nei-like DNA
glycosylase 1 | GO:0010730 | 7.6E-07 | −1.86 | 3.19 | 0.87 |
| NM_001039469 | 2011 | MARK2 | MAP/microtubule
affinity-regulating kinase 2 | GO:0016055 | 7.6E-07 | −3.05 | 1.15 | 1.01 |
| NM_001193341 | 221421 | RSPH9 | Radial spoke head 9
homolog (Chlamydomonas) | GO:0044458 | 7.6E-07 | −3.74 | 0.46 | −2.33 |
| NM_033199 | 90226 | UCN2 | Urocortin 2 | GO:0031669 | 7.6E-07 | −3.43 | 1.19 | 0.14 |
B, Hypo-methylated
genes in MAF vs. CDF
|
|---|
| RefSeq ID | Entrez Gene ID | Symbol | Definition | Descriptive GO BP
term | FDR | CDF M-value | MAF M-value | ACF M-value |
|---|
| NM_001199505 | 116154 | PHACTR3 | Phosphatase and
actin regulator 3 | GO:0043086 | 7.6E-07 | 3.37 | −2.73 | 0.74 |
| NM_144719 | 152206 CCDC | 13 | Coiled-coil domain
containing 13 | GO:0035058 | 7.6E-07 | 2.05 | −2.57 | −0.17 |
| NM_000438 | 5077 | PAX3 | Paired box 3 | GO:0009887a | 7.6E-07 | 2.96 | −1.53 | 2.98 |
| NM_002151 | 3249 | HPN | Hepsin | GO:0010719 | 7.6E-07 | 4.09 | −1.15 | 1.34 |
| NM_153038 | 151278 CCDC | 140 | Coiled-coil domain
containing 140 | – | 7.6E-07 | 2.40 | −2.86 | 2.87 |
| NM_000384 | 338 | APOB | Apolipoprotein
B | GO:0032496a | 7.6E-07 | 2.90 | −2.93 | 0.66 |
C, Hyper-methylated
genes in MAF vs. ACF
|
|---|
| RefSeq ID | Entrez Gene ID | Symbol | Definition | Descriptive GO BP
term | FDR | CDF M-value | MAF M-value | ACF M-value |
|---|
| NM_001242805 | 676 | BRDT | Bromodomain,
testis-specific | GO:0006338 | 4.2E-06 | 1.15 | 3.62 | −1.43 |
| NM_001300905 | 11176 | BAZ2A | Bromodomain
adjacent to zinc finger domain, 2A | GO:0006338 | 5.1E-06 | −4.52 | −0.9 | −4.29 |
| NM_018593 | 117247 | SLC16A10 | Solute carrier
family 16 (aromatic amino acid transporter). Member 10 | GO:0006865 | 4.2E-06 | −3.50 | 1.46 | −3.98 |
| NM_005992 | 6899 | TBX1 | T-box 1 | GO:0001525 | 4.2E-06 | 0.79 | 1.60 | −2.20 |
| NM_178818 | 146223 | CMTM4 | CKLF-like MARVEL
transmembrane domain containing 4 | GO:0005125 | 4.2E-06 | −2.70 | 1.35 | −2.46 |
| NM_000663 | 18 | ABAT | 4-aminobutyrate
aminotransferase | GO:0001666a | 4.2E-06 | −4.14 | −0.07 | −4.11 |
| NM_006829 | 10974 | ADIRF | Adipogenesis
regulatory factor | GO:0030154 | 4.2E-06 | −4.29 | 0.31 | −4.32 |
| NM_006181 | 4917 | NTN3 | Netrin 3 | GO:0007411 | 4.2E-06 | −4.54 | −1.14 | −4.78 |
| NM_031950 | 83888 | FGFBP2 | Fibroblast growth
factor binding protein 2 | – | 4.7E-06 | −3.13 | 1.69 | −2.15 |
| NM_001720 | 656 | BMP8B | Bone morphogenetic
protein 8b | GO:0001503a | 4.7E-06 | −4.66 | −0.79 | −4.55 |
| NM_005731 | 10109 | ARPC2 | Actin related
protein 2/3 complex. subunit 2, 34 kDa | GO:1900026 | 5.1E-06 | −3.37 | −0.84 | −4.31 |
D, Hypo-methylated
genes in MAF vs. ACF
|
|---|
| RefSeq ID | Entrez Gene ID | Symbol | Definition | Descriptive GO BP
term | FDR | CDF M-value | MAF M-value | ACF M-value |
|---|
| NM_000192 | 6910 | TBX5 | T-box 5 | GO:0002009a | 1.3E-06 | −2.27 | −3.24 | 3.75 |
| NM_153038 | 151278 CCDC | 140 | Coiled-coil domain
containing 140 | – | 3.4E-06 | 2.40 | −2.86 | 2.87 |
| NM_000438 | 5077 | PAX3 | Paired box 3 | GO:0009887a | 4.2E-06 | 2.96 | −1.53 | 2.98 |
| NM_001053 | 6755 | SSTR5 | Somatostatin
receptor 5 | GO:0007186 | 4.2E-06 | −0.75 | −4.83 | −0.62 |
| NM_152739 | 3205 | HOXA9 | Homeobox A9 | GO:0007275 | 4.2E-06 | 0.09 | −3.76 | 0.28 |
| NM_015916 | 51063 C | ALHM2 | Calcium homeostasis
modulator 2 | GO:0005261 | 5.1E-06 | −4.79 | −4.84 | −1.16 |
E, Hyper-methylated
genes in ACF vs. CDF
|
|---|
| RefSeq ID | Entrez Gene ID | Symbol | Definition | Descriptive GO BP
term | FDR | CDF M-value | MAF M-value | ACF M-value |
|---|
| NM_000192 | 6910 | TBX5 | T-box 5 | GO:0002009a | 3.6E-06 | −2.27 | −3.24 | 3.75 |
| NM_001141945 | 59 | ACTA2 | Actin. α2, smooth
muscle, aorta | GO:0090131 | 3.6E-06 | −3.48 | 3.43 | 1.72 |
| NM_006308 | 8988 | HSPB3 | Heat shock 27 kDa
protein 3 | – | 3.6E-06 | −3.32 | 3.07 | 2.09 |
| NM_001039469 | 2011 | MARK2 | MAP/microtubule
affinity-regulating kinase 2 | GO:0016055 | 3.6E-06 | −3.05 | 1.15 | 1.01 |
| NM_001202233 | 3164 | NR4A1 | Nuclear receptor
subfamily 4. group A. member 1 | GO:0044344 | 4.0E-06 | 0.07 | 4.86 | 4.06 |
| NM_000129 | 2162 | F13A1 | Coagulation factor
XIII. A1 polypeptide | GO:0007596 | 4.0E-06 | −4.97 | −0.78 | −1.12 |
| NM_001286555 | 56940 | DUSP22 | Dual specificity
phosphatase 22 | GO:0008283 | 5.9E-06 | −3.92 | −0.45 | −0.51 |
| NM_015916 | 51063 | CALHM2 | Calcium homeostasis
modulator 2 | GO:0005261 | 5.9E-06 | −4.79 | −4.84 | −1.16 |
| NM_001012631 | 9235 | IL32 | Interleukin 32 | GO:0005125 | 5.9E-06 | −3.35 | 0.37 | 1.29 |
| NM_000504 | 2159 | F10 | Coagulation factor
X | GO:0030335a | 6.2E-06 | −0.42 | 3.59 | 3.68 |
F, Hypo-methylated
genes in ACF vs. CDF
|
|---|
| RefSeq ID | Entrez Gene ID | Symbol | Definition | Descriptive GO BP
term | FDR | CDF M-value | MAF M-value | ACF M-value |
|---|
| NM_001297436 | 3036 | HAS1 | Hyaluronan synthase
1 | GO:0085029 | 4.0E-06 | 1.38 | −4.34 | −4.22 |
| NM_000965 | 5915 | RARB | Retinoic acid
receptor, beta | GO:0007165 | 4.0E-06 | −0.57 | −4.43 | −4.66 |
| NM_001166247 | 2898 | GRIK2 | Glutamate receptor,
ionotropic, kainate 2 | GO:0046328 | 4.0E-06 | 0.73 | −3.46 | −3.40 |
| NM_001207011 | 1271 | CNTFR | Ciliary
neurotrophic factor receptor | GO:0060538 | 5.8E-06 | 2.87 | −2.6 | −1.69 |
| NM_001128423 | 255027 | MPV17L | MPV17 mitochondrial
membrane protein-like | GO:0010730 | 6.3E-06 | −0.75 | −3.91 | −4.53 |
As in the gene expression analysis, the association
between ACFs and other analysed groups was evaluated (Fig. 5F and G) and two sets of
deregulated regions were defined: a) Those differentially
methylated in both MAFs and ACFs, and MAFs and CDFs, and b) the
genes differentially methylated in both ACFs and CDFs, and MAFs and
CDFs. GSEA was performed on the respective gene sets. Notably,
although there is a large number of DMRs and associated genes, GSEA
did not yield significant enrichment of any single GO term (except
the general term 'behavior', which is unrelated to the studied
phenomenon). Still, it was observed that the genes attributed to
the GO terms affected by changes in gene transcription were widely
present among DMRs. For MAF specific genes (set a), the GO terms
typically contained 25 DMRs (min 23, max 70), with the exception of
a single GO term (GO:0071294) with only 3 DMRs. For CDF specific
genes (set b), the terms typically contained 17 DMRs (min 7, max
34), with the exception of the GO term GO:0001937 with two DMRs
only. Therefore, it may be concluded that, although changes in
methylation are not specifically targeted on biological processes
manifested by changes in the expression activity, they target these
processes to a large degree.
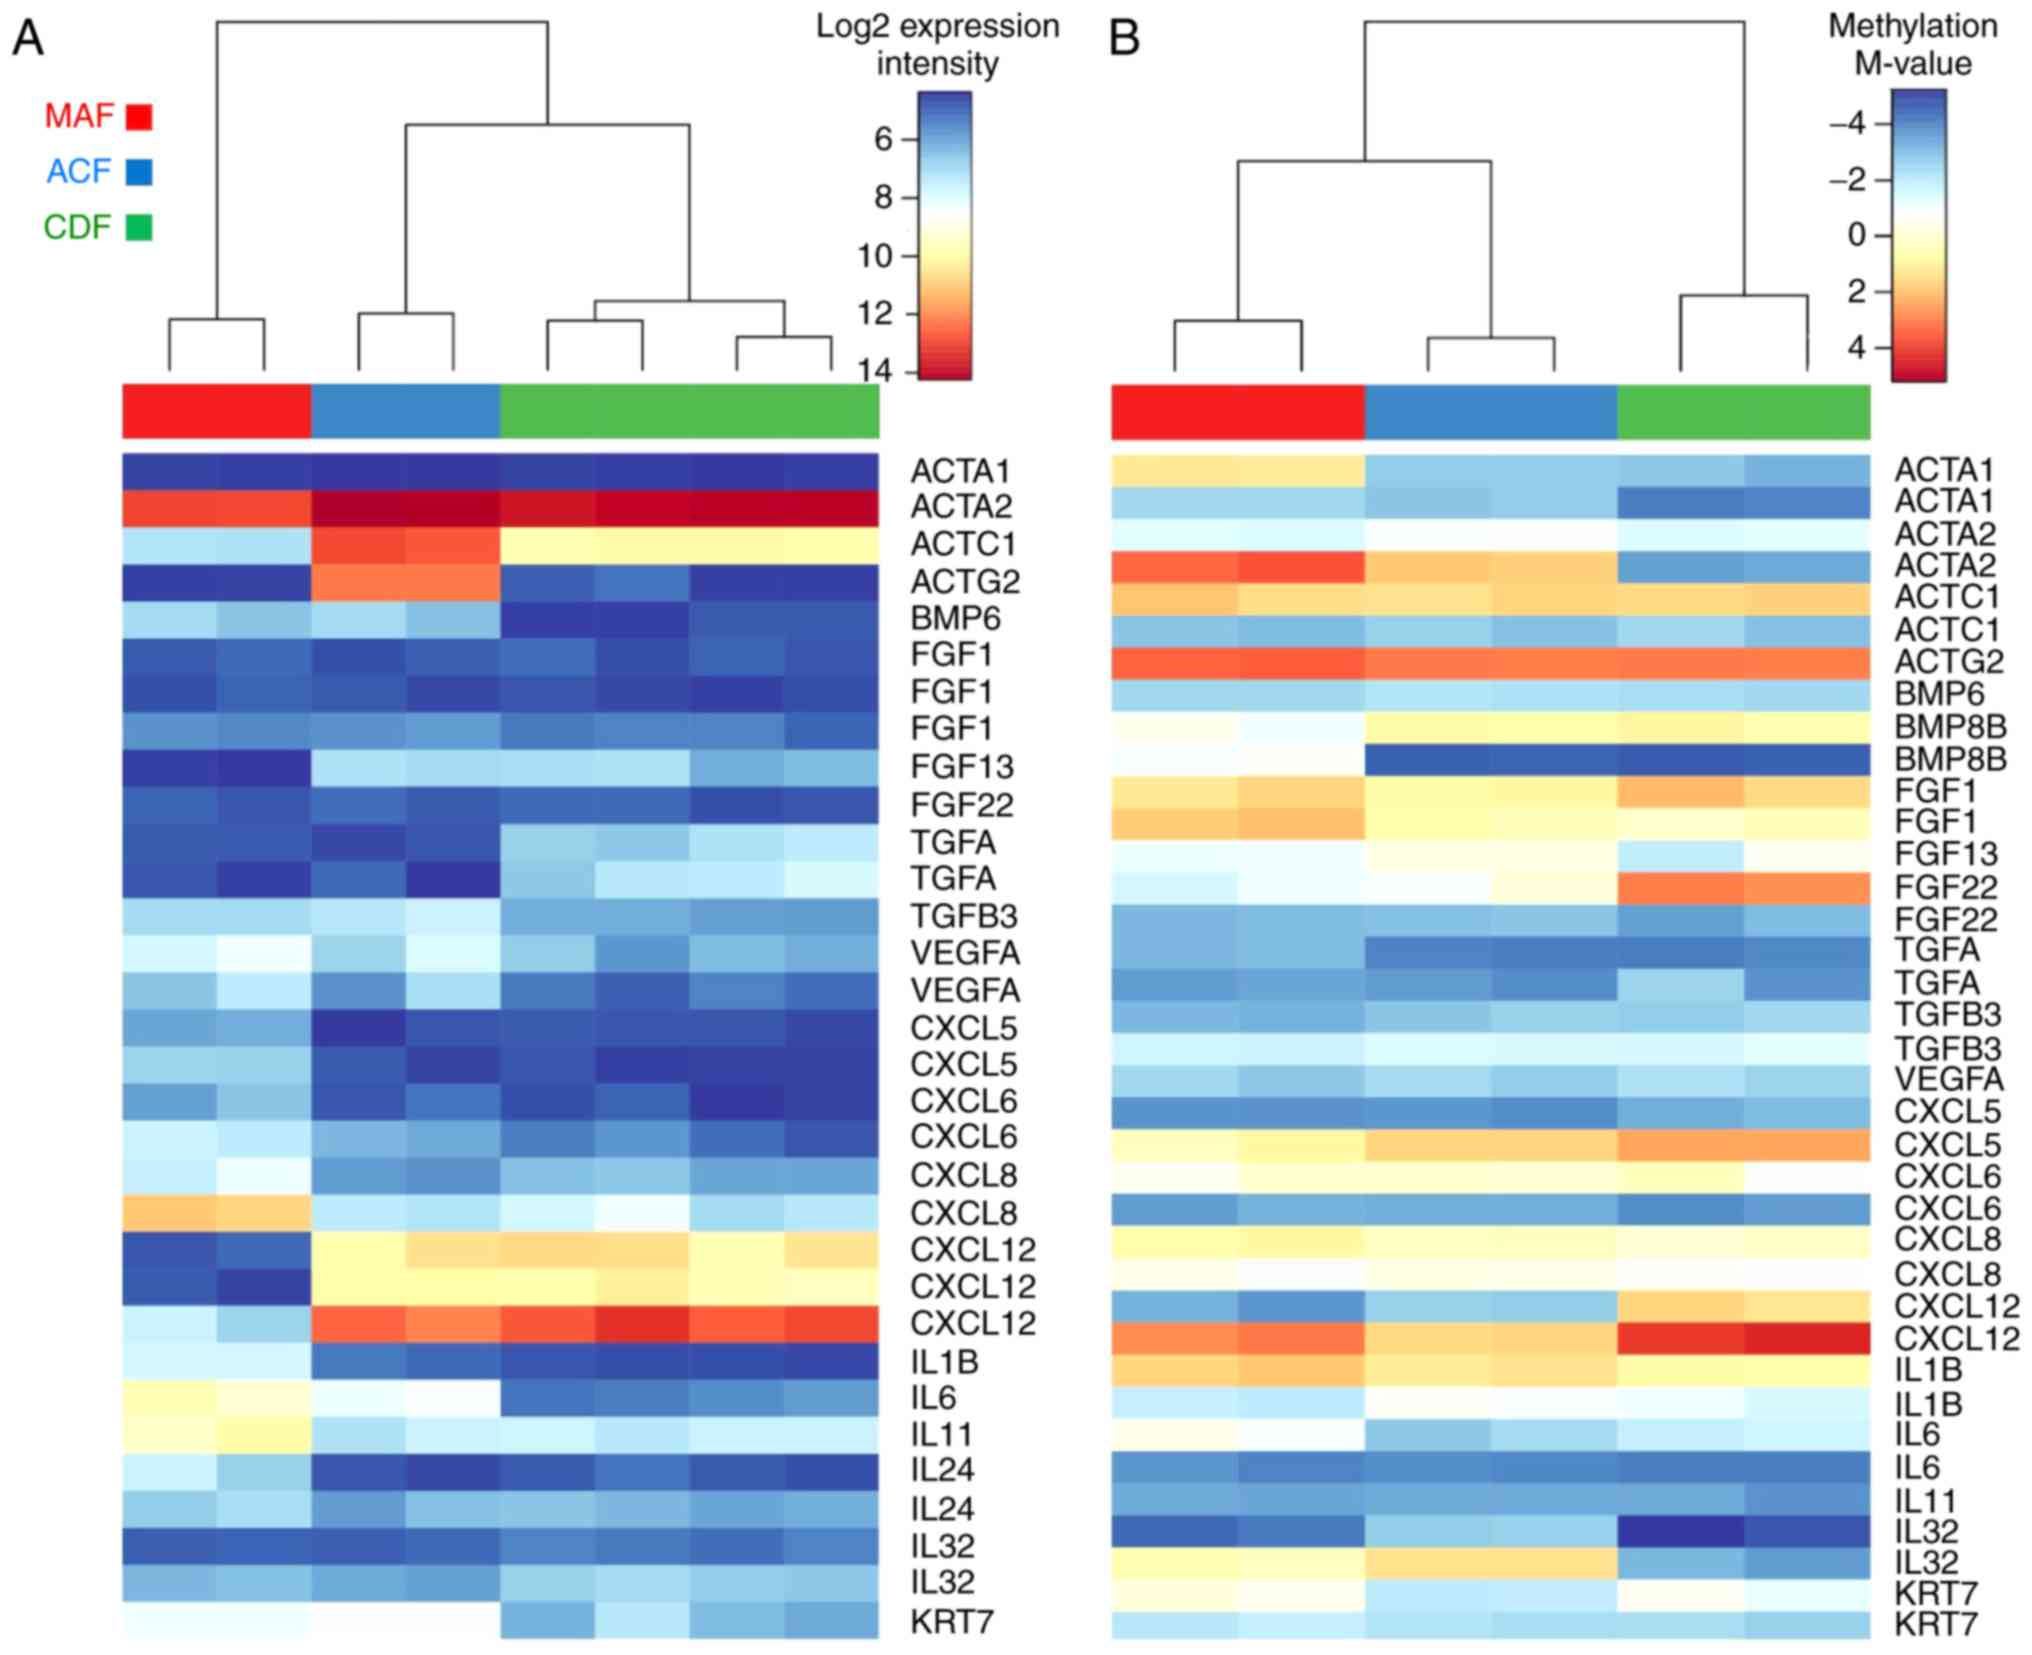
At the gene level, the largest changes in
methylation of these selected genes were observed: Actins ACTA1 and
ACTA2, the genes coding for SMA; growth factors FGF11, FGF22, and
BMP8B; and chemokines and interleukins CXCL12, IL6, and IL32.
Finally, the expression profiles (Fig. 6A) and methylation profiles
(Fig. 6B) were evaluated,
together with the selected genes with strongest changes in gene
expression: Actins ACTC1 and ACTG2; growth factors FGF13, BMP6, and
TGFA; chemokines and interleukins CXCL5, -6, -12, IL1B, IL6, IL8,
IL11, and IL24; and keratin KRT7. Notably, the expression profiles
of the selected genes in ACF samples are typically closer to
expression profiles observed in CDF samples, whereas their
methylation status is, in general, closer to MAFs (Fig. 6).
Discussion
In skin, normal fibroblasts represent a number of
distinct differentiated mesenchymal cell types that have different
origins, locations and functions (25,26). Furthermore, similar heterogeneity
is observed in tumor stromal tissues. The myofibroblast (27), which is a hallmark of cancer
stroma, remains one of the most poorly understood cell types. It is
clear that current understanding of the myofibroblast (its origins,
functions and molecular regulation) will have a profound influence
on the future effectiveness of regenerative medicine, tissue
engineering and cancer therapy.
To exclude site-specific differences in e.g. gene
transcription or DNA methylation, low passage fibroblasts obtained
from the comparable anatomically defined region, the upper trunk,
were used. Based on this restriction, relatively high homogeneity
in gene transcription of CDFs, even from various donors, can be
demonstrated.
In the present study, MAFs did not share B-Raf
mutations with melanoma cells from skin metastasis. This suggests a
likely local origin from the dermis, rather than the
epithelial-to-mesenchymal transition from malignant cells. This
also excludes MAFs as the primary target of the direct effect of
B-Raf inhibitor.
Via the comparison of MAFs and CDFs from healthy
donors, distinctive differences were observed. Recruitment of
normal dermal cells in the vicinity of melanoma and their
conversion to MAFs is classically associated with TGF-β release
from melanoma cells in a paracrine manner (27). Notably, ACFs from the same
melanoma patient also greatly differed from CDFs from the general
population. All gene expression profile differences were confirmed
directly on the protein level, therefore omitting the necessity of
quantitative-PCR.
The comparison of expression profiles of MAFs, ACFs
and CDFs indicated that ACFs exhibit higher activity of the genes
responsible for activation of fibroblasts and cancer cells, namely
important mediators such as TGF-β or IL6. ACFs also demonstrated
deregulation of ACTG2 expression, and of another gene associated
with smooth muscle, KCNMA1.
The presence of activated fibroblasts in normal
dermis far from the melanoma lesions supports that melanoma is a
systemic disease. This idea was initially proposed by Krasagakis
et al (12). Furthermore,
the present patient was treated with a B-Raf inhibitor which is
known to induce cytokine release from melanoma cells in
vitro (27). The observed
unusual activation of ACF cells may be explained in a similar
manner as activation of MAF via production of bioactive substances,
namely TGF-β, IL6, IL8, and matrix metalloproteinase-1 by cancer
cells in consequence to vemurafenib treatment (28-32).
TGF-β signalling is one of the major pathways
controlling cell and tissue behaviour in development and in various
human pathologies. During tumorigenesis, TGF-β has a dual role as
tumor suppressor and tumor promoter (33). Important functions of this pathway
have previously been described in a context-dependent manner both
in epithelial cancer cells and in the tumor microenvironment during
tumor progression (28,30,33). The TGF-β system signals via
protein kinase receptors and SMAD mediators. Alterations of the
TGF-β signaling pathway are implicated in numerous types of human
cancer (33).
Notably, differential expression of genes in the
TGF-β signalling pathway (e.g. SMAD molecules, etc.) have not been
observed, despite the fact that the TGF-β signalling pathway serves
an important and key role in the tumor microenvironment and cancer
progression. This reflects the dependence of SMADs on their
phosphorylation status, rather than actual quantity. Furthermore,
TGF-β signalling is always reported as 'context-dependent'
(27,28,30). In such cases, the critical point
is availability of the cytokine (TGF-β) in the tumor tissue.
In a recent study, Fedorenko et al (28) concluded that B-Raf inhibitor
treatment escape in melanoma is due to short-term adaptation in
which cells evade the immediate effects of the drug in the
supportive microenvironment. However, confirmation of relevancy of
this murine model for human pathology was (to the best of our
knowledge) missing. The present study offers a comparison of this
murine model to paired dermal fibroblasts isolated from a single
melanoma patient prior to systemic therapy (B-Raf inhibitor)
initiation and on treatment. Such paired material is rarely
available and the present data is of relevance to the
above-mentioned animal model.
The present data suggests a more sustained effect as
the ACF cultures were stored without vemurafenib for a substantial
duration (≥2 months) during expansion in vitro. Maintenance
of this activated phenotype would require more profound cellular
changes, e.g. on the epigenetic level. Although dependence of the
gene methylation and its expression is complex, and both gene
upregulation and downregulation may occur with gene methylation
(33), the observed increase of
IL6 expression in ACFs may be associated with the observed
demethylation of this gene in ACFs. Similarly, an increased
expression of keratin 7 was observed in ACFs and MAFs accompanied
by its decreased methylation. This unusual presence of simple type
keratins in activated fibroblasts has also been described elsewhere
(34).
Notably, observed upregulation of SMA expression in
ACF cells at the protein level and the transcriptional activation
of ACTA2, the gene coding for SMA, is consistent with abrupt
hypermethylation of ACTA2 in both ACF and MAF cells. This
observation may indicate the association of epigenetic changes in
the activation of ACF cells.
Cancer-associated fibroblasts, including MAFs,
produce numerous bioactive substances that actively influence
cancer cell proliferation, differentiation and migration (15) and are able to strongly influence
melanoma cells. Furthermore, cancer-associated fibroblasts, or MAFs
specifically, are important drivers of tumor progression, including
metastatic spread, and resistance to vemurafenib, as proposed
recently (27,30,37). Based on the presented similarities
of MAFs and ACFs in the present patient on B-Raf inhibitor
treatment, it may be hypothesized that vemurafenib therapy is able
to influence not only B-Raf mutated tumor cells, but presumably may
also shape the whole landscape of tissue microenvironment in the
human body, to some extent. Vast differences have also been
documented in control fibroblasts (ACF vs. CDF) on the level of DNA
methylation, RNA transcription and also on the protein level. Such
an activated microenvironment may be suitable for growth of
circulating melanoma cells (2,4,6).
The fibronectin rich 'safe haven' may be created either by
melanoma-associated fibroblasts or by distant fibroblasts activated
by TGF-β1 released from B-Raf therapy-stressed melanoma cells
(27-31). Mechanistically, this phenomenon
may participate in the induction of resistance to the therapy as
depicted in the case of the presented patient.
The key question for the future is whether the
present knowledge of fibroblast heterogeneity may be of clinical
use in personalized cancer therapy. As indicated above, the ACFs
resemble normal dermal fibroblasts of a healthy individual
stimulated by TGF-β1. Therefore, it may be hypothesized that
therapeutic attenuation of TGF-β activity (38,39), blocking of transition of
fibroblasts to myofibroblasts (39) and/or therapeutic blockade of their
function (40) may be used to
prevent resistance to B-Raf inhibitor therapy in the future.
Mechanistically, this blockade would disrupt bi-directional
cross-talk between the melanoma cells and stromal fibroblasts which
allow the tumors to amplify a drug-resistant niche. Genomic studies
have clearly demonstrated the evolution of genetic heterogeneity in
melanoma in the course of tumor progression and metastasis
formation (41,42). The tumor microenvironment seems to
participate in the tumor evolution by the formation of a suitable
cellular ecosystem supporting its progression (43).
The present study represents a single clinical case
analysis that may be easily linked to the latest development in
preclinical melanoma research on animal models (28-31,37,38). Larger cohort-based studies are
necessary for the near future for selection of proper candidate
additional targets for further improvement of personalized melanoma
therapy.
Glossary
Abbreviations
Abbreviations:
|
ACF
|
autologous control fibroblasts
|
|
CDF
|
control dermal fibroblasts
|
|
CT
|
computed tomography
|
|
MAF
|
melanoma associated fibroblasts
|
|
PCR
|
polymerase chain reaction
|
|
SMA
|
smooth muscle actin
|
|
TGF-β1
|
transforming growth factor-β1
|
Acknowledgments
The present study is a result of the project
implementation: 'The equipment for metabolomic and cell analyses'
(registration no. CZ.1.05/2.1.00/19.0400) supported by Research and
Development for Innovations Operational Program (RDIOP) co-financed
by the European Regional Development Fund and the state budget of
the Czech Republic, MH CZ-DRO (Institute of Endocrinology grant no.
EU 00023761). The present study was also supported by the Grant
Agency of the Czech Republic (grant no. 16-05534S), the Ministry of
Health (AZV nos. 16-29032A, 16-32665A and 16-30954A), Charles
University (Project of Specific University Research grant nos.
PRVOUK-27 and UNCE 23014) and by the Ministry of Education, Youth
and Sports of CR within the National Sustainability Program II
(Project BIOCEV-FAR reg. no. LQ1604) and by the project BIOCEV
(grant no. CZ.1.05/1.1.00/02.0109). Access to computing and storage
facilities owned by parties and projects contributing to the
National Grid Infrastructure MetaCentrum were provided under the
programme 'Projects of Large Research, Development, and Innovations
Infrastructures' (grant no. CESNET LM2015042), is greatly
appreciated. The present authors are grateful to Marie Jindráková
for technical assistance and also to Ms. Pearl Harris for English
language editing during manuscript preparation and consequent
proofreading.
Notes
[1] Competing
interests
The authors declare that they have no competing
interests.
References
|
1
|
Forsea AM, Del Marmol V, de Vries E,
Bailey EE and Geller AC: Melanoma incidence and mortality in
Europe: New estimates, persistent disparities. Br J Dermatol.
167:1124–1130. 2012. View Article : Google Scholar : PubMed/NCBI
|
|
2
|
Smetana K Jr, Dvoøánková B, Szabo P,
Strnad H and Koláø M: Role of stromal fibroblasts in cancer
originated from squamous epithelia. Dermal Fibroblasts:
Histological perspectives, characterization and role in disease.
Bai X: Nova Sciences Publishers; New York, NY: pp. 83–94. 2013
|
|
3
|
Kulesa PM, Kasemeier-Kulesa JC, Teddy JM,
Margaryan NV, Seftor EA, Seftor RE and Hendrix MJ: Reprogramming
metastatic melanoma cells to assume a neural crest cell-like
phenotype in an embryonic microenvironment. Proc Natl Acad Sci USA.
103:3752–3757. 2006. View Article : Google Scholar : PubMed/NCBI
|
|
4
|
Kodet O, Dvořánková B, Krejčí E, Szabo P,
Dvořák P, Štork J, Krajsová I, Dundr P, Smetana K Jr and Lacina L:
Cultivation-dependent plasticity of melanoma phenotype. Tumour
Biol. 34:3345–3355. 2013. View Article : Google Scholar : PubMed/NCBI
|
|
5
|
Kodet O, Lacina L, Krejčí E, Dvořánková B,
Grim M, Štork J, Kodetová D, Vlček Č, Šáchová J, Kolář M, et al:
Melanoma cells influence the differentiation pattern of human
epidermal keratinocytes. Mol Cancer. 14:12015. View Article : Google Scholar : PubMed/NCBI
|
|
6
|
Li L, Dragulev B, Zigrino P, Mauch C and
Fox JW: The invasive potential of human melanoma cell lines
correlates with their ability to alter fibroblast gene expression
in vitro and the stromal microenvironment in vivo. Int J Cancer.
125:1796–1804. 2009. View Article : Google Scholar : PubMed/NCBI
|
|
7
|
Comito G, Giannoni E, Di Gennaro P, Segura
CP, Gerlini G and Chiarugi P: Stromal fibroblasts synergize with
hypoxic oxidative stress to enhance melanoma aggressiveness. Cancer
Lett. 324:31–41. 2012. View Article : Google Scholar : PubMed/NCBI
|
|
8
|
Dvořánková B, Szabo P, Lacina L, Kodet O,
Matoušková E and Smetana K Jr: Fibroblasts prepared from different
types of malignant tumors stimulate expression of luminal marker
keratin 8 in the EM-G3 breast cancer cell line. Histochem Cell
Biol. 137:679–685. 2012. View Article : Google Scholar
|
|
9
|
Yin M, Soikkeli J, Jahkola T, Virolainen
S, Saksela O and Hölttä E: TGF-β signaling, activated stromal
fibroblasts, and cysteine cathepsins B and L drive the invasive
growth of human melanoma cells. Am J Pathol. 181:2202–2216. 2012.
View Article : Google Scholar : PubMed/NCBI
|
|
10
|
Krasagakis K, Thölke D, Farthmann B,
Eberle J, Mansmann U and Orfanos CE: Elevated plasma levels of
transforming growth factor (TGF)-beta1 and TGF-beta2 in patients
with disseminated malignant melanoma. Br J Cancer. 77:1492–1494.
1998. View Article : Google Scholar : PubMed/NCBI
|
|
11
|
Dvořánková B, Szabo P, Lacina L, Gal P,
Uhrova J, Zima T, Kaltner H, André S, Gabius HJ, Sykova E and
Smetana K Jr: Human galectins induce conversion of dermal
fibroblasts into myofibroblasts and production of extracellular
matrix: Potential application in tissue engineering and wound
repair. Cells Tissues Organs. 194:469–480. 2011. View Article : Google Scholar
|
|
12
|
Krasagakis K, Garbe C, Schrier PI and
Orfanos CE: Paracrine and autocrine regulation of human melanocyte
and melanoma cell growth by transforming growth factor beta in
vitro. Anticancer Res. 14:2565–2571. 1994.PubMed/NCBI
|
|
13
|
Balch CM, Gershenwald JE, Soong SJ and
Thompson JF: Update on the melanoma staging system: The importance
of sentinel node staging and primary tumor mitotic rate. J Surg
Oncol. 104:379–385. 2011. View Article : Google Scholar : PubMed/NCBI
|
|
14
|
Lacina L, Smetana K Jr, Dvoránková B,
Pytlík R, Kideryová L, Kucerová L, Plzáková Z, Stork J, Gabius HJ
and André S: Stromal fibroblasts from basal cell carcinoma affect
phenotype of normal keratinocytes. Br J Dermatol. 156:819–829.
2007. View Article : Google Scholar : PubMed/NCBI
|
|
15
|
Kolář M, Szabo P, Dvořánková B, Lacina L,
Gabius HJ, Strnad H, Sáchová J, Vlček C, Plzák J, Chovanec M, et
al: Upregulation of IL-6, IL-8 and CXCL-1 production in dermal
fibroblasts by normal/malignant epithelial cells in vitro:
Immunohistochemical and transcriptomic analyses. Biol Cell.
104:738–751. 2012. View Article : Google Scholar
|
|
16
|
Therasse P, Arbuck SG, Eisenhauer EA,
Wanders J, Kaplan RS, Rubinstein L, Verweij J, Van Glabbeke M, van
Oosterom AT, Christian MC and Gwyther SG: New guidelines to
evaluate the response to treatment in solid tumors European
organization for research and treatment of cancer, National Cancer
institute of the United States, National Cancer Institute of
Canada. J Natl Cancer Inst. 92:205–216. 2000. View Article : Google Scholar : PubMed/NCBI
|
|
17
|
Salvatore G, Chiappetta G, Nikiforov YE,
Decaussin-Petrucci M, Fusco A, Carney JA and Santoro M: Molecular
profile of hyalinizing trabecular tumours of the thyroid: High
prevalence of RET/PTC rearrangements and absence of B-raf and N-ras
point mutations. Eur J Cancer. 41:816–821. 2005. View Article : Google Scholar : PubMed/NCBI
|
|
18
|
Sykorova V, Dvorakova S, Ryska A, Vcelak
J, Vaclavikova E, Laco J, Kodetova D, Kodet R, Cibula A, Duskova J,
et al: BRAFV600E mutation in the pathogenesis of a large series of
papillary thyroid carcinoma in Czech Republic. J Endocrinol Invest.
33:318–324. 2010. View Article : Google Scholar
|
|
19
|
Smyth GK: Linear models and empirical
bayes methods for assessing differential expression in microarray
experiments. Stat Appl Genet Mol Biol. 3:Article 3. 2004.
View Article : Google Scholar
|
|
20
|
Gentleman RC, Carey VJ, Bates DM, Bolstad
B, Dettling M, Dudoit S, Ellis B, Gautier L, Ge Y, Gentry J, et al:
Bioconductor: Open software development for computational biology
and bioinformatics. Genome Biol. 5:R802004. View Article : Google Scholar : PubMed/NCBI
|
|
21
|
Valach J, Fík Z, Strnad H, Chovanec M,
Plzák J, Cada Z, Szabo P, Sáchová J, Hroudová M, Urbanová M, et al:
Smooth muscle actin-expressing stromal fibroblasts in head and neck
squamous cell carcinoma: Increased expression of galectin-1 and
induction of poor prognosis factors. Int J Cancer. 131:2499–2508.
2012. View Article : Google Scholar : PubMed/NCBI
|
|
22
|
Culhane AC, Thioulouse J, Perrière G and
Higgins DG: MADE4: An R package for multivariate analysis of gene
expression data. Bioinformatics. 21:2789–2790. 2005. View Article : Google Scholar : PubMed/NCBI
|
|
23
|
Wu H, Caffo B, Jaffee HA, Irizarry RA and
Feinberg AP: Redefining CpG islands using hidden Markov models.
Biostatistics. 11:499–514. 2010. View Article : Google Scholar : PubMed/NCBI
|
|
24
|
Chen EY, Tan CM, Kou Y, Duan Q, Wang Z,
Meirelles GV, Clark NR and Ma'ayan A: Enrichr: Interactive and
collaborative HTML5 gene list enrichment analysis tool. BMC
Bioinformatics. 14:1282013. View Article : Google Scholar : PubMed/NCBI
|
|
25
|
Driskell RR and Watt FM: Understanding
fibroblast heterogeneity in the skin. Trends Cell Biol. 25:92–99.
2015. View Article : Google Scholar
|
|
26
|
Tomasek JJ, GAbbiani G, Hinz B, Chaponnier
C and Brown RA: Myofibroblasts and mechano-regulation of connective
tissue remodelling. Nat Rev Mol Cell Biol. 3:349–363. 2002.
View Article : Google Scholar : PubMed/NCBI
|
|
27
|
Whipple CA and Brinckerhoff CE:
BRAF(V600E) melanoma cells secrete factors that activate stromal
fibroblasts and enhance tumourigenicity. Br J Cancer.
111:1625–1633. 2014. View Article : Google Scholar : PubMed/NCBI
|
|
28
|
Fedorenko IV, Wargo JA, Flaherty KT,
Messina JL and Smalley KSM: BRAF inhibition generates a host-tumor
niche that mediates therapeutic escape. J Invest Dermatol.
135:3115–3124. 2015. View Article : Google Scholar : PubMed/NCBI
|
|
29
|
Hirata E, Girotti MR, Viros A, Hooper S,
Spencer-Dene B, Matsuda M, Larkin J, Marais R and Sahai E:
Intravital imaging reveals how BRAF inhibition generates
drug-tolerant microenvi-ronments with high integrin β1/FAK
signaling. Cancer Cell. 27:574–588. 2015. View Article : Google Scholar : PubMed/NCBI
|
|
30
|
Fedorenko IV and Smalley KS: The
complexity of microenvironment-mediated drug resistance. Genes
Cancer. 6:367–368. 2015.PubMed/NCBI
|
|
31
|
De Wever O, Hendrix A, De Boeck A,
Eertmans F, Westbroek W, Braems G and Bracke ME: Single cell and
spheroid collagen type I invasion assay. Methods Mol Biol.
1070:13–35. 2014. View Article : Google Scholar
|
|
32
|
Varley KE, Gertz J, Bowling KM, Parker SL,
Reddy TE, Pauli-Behn F, Cross MK, Williams BA, Stamatoyannopoulos
JA, Crawford GE, et al: Dynamic DNA methylation across diverse
human cell lines and tissues. Genome Res. 23:555–567. 2013.
View Article : Google Scholar : PubMed/NCBI
|
|
33
|
Drabsch Y and ten Dijke P: TGF-β
signalling and its role in cancer progression and metastasis.
Cancer Metastasis Rev. 31:553–568. 2012. View Article : Google Scholar : PubMed/NCBI
|
|
34
|
Guo L, Kuroda N, Nakayama H, Miyazaki E,
Hayashi Y, Toi M, Hiroi M and Enzan H: Cytokeratin positive
subserosal positive subserosal myofibroblasts in gastroduodenal
ulcer; another type of myofibroblasts. Histol Histopathol.
21:697–704. 2006.PubMed/NCBI
|
|
35
|
Seip K, Fleten KG, Barkovskaya A, Nygaard
V, Haugen MH, Engesæter BØ, Mælandsmo GM and Prasmickaite L:
Fibroblast-induced switching to the mesenchymal-like phenotype and
PI3K/mTOR signaling protects melanoma cells from BRAF inhibitors.
Oncotarget. 7:19997–20015. 2016. View Article : Google Scholar : PubMed/NCBI
|
|
36
|
Johnson DB, Menzies AM, Zimmer L, Eroglu
Z, Ye F, Zhao S, Rizos H, Sucker A, Scolyer RA, Gutzmer R, et al:
Acquired BRAF inhibitor resistance: A multicenter meta-analysis of
the spectrum and frequencies, clinical behaviour, and phenotypic
associations of resistance mechanisms. Eur J Cancer. 51:2792–2799.
2015. View Article : Google Scholar : PubMed/NCBI
|
|
37
|
Llopiz D, Dotor J, Casares N, Bezunartea
J, Díaz-Valdés N, Ruiz M, Aranda F, Berraondo P, Prieto J, Lasarte
JJ, et al: Peptide inhibitors of transforming growth factor-beta
enhance the effi-cacy of antitumor immunotherapy. Int J Cancer.
125:2614–2623. 2009. View Article : Google Scholar : PubMed/NCBI
|
|
38
|
Morris JC, Tan AR, Olencki TE, Shapiro GI,
Dezube BJ, Reiss M, Hsu FJ, Berzofsky JA and Lawrence DP: Phase I
study of GC1008 (fresolimumab): A human anti-transforming growth
factor-beta (TGFβ) monoclonal antibody in patients with advanced
malignant melanoma or renal cell carcinoma. PLoS One. 9:903532014.
View Article : Google Scholar
|
|
39
|
Mifková A, Kodet O, Szabo P, Kučera J,
Dvořánková B, André S, Koripelly G, Gabius HJ, Lehn JM and Smetana
K Jr: Synthetic polyamine BPA-C8 inhibits TGF-β1-mediated
conversion of human dermal fibroblast to myofibroblasts and
establishment of galectin-1-rich extracellular matrix in vitro.
Chembiochem. 15:1465–1470. 2014. View Article : Google Scholar
|
|
40
|
Jobe NP, Rösel D, Dvořánková B, Kodet O,
Lacina L, Mateu R, Smetana K and Brábek J: Simultaneous blocking of
IL-6 and IL-8 is sufficient to fully inhibit CAF-induced human
melanoma cell invasiveness. Histochem Cell Biol. 146:205–217. 2016.
View Article : Google Scholar : PubMed/NCBI
|
|
41
|
Harbst K, Lauss M, Cirenajwis H, Winter C,
Howlin J, Törngren T, Kvist A, Nodin B, Olsson E, Häkkinen J, et
al: Molecular and genetic diversity in the metastatic process of
melanoma. J Pathol. 233:39–50. 2014. View Article : Google Scholar : PubMed/NCBI
|
|
42
|
Patrick E, Schramm SJ, Ormerod JT, Scolyer
RA, Mann GJ, Mueller S and Yang JY: A multi-step classifier
addressing cohort heterogeneity improves performance of prognostic
biomarkers in three cancer types. Oncotarget. 8:2807–2815. 2017.
View Article : Google Scholar :
|
|
43
|
Maley CC, Aktipis A, Graham TA, Sottoriva
A, Boddy AM, Janiszewska M, Silva AS, Gerlinger M, Yuan Y, Pienta
KJ, et al: Classifying the evolutionary and ecological features of
neoplasms. Nat Rev Cancer. 17:605–619. 2017. View Article : Google Scholar : PubMed/NCBI
|