Introduction
Acute alcoholic liver injury refers to a period that
may span several days, or periods of intermittent, repeated
episodes of heavy drinking, which result in a spectrum of clinical
signs and morphological changes, ranging from fatty liver
(steatosis) to more severe forms of chronic liver injury, including
fibrosis, cirrhosis and hepatocellular carcinoma (1–3).
In addition, the increased prevalence of metabolic syndrome, and
the combination of obesity, hypertension, dyslipidemia and
hyperglycemia in a population, may present a risk factor to an
increasing number of individuals with acute alcoholic liver injury
manifestations (4–6). Liver injury and disease from
excessive alcohol consumption have become important contributors to
morbidity and mortality rates worldwide (7,8).
The molecular events involved in acute alcoholic
liver injury are complex, and altered gene expression ultimately
orchestrates the integration of these distinct pathways in order to
promote the response to alcoholic liver injury (9,10).
Previous studies have elucidated mechanisms that may be involved in
the process of acute alcoholic liver injury, however, its molecular
mechanism in terms of gene expression remains to be elucidated.
Gene expression analysis in mouse models may provide important
information on the molecular pathways involved in acute alcoholic
liver injury, and reverse transcription-quantitative polymerase
chain reaction (RT-qPCR) analysis has become the most important
analytical tool for measuring gene expression due to its accuracy,
sensitivity, specificity and reproducibility (11–13). However, the appropriate
application of reverse transcription-quantitative polymerase chain
reaction (RT-qPCR) analysis in comparative gene expression studies
requires a rigorous normalization strategy to explain the technical
variability among samples (14,15). The use of reference genes as
internal controls is the most common method of normalizing gene
expression data (14).
Consequently, it is important to select an appropriate reference
gene for each experimental model. The selection of the reference
gene(s) to use may be meaningful, and previous studies have
demonstrated that a single common reference gene is not likely to
be present and perform well for all tissue types, or under all
physiological, pathological and experimental conditions (16). Furthermore, studies have
demonstrated that the conventional use of a single reference gene
for normalization may lead to relative errors. The use of multiple
reference genes is currently considered to be the most effective
approach for accurate normalization of data (17,18).
The optimization of normalizing methods using
reference genes has attracted increasing attention, leading to the
development of several mathematical algorithms, including geNorm
(19), NormFinder (20) and BestKeeper (21), which were developed to promote the
evaluation of potential reference gene expression stability under
different experimental conditions. Using these methods of
statistical analysis, a number of reference genes have been
selected for evaluation of their expression profiles under specific
conditions (22).
The present study aimed to identify and evaluate the
appropriate reference genes in a mouse model of ethanol-induced
acute alcoholic liver injury. Using this model, the expression
profiles of seven commonly used reference genes, β-actin (Actb),
glyceraldehyde 3-phosphate dehydrogenase (Gadph), glucuronidase β
(Gusb), hypoxanthine phosphoribosyltransferase 1 (Hprt1), 18S
ribosomal RNA (18S), TATA binding protein (Tbp) and β-2
microglobulin (B2m) were subsequently examined. Ethanol directly or
indirectly leads to endoplasmic reticulum (ER) stress, causing
changes in ER stress-associated gene expression (23). The stability of the selected
reference gene was verified by expression analyses of ER
stress-associated genes. It was observed that several genes
commonly used to normalize qPCR data were not suitable for
application as reference genes in acute alcoholic liver injury
mouse models. The application of several mathematical algorithms
under the set experimental conditions revealed that Hprt1 was the
most stable gene, and that Hprt1 and Gapdh were the most
appropriate gene pair to use in mouse models of acute alcoholic
liver injury. The reliability of the selected reference genes was
further confirmed by analyzing the expression of ER
stress-associated genes.
Materials and methods
Chemicals and reagents
TRIzol® reagent was obtained from
Invitrogen; Thermo Fisher Scientific, Inc. (Waltham, MA, USA).
RNase-free DNase was purchased from Promega Corporation (Madison,
WI, USA). A Reverse Transcription System kit was purchased from
Promega Corporation. The Light Cycler 480 SYBR Green® I
kit was obtained from Roche Diagnostics GmbH (Manheim, Germany).
All other reagents were obtained from Sigma-Aldrich; Merck
Millipore (Darmstadt, Germany), or as indicated in the specified
methods.
Animals and treatments
Male Imprinting Control Region (ICR) mice (aged 8–10
weeks and weighing 28–30 g) were purchased from Beijing Vital River
Laboratories Co., Ltd. (Beijing, China), whose foundation colonies
were all introduced from Charles River Laboratories, Inc.
(Yokohama, Japan). The animals were allowed free access to food and
water at all times, and were maintained on a 12/12 h light/dark
cycle with a controlled temperature (20–25°C) and humidity (50±5%)
environment for 1 week prior to use. To identify the optimal
reference gene in mouse models with ethanol-induced acute alcoholic
liver injury, a total of 18 mice were divided into three groups
(n=6 per group). The mice received ethanol (5 g/kg) by intragastric
administration. The control group received saline (5 g/kg) by
intragastric administration. At different time points (6 and 12 h)
following intragastric ethanol administration, the mice were
weighed and sacrificed. All the mice were sacrificed following
fasting for 14 h, and liver and blood samples were collected. Liver
tissue was collected and frozen immediately in liquid nitrogen for
RT-qPCR analysis, or partially fixed in 4% paraformaldehyde for
histological examination.
The present study was approved by the Association of
Laboratory Animal Sciences and the Center for Laboratory Animal
Sciences at Anhui Medical University (Hefei, China; permit no.
20150349). All procedures on animals conformed to the Guidelines
for Humane Treatment set by the Association of Laboratory Animal
Sciences and the Center for Laboratory Animal Sciences at Anhui
Medical University.
Biochemical parameters and hepatic
histology
Plasma was obtained from blood collected into tubes,
after 2–6 h of storage at room temperature before centrifugation
(5,000 × g, 10 min at 4°C). The plasma alanine aminotransferase
level was measured using commercial available kits (Nanjing
Jiancheng Bioengineering Institute, Nanjing, China). Histological
evaluation was performed using hematoxylin and eosin-stained tissue
sections (0.5×0.5 cm) and light microscopy. To quantify the extent
of necrosis, the percentage of necrosis was estimated by measuring
the necrotic area relative to the entire histological section.
Analysis of the region was performed using NIH ImageJ software,
version 1.44 (National Institutes of Health, Bethesda, MD, USA;
http://rsb.info.nih.gov/ij/).
Terminal dUTP nick-end labeling (TUNEL)
assay
For the detection of nuclear DNA strand breaks, the
paraffin-embedded sections were stained with the TUNEL technique
using an in situ apoptosis detection kit (Promega
Corporation), according to the manufacturer's protocol. The
sections were counter-stained with hematoxylin. The TUNEL-positive
cells were counted in 12 randomly selected fields from each slide
at ×200 magnification with a light microscope. The percentage of
TUNEL-positive hepatocytes was analyzed in six liver sections from
the six mice in each group.
Liver tissue collection and RNA
isolation
Total RNA was isolated from the liver tissues of the
saline- and ethanol-treated mice using TRIzol reagent. The liver
samples were homogenized using 1.2 ml TRIzol reagent per 50 mg
liver tissue. DNase I was used to digest and remove genomic DNA
contaminants. The RNA purity was determined by measuring the
absorbance at 260 and 280 nm with a microplate reader (ELX800,
Bio-Tek Instruments, Inc., Winooski, VT, USA). The purity was
verified at OD260/OD280 nm, and the ratios of all samples ranged
between 1.8 and 2.0. The RNA was stored at −80°C until further
analysis.
RT-qPCR analysis
The RNase-free DNase-treated total RNA (1.0
µg) was reverse-transcribed with AMV (Promega Corporation).
In order to improve the reverse transcription, random primers were
used. The reactions were incubated at 37°C for 30 min, 65°C for 10
min and 42°C for 60 min, and then diluted to a concentration of 0.5
µg/µl. All cDNA was stored at −20°C until required
for the qPCR assay. The RT-qPCR analysis was performed with the
Light Cycler 480 SYBR Green I kit using genetic-specific primers
synthesized by Invitrogen; Thermo Fisher Scientific, Inc., as
listed in Table I. The reaction
mixture (20 µl) consisted of 7 µl of 10X buffer, 10
µl of Mix (2X Taq DNA Polymerase, 2X PCR Buffer, 2X dNTP), 2
µl of primer mix (forward and reverse primers) and 1
µl of diluted cDNA. The amplification reactions were
performed on a Light Cycler 480 instrument (Roche Diagnostics
GmbH), with an initial hold step (95°C for 5 min) and 50 cycles of
a three-step PCR (95°C for 15 sec, 60°C for 15 sec and 72°C for 30
sec). For the quantification of primers, a dissociation curve was
drawn at the end of the run.
 | Table IOligonucleotide sequences and sizes
of primers. |
Table I
Oligonucleotide sequences and sizes
of primers.
| Gene | Sequence
(5′–3′) | Size
(bp) |
|---|
| Actb | Forward:
GCTCTTTTCCAGCCTTCCTT | 92 |
| Reverse:
CGGATGTCAACGTCACACTT | |
| Gapdh | Forward:
AGCCTCGTCCCGTAGACAA | 164 |
| Reverse:
AATCTCCACTTTGCCACTGC | |
| Gusb | Forward:
AGCCTTCCTCTGCTCTGAAAC | 117 |
| Reverse:
CTGCATCATATTTGGCGTTG | |
| Hprt1 | Forward:
CAAACTTTGCTTTCCCTGGT | 100 |
| Reverse:
TCTGGCCTGTATCCAACACTTC | |
| 18S | Forward:
TTGACGGAAGGGCACCACCAG | 130 |
| Reverse:
GCACCACCACCCACGGAATCG | |
| Tbp | Forward:
GAAGAACAATCCAGACTAGCAGCA | 129 |
| Reverse:
CCTTATAGGGAACTTCACATCACAG | |
| B2m | Forward:
ATTCACCCCCACTGAGACTG | 193 |
| Reverse:
TGCTATTTCTTTCTGCGTGC | |
Statistical analysis
Seven candidate reference genes (Actb, Gapdh, Gusb,
Hprt1, 18S, Tbp and B2m) were analyzed. The quantification cycle
(Cq) values were transformed into Raw Quantity (RQ) values via the
ΔCq method [RQ=2−(ΔCq)], ΔCq represents each
corresponding Cq value - minimum Cq value (24). Two separate sets of independent
samples from the control and treated mice were compared using an
unpaired one-tailed t-test. Multiple-group comparisons were
analyzed using one-way analysis of variance, followed by the
Student-Newman-Keuls test. In all samples, P<0.05 was considered
to indicate a statistically significant difference. The data are
expressed as the mean ± standard deviation. In order to calculate
the expression stability of the candidate reference genes, three
validation mathematical algorithms were used, including BestKeeper
(http://gene-quantification.com/bestkeeper.html), which
identifies the appropriate reference gene by paired correlation
analysis of all pairs of candidate genes; geNorm (https://genorm.cmgg.be/), which calculates a gene
normalization factor based on a pairwise comparison analysis,
without considering the experimental conditions; and NormFinder
(http://www.mdl.dk/publicationsnormfinder.htm), which
is based on a model selection method that enables estimation not
only of the overall variation of the candidate normalization genes,
but also of the variation between sample subgroups (20). The obtained RQ data were further
analyzed with geNorm and NormFinder. BestKeeper analysis was based
on the untransformed Cq values. For the rank of all candidate
reference genes, the stability values from these three statistical
algorithms were analyzed. The comparative Cq-method was used to
determine the level of a target gene, normalized to a reference
gene and relative to a calibrator (2−∆∆Cq) using
Lightcycler 480 software (Roche Diagnostics GmbH; version 1.5.0)
(25,26).
Results
Ethanol treatment induces acute liver
injury and hepatocyte necrosis
The characteristics of the mice administered with
saline or 5 g/kg ethanol intragastrically are listed in Table II. There was no statistically
significant difference in mouse weights between the two groups.
However, the ethanol-treated mice exhibited significantly elevated
liver weights compared with those in the control group (P<0.05).
In the ethanol group, the mice in the 12 h group exhibited a
significant increase in hepatosomatic index (liver weight/body
weight), compared with those in the 6 h group (P<0.05), whereas
no significant difference in liver weight was found. The alanine
aminotransferase activity was increased in the ethanol-treated
group at different time points, and the activity in the ethanol 12
h group was significantly increased compared with that in the
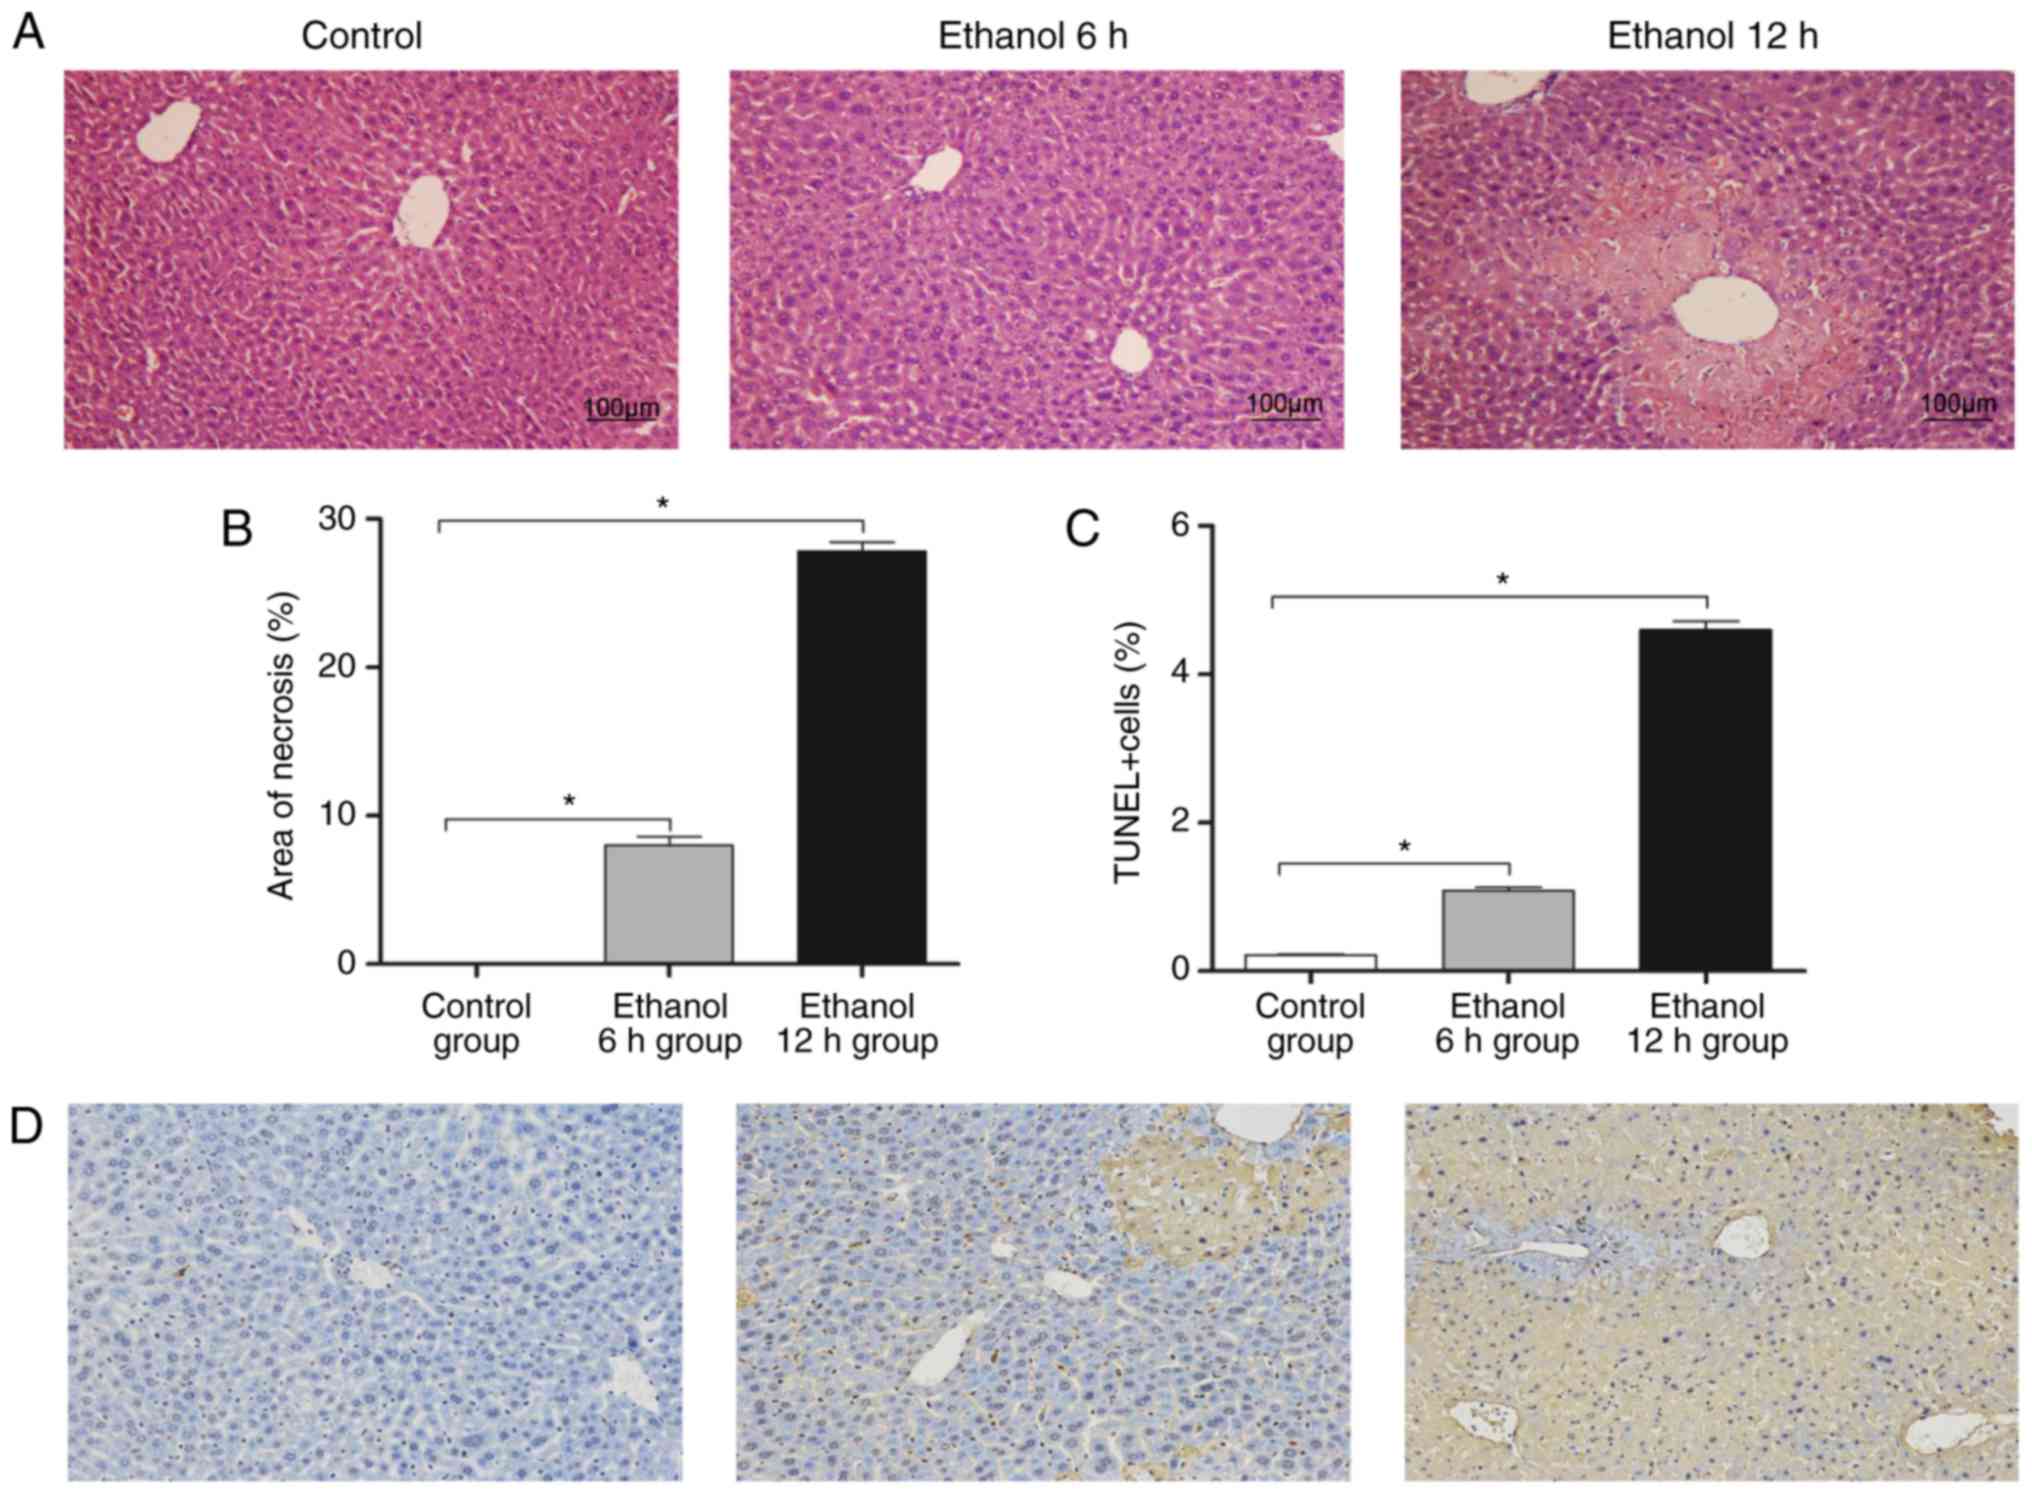
control group (P<0.05). Microscopic examination of the livers
was performed to verify the damage caused by ethanol and to
describe its typical histopathological characteristics.
Characteristic hepatocyte necrosis was observed in the liver
sections from the mice treated with ethanol (Fig. 1A). The area of necrosis was ~28%
at 12 h post-ethanol administration (Fig. 1B). Ethanol-induced hepatocyte
death was determined using a TUNEL assay, and numerous
TUNEL-positive cells were observed in the livers of the
ethanol-treated mice (Fig. 1C and
D). The ethanol 6 h group exhibited mild inflammatory
infiltration and mild liver cell degeneration, whereas the tissue
in the 12 h ethanol group exhibited severe infiltration and
hepatocyte necrosis.
| Table IICharacteristics of mice administered
with saline or ethanol (5 g/kg intragastrically). |
Table II
Characteristics of mice administered
with saline or ethanol (5 g/kg intragastrically).
| Parameter | Group
|
|---|
| Control | Ethanol 6 h | Ethanol 12 h |
|---|
| Weight (g) | 38.051±1.481 | 39.183±1.682 | 37.156±2.234 |
| Liver weight
(g) | 1.590±0.081 | 1.714±0.072a | 1.763±0.181a |
| Hepatosomatic
indexc | 0.042±0.002 | 0.044±0.001a | 0.047±0.003a,b |
| ALT (U/l) | 37.021±4.342 | 88.431±58.501 |
184.046±55.663a |
RT-qPCR data analysis
Following data normalization, the Cq value was
calculated for all PCR reactions. The Cq values for these seven
reference genes were calculated for all mouse livers sampled. The
median Cq values of the seven reference genes ranged between 11.2
cycles for 18S and 26.6 cycles for Tbp (Fig. 2A–G). Tbp and Gusb had the lowest
expression levels, with median Cq values of 24–26 cycles. By
contrast, 18S and B2m had high expression levels with median Cq
values ranging between 11 and 18 cycles. Actb, Gapdh and Hprt1
distributed intermediate expression levels with median Cq values
between 20 and 23 cycles. Among the seven genes, Actb had the
maximum range of expression at 3.2 cycles (19.6–22.8 cycles),
whereas the minimum range of Gapdh was 1.3 cycles., The range of Cq
values within each gene are shown in Fig. 2A–G. The extended vertical bars
show standard the minimum and maximum values deviation of the mean
in each gene. To an extent, it reflects the expression stability of
each reference gene in the different groups.
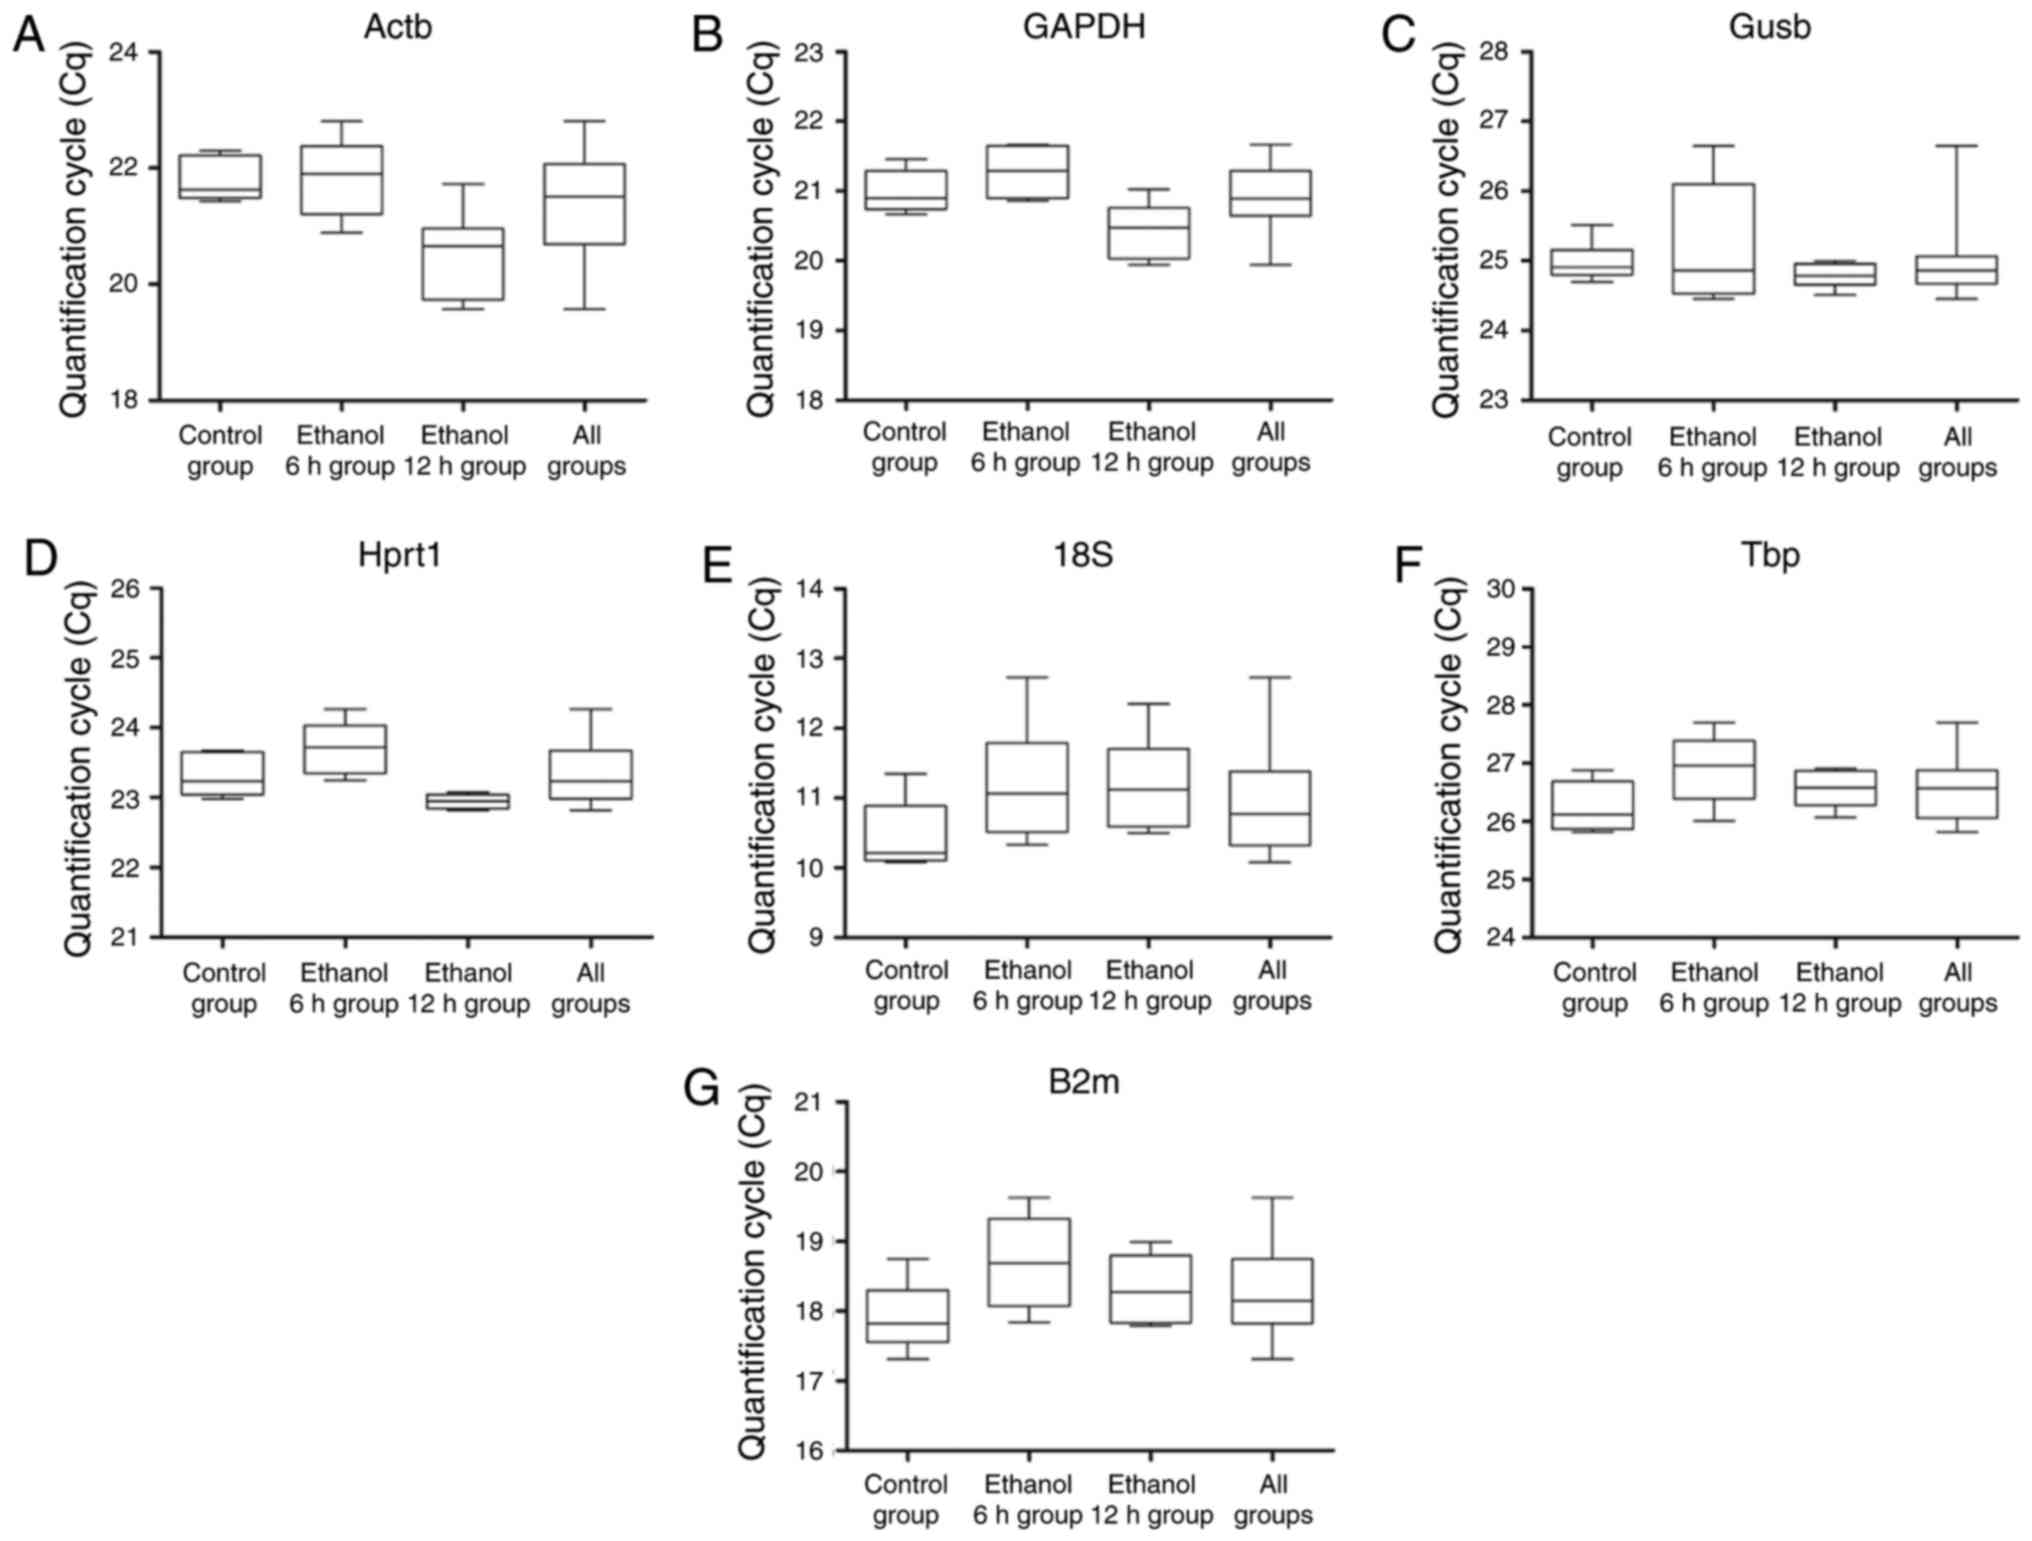 | Figure 2Reverse transcription-quantitative
polymerase chain reaction Cq values of each candidate reference
gene in four groups. The boxes indicate the range of Cq values
within each gene. The central box represents the interquartile
interval, the central lines indicate the median, and the extended
vertical bars show the minimum and maximum standard deviation of
the mean values for (A) Actb, (B) Gapdh, (C) Gusb, (D) Hprt1, (E)
18S, (F) Tbp and (G) B2m genes combined. Cq, quantification cycle;
Actb, β-actin; Gapdh, glyceraldehyde 3-phosphate dehydrogenase;
Gusb, glucuronidase β, Hprt1, hypoxanthine
phosphoribosyltransferase 1; 18S, 18S ribosomal RNA; Tbp, TATA
binding protein; B2m, β-2 microglobulin. |
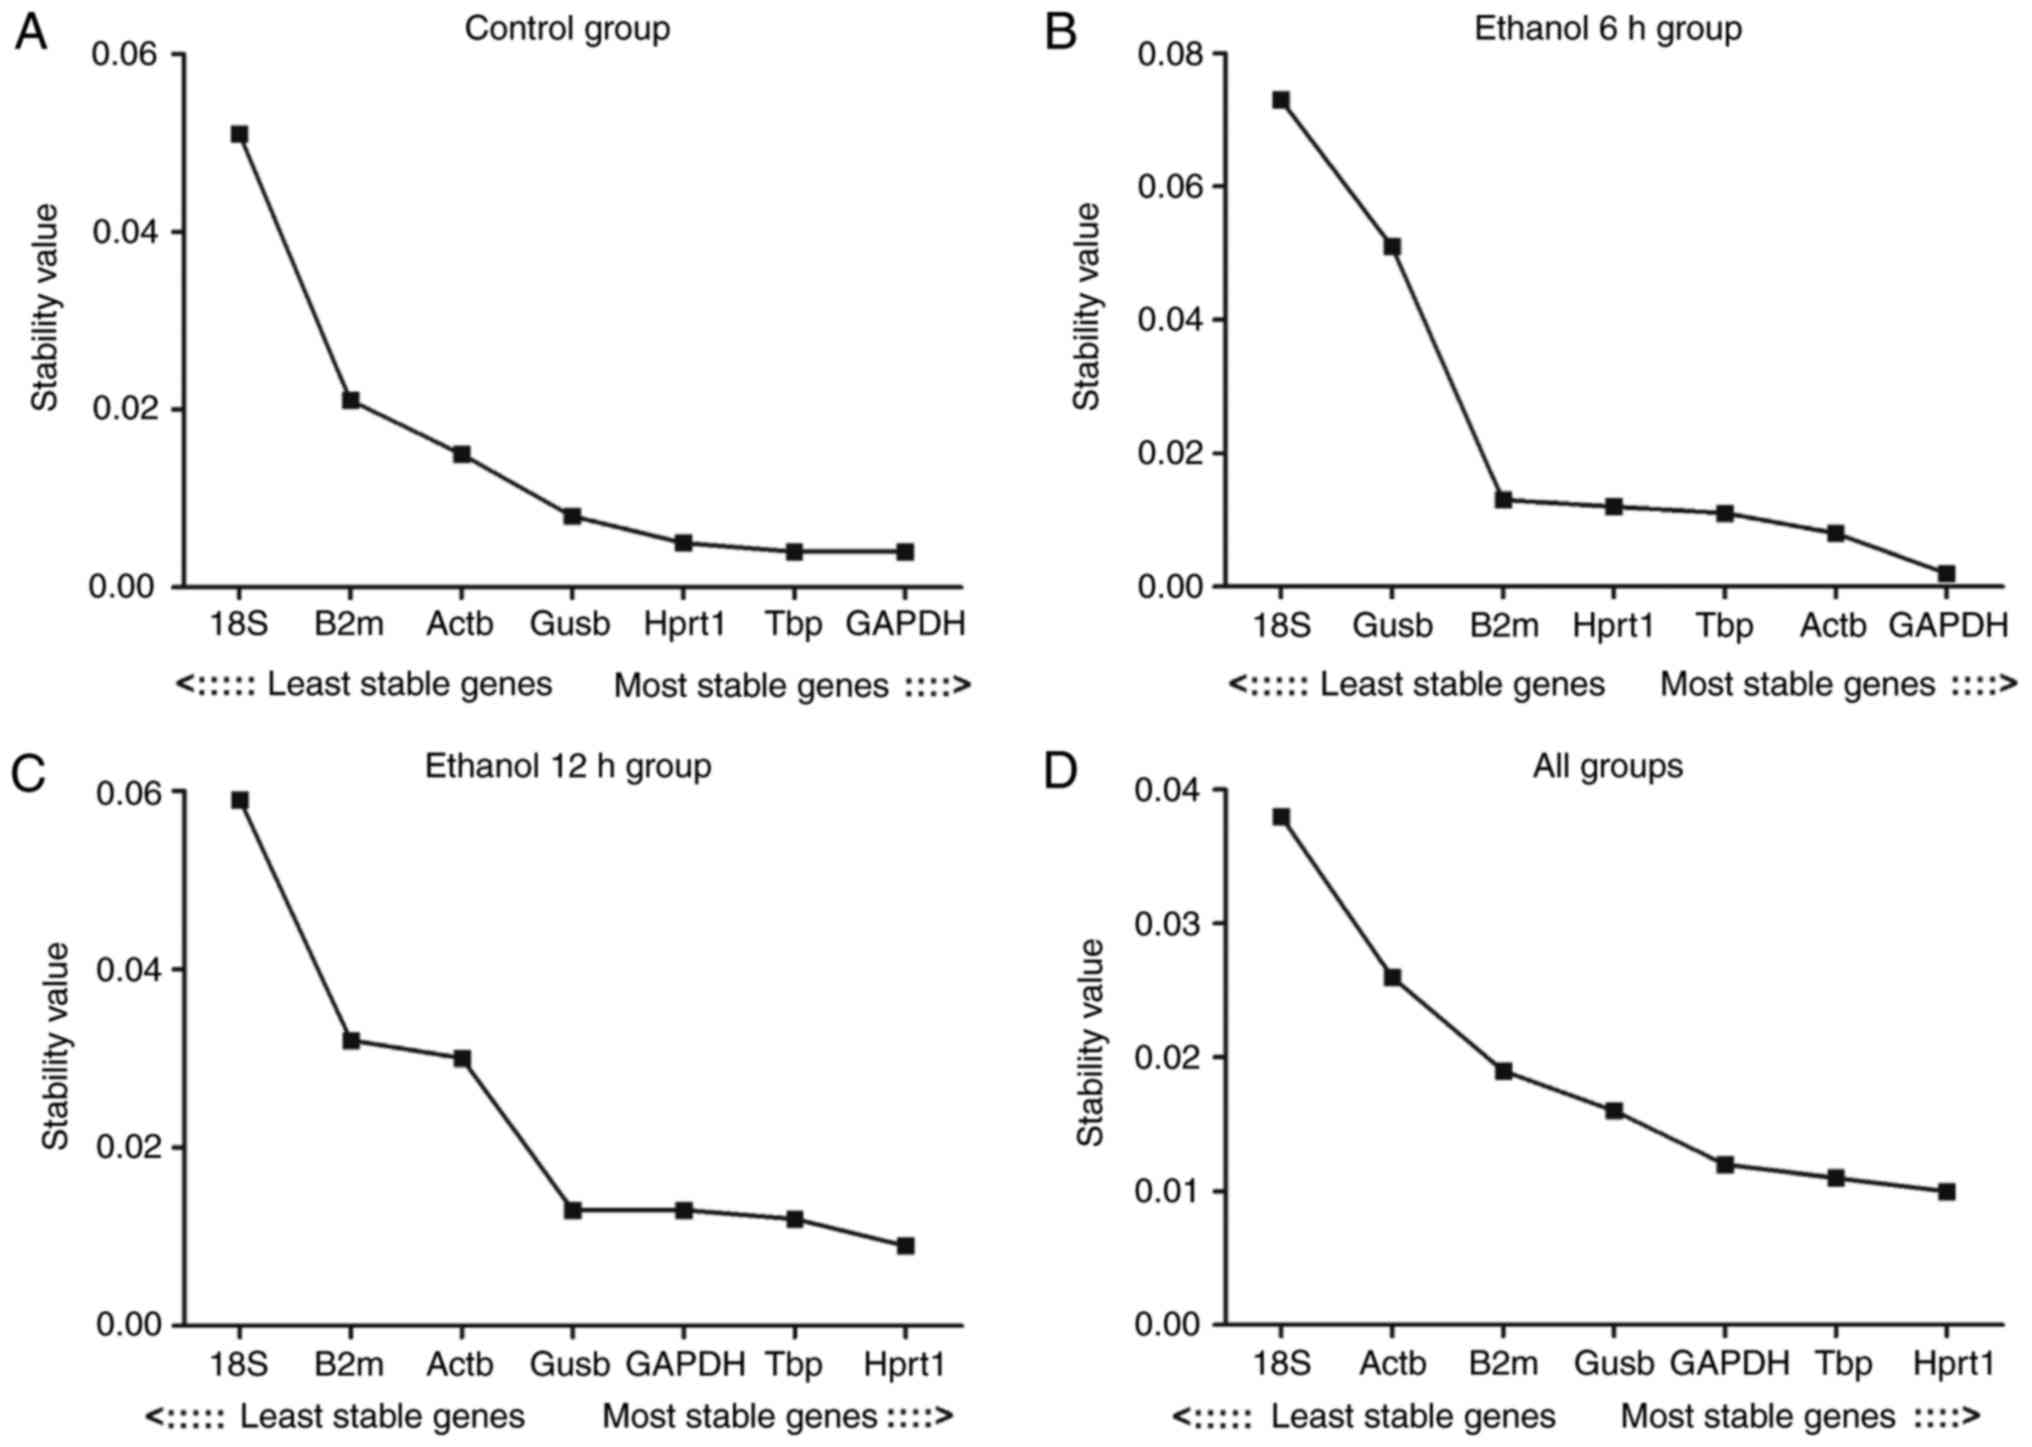
Evaluation of the expression stability of
the reference genes: geNorm analysis results
The present study first assessed the stability of
expression for seven reference genes in the control, ethanol 6 h,
ethanol 12 h and all groups (Table
III). The expression stability of the reference genes was
analyzed using geNorm software. When all groups were analyzed, the
genes examined exhibited expression stability measures (M values)
between 0.11 (Hprt1) and 0.68 (Gusb). Hprt1 and Gapdh had the
lowest M values, representing the most stable reference genes/gene
pair in the liver in all samples. Reference gene stability analysis
revealed that the gene with the lowest variability in all groups
was Hprt1; 18S had the highest M value in the other three groups,
with the exception of the assessment of ʻall groupsʼ. The result
revealed that the least stable gene was 18S. The expression
stability of the seven reference genes is shown in Fig. 3A–D
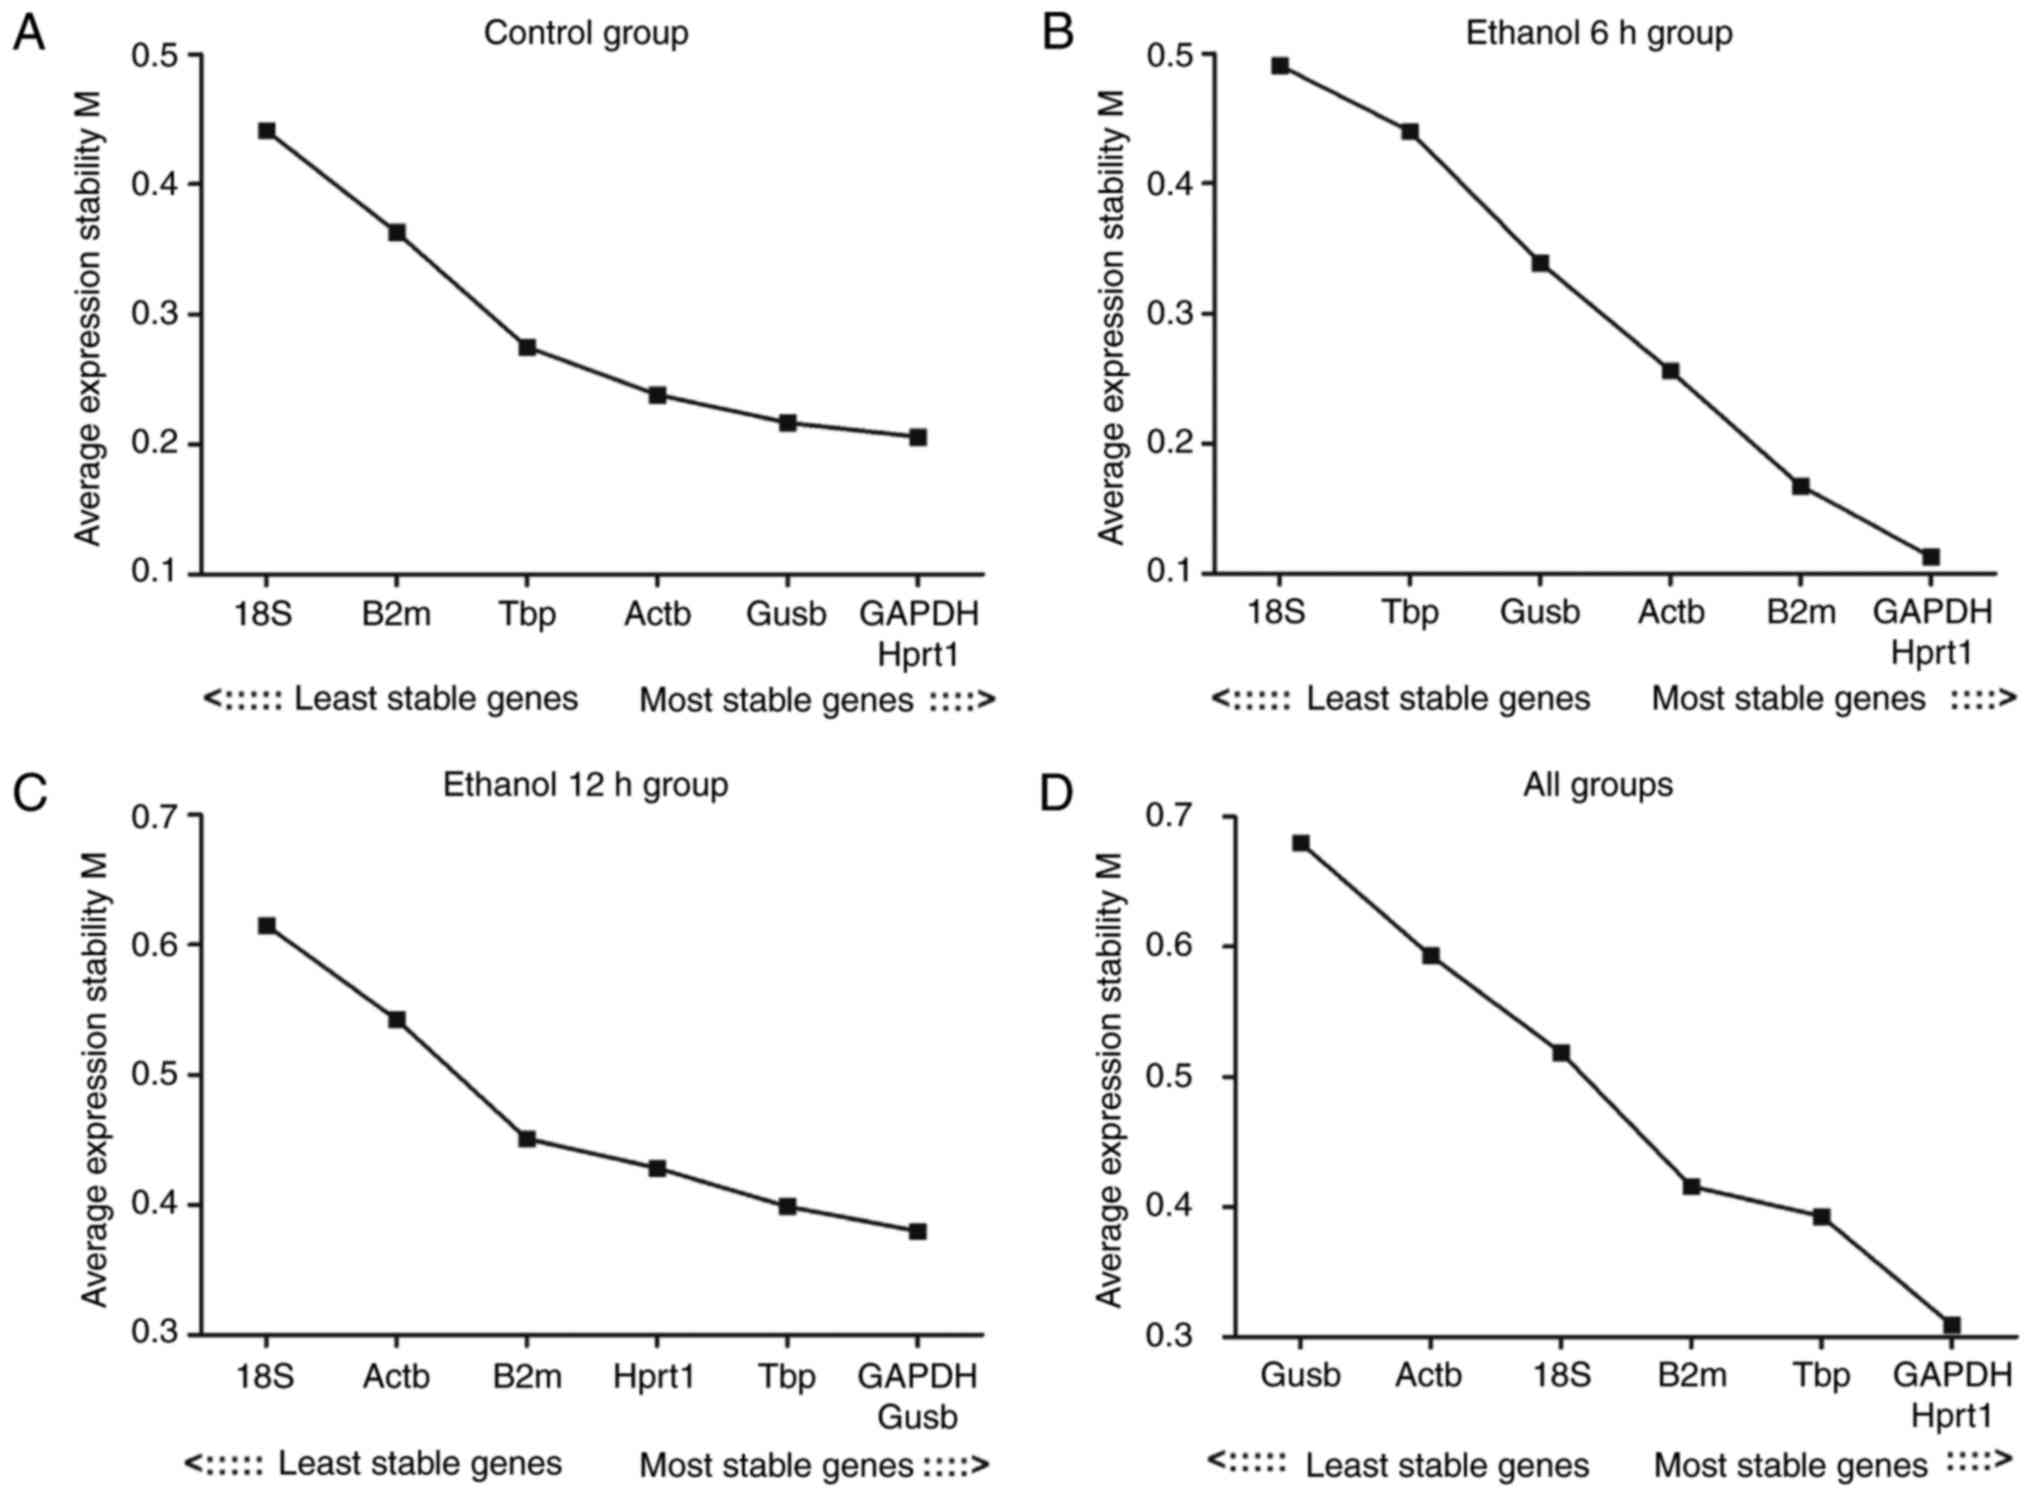 | Figure 3M value analysis of the seven
reference genes calculated by geNorm. (A) Control group; (B)
ethanol 6 h group; (C) ethanol 12 h group; (D) all groups. The
least stable genes have high mean expression stability values (M);
starting from the left, genes are ranked according to increasing
expression stability, ending with the most stable genes on the
right, with lower M values indicating more stable expression. M,
expression stability; Actb, β-actin; Gapdh, glyceraldehyde
3-phosphate dehydrogenase; Gusb, glucuronidase β; Hprt1,
hypoxanthine phosphoribosyltransferase 1; 18S, 18S ribosomal RNA;
Tbp, TATA binding protein; B2m, β-2 microglobulin. |
| Table IIIComparisons of ranking results from
the geNorm, NormFinder and BestKeeper analyses. |
Table III
Comparisons of ranking results from
the geNorm, NormFinder and BestKeeper analyses.
| Rank | All groups
| Control group
| Ethanol 6 h group
| Ethanol 12 h group
|
|---|
| geNorm | Norm-Finder | Best-Keeper | geNorm | Norm-Finder | Best-Keeper | geNorm | Norm-Finder | Best-Keeper | geNorm | Norm-Finder | Best-Keeper |
|---|
| 1 | Hprt1a | Hprt1 | Hprt1 | Hprt1a | Gapdh | Gapdh | Hprt1a | Gapdh | B2m | Gapdha | Hprt1 | Gapdh |
| 2 | Gapdha | Tbp | Gapdh | Gapdha | Tbp | Hprt1 | Gapdha | Actb | Actb | Gusba | Tbp | Actb |
| 3 | Tbp | Gapdh | Tbp | Gusb | Hprt1 | Tbp | B2m | Tbp | Gapdh | Tbp | Gapdh | Hprt1 |
| 4 | B2m | Gusb | B2m | Actb | Gusb | B2m | Actb | Hprt1 | Tbp | Hprt1 | Gusb | 18S |
| 5 | 18S | B2m | Actb | Tbp | Actb | Gusb | Gusb | B2m | Hprt1 | B2m | Actb | Tbp |
| 6 | Actb | Actb | 18S | B2m | B2m | Actb | Tbp | Gusb | 18S | Actb | B2m | Gusb |
| 7 | Gusb | 18S | Gusb | 18S | 18S | 18S | 18S | 18S | Gusb | 18S | 18S | B2m |
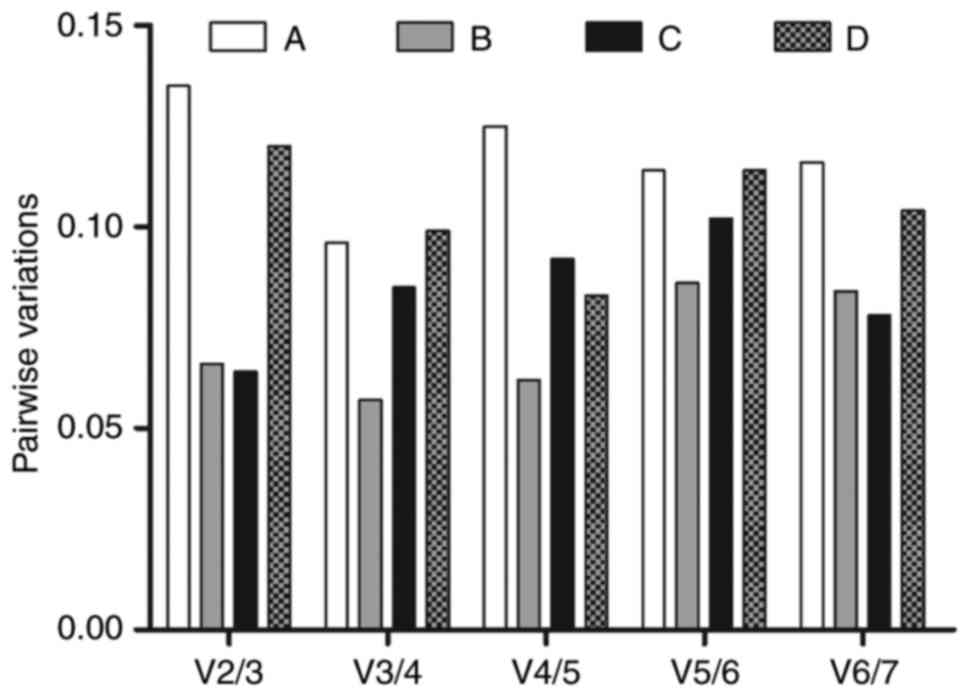
As shown in Fig.
4, the pairwise variations V2/3, V3/4, V4/5, V5/6 and V6/7 were
all lower than the limited value of 0.15, which indicated that the
combination of the two reference genes with the lowest M values in
the experiments was sufficient for normalization. As all pairwise
variations were <0.15, the above-mentioned observations remain
valid, whether the data were analyzed for each experimental group,
or in a single set grouping all data.
NormFinder analysis results
NormFinder also analyzed the stability values of the
seven candidate reference genes. NormFinder is an Excel-based
mathematical tool, which analyzes each sample set separately and
also estimates inter-group variations in expression across
different sample sets. NormFinder ranks the control genes on the
basis of their stability value, where the lower stability value
represents higher gene expression stability and vice versa. In the
'all groups' group and in the ethanol 12 h group, Hprt1 was
identified as the most stable reference gene (Fig. 5 and Table III).
BestKeeper analysis results
Hprt1 was considered to be the top-ranked stable
reference gene in all groups, whereas B2m and Gapdh were identified
as the most stable internal reference genes in the control group,
and in the ethanol 6 h and ethanol 12 h groups, respectively
(Table III).
Differential gene expression associated
with ER stress based on the selection of different reference
genes
Ethanol can directly or indirectly lead to the
occurrence of ER stress, and it may change the expression levels of
glucose-regulated protein (GRP)78 and of other genes (27,28). It has been reported that the ER
chaperone gene ER DNA J domain-containing protein 4 (ERdj4) is
upregulated by ER stress (29).
Protein disulfide isomerase (PDI) is a resident enzymatic chaperone
and its expression is upregulated in ER stress (30). To demonstrate the importance of
selecting appropriate reference genes as calibrators in ethanol
treatment paradigms, ER stress-associated gene expression was
normalized in the present study, with the most stable gene Hprt1
and the least stable gene 18S as the reference genes analyzed by
the three mathematical algorithms, geNorm, NormFinder and
BestKeeper. The ER stress-associated genes included GRP78, C/EBP
homologous protein (CHOP), GRP94, spliced X-box binding protein 1
(XBP1s) total XBP1 (XBP1t), ERdj4 and PDI. Using Hprt1 as the
reference gene, the mRNA levels of GRP78, CHOP and PDI were
significantly increased in the livers of the ethanol 12 h group,
compared with those in the control group, and the difference was
statistically significant (P<0.05; Fig. 6). The relative expression levels
of the remaining genes, ERdj4, GRP94 and XBP1t, exhibited a
gradually increasing trend in the control to the ethanol groups.
Using 18S as the reference gene, no statistically significant
differences in gene expression were found between the ethanol and
control groups. These results suggested that Hprt1 offers an
advantage as a reference gene in mouse models of acute alcoholic
liver injury.
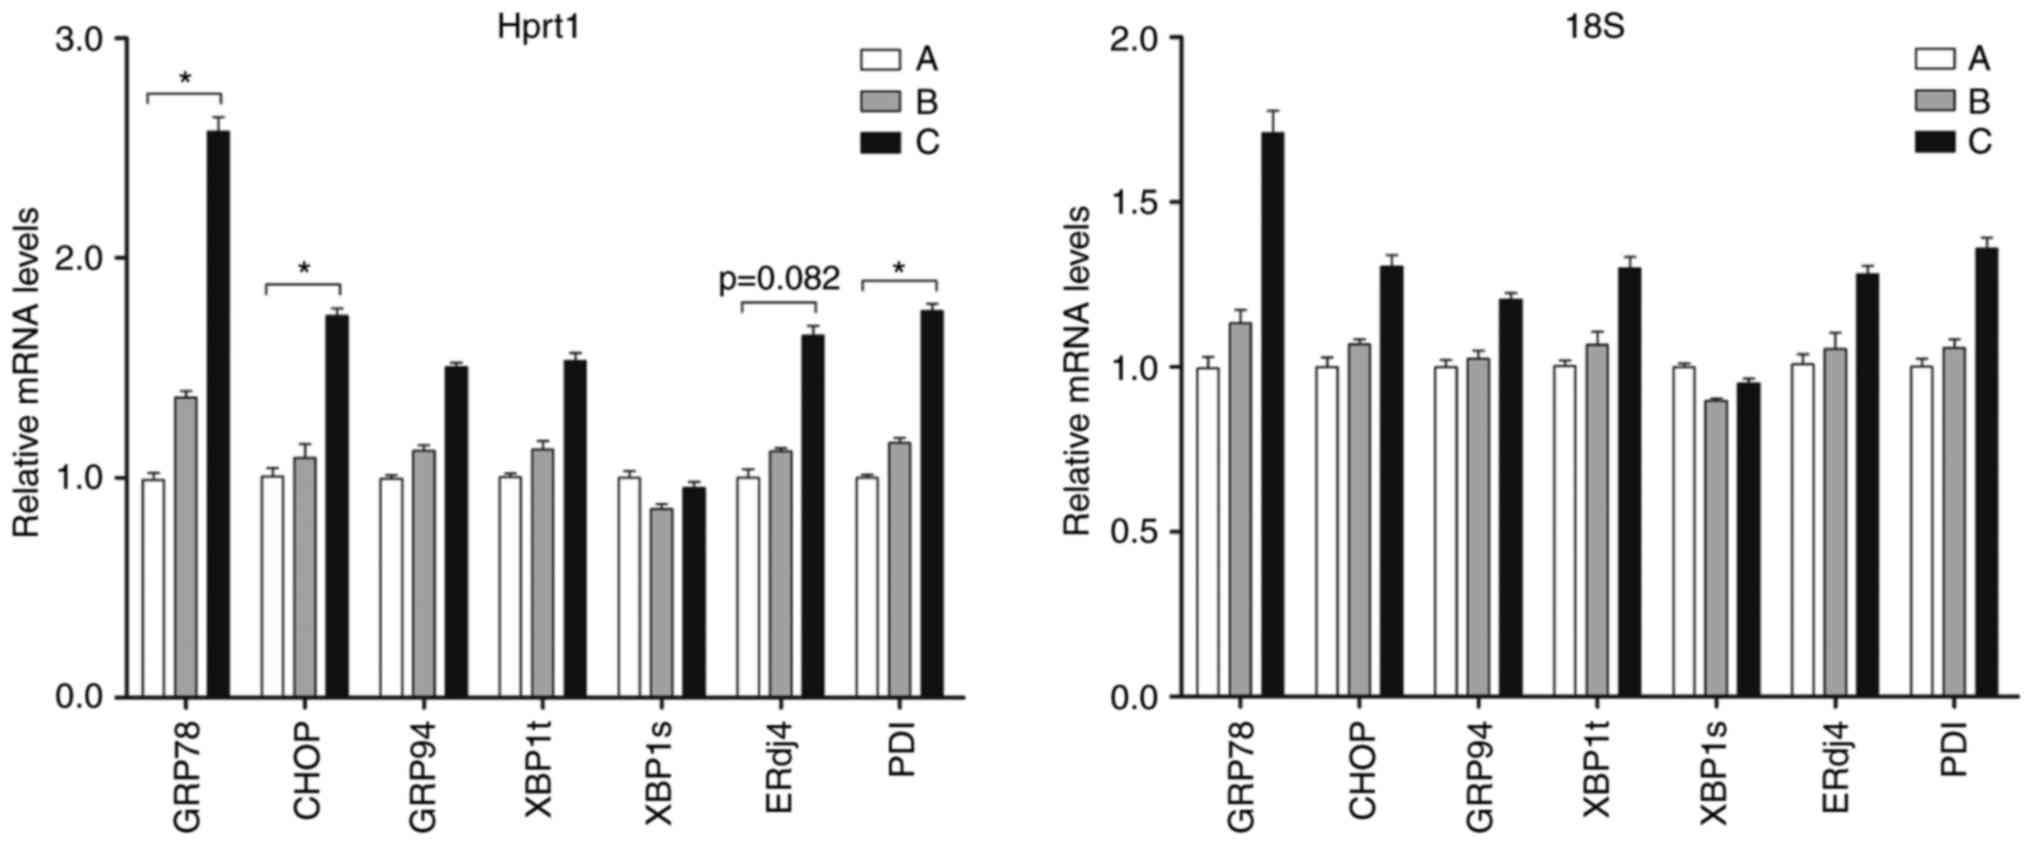 | Figure 6Levels of different ER
stress-associated genes. Hprt1 and 18S were used as reference genes
for reverse transcription-quantitative polymerase chain reaction
analysis. (A) Control group; (B) ethanol 6 h group; (C) ethanol 12
h group. All data are expressed as the mean ± standard deviation
(n=6). *P<0.05, compared with the control. ER,
endoplasmic reticulum; Hprt1, hypoxanthine
phosphoribosyltransferase 1; 18S, 18S ribosomal RNA; GRP78,
glucose-regulated protein 78; CHOP, C/EBP homologous protein;
GRP94, glucose-regulated protein 94; XBP1a, spliced X-box binding
protein 1; XBP1t, total XBP1; ERdj4, ER DNA J domain-containing
protein 4; PDI, protein disulfide isomerase |
Discussion
With regards to endogenously expressed reference
genes, the appropriate selection of an individual or of a pair of
reference genes is crucial for the quantification of gene
expression under specific conditions. Similarly, the establishment
of well-characterized animal models is also crucial to fully
understand the condition represented by the model. RT-qPCR analysis
of gene expression is the most common method for examining relevant
changes in gene regulation, and provides rapid and consistent
results. The use of reference genes is generally considered to be
the most reliable method of normalizing qPCR data and reducing
possible errors in the quantification of gene expression (31); however, their utility requires
experimental validation for particular experimental designs
(32). The consistent expression
of the reference gene is crucial to ensure correct analysis of the
experimental results. The inadequate selection of reference genes
may lead to an erroneous analysis and interpretation of relative
expression, particularly when there are marginal variations in
transcription levels between different individuals, sample groups
and experimental conditions (33,34). Therefore, one of the key points in
validation is to select appropriate reference genes for data
normalization in gene expression analyses. In the present study,
seven reference genes were examined, which were selected due to
their common use in previously published reports on the liver and
other type of tissues. ER stress-associated gene expression
measurements can be demonstrably affected by the selection of
reference genes. Therefore, it is necessary to select appropriate
reference genes for the quantitation of genes via qPCR in acute
alcoholic liver injury.
The commonly used programs, geNorm, NormFinder and
BestKeeper, estimated the most stable reference genes. The ranking
of the reference genes examined by the three programs varied
marginally (Table III),
however, this was not unexpected as the different programs rely on
distinct mathematical approaches and analytical principles
(35). The geNorm algorithm
calculates an average expression stability M value for each gene
from a set of reference genes used in the analysis. NormFinder
identifies stable expression genes in a set of candidate
normalization genes based on a mathematical model that can estimate
the intra- and inter-group variations of the sample set. BestKeeper
is an Excel-based tool to assist in selecting the optimal reference
genes following calculation of variables. The results in the
present study were based on these three mathematical algorithms,
which confirmed that Hprt1 was the reference gene with the most
stable expression level among the seven candidate genes, regardless
of the different mouse models. In addition, 18S was identified as
the least stable reference gene. However, several experiments using
qPCR analysis have selected other reference genes, for example 18S
and Actb, even when it has been reported that these common
reference genes are not stably expressed under variable
experimental conditions (36,37). It has been previously reported
that 18S as a reference gene shows the least expression stability
(38,39).
Hprt1 is a common reference gene for normalizing
relative expression values in qPCR analysis (40,41). Gapdh is also reliable as a
reference gene for quantitative gene expression analysis under
experimental conditions (42).
Although there is a possibility that there are more appropriate
reference genes other than those analyzed in the present study, the
results confirmed that Hprt1 and Gapdh exhibited reliable and
stable gene expression, compared with other more commonly used
reference genes, including 18S and Actb (Figs. 3 and 5; Table
III).
Following estimation of the M value, geNorm
calculates the minimum number of genes necessary for an appropriate
normalization. NormFinder, provides the optimal reference gene
pairs for normalization and suggests that multiple reference genes
only be used when a single stable gene cannot be selected (43). Therefore, Hprt1, a reference gene
selected by NormFinder and geNorm, may be used as a suitable
reference gene in mouse models of acute alcoholic liver injury.
Ethanol induces ER stress, causing changes in the
expression levels of ER stress-associated genes. The stability of
the selected reference genes was verified by expression analysis of
ER stress-associated genes. Using the most stable reference gene,
Hprt1, and the least stable gene, 18S, each identified by the three
statistical algorithms, the results demonstrated that, compared
with the control group and using Hprt1 as the reference gene, ER
stress-associated gene expression was upregulated in the ethanol
groups with a statistically significant difference; whereas the use
of 18S as the reference gene revealed no statistically significant
difference between the ethanol and control groups (Fig. 6). These results suggested that
Hprt1 is a suitable reference gene in mouse models of acute
alcoholic liver injury. Therefore, selecting a commonly used
reference gene without first evaluating its stability may result in
incorrect normalization and altered quantification of target gene
expression, affecting the interpretation of the results.
In conclusion, the suitable selection of reference
genes is a crucial step in the characterization of any animal
model. Seven commonly used reference genes were examined in the
present study to identify their stability in the livers of mice
with acute alcoholic liver injury. The reliability of the selected
reference genes was further verified by expression analysis of ER
stress-associated genes. The results of the present study
demonstrated that the advantages of Hprt1 in normalizing target
gene expression make it a feasible method for the accurate
quantification of gene expression associated with acute alcoholic
liver injury. These findings may assist in subsequent
investigations of gene expression using this mouse model. However,
only the expression stabilities of select reference genes in ICR
mice with acute alcoholic liver injury were evaluated in the
present study. Whether the selected reference genes are also
suitable for other commonly used mouse strains, for example
C57BL/6, remains to be elucidated. In order to optimize the gene
expression analysis in this mouse model, the stability of the
reference gene in other mouse strains requires assessment in
subsequent investigations to further elucidate the molecular
mechanisms involved in mouse models of acute alcoholic liver
injury.
Acknowledgments
Not applicable.
Notes
[1]
Funding
This study was supported by the National Science
Foundation of China (grant nos. 81270498 and 81400643) and the 2016
Annual Leading Talent Introduction and Cultivation Project in
Universities (grant no. gxbjZD2016032).
[2] Availability
of data and materials
The analyzed data sets generated during the study
are available from the corresponding author on reasonable
request.
[3] Authors'
contributions
All authors have read and approved the contents of
this manuscript for publication. XL provided experimental animal
models. JW analyzed and interpreted the mouse models data. SW
performed the histological examination of the liver and was a major
contributor in writing the manuscript.
[4] Ethics
approval and consent to participate
The study was approved by the Association of
Laboratory Animal Sciences and the Center for Laboratory Animal
Sciences at Anhui Medical University (permit no. 20150349). All
procedures on animals conformed to the Guidelines for Humane
Treatment set by the Association of Laboratory Animal Sciences and
the Center for Laboratory Animal Sciences at Anhui Medical
University.
[5] Consent for
publication
Not applicable.
[6] Competing
interests
No conflict of interest exists in the submission of
this manuscript.
References
|
1
|
Massey VL and Arteel GE: Acute
alcohol-induced liver injury. Front Physiol. 3:1932012. View Article : Google Scholar : PubMed/NCBI
|
|
2
|
Gonçalves JL, Lacerda-Queiroz N, Sabino
JFL, Marques PE, Galvão I, Gamba CO, Cassali GD, de Carvalho LM, da
Silva E, Silva DA, Versiani A, et al: Evaluating the effects of
refined carbohydrate and fat diets with acute ethanol consumption
using a mouse model of alcoholic liver injury. J Nutr Biochem.
39:93–100. 2016. View Article : Google Scholar : PubMed/NCBI
|
|
3
|
Sugimoto K and Takei Y: Pathogenesis of
alcoholic liver disease. Hepatol Res. 47:70–79. 2017. View Article : Google Scholar
|
|
4
|
Chang B, Xu MJ, Zhou Z, Cai Y, Li M, Wang
W, Feng D, Bertola A, Wang H, Kunos G and Gao B: Short- or
long-term high-fat diet feeding plus acute ethanol binge
synergistically induce acute liver injury in mice: An important
role for CXCL1. Hepatology. 62:1070–1085. 2015. View Article : Google Scholar : PubMed/NCBI
|
|
5
|
Song BJ, Abdelmegeed MA, Henderson LE, Yoo
SH, Wan J, Purohit V, Hardwick JP and Moon KH: Increased
nitroxidative stress promotes mitochondrial dysfunction in
alcoholic and nonalcoholic fatty liver disease. Oxid Med Cell
Longev. 2013:7810502013. View Article : Google Scholar : PubMed/NCBI
|
|
6
|
Fujita N and Takei Y: Alcohol consumption
and metabolic syndrome. Hepatol Res. 41:287–295. 2011. View Article : Google Scholar : PubMed/NCBI
|
|
7
|
Zhang JJ, Meng X, Li Y, Zhou Y, Xu DP, Li
S and Li HB: Effects of melatonin on liver injuries and diseases.
Int J Mol Sci. 18:E6732017. View Article : Google Scholar : PubMed/NCBI
|
|
8
|
Chacko KR and Reinus J: Spectrum of
alcoholic liver disease. Clin Liver Dis. 20:419–427. 2016.
View Article : Google Scholar : PubMed/NCBI
|
|
9
|
Tsuchiya M, Ji C, Kosyk O, Shymonyak S,
Melnyk S, Kono H, Tryndyak V, Muskhelishvili L, Pogribny IP,
Kaplowitz N and Rusyn I: Interstrain differences in liver injury
and one-carbon metabolism in alcohol-fed mice. Hepatology.
56:130–139. 2012. View Article : Google Scholar : PubMed/NCBI
|
|
10
|
Halsted CH: B-Vitamin dependent methionine
metabolism and alcoholic liver disease. Clin Chem Lab Med.
51:457–465. 2013. View Article : Google Scholar
|
|
11
|
Nolan T, Hands RE and Bustin SA:
Quantification of mRNA using real-time RT-PCR. Nat Protoc.
1:1559–1582. 2006. View Article : Google Scholar
|
|
12
|
Derveaux S, Vandesompele J and Hellemans
J: How to do successful gene expression analysis using real-time
PCR. Methods. 50:227–230. 2010. View Article : Google Scholar
|
|
13
|
Ballester M, Cordon R and Folch JM: DAG
expression: High-throughput gene expression analysis of real-time
PCR data using standard curves for relative quantification. PloS
One. 8:e803852013. View Article : Google Scholar : PubMed/NCBI
|
|
14
|
Lardizabal MN, Nocito AL, Daniele SM,
Ornella LA, Palatnik JF and Veggi LM: Reference genes for real-time
PCR quantification of microRNAs and messenger RNAs in rat models of
hepatotoxicity. PLoS One. 7:e363232012. View Article : Google Scholar : PubMed/NCBI
|
|
15
|
Hernández AH, Curi R and Salazar LA:
Selection of reference genes for expression analyses in liver of
rats with impaired glucose metabolism. Int J Clin Exp Pathol.
8:3946–3954. 2015.PubMed/NCBI
|
|
16
|
Xu XY, Shen YB, Fu JJ, Lu LQ and Li JL:
Determination of reference microRNAs for relative quantification in
grass carp (Ctenopharyngodon idella). Fish Shellfish Immunol.
36:374–382. 2014. View Article : Google Scholar
|
|
17
|
Matouskova P, Bartikova H, Bousova I,
Hanusova V, Szotakova B and Skalova L: Reference genes for
real-time PCR quantification of messenger RNAs and microRNAs in
mouse model of obesity. PLoS One. 9:e860332014. View Article : Google Scholar : PubMed/NCBI
|
|
18
|
Castonguay Y, Michaud J and Dubé MP:
Reference genes for RT-qPCR analysis of environmentally and
developmentally regulated gene expression in alfalfa. Am J Plant
Sci. 6:132–143. 2015. View Article : Google Scholar
|
|
19
|
Vandesompele J, De Preter K, Pattyn F,
Poppe B, Van Roy N, De Paepe A and Speleman F: Accurate
normalization of real-time quantitative RT-PCR data by geometric
averaging of multiple internal control genes. Genome Biol.
3:RESEARCH00342002. View Article : Google Scholar : PubMed/NCBI
|
|
20
|
Andersen CL, Jensen JL and Ørntoft TF:
Normalization of real-time quantitative reverse transcription-pcr
data: A model-based variance estimation approach to identify genes
suited for normalization, applied to bladder and colon cancer data
sets. Cancer Res. 64:5245–5250. 2004. View Article : Google Scholar : PubMed/NCBI
|
|
21
|
Pfaffl MW, Tichopad A, Prgomet C and
Neuvians TP: Determination of stable housekeeping genes,
differentially regulated target genes and sample integrity:
BestKeeper-Excel-based tool using pair-wise correlations.
Biotechnol Lett. 26:509–515. 2004. View Article : Google Scholar : PubMed/NCBI
|
|
22
|
Tatsumi K, Ohashi K, Taminishi S, Okano T,
Yoshioka A and Shima M: Reference gene selection for real-time
RT-PCR in regenerating mouse livers. Biochem Biophys Res Commun.
374:106–110. 2008. View Article : Google Scholar : PubMed/NCBI
|
|
23
|
Ji C: New insights into the pathogenesis
of alcohol-induced ER stress and liver diseases. Int J Hepatol.
2014:5137872014.PubMed/NCBI
|
|
24
|
Schmittgen TD and Livak KJ: Analyzing
real-time PCR data by the comparative C (T) method. Nat Protoc.
3:1101–1108. 2008. View Article : Google Scholar
|
|
25
|
Ferlini A and Rimessi P: Exon skipping
quantification by real-time PCR. Methods Mol Biol. 867:189–199.
2012. View Article : Google Scholar : PubMed/NCBI
|
|
26
|
Rao X, Huang X, Zhou Z and Lin X: An
improvement of the 2ˆ(−delta delta CT) method for quantitative
real-time polymerase chain reaction data analysis. Biostat
Bioinforma Biomath. 3:71–85. 2013.PubMed/NCBI
|
|
27
|
Ji C and Kaplowitz N: ER stress: Can the
liver cope? J Hepatol. 45:321–333. 2006. View Article : Google Scholar : PubMed/NCBI
|
|
28
|
Malhi H and Kaufman RJ: Endoplasmic
reticulum stress in liver disease. J Hepatol. 54:795–809. 2011.
View Article : Google Scholar
|
|
29
|
Lai CW, Otero JH, Hendershot LM and Snapp
E: ERdj4 protein is a soluble endoplasmic reticulum (ER) DnaJ
family protein that interacts with ER-associated degradation
machinery. J Biol Chem. 287:7969–7978. 2012. View Article : Google Scholar : PubMed/NCBI
|
|
30
|
Wang SB, Shi Q, Xu Y, Xie WL, Zhang J,
Tian C, Guo Y, Wang K, Zhang BY, Chen C, et al: Protein disulfide
isomerase regulates endoplasmic reticulum stress and the apoptotic
process during prion infection and PrP mutant-induced cytotoxicity.
PLoS One. 7:e382212012. View Article : Google Scholar : PubMed/NCBI
|
|
31
|
Peletto S, Bertuzzi S, Campanella C,
Modesto P, Maniaci MG, Bellino C, Ariello D, Quasso A, Caramelli M
and Acutis PL: Evaluation of internal reference genes for
quantitative expression analysis by real-time PCR in ovine whole
blood. Int J Mol Sci. 12:7732–7747. 2011. View Article : Google Scholar : PubMed/NCBI
|
|
32
|
Bustin SA, Benes V, Garson JA, Hellemans
J, Huggett J, Kubista M, Mueller R, Nolan T, Pfaffl MW, Shipley GL,
et al: The MIQE guidelines: Minimum information for publication of
quantitative real-time PCR experiments. Clin Chem. 55:611–622.
2009. View Article : Google Scholar : PubMed/NCBI
|
|
33
|
Lacerda AL, Fonseca LN, Blawid R, Boiteux
LS, Ribeiro SG and Brasileiro AC: Reference gene selection for qPCR
analysis in tomato-bipartite begomovirus interaction and validation
in additional tomato-virus pathosystems. PLoS One. 10:e01368202015.
View Article : Google Scholar : PubMed/NCBI
|
|
34
|
Zhang X, Ding L and Sandford AJ: Selection
of reference genes for gene expression studies in human neutrophils
by real-time PCR. BMC Mol Biol. 6:42005. View Article : Google Scholar : PubMed/NCBI
|
|
35
|
Nelissen K, Smeets K, Mulder M, Hendriks
JJ and Ameloot M: Selection of reference genes for gene expression
studies in rat oligodendrocytes using quantitative real time PCR. J
Neurosci Methods. 187:78–83. 2010. View Article : Google Scholar
|
|
36
|
Li H, Chen C, Yao H, Li X, Yang N, Qiao J,
Xu K and Zeng L: Identification of suitable reference genes for
mRNA studies in bone marrow in a mouse model of hematopoietic stem
cell transplantation. Transplant Proc. 48:2826–2832. 2016.
View Article : Google Scholar : PubMed/NCBI
|
|
37
|
Lin P, Lan X, Chen F, Yang Y, Jin Y and
Wang A: Reference gene selection for real-time quantitative PCR
analysis of the mouse uterus in the peri-implantation period. PLoS
One. 8:e624622013. View Article : Google Scholar : PubMed/NCBI
|
|
38
|
Stephens AS, Stephens SR and Morrison NA:
Internal control genes for quantitative RT-PCR expression analysis
in mouse osteoblasts, osteoclasts and macrophages. BMC Res Notes.
4:4102011. View Article : Google Scholar :
|
|
39
|
Klein C, Rutllant J and Troedsson MH:
Expression stability of putative reference genes in equine
endometrial, testicular, and conceptus tissues. BMC Res Notes.
4:1202011. View Article : Google Scholar : PubMed/NCBI
|
|
40
|
Valadan R, Hedayatizadeh-Omran A,
Alhosseini-Abyazani MN, Amjadi O, Rafiei A, Tehrani M and
Alizadeh-Navaei R: Data supporting the design and evaluation of a
universal primer pair for pseudogene-free amplification of HPRT1 in
real-time PCR. Data Brief. 4:384–389. 2015. View Article : Google Scholar : PubMed/NCBI
|
|
41
|
Valadan R, Amjadi O, Tehrani M, Rafiei A,
Hedayatizadeh-Omran A and Alizadeh-Navaei R: Pseudogene-free
amplification of HPRT1 in quantitative reverse transcriptase
polymerase chain reaction. Anal Biochem. 485:46–48. 2015.
View Article : Google Scholar : PubMed/NCBI
|
|
42
|
Zainuddin A, Chua KH, Abdul Rahim N and
Makpol S: Effect of experimental treatment on GAPDH mRNA expression
as a housekeeping gene in human diploid fibroblasts. BMC Mol Biol.
11:592010. View Article : Google Scholar : PubMed/NCBI
|
|
43
|
Bonefeld BE, Elfving B and Wegener G:
Reference genes for normalization: A study of rat brain tissue.
Synapse. 62:302–309. 2008. View Article : Google Scholar : PubMed/NCBI
|