Introduction
The short de Broglie wavelength of helium ions
(He+) makes the resolution expected for helium ion
microscopy (HIM) very high. The interaction between He+
and sample atoms causes the emission of several signals that can be
separately recorded (1). Several
helium ion microscopes exploit secondary electron (SE) emission.
Detection of the weak ionoluminescence (IL) signal was only
recently reported (2) and has not
yet been applied to biological samples. Based on simulations, HIM
of biological samples is expected to achieve sub-nanometer
resolution with efficient charge control (3). Of advantage for high resolution, the
collected SEs are predicted to arise from a relatively narrow
excitation volume (4,5). Furthermore, the narrow convergence
angle of the fine He+ beam makes the depth-of-field
(DOF) great (6).
These properties indicate that HIM may be considered
an important novel tool for cell biology and nanomedical research
(7–9). Until recently, observation was
limited to the cell surface, partly due to the metal-coating
pretreatment (10) employed to
reduce charging for long time-periods. However, intracellular
structures have been observed by transmission HIM by using a
low-brightness radio frequency ion source at a beam line faculty
[accelerating voltage 1.2 MeV; (11)] rather than the standard single
atom HIM source.
The present study achieved high contrast, high DOF
imaging of uncoated, unstained dried cells and Epon-embedded tissue
sections using the SE signal generated by a bright single atom HIM
source at 30.0 kV (SE-HIM). Labeling the cells with gold
(Au)-tagged antibodies realized immuno-SE-HIM.
Materials and methods
Cell culture and fixation
African green-monkey kidney fibroblast COS7 cells
and mouse C2C12 myoblast cells were either cultured directly on a
silicon nitride (SiN)/Si chip (i.e., on a 100 nm SiN film layered
on a 200 µm Si chip) or on SiN film alone [i.e., in an
atmospheric SEM (ASEM) dish, which has a SiN window supported by a
Si frame in its base] (12–14). Cells were cultured in 3 ml
Dulbecco's modified Eagle's medium (Wako Pure Chemical Industries,
Ltd., Osaka, Japan) supplemented with 10% fetal bovine serum
(Gibco; Thermo Fisher Scientific, Inc., Waltham, MA, USA) and 100
µg/ml kanamycin, in an atmosphere containing 5%
CO2 at 37°C. Following culture, cells were fixed with 1%
glutaraldehyde in PBS (136 mM NaCl, 1.4 mM KCl, 10 mM
Na2HPO4 and 1.7 mM
KH2PO4; pH 7.4) at room temperature for 15
min or, if immunolabeling or fluorescence microscopy (FM) followed,
with 4% paraformaldehyde in PBS (pH 7.4) at room temperature for 15
min. Paraformaldehyde-fixed cells were immunolabeled and further
fixed with glutaraldehyde. For HIM observation, fixed cells were
dehydrated through an alcohol gradient series and dried.
Immunolabeling
Cells were labeled as previously described (12). Briefly, paraformaldehyde-fixed
cells were perforated with 0.1 or 0.5% Triton X-100 in PBS at room
temperature for 15 min, washed with PBS and blocked with 1% skimmed
milk/5% goat serum (Gibco; Thermo Fisher Scientific, Inc.) in PBS
for 20 min. For primary labeling, cells were incubated with
antibodies or phalloidin in blocking solution. The antibodies used
were: Mouse anti-α-tubulin antibody (1:100 dilution in blocking
solution, incubated at room temperature for 1 h; A11126;
Invitrogen; Thermo Fisher Scientific, Inc.) and rabbit anti-protein
disulfide isomerase (PDI) (1:100 dilution, incubated at room
temperature for 1 h; ER Stress Antibody Sampler kit, #9956; Cell
Signaling Technology, Inc., Danvers, MA, USA). Alexa
Fluor® 488-conjugated phalloidin (1:500 dilution,
incubated at room temperature for 30 min; A12379; Molecular Probes;
Thermo Fisher Scientific, Inc.) or phalloidin-biotin (4
µg/ml; P8716; Sigma-Aldrich; Merck KGaA, Darmstadt, Germany)
was used for fluorescence and fluorescence/Au-labeling of
filamentous-actin (F-actin), respectively. The cells were labeled
with the following secondary antibodies: Goat immunoglobulin G
(IgG) against rabbit or mouse IgG conjugated with fluorescent Alexa
Fluor® 488 or 594 dye (1:500-1:1,000 dilution, incubated
at room temperature for 30 min; A11034, A11029, A11037 and A11032;
Invitrogen; Thermo Fisher Scientific, Inc.), or goat Fab' against
rabbit or mouse IgG, doubly conjugated with 1.4 nm
Nanogold® and Alexa Fluor® 488 (1:100-1:400
dilution in blocking solution, incubated at room temperature for 30
min; NAN7204 and NAN7202; Nanoprobes, Inc., Yaphank, NY, USA).
Samples labeled with phalloidin-biotin were incubated with
streptavidin conjugated with Nanogold and Alexa Fluor®
488 (1:50 dilution, incubated at room temperature for 30 min;
NAN7216; Nanoprobes, Inc.). To achieve counter-labeling using
another type of fluorescence, samples were first incubated with
rabbit anti-PDI or mouse anti-α-tubulin antibody, then with Alexa
Fluor® 594-tagged anti-rabbit or anti-mouse IgG. To
achieve fluorescent labeling of nuclei, cells were stained with 5
ng/ml 4′,6-diamidino-2-phenylindole (DAPI; Sigma Aldrich; Merck
KGaA) for 3 min. For ASEM or HIM observation, the bound antibodies
were fixed with 1% glutaraldehyde in PBS for 15 min. After washing,
Nanogold particles were enhanced by Au sedimentation using
GoldEnhance EM (Nanoprobes, Inc.) at room temperature for 5 min.
For lectin labeling, paraformaldehyde-fixed COS7 cells that had
been cultured on the SiN/Si chip were blocked with 2% bovine serum
albumin (Wako, Pure Chemical Industries Ltd.) in PBS for 30 min
without perforation. Surface glycans on the cells were labeled with
wheat germ agglutinin (WGA)-15 nm colloidal Au (EY Laboratories,
Inc., San Mateo, CA, USA) at a final concentration corresponding to
0.8 at absorbance 520 for 30 min. The labeled cells were fixed with
1% glutaraldehyde in PBS for 15 min.
Tissues
Adult mice were anesthetized with isoflurane and
sacrificed to obtain kidney tissues for observation. Briefly, the
kidney samples were diced, and the pieces were fixed with 2.5%
glutaraldehyde in 0.2 M phosphate buffer for 30 min, dehydrated
through a gradient series of alcohol at room temperature, embedded
in Epon, and sectioned using a Leica Ultracut UCT ultramicrotome
(Leica Microsystems, Inc., Buffalo Grove, IL, USA). The sections
were placed on a SiN/Si chip for SE-HIM or a carbon-covered copper
mesh grid for transmission electron microscopy (TEM). The animal
studies were conducted in compliance with the national
institutional rules of conduct of Advanced Industrial Science and
Technology (AIST; Tsukuba, Japan). The present study was approved
by the Animal Care and Use Committee of the National Institute of
AIST.
HIM
A Carl Zeiss Orion Plus HIM (Carl Zeiss Microscopy,
LLC, Peabody, MA, USA) was used in the present study. The SiN/Si
chip or ASEM dish (14) holding
the cells was attached to the metal specimen holder of the HIM with
conductive carbon tape (3 M; Japan Ltd., Tokyo, Japan) as
illustrated in Fig. 1A left and
center, respectively. Dried cells and tissues were imaged using an
acceleration voltage of 30.0 kV and a beam current of ~2.0 pA. The
radiation dose was <14.4 He+/Å2. The flood
gun of the HIM was employed mainly in conjunction with the ASEM
dish to reduce charging, and generally not with the SiN/Si chip.
Use of the flood gun entailed rastering the beam of electrons over
the same area as the ion beam; the electrons partially neutralize
the surface charge, enabling SE to leave the surface with
sufficient energy to be collected by the SE detector. Small
adjustments were made to the electron beam energy, and the X and Y
deflectors, during imaging to ensure that the best possible image
was obtained. For correlative microscopy, labeled cells were first
checked in solution using FM and/or the inverted SEM of an ASEM
and, after drying, by SE-HIM.
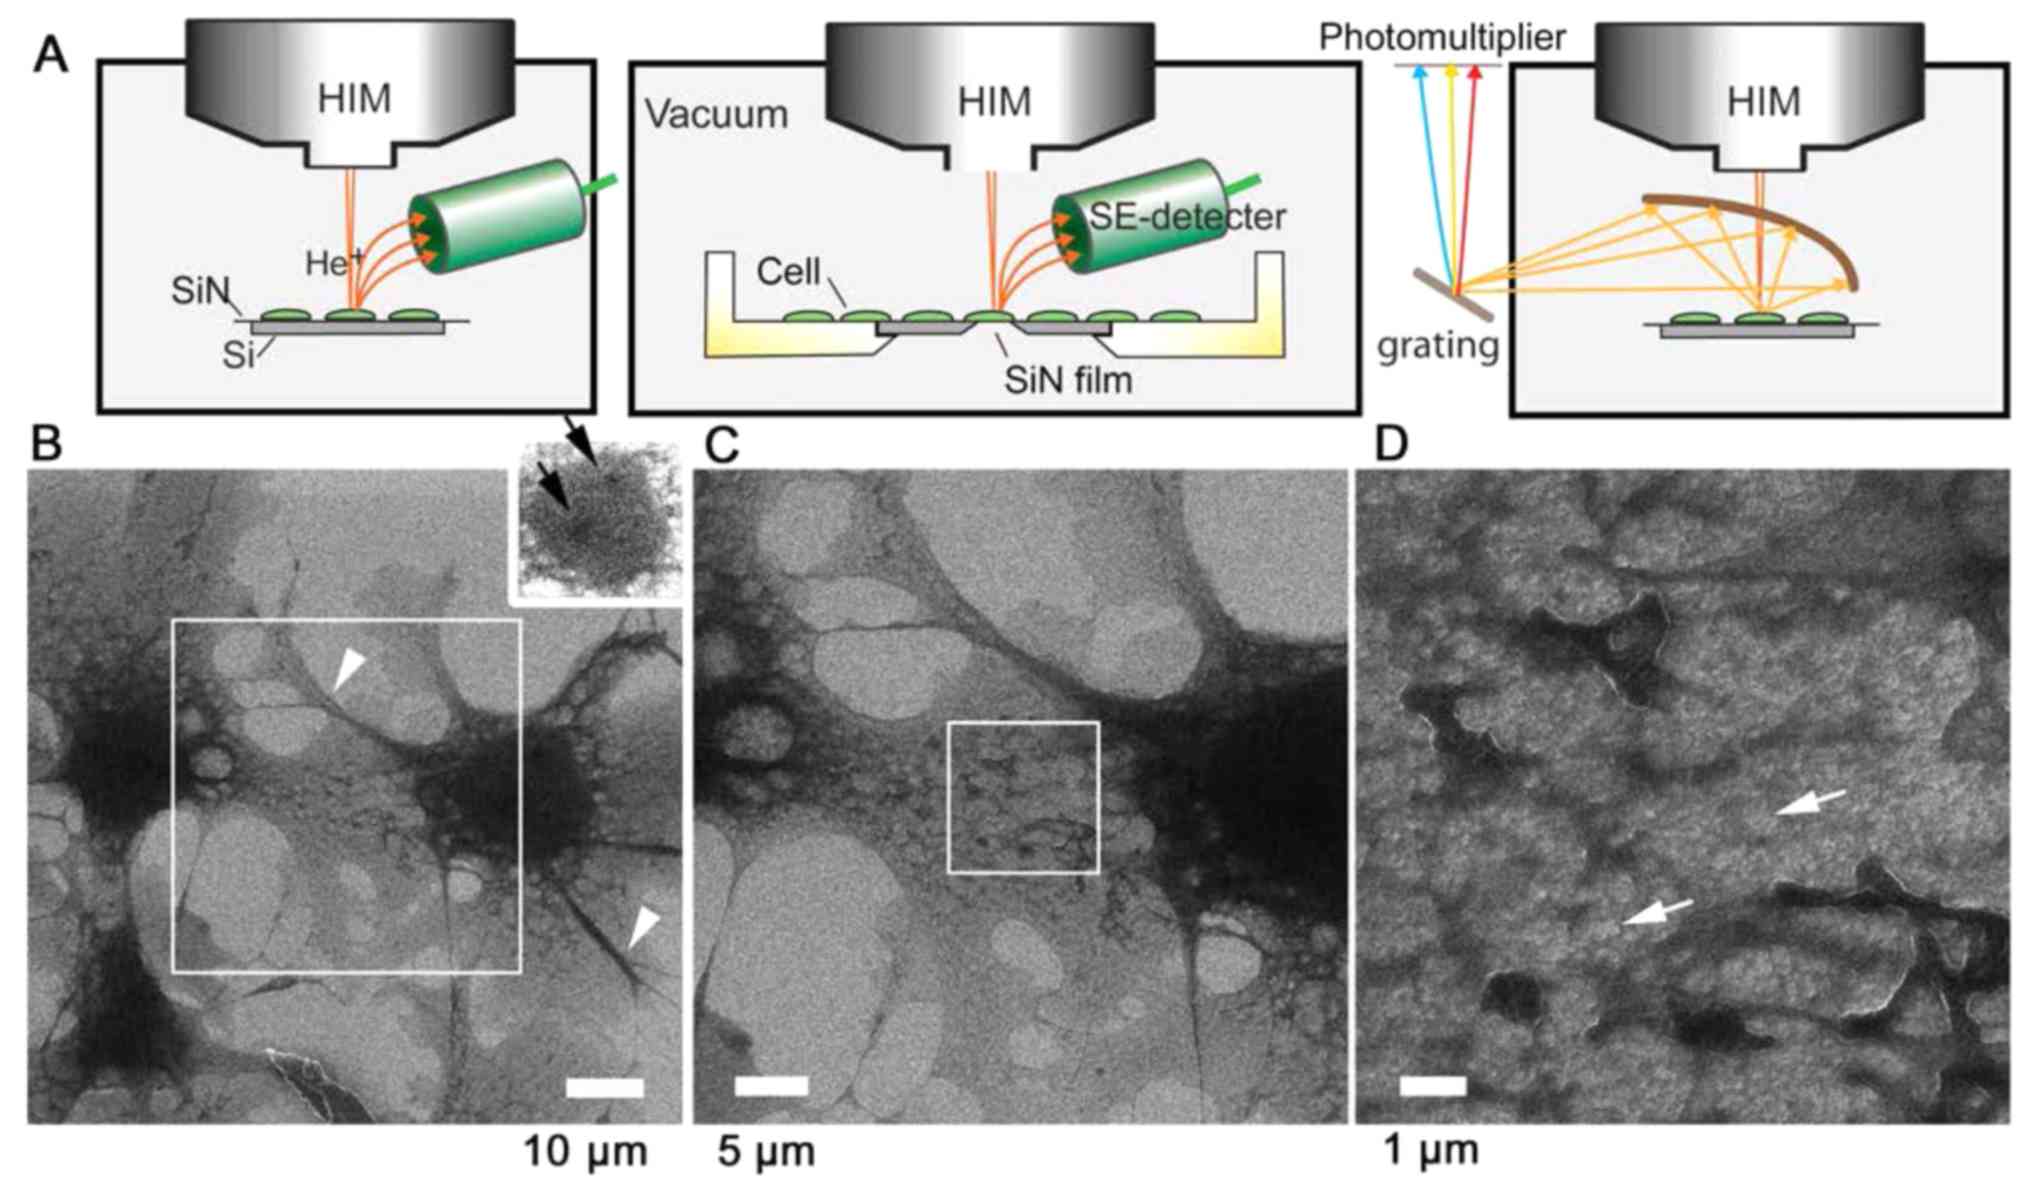 | Figure 1SE-HIM and IL-HIM of uncoated,
unstained fibroblast cells. (A) Schematic diagrams. The sample is
scanned by a He+ beam and the emitted SEs are detected
(left and center). Alternatively, emitted IL is collected by an
elliptical mirror, separated by grating and detected by a
photomultiplier (right). (B) SE-HIM of uncoated, unstained COS7
cells on a SiN/Si bilayer. The background is bright; cell
boundaries are clearly defined. The dark central region is the
nucleus. Inset: Adjusted to visualize darker nucleoli-like
structures (black arrows) within the nucleus on the right. (C)
Image of the rectangle in B. Dark striated bundles radiate from the
nucleus to the cell periphery. A web-like network, the ER, is
prominent between them, particularly near the nucleus. (D) Image of
the rectangle in C. Contrast variations indicate that the ER
network is not uniformly thick. ER, endoplasmic reticulum;
He+, helium ion; HIM, helium ion microscopy; IL-HIM,
ionoluminescence-HIM; SE, secondary electron; SiN/Si, silicon
nitride/silicon. |
IL-HIM
COS7 cells cultured on a SiN/Si bilayer were
incubated with zinc oxide (ZnO) nanoparticles (ZnO-NPs;
Sigma-Aldrich; Merck KGaA) for 7 h at 37°C. The cells were fixed
with 4% paraformaldehyde as aforementioned. The cells were further
fixed with glutaraldehyde, dehydrated in alcohol and air-dried,
after which they were observed by IL-based HIM. Briefly, an
elliptical mirror in the specimen chamber of the HIM is used to
efficiently collect luminescence from the sample, and the light is
transferred, separated by diffraction grating and detected by a
photomultiplier (Fig. 1A, right).
The light intensity is plotted for each pixel in the output image,
according to the timing signal of the scan frame shift.
TEM
Unstained Epon thin-sections on carbon-covered
copper EM grids were imaged using a Hitachi H7600 TEM (Hitachi,
Ltd., Tokyo, Japan) at x500–2,000 magnification with an
acceleration voltage of 80 kV.
ASEM and FM
The ClairScope ASEM correlative-microscope
(JASM-6200; JEOL, Ltd., Tokyo, Japan) was used to record
fluorescence and SEM images of the samples in solution (14) as references. The standard 8-window
35 mm bio-ASEM dish with a 100 nm, 0.25×0.25 mm SiN film window
built into its base (JEOL, Ltd.) was employed for cell culture
(13). After fixation and
labeling, cells in PBS were observed with the fluorescence
microscope of the ASEM equipped with a 40x objective lens (NA:
0.8), or with an Olympus-AX fluorescence microscope equipped with a
60x objective lens (NA: 1.1). After Au enhancement, the medium was
supplemented with 10 mg/ml (w/v) ascorbic acid as a radical
scavenger, and the cells were directly observed in buffer using the
inverted SEM of the ASEM at an acceleration voltage of 30 kV; the
backscattered electrons were recorded.
Results
SE-HIM of fibroblast cells on a SiN/Si
bilayer
Unstained and uncoated African green monkey COS7
kidney fibroblast cells cultured on a SiN/Si substrate were fixed,
dried and observed in vacuum by SE-HIM without counter
electron-radiation (Fig. 1A,
left). Cells appeared dark on a bright background from the
substrate, and the nucleus and delicate intracellular structures
were easily distinguishable (Fig.
1B). The nucleus displayed even darker nucleoli-like structures
(Fig. 1B inset, arrows). While
the lamellipodia were relatively homogeneous (Fig. 1B and C), medium-dark striated
bundles including actin stress fibers or microtubules radiated from
the region around the nucleus to the cell periphery (Fig. 1B, arrowheads) and were present in
most filo-podia. The dark web-like network prominent between these
bundles, particularly near the nucleus (Fig. 1C), corresponds to the ER. The ER
extended throughout the cytoplasm (Fig. 1D) and surrounded gray cytoplasmic
structures and various brighter features (Fig. 1D, arrows) that might be vacuoles.
The white line at the edge of the ER may arise from enhanced SE
emission (Fig. 1D).
These observations were confirmed by correlative FM
(Fig. 2). Cells were labeled with
fluorescent cell organelle markers for DNA (Fig. 2A), PDI (Fig. 2B), which is present in the ER
lumen, and F-actin (Fig. 2C). The
fluorescence signals from the ER (Fig. 2B, arrows) correspond to thick
web-like networks in the SE-HIM images (Fig. 2E, arrows), whereas the
fluorescence signals from F-actin (Fig. 2C, arrowheads) correspond to the
faint striated bundles in the SE-HIM images (Fig. 2E, arrowheads).
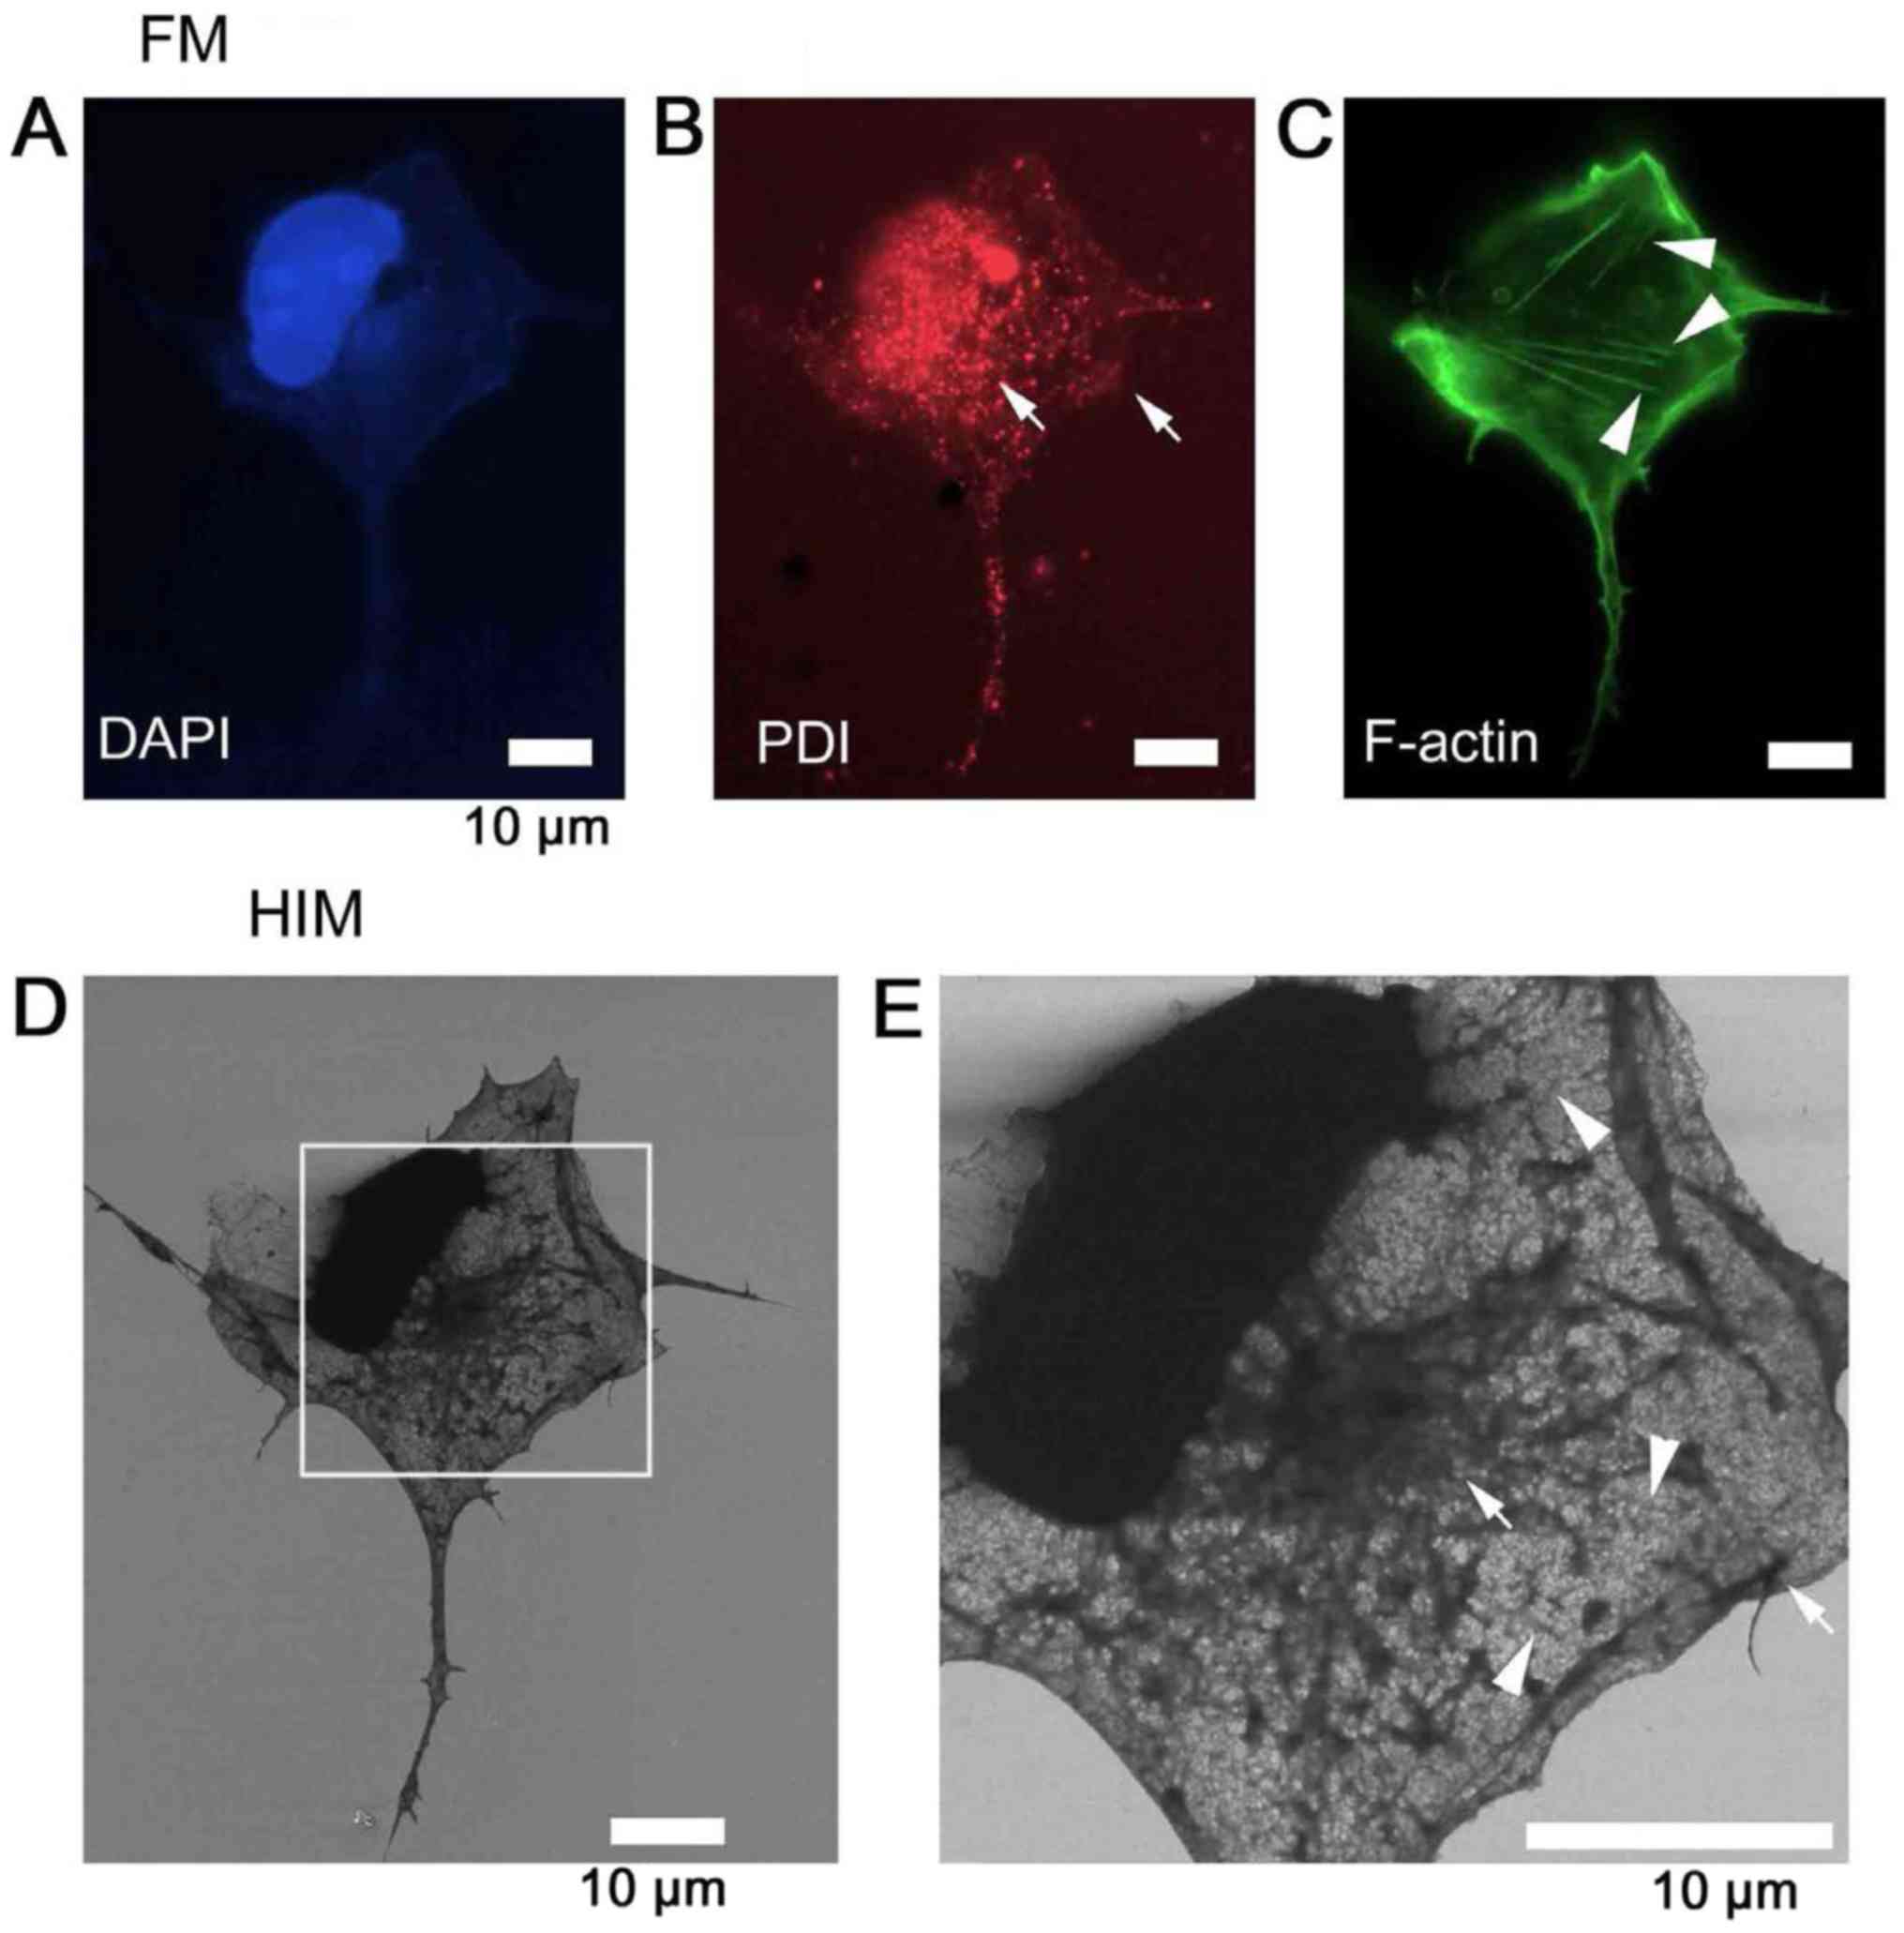 | Figure 2Fluorescence identification of
organelles imaged by SE-based HIM. To identify the organelles of
COS7 cells, F-actin was labeled with Alexa Fluor®
488-conjugated phalloidin (green), ER with anti-PDI antibody and
further with Alexa Fluor® 594-conjugated secondary
antibody (red), and DNA with DAPI (blue). Labeling was checked in
solution by fluorescence microscopy: (A) DAPI was used to identify
the nucleus. (B) PDI was used to identify the ER. (C) F-actin was
used to identify stress fibers. Cells were then dehydrated/dried
and observed by SE-HIM. (D) SE-HIM, corresponding to C. (E)
Magnification of the rectangle in D. The web-like network in the
SE-HIM images corresponds to florescence signals from the ER
(arrows), and the faint striated bundles to fluorescence signals
from F-actin (arrowheads). DAPI, 4′,6-diamidino-2-phenylindole; ER,
endoplasmic reticulum; F-actin, filamentous-actin; HIM, helium ion
microscopy; PDI, protein disulfide isomerase; SE, secondary
electron. |
Stress fibers in C2C12 myoblast
cells
F-actin and PDI in C2C12 myoblast cells were
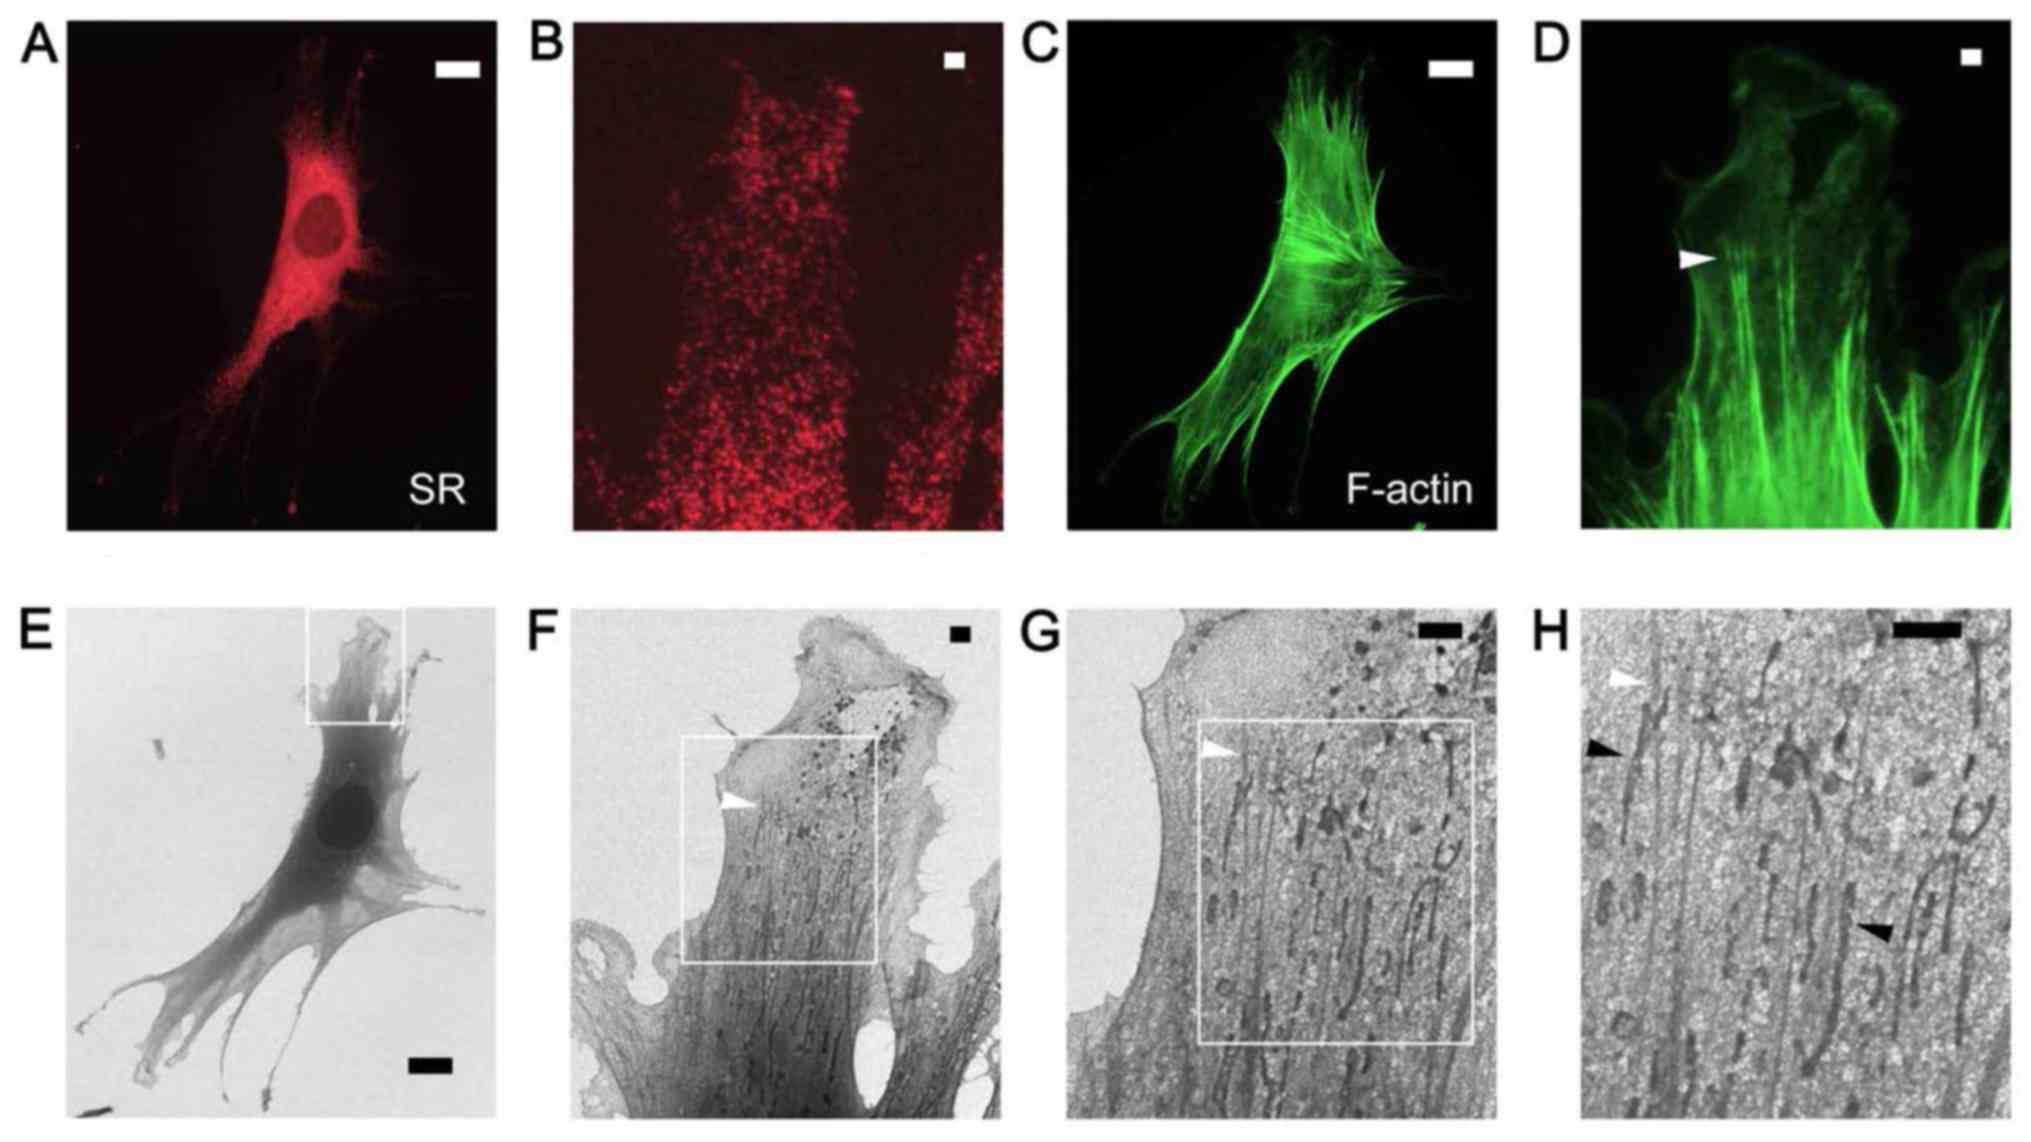
similarly labeled and observed by FM (Fig. 3A–D) and SE-HIM (Fig. 3E–H). Myoblasts possess abundant
stress fibers. The nucleus and sarcoplasmic reticulum (SR) were the
darkest regions observed on the HIM images (Fig. 3A and 3E). The thick spindle-shaped cell body
and well-developed SR exhibited darker SE signals than the
corresponding regions in COS7 cells (Figs. 1 and 2). Moderately dense, 50–200 nm wide
F-actin fibers that aligned with the cell boundary were prevalent
in the cytoplasm at the cell periphery (Figs. 3C, D, F and G) and fork-shaped
stress fiber bundles can be distinguished (Fig. 3D and F–H, white arrowheads). The
darker, ~200 nm wide and 1–10 µm long, vesicle-like
structures present along the bundles (Fig. 3H, black arrowheads) were
considered to be mitochondria, and the fine web of material
surrounding them may be a fine network of SR (Fig. 3B) or protein complexes.
HIM of immuno-Au-labeled PDI on SiN
film
To directly identify the ER of COS7 cells by SE-HIM,
PDI was labeled with antibodies tagged with both fluorescence and
Au. The cultured cells extended over the thin SiN film window and
SiN/Si chip in the base of an ASEM dish (Fig. 1A, center). Labeling was detected
by FM (Fig. 4A, center and
right). Cells on SiN/Si regions (Fig.
4A, left) were clearly visible by SE-HIM, but scattering from
the Au sediments (bright spots) was difficult to distinguish
(Fig. 4C). On SiN film regions
(Fig. 4A, left), Au signals could
be clearly visualized (compare Fig.
4B, bottom left and right, with gain adjustment, and Fig. 4B, upper left, without adjustment).
Moderately dark filamentous features on the SiN/Si bilayer
(Fig. 4B, arrowheads) were not
visible on the SiN-film. Similarly, although the nucleus and thick
ER were very dark on SiN film only faint traces of the thinner ER
present at the cell periphery could be distinguished (Fig. 4B). Notably, both ER regions were
similarly speckled by Au signals (Fig. 4B); only the contrast and degree of
PDI fluorescence reflected their thickness (Fig. 4A). Other COS7 cells cultured on an
ASEM dish were fixed with paraformaldehyde and similarly labeled.
Afterwards, cells on the SiN film were observed in radical
scavenger glucose solution by ASEM (Fig. 5A–D). The cells were then
dehydrated and observed in a vacuum by SE-HIM (Fig. 5E–H). The SE-HIM Au signal
corresponded to the Au signal recorded by ASEM (Fig. 5B–D), which is comparable to the
signal obtained by typical immuno-EM (15).
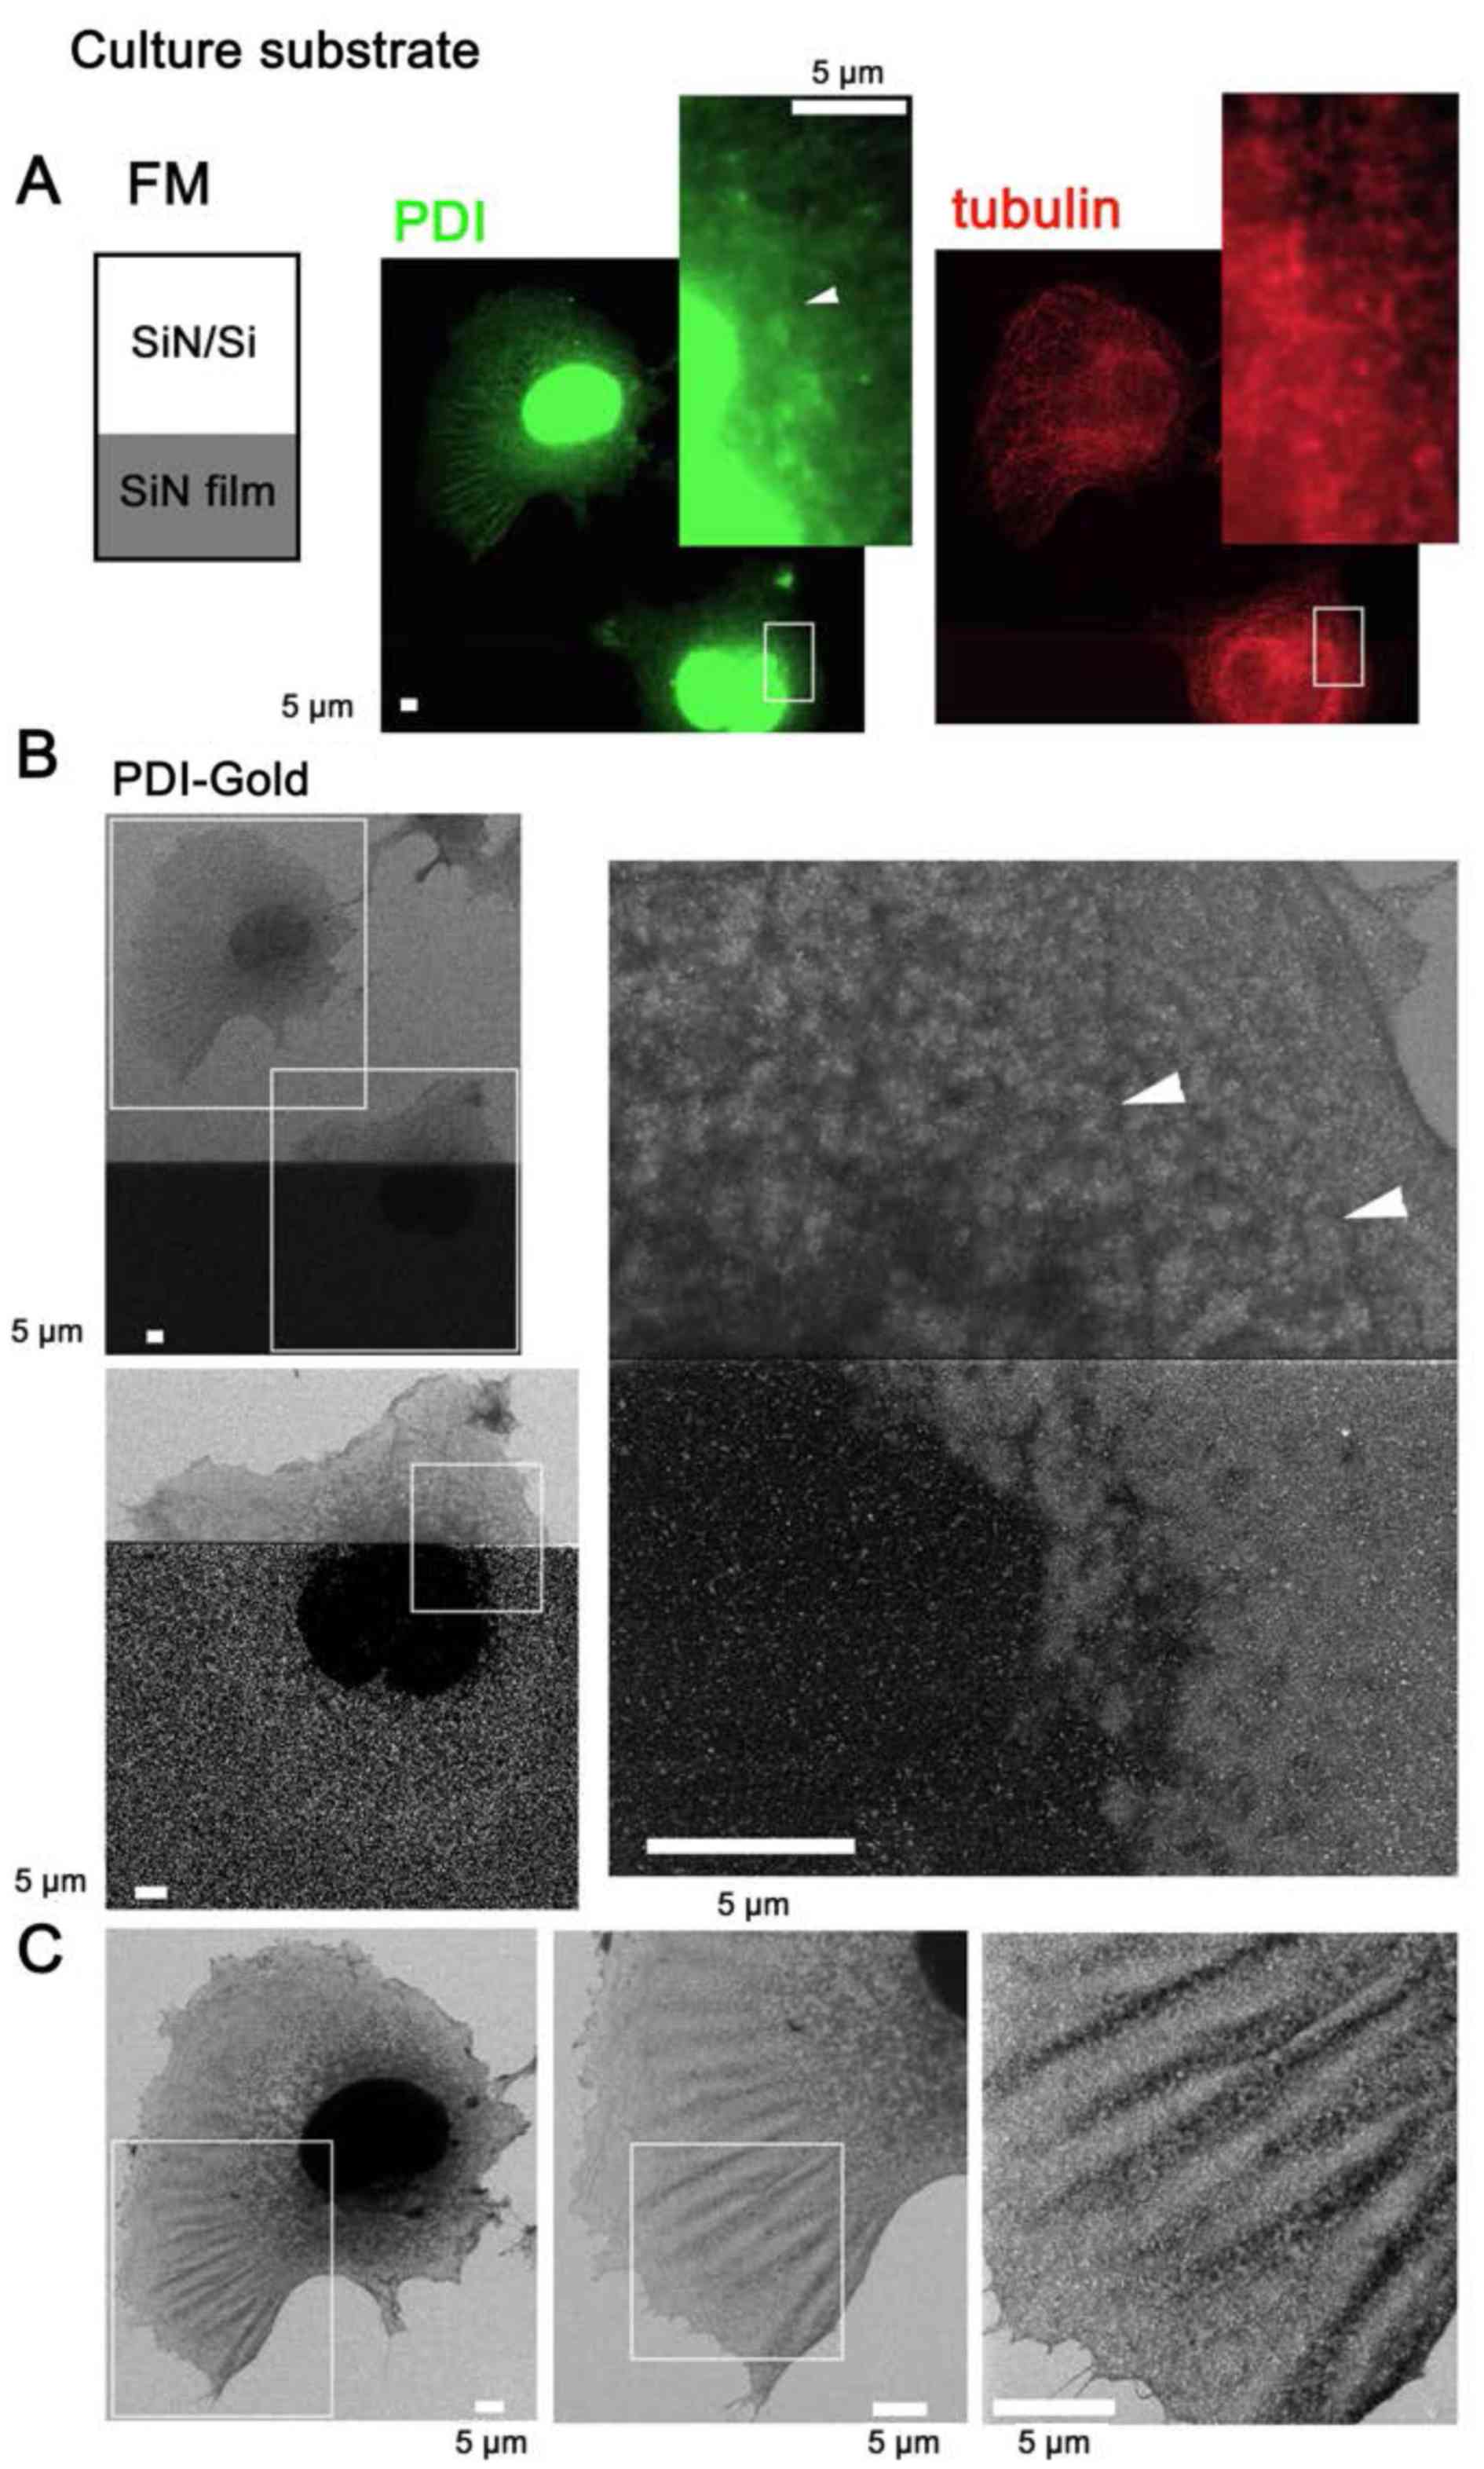 | Figure 4SE-HIM of immunogold-labeled PDI in
COS7 cells on SiN film and SiN/Si. PDI was tagged with
fluorescence/Au to directly identify the ER by SE-HIM, whereas
α-tubulin was labeled only with fluorescence. Cells were cultured
on the electron-transparent SiN film window of an atmospheric
scanning electron microscopy dish, fixed and perforated. PDI and
α-tubulin were then immunolabeled with Alexa Fluor®
488-Nanogold and Alexa Fluor® 594, respectively.
Labeling was confirmed in buffer by correlative FM. (A) FM of PDI
and α-tubulin. Insets: Enlarged views of the white rectangles. (B)
SE-HIM of PDI in cells at the border between SiN film and
SiN/Si-bilayer. Bottom panel: Higher magnification image of the
lower rectangle in the upper panel. Right, further magnification.
In both cases, the brightness and contrast of the lower SiN film
region was adjusted to make the signals visible. On SiN/Si, Au
signals were present but indistinct. On SiN film, the nuclei and
thick ER were speckled with bright Au signals. Filamentous density
(arrowheads) visualized on the SiN/Si bilayer, was barely visible
on SiN film. (C) Cell on the SiN/Si region. Left, higher
magnification image of the top rectangle in the upper left panel of
B. The cell has a dense web-like structure around the nucleus that
is connected to a fin-like structure in lamellipodia; both
structures correspond to ER fluorescence in A. Center and right,
higher magnification image of the rectangle in the preceding panel.
Au signals are present but indistinct. Au, gold; ER, endoplasmic
reticulum; FM, fluorescence microscopy; PDI, protein disulfide
isomerase; SE-HIM, secondary electron-helium ion microscopy;
SiN/Si, silicon nitride/silicon. |
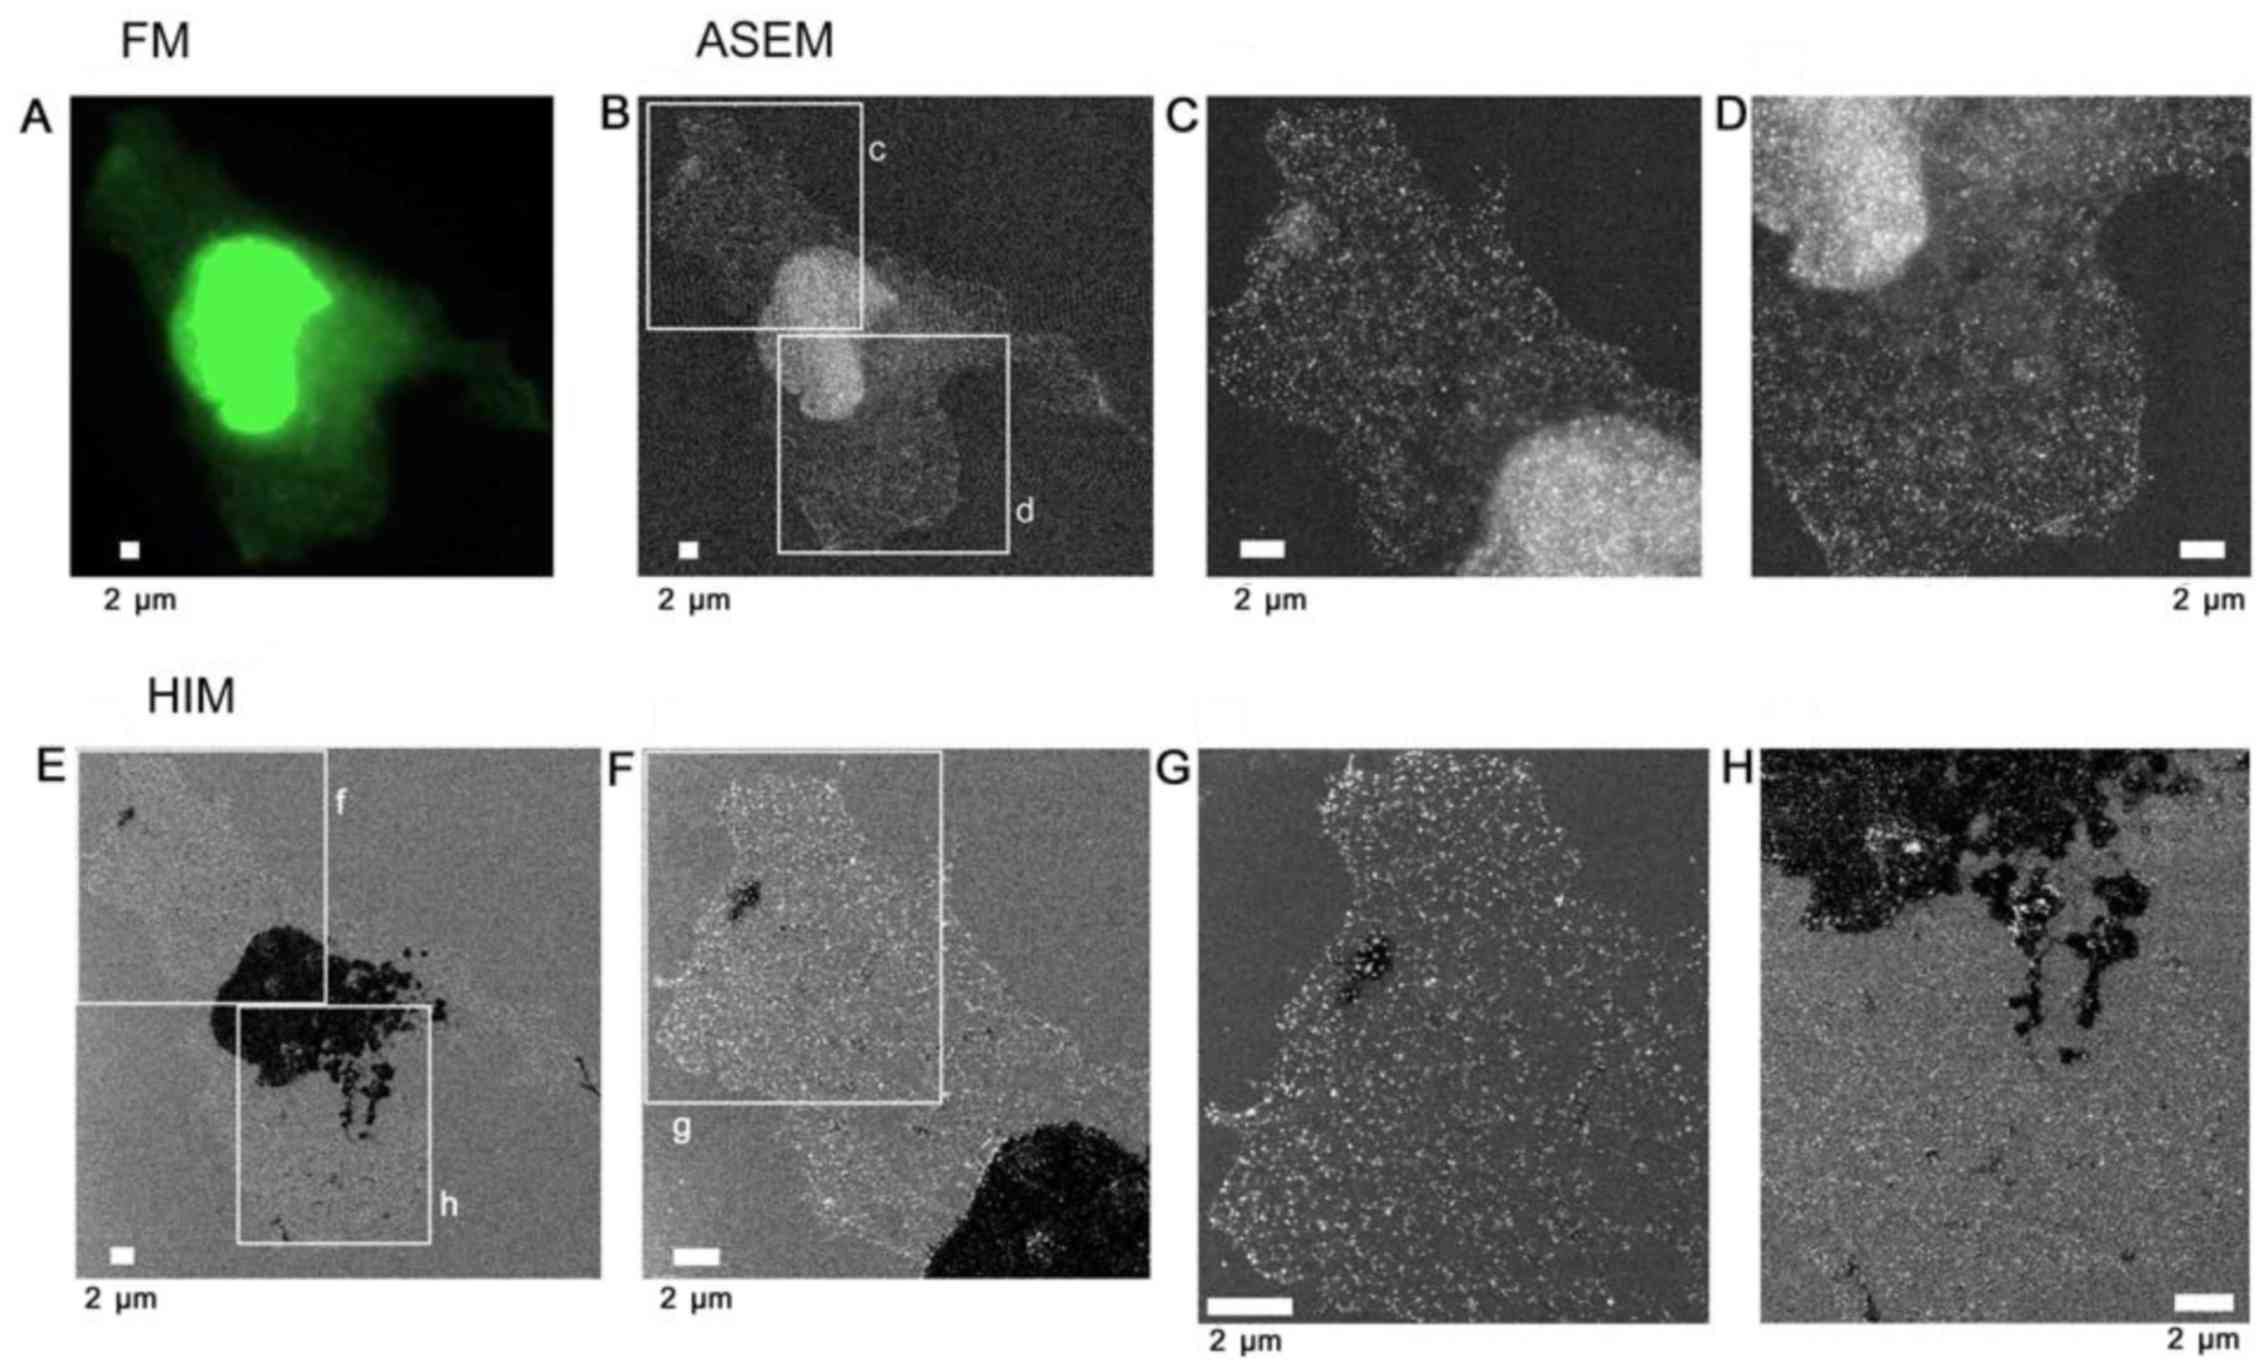 | Figure 5Au-labeled ER in cells on SiN film.
COS7 cells on an ASEM dish were labeled as in Fig. 4 to directly identify the ER by
SE-HIM and ASEM, and access SE-HIM imaging of Au sediments.
Labeling was confirmed in buffer by correlative FM, and further by
ASEM. (A) FM of PDI. (B) ASEM of the same region. Cells in buffer
were scanned from underneath, the electron beam passing through the
SiN film, and backscattered electrons were detected. The high
scattering centers (white) are Au sediments. (C) Image of rectangle
c in B. (D) Image of rectangle d in B. Afterwards, cells were
dehydrated/dried and observed by SE-HIM. (E) SE-HIM of the cell
imaged in A and B. Both the nucleus and the thick ER are very dark.
(F) Image of rectangle f in E. (G) Image of rectangle g in F. Au
signals evident as white dots, form a web-like pattern over the
cytoplasm and also cover parts of the nucleus, but to a lesser
extent than indicated by ASEM. (H) Image of rectangle h in E. The
contrast of the ER seems to be related to its diameter. In the
SE-HIM image, the concentration of Au signals in thin ER regions is
higher than in thick ER regions. The sum of the bright (Au) and the
dark signals in the SE-HIM image matches the ASEM. ASEM,
atmospheric scanning electron microscopy; Au, gold; ER, endoplasmic
reticulum; FM, fluorescence microscopy; PDI, protein disulfide
isomerase; SE-HIM, secondary electron-helium ion microscopy; SiN,
silicon nitride. |
Au-labeled F-actin and HIM image
resolution
The F-actin of C2C12 cells was tagged with
fluorescence and Au, inspected for labeling by FM (Fig. 6A) and ASEM (Fig. 6B), and imaged by SE-HIM (Fig. 6C). Au signals from labeled F-actin
were visible in the HIM images, regardless of whether the substrate
was SiN-film or SiN/Si (Fig. 6C).
They were highly concentrated towards the edge of lamellipodia,
moderately present on the internal mesh-like F-actin network
(Fig. 6C, right) and also visible
on filopodia (Fig. 6C,
arrowhead). This distribution agrees with FM (Fig. 6A) and ASEM (Fig. 6B), particularly at thin cell
margins, thus indicating that SE-HIM captures images of regions
close to the cell surface. C2C12 cells cultured on the SiN/Si chip
(Fig. 1A, left) were similarly
labeled to measure the resolution. From the minimum recognizable
gap between two Au particles, the resolution was 2 nm (Fig. 6D).
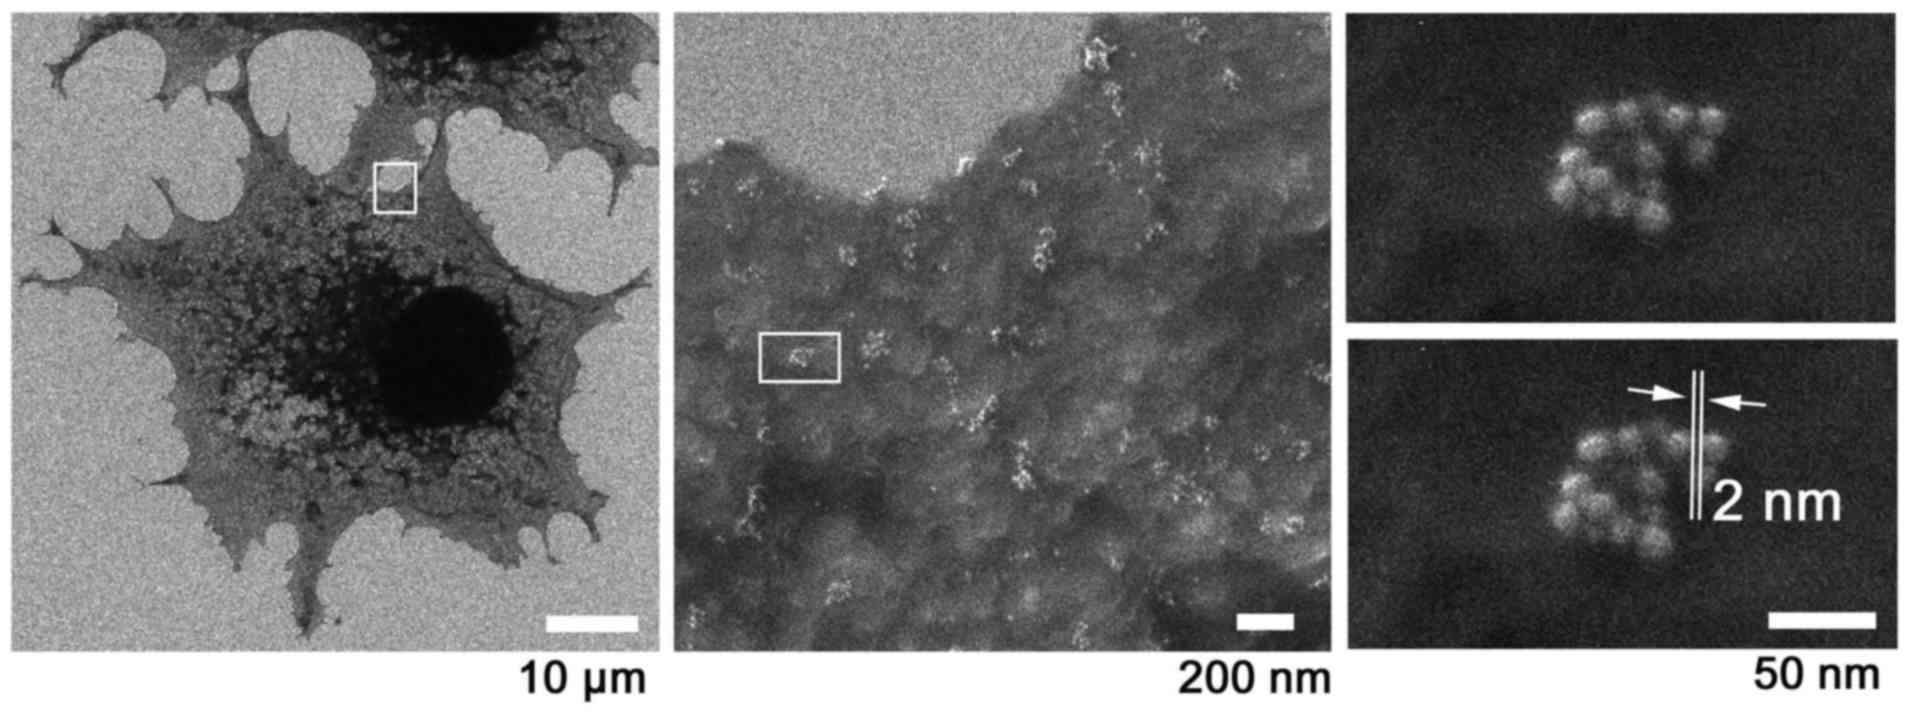
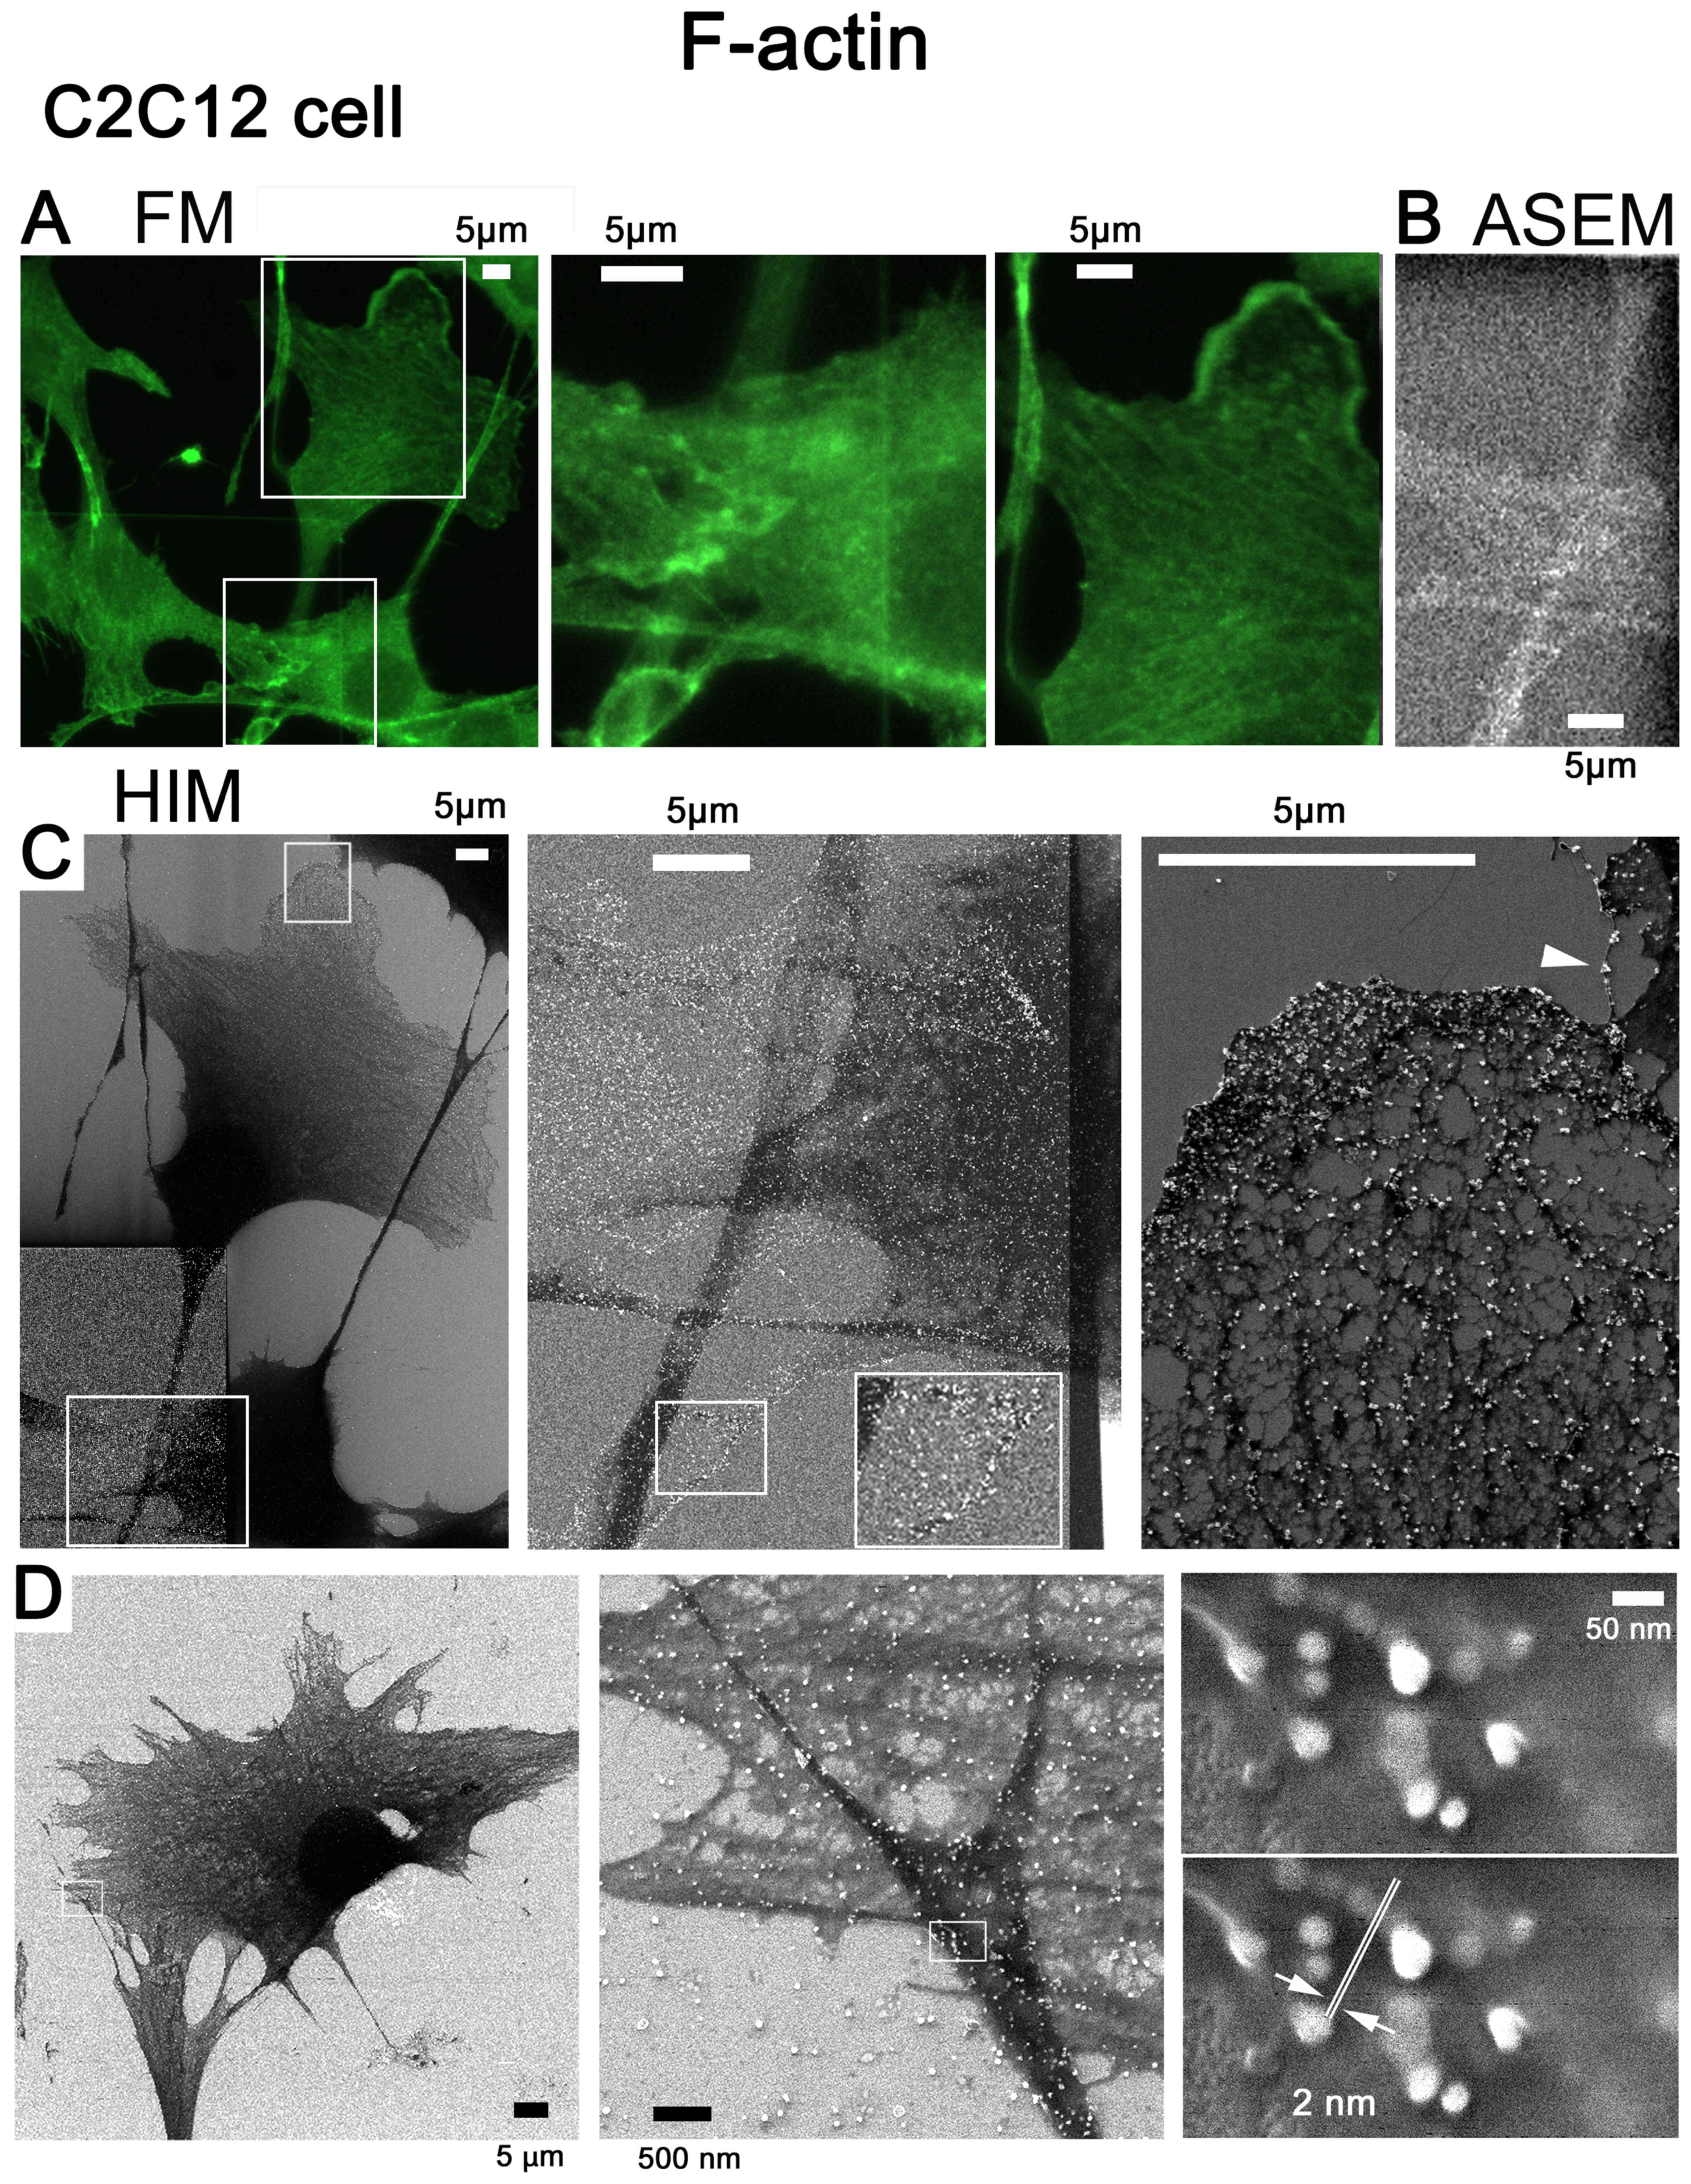 | Figure 6Au-labeled F-actin in C2C12 cells on
SiN film and SiN/Si bilayer substrates, and the resolution of
SE-HIM. (A-D) F-actin in C2C12 cells was tagged with
fluorescence/Au. (A-C) Cells were cultured in an ASEM dish and
imaged on the SiN film and SiN/Si-bilayer. (A) Fluorescence
microscopy; center and right, corresponding enlarged views. (B) Au
visualized by ASEM; compare A center panel. (C) SE-HIM; compare A
and B. Cells and their thin lamellipodia were dark, particularly on
the SiN film at the bottom left (brightness and contrast adjusted
to make the signal visible). Center and right, higher magnification
images of the marked areas. Au signals can be discerned along
filamentous structures in the cytoplasm and in the lamellipodia, as
well as in the philopodia (white arrowhead) of cells on the SiN/Si
bilayer, on the F-actin network and at the edge of the cell. (D)
Resolution was measured using similarly labeled cells cultured on a
SiN/Si chip. Au was imaged at various magnifications by SE-HIM.
Left, 1,143x; center, 22,860x; right, 228,600x; the measurement
indicated in the lower of the two otherwise identical panels in the
right frame showed the resolution to be 2 nm. ASEM, atmospheric
scanning electron microscopy; Au, gold; F-actin, filamentous-actin;
SE-HIM, secondary electron-helium ion microscopy; SiN/Si, silicon
nitride/silicon. |
All three types of microscopy clearly revealed actin
stress fibers in the cell bodies (Fig. 7B, H and M, arrows and arrowheads)
and filopodia (Fig. 7B, C, I, J and
L, O–R) of correspondingly labeled COS7 cells. Actin fibers
that passed below nuclei, which were imaged from below in solution
by ASEM (Fig. 7H, arrowheads),
were not visible from above by SE-HIM (Fig. 7M); the observable specimen
thickness of ASEM is 2–3 µm from the SiN film surface,
whereas the height of COS7 cells usually exceeds 7 µm in
solution.
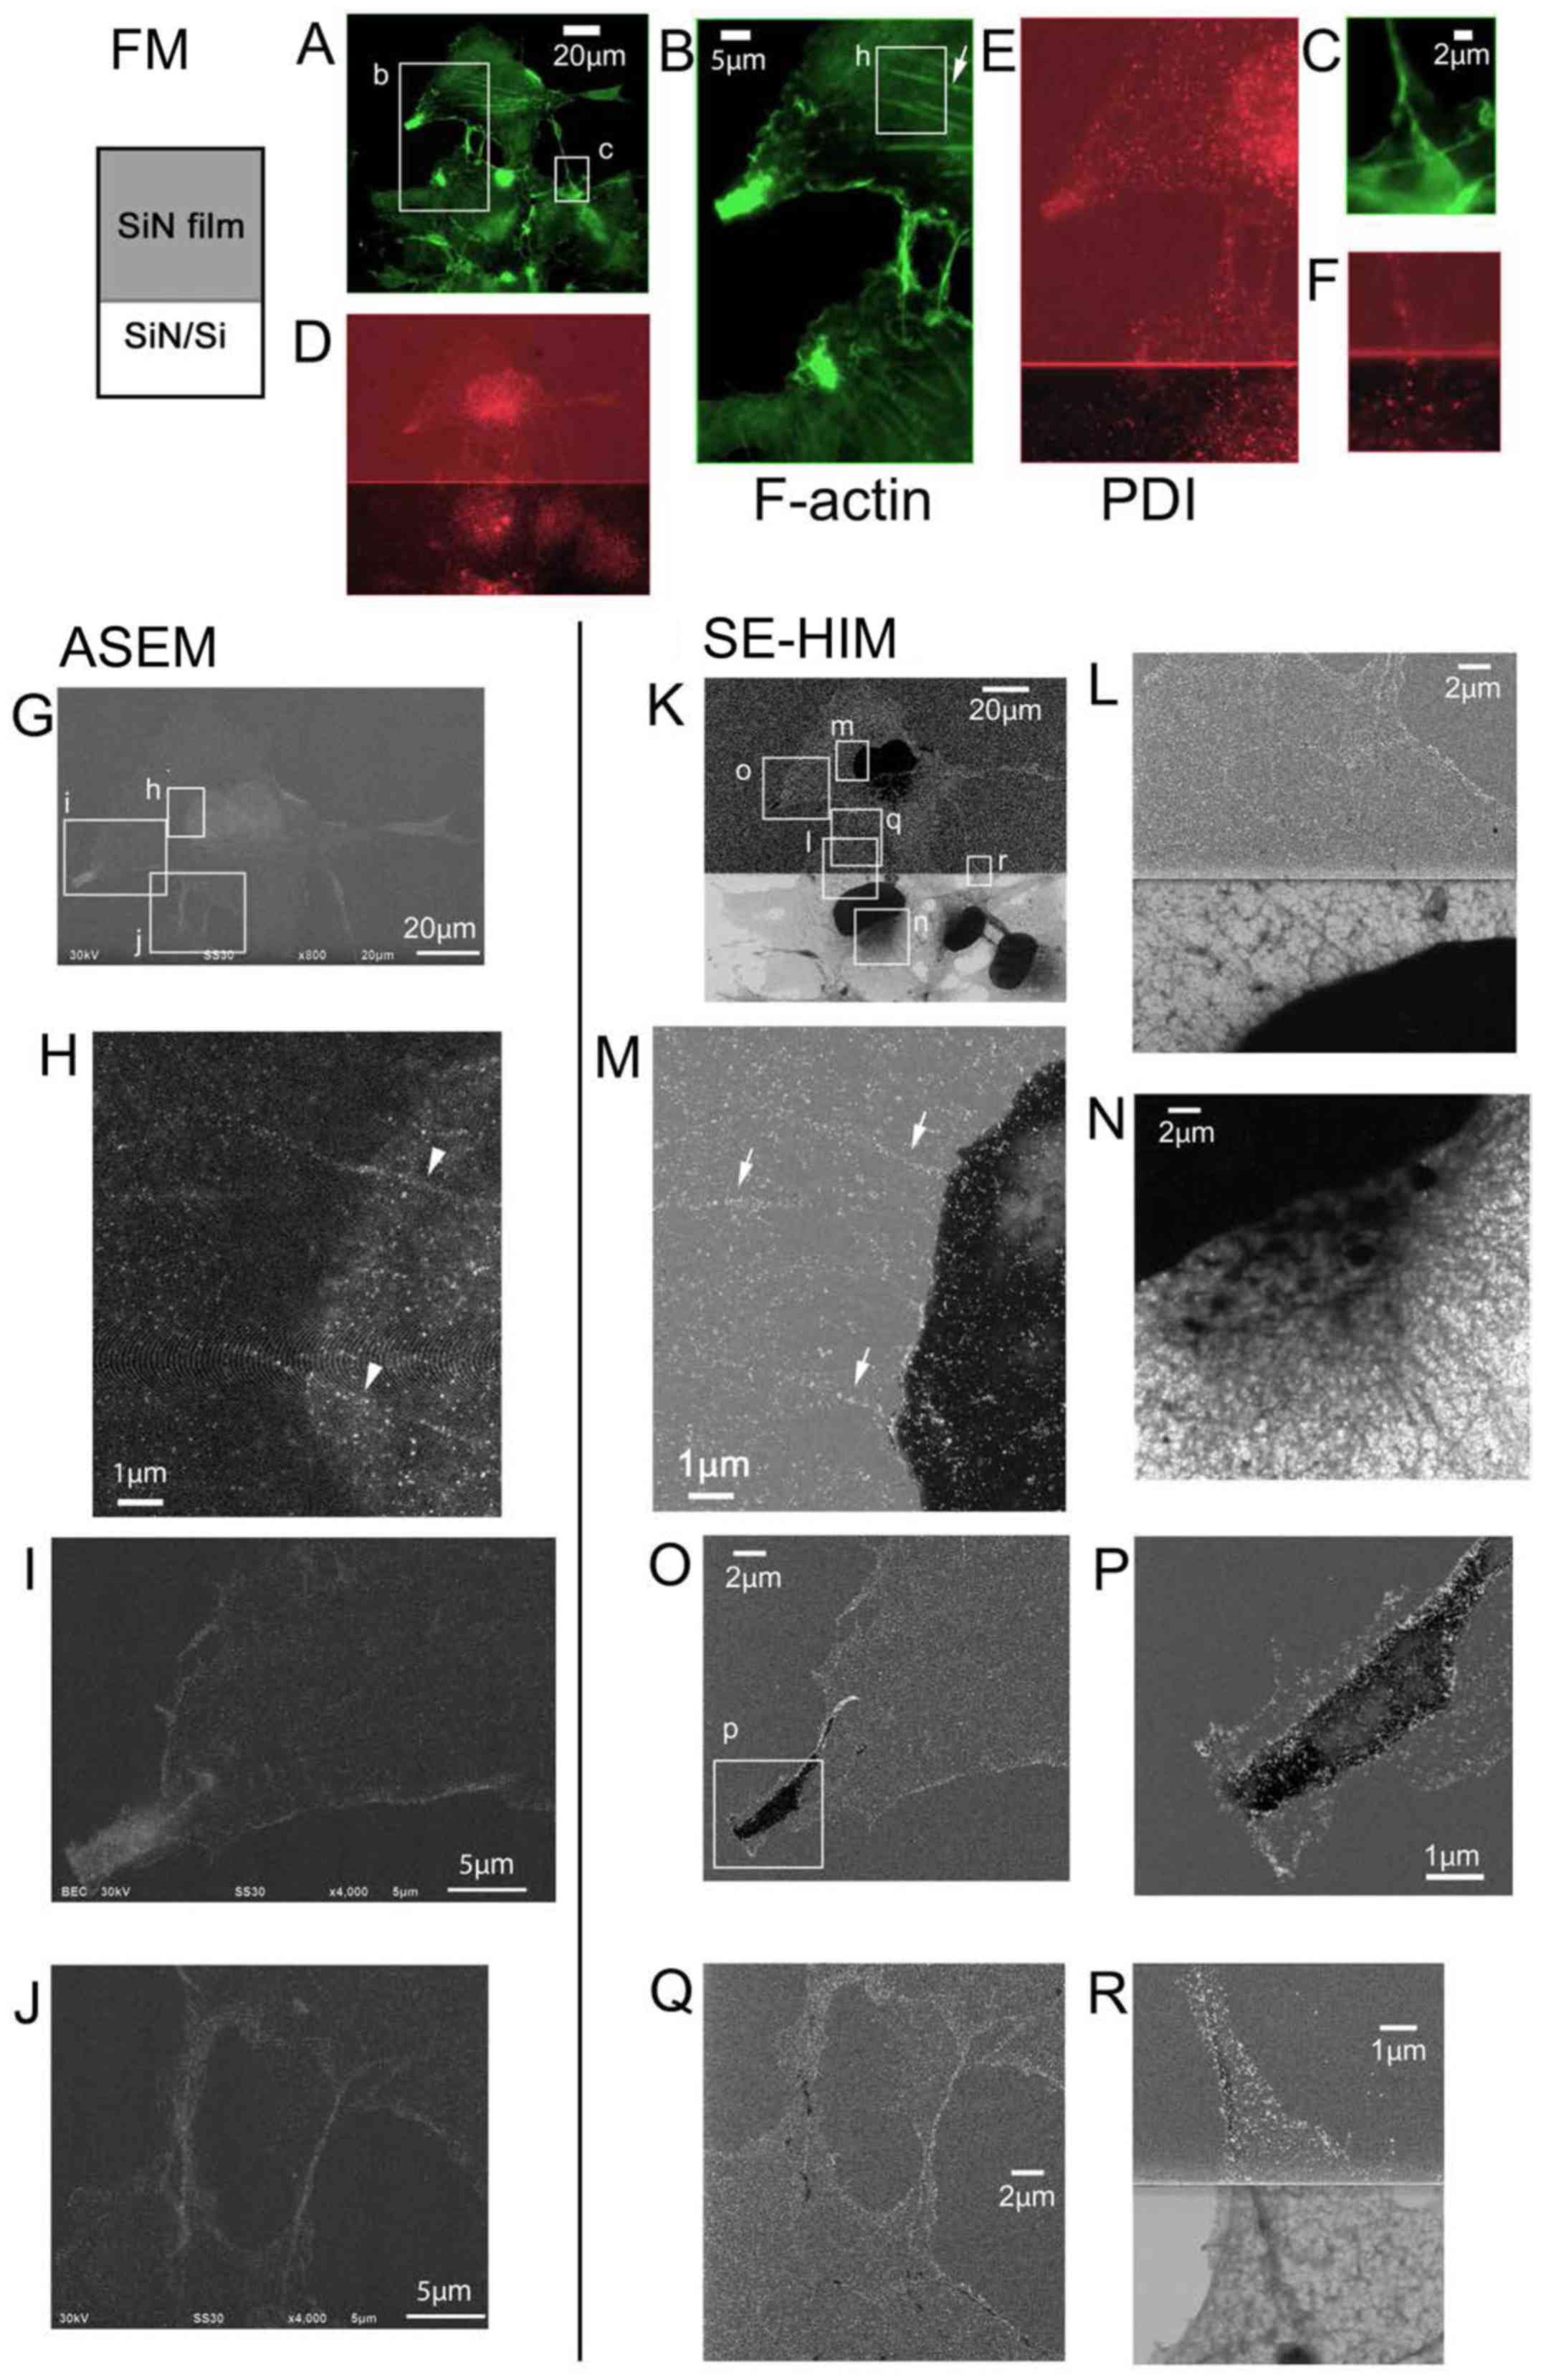 | Figure 7Au-labeled F-actin in COS7 cells.
F-actin and PDI were tagged with Alexa Fluor® 488
fluorescence/Au and Alexa Fluor® 594, respectively. The
cells were close to or across the boundary between the
SiN/Si-bilayer and SiN film of the ASEM dish. The influence of the
substrate can be discerned. (A-C) FM of F-actin. (A) Larger field.
(B) Enlarged view of b in A. (C) Enlarged view of c in A. (D-F) FM
of PDI; same fields as A, B and C, respectively. (G-J) ASEM. (G)
The cell imaged in the upper region of A. (H) Enlarged image of h
in G. (I) Enlarged image of i in G. (J) Enlarged image of j in G.
(K-R) SE-HIM. (K) Image corresponding to A. (L-R) Enlarged images
of rectangles l-r in K and of the rectangle p in O, respectively.
Au signals can be clearly distinguished, particularly on the SiN
film. In the ASEM and SE-HIM images, signals from Au-labeled
F-actin formed rows indicating the presence of various filaments in
the cytoplasm. (H and M) Regions of actin fibers passing below the
nuclei and imaged from below by ASEM (arrowheads), were not visible
from above by SE-HIM. ASEM, atmospheric scanning electron
microscopy; Au, gold; F-actin, filamentous-actin; PDI, protein
disulfide isomerase; SE-HIM, secondary electron-helium ion
microscopy; SiN/Si, silicon nitride/silicon. |
Au-labeled tubulin
Tagging the α-tubulin of COS7 cells with
fluorescence alone (Fig. 8), and
fluorescence and Au (Fig. 9)
allowed microtubules to be identified and distinguished from the ER
visualized by SE-HIM. In the fluorescence-labeled cells on the
SiN/Si substrate, FM and SE-HIM indicated that the distribution of
microtubules largely overlapped with the ER (Fig. 8). Differences were mainly evident
towards the cell periphery, allowing some moderately-dark fibers on
the SE-HIM images (Fig. 8F,
arrowheads) to be assigned as microtubules (Fig. 8C, arrowheads). In the dually
labeled cells on SiN film, microtubules appeared as lines of fine
white dots (Fig. 9G–J); the
signals were less clear on SiN/Si substrate (Fig. 9G, left). Some features observed by
ASEM were not evident on the HIM images, whereas others were
clearly revealed (Fig. 9C–J).
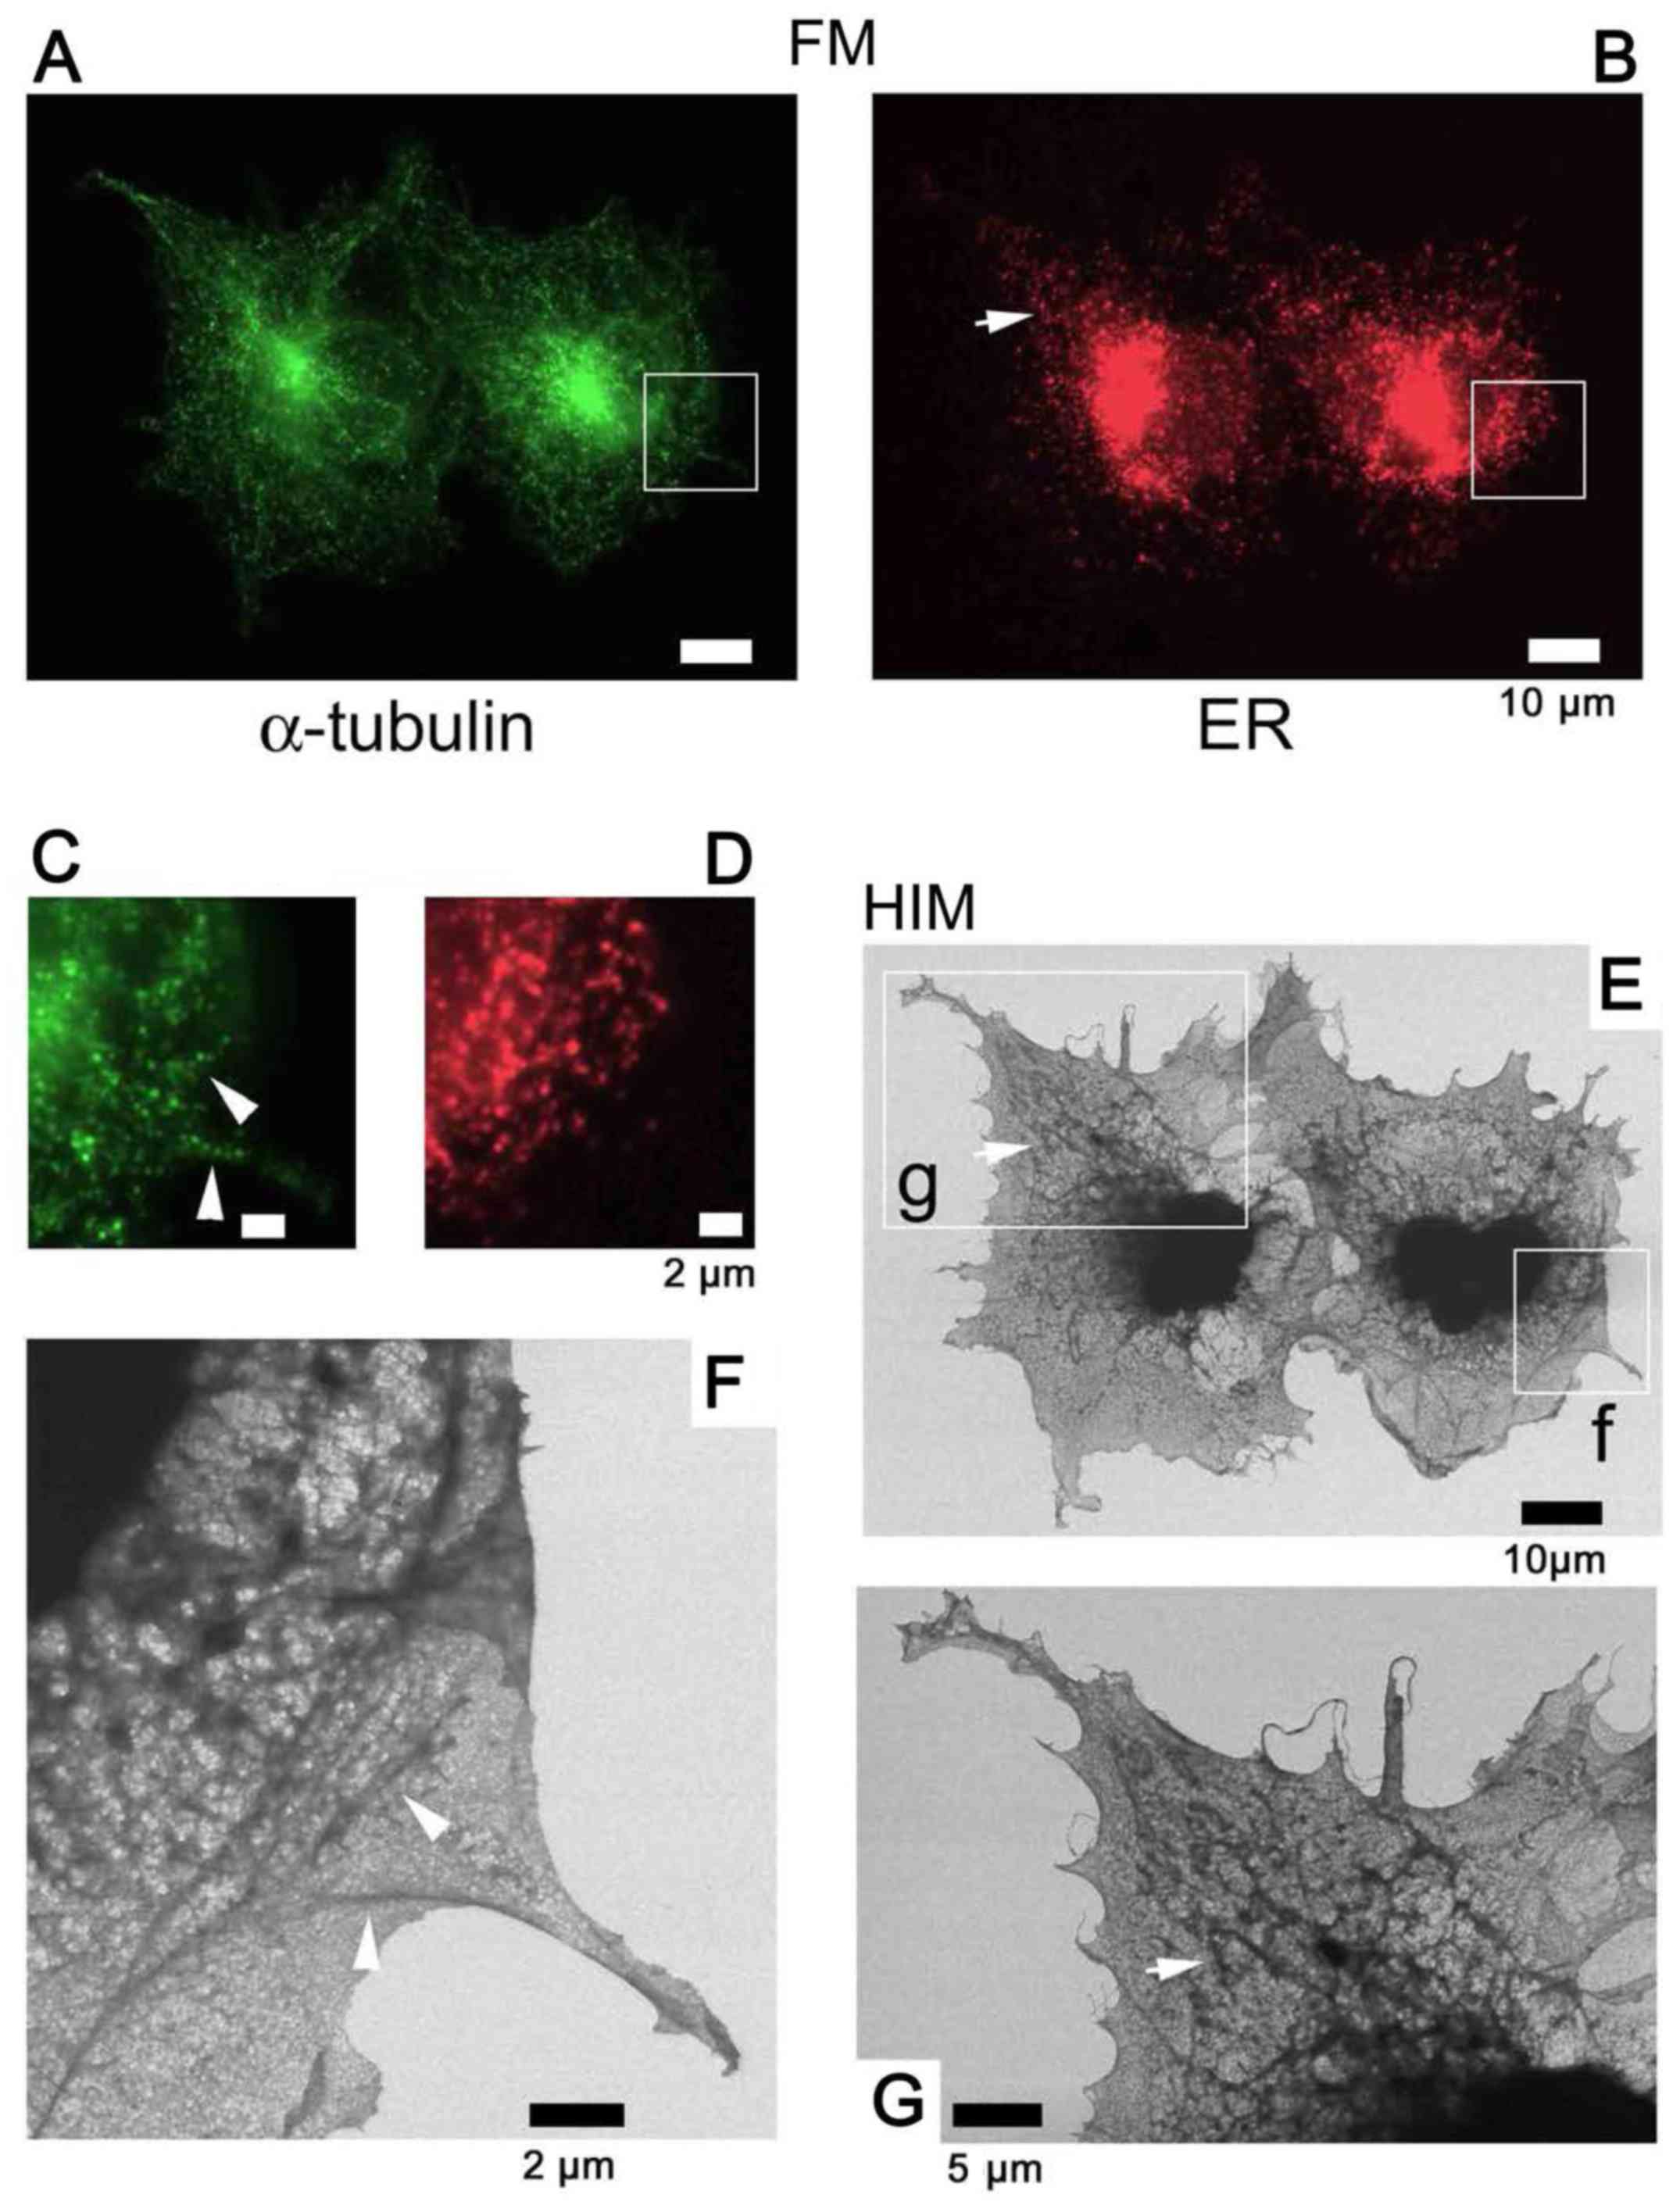 | Figure 8Use of fluorescence to identify
microtubules. To identify other bundle-like densities in COS7 cells
cultured on SiN/Si substrate, α-tubulin and PDI were tagged with
Alexa Fluor® 488 and Alexa Fluor® 594,
respectively, and observed by FM and further by SE-HIM. (A) FM of
α-tubulin. (B) FM of PDI in the same region. (C) Enlarged view of
the rectangle in A. (D) Enlarged view of the corresponding
rectangle in B. (E) SE-HIM, corresponding to A. (F) Image of
rectangle f in E. (G) Image of rectangle g in E. Both FM and SE-HIM
indicated that the distribution of microtubules largely overlapped
the endoplasmic reticulum. Differences are mainly evident towards
the cell periphery, allowing some moderately-dark fibers on the
SE-HIM images (F, arrowheads) to be assigned as microtubules:
Compare E and G with A and B, arrows indicate features that are
also recognizable in PDI fluorescence images; compare F with C and
D, arrowheads indicate features that are also recognizable in the
α-tubulin fluorescence images. FM, fluorescence microscopy; PDI,
protein disulfide isomerase; SE-HIM, secondary electron-helium ion
microscopy |
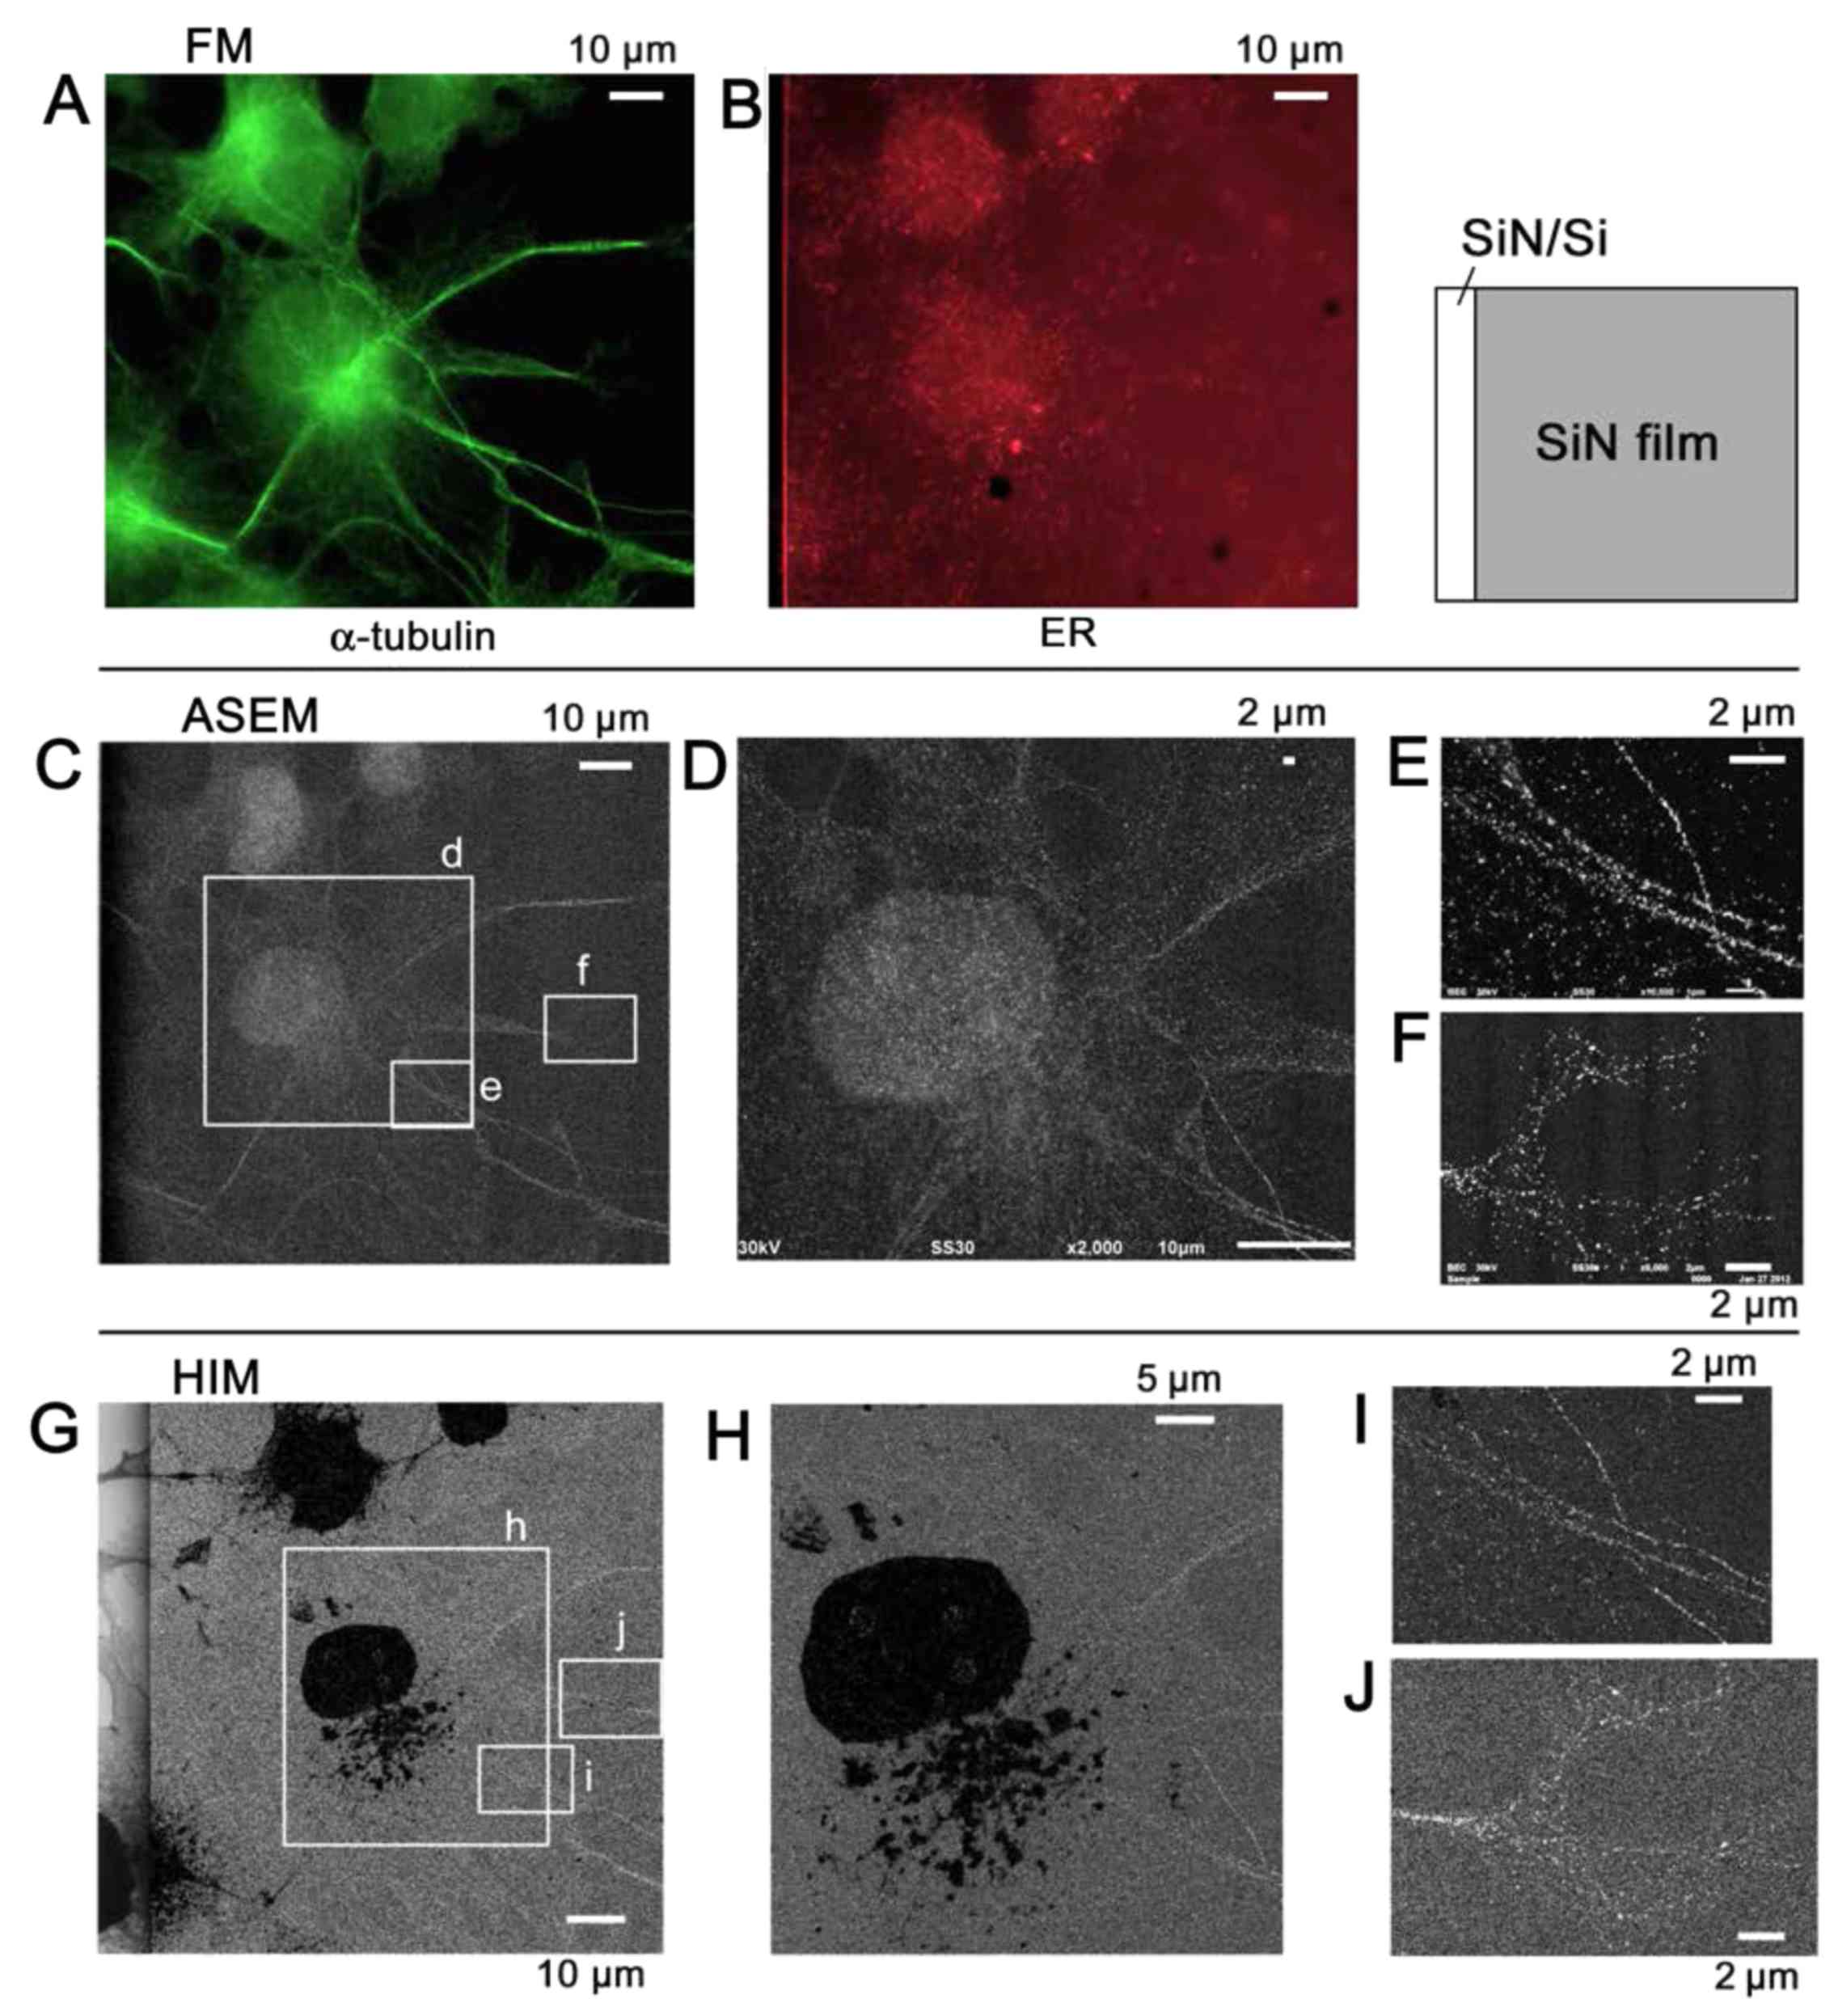 | Figure 9Immuno-SE-HIM of α-tubulin in COS7
cells. The use of Au labels and SE-HIM is essential to distinguish
the microtubules of COS7 cells. α-tubulin and PDI in COS7 cells
cultured on an ASEM dish, were tagged with Alexa Fluor®
488-Nanogold and Alexa Fluor® 594, respectively. After
FM and confirmation of Au labeling by ASEM, dehydrated/dried cells
were observed by SE-HIM. (A) FM of α-tubulin. (B) FM of PDI in the
same region. (C) ASEM, almost corresponding to A. (D) Image of
rectangle d in C. (E and F) Image of rectangles e and f in C,
respectively. (G-J) SE-HIM. (G) SE-HIM corresponding to A; the
boundary between the SiN/Si bilayer and the SiN film can be seen.
The nucleus and endoplasmic reticulum are very dark, but there are
still bright filaments in the cytoplasm; compare C. (H) Image of
rectangle h in G. (I) Image of the rectangle i in G. The
filamentous lines are comprised of white dots, i.e., signals from
Au sedimentation. (J) Image of rectangle j in G. Microtubules in
filopodia were visualized by this method. The SE-HIM and ASEM
images appear similar, with the exception of the inversely
contrasted organelle. ASEM, atmospheric scanning electron
microscopy; Au, gold; FM, fluorescence microscopy; PDI, protein
disulfide isomerase; SE-HIM, secondary electron-helium ion
microscopy; SiN/Si, silicon nitride/silicon. |
WGA-15 nm colloidal Au-labeled COS7
cells
Non-permeabilized COS7 cells were labeled with
WGA-Au conjugate and imaged by SE-HIM (Fig. 10). Some of the Au particles on
the surface of the cells were clustered, forming patches ~50–200 nm
in diameter. This might represent the gathering of glycosylated
proteins, suggesting the presence of membrane raft structures that
include membrane proteins. Again, 2 nm resolution was achieved.
 | Figure 10WGA-colloidal gold-labeled surface
glycan of COS7 cells. Surface glycans were labeled with
WGA-colloidal Au conjugates (15 nm in diameter) on COS7 cells
cultured on a SiN/Si chip. Au was imaged at various magnifications
by SE-HIM. Clusters of WGA-Au particles ~50–200 nm in diameter were
observed on COS7 cells. These might represent the gathering of
glycosylated proteins, suggesting the presence of membrane raft
structures that include membrane proteins. Left, 1,524x; center,
45,720x; right, 228,600x; the measurement indicated in the lower of
the two otherwise identical frames of the right panel showed the
resolution to be 2 nm. Au, gold; SE-HIM, secondary electron-helium
ion microscopy; SiN/Si, silicon nitride/silicon; WGA, wheat germ
agglutinin. |
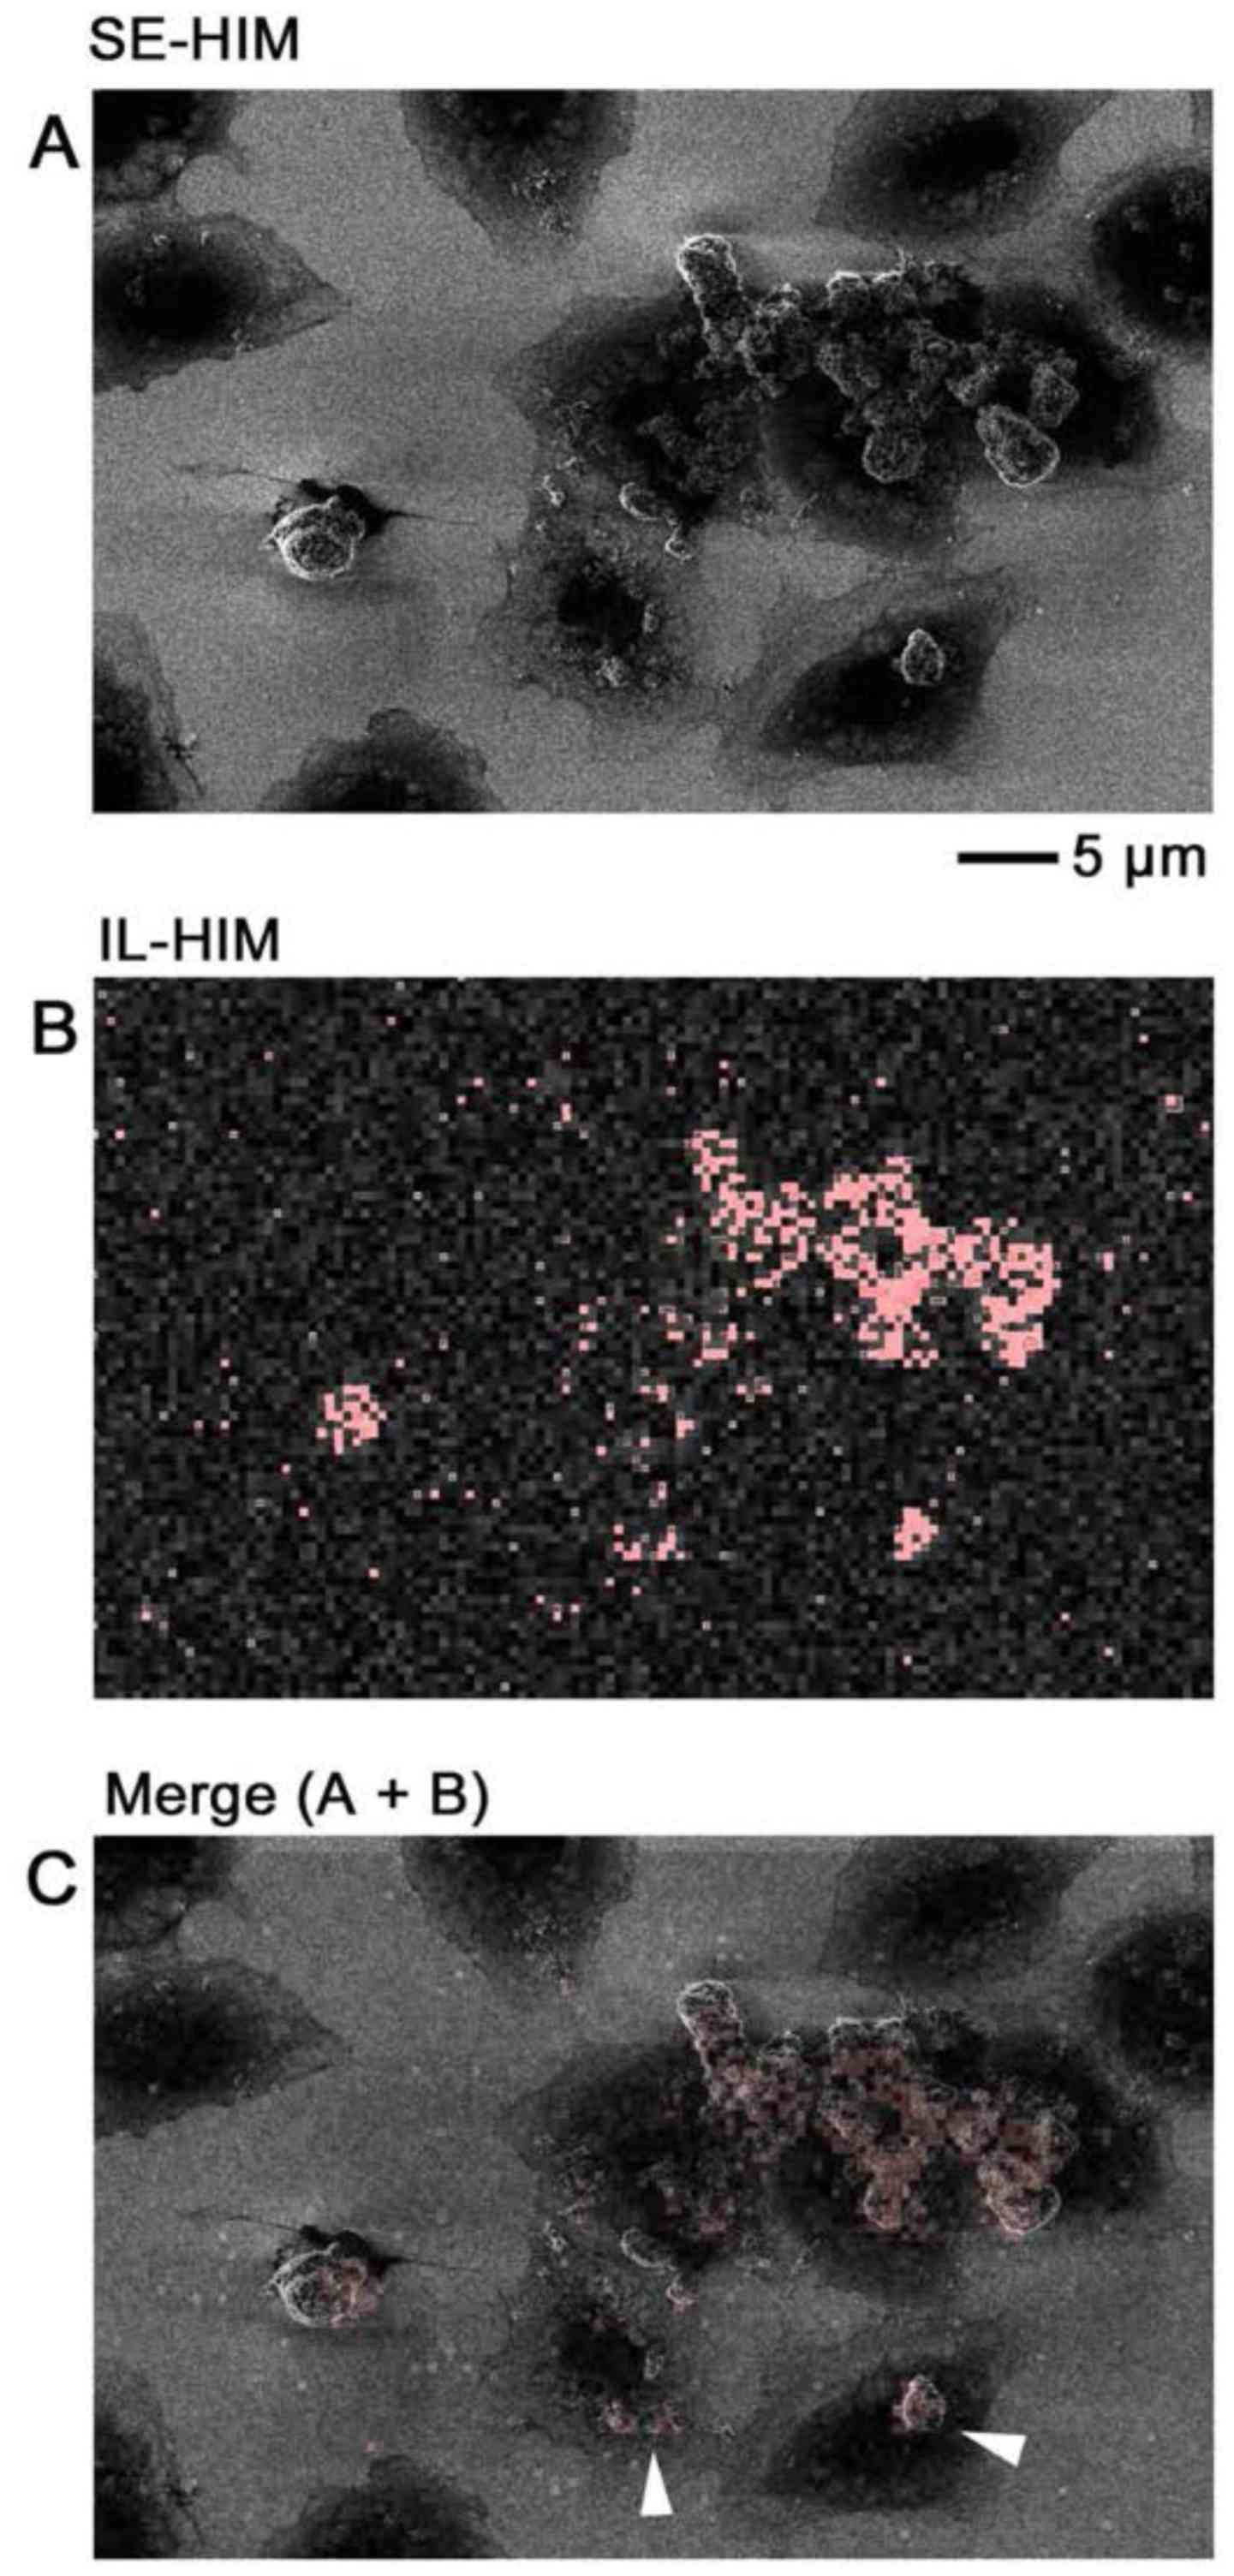
IL-HIM
IL-HIM was developed to realize multicolored
labeling/imaging that is detectable regardless of the cellular
structures above epitopes. Fixed COS7 cells with ZnO-NPs were
examined on a SiN/Si support. Signals corresponding to the ZnO-NPs
were clearly detected above very little cell background (Fig. 11). Until recently (2) the SE emission caused by a
He+ beam was considered too little to yield detectable
electron excitation-triggered fluorescence.
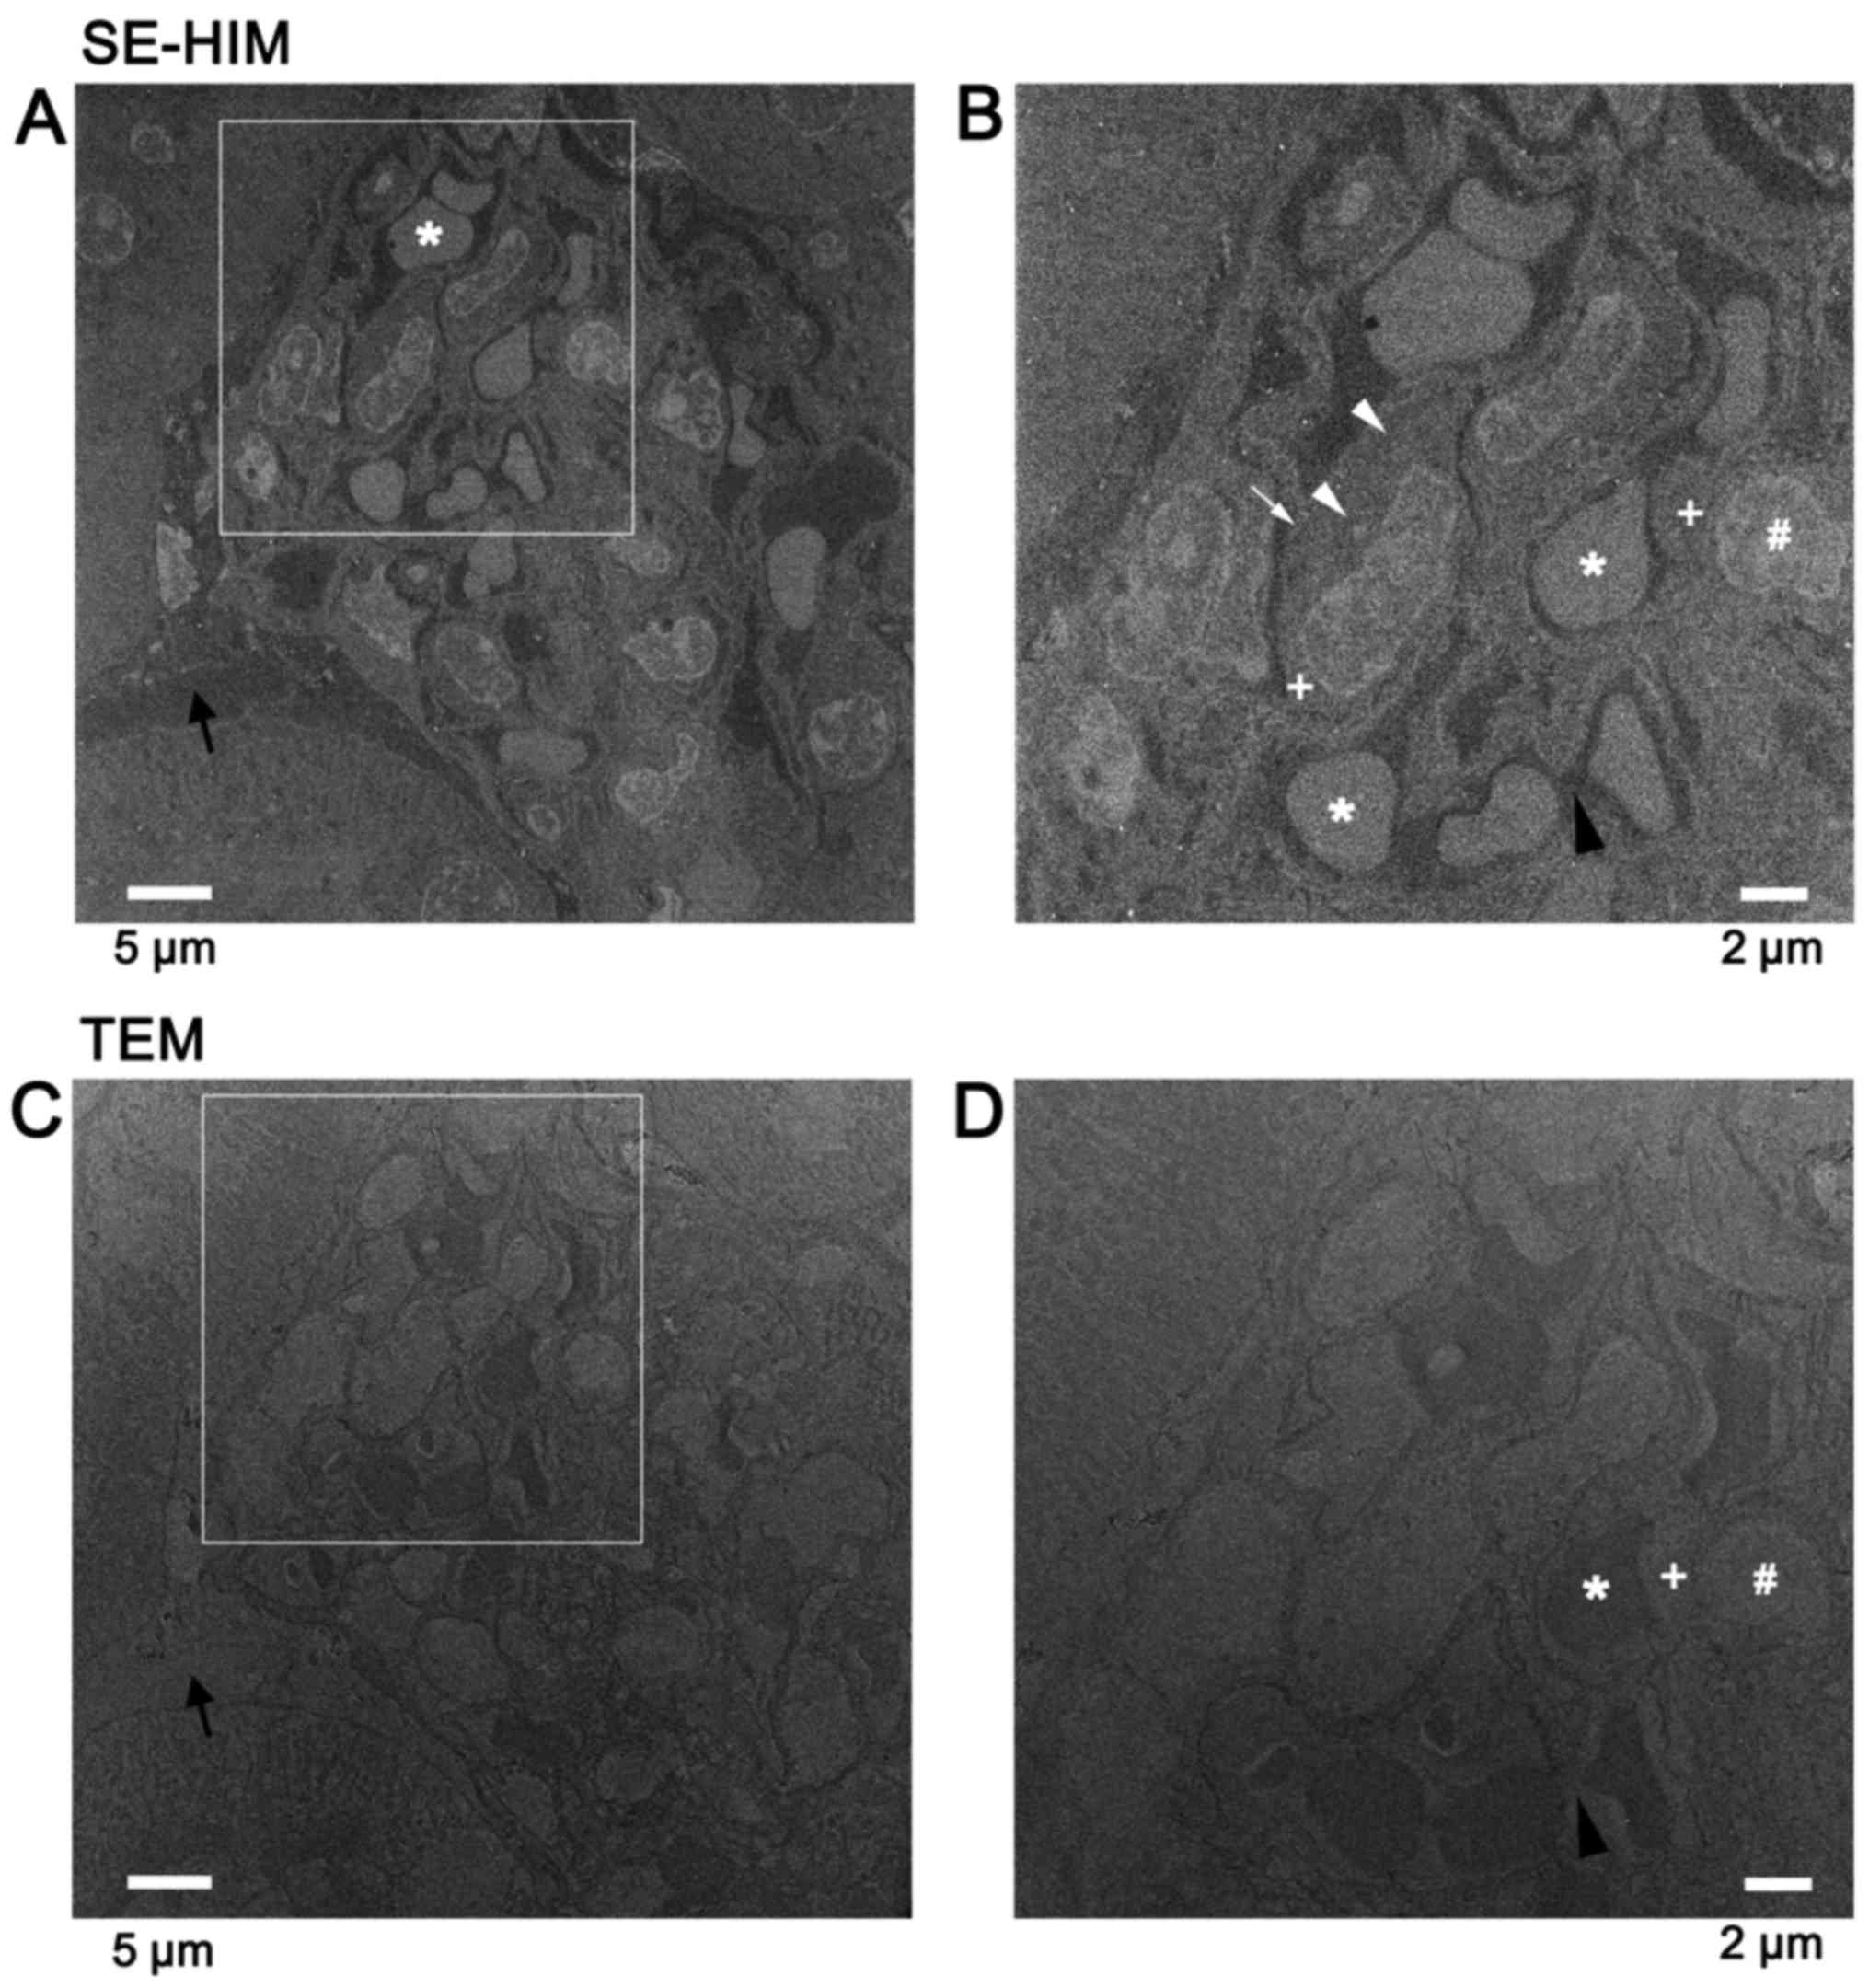
Epon-embedded tissue sections
High contrast images were recorded from unstained,
uncoated thin sections of mouse kidney tissue embedded in Epon by
SE-HIM, revealing detailed features of sub-tissues and cell
organelles (Fig. 12A and B). The
contrast was sometimes the inverse of that delivered by TEM
(Fig. 12C and D) and also of
SE-HIM images of dehydrated/dried cells (Figs. 1Figure 2Figure 3Figure 4Figure 5Figure 6Figure 7Figure 8Figure 9–10). In the latter case this was due to
the presence of Epon; Epon-filled spaces are dark in SE-HIM images
(Fig. 12A and B).
Discussion
The present study was designed to observe uncoated
and unstained cells by HIM (16)
and gain information about the biological systems. The results
indicated that the lack of intracellular details in SE-HIM images
of uncoated cells in a previous study (10) is associated with the electrical
conductivity of the sample, substrate and surroundings.
The SiN/Si substrate provided a backlight effect on
SE-HIM images, thus facilitating the visualization of cytoskeletal
protein complexes and intracellular membrane systems in dried
cells. Variations in ER thickness were detectable, and the clarity
with which mitochondria were imaged may allow the study of
mitochondria-associated diseases and apoptosis. Notably, the
cytoskeleton that was quite prominent on SiN/Si supports readily
became invisible on SiN film, which provided less backlight.
The visibility of Au labels employed in
immuno-SE-HIM was associated with both the substrate and the
structure covering the Au. The reduced background signal from SiN
film allowed the Au sediments labeling F-actin, tubulin and the ER
to be clearly detected. Detection was more difficult on SiN/Si due
to the bright background, and depended on where the labeled
structure was localized in the cell. As it is ubiquitously
distributed, clear signals from F-actin were always observed, but
not from the relatively internal microtubules and ER. Notably,
signals were registered from an F-actin filament situated close to
the cell bottom, i.e., the DOF of SE-HIM and the thickness of the
dried cell were comparable.
Uncoated, unstained thin kidney tissue sections were
imaged with unprecedented clarity by SE-HIM. The contrast was often
the inverse of the contrast delivered by TEM. TEM images basically
reflect the electron density and mass thickness of the sample.
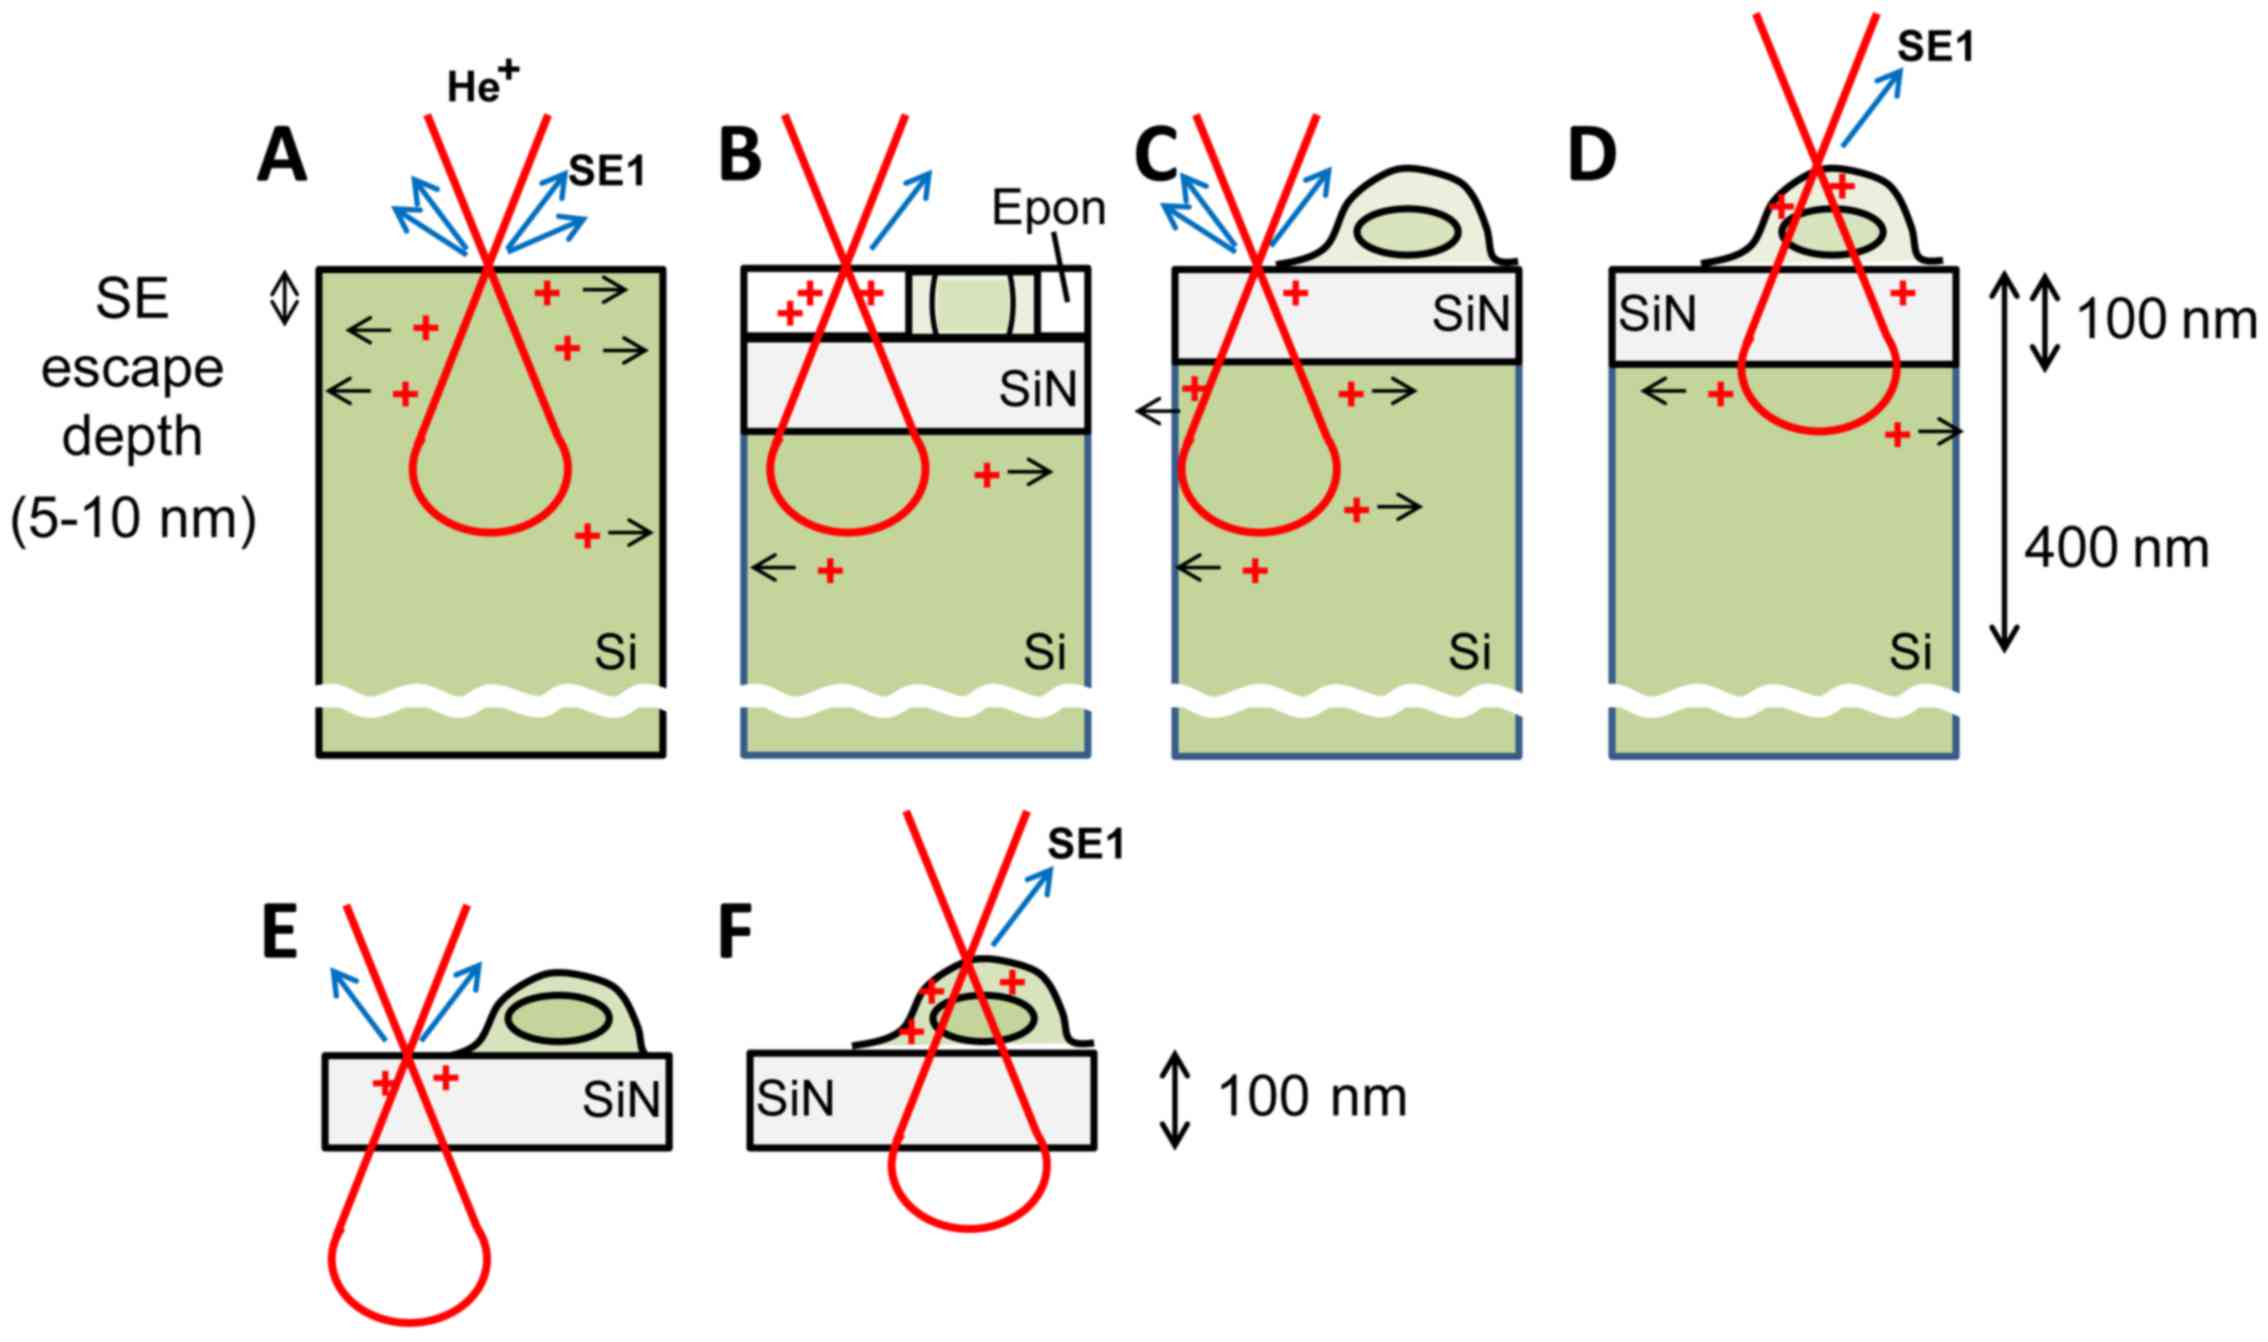
According to Monte-Carlo simulations, the
He+ beam penetrates a Si substrate to a depth of a few
hundred nanometers (4,6) (Fig.
13) and the escape depth of the generated SEs is 5–10 nm.
However, SE-HIM of uncoated, unstained cells on SiN/Si or SiN film
revealed structures at greater depth, thus suggesting that the
He+ beam penetrates at least the cell and a 100 nm SiN
film. Two effects contribute to the observed contrast: (i) SE
emission related to atomic number and density of the sample surface
(5–10 nm depth) and (ii) emission blockage by the positive charges
accumulating due to the He+ beam; the degree will depend
on the electrical conductivity of the material. Like SiN, Epon
resin is an insulator; when uniformly thin sections mounted on
SiN/Si are irradiated by He+, positive charges will
accumulate, and preclude SE emission from the surface. Although the
possibility of SE emission directly from within the DOF still
cannot be entirely excluded, the pixel darkness in the images may
primarily reflect the degree of blockage, which will be decreased
by electron-conducting components (Fig. 13B, green). Contrast variations
arising from surface density variations are considered
comparatively small, as the density of Epon resin is similar to
that of lipids and proteins. Accordingly, the bright intensity of
red blood cells is probably explained by the conductive nature of
iron-associated proteins.
The inverse contrast of dried cells on SiN/Si is
attributable to differences in the substance surrounding the cell
components (vacuum vs. Epon) and to the thickness of the cells.
Most charges generated in the thin insulating SiN layer will be
directly dissipated by the underlying Si; SE emission will not be
inhibited, and the corresponding image regions will be bright.
Being insulators like Epon (17),
phospholipid membranes will partially block SE emission, i.e.,
cells will be comparatively dark. The contrast of very thin
filopodia or lamellipodia will be less as the He+ beam
is primarily scattered in the substrate (Fig. 13C). In the middle of the cell,
the He+ beam is mainly scattered in the thick cell body
(Fig. 13D). Structures with
higher density and large atomic number scatter more, creating more
positive charges, which further accumulate as the underlying
intracellular lipid membrane inhibits their dissipation. These
regions are therefore darker on the images.
SE-HIM images of SiN film alone and of the cells on
it, are comparatively dark. This is because the insulator film is
not lined by a conductor; positive charges formed by He+
irradiation easily accumulate precluding SE emission (Fig. 13E) and the effect is more
pronounced when a cell is present (Fig. 13F). However, unless they were
covered by large membranous cell organelles, Au sediments were
clearly visible. Since Au is a conductor, it can efficiently
dissipate accumulated charge to the surroundings. This will
alleviate charging near the surface and facilitate SE emission.
The contrast of SE-HIM might be related to the
'voltage contrast' observed when insulator or insulator
semiconductor composites are imaged by SE-SEM (18). Voltage contrast is affected by the
dielectric constant of the irradiated material and by the
beam-induced current (conductivity) (18). These factors might also influence
the contrast of SE-HIM in the present study, although the electron
beam used for SE-SEM is substituted by a He+ beam in
SE-HIM.
The 2 nm resolution obtained for labeled-Au
particles is one of the most attractive features of HIM. However,
in immunolabeling experiments, the localization accuracy of
antigens is also affected by the labeling system. Due to the
flexibility and size of the primary antibody and secondary Fab',
the distance between the Au particle and the antigenic site can be
as much as 15 nm. Therefore, in spite of the resolution of HIM, the
total localization accuracy is not better than the localization
accuracy achieved using Au-labeling and conventional TEM or SEM, or
fluorescence labeling and optical microscopy including
photo-activated localization microscopy/stochastic optical
reconstruction microscopy, structured illumination microscopy and
stimulated emission depletion microscopy. The accuracy of
immuno-SE-HIM can be improved by Au-conjugated Fab' labeling, which
avoids the use of a secondary antibody. If Nanogold-Fab' labeling
was combined with Au enhancement, the labeling density would
probably be higher than the labeling density obtained with standard
colloidal-Au-Fabs' employed for immuno-SE-HIM. The use of such
labeling is expected to make high-resolution immuno-SE-HIM of deep
specimen zones possible.
Cathode luminescence-based SEM and scanning TEM are
widely used in material science (19). As demonstrated in the present
study, IL-HIM can image ZnO-NPs above a dark background, and it has
the potential to visualize signals behind nuclei and thick ER.
Combined with multiple fluorescent labeling, IL-HIM promises
multi-color-labeled microscopy at high-resolution, and -position
accuracy, which would be useful to study the formation of molecular
complexes. Fluorescent NP probes (20) directly bound to Fab' prepared from
primary antibodies are required for this purpose.
In conclusion, the ability of HIM to realize high
DOF observations for dried cells and Epon-embedded tissues, to
detect Au tags employed in immunohistochemistry at high resolution
and to exploit the IL signal make this microscopy an important and
versatile novel tool for cell/tissue studies. A wide variety of
Epon-based sample preparation methods developed in biological and
medical science fields can now be tested. High-dose milling and
mild-dose imaging by HIM could possibly be used in combination with
EM for various 3D structure analyses. In addition, in the future,
HIM of unstained and uncoated samples is expected to be applied in
the fields of soft materials.
Abbreviations:
|
ASEM
|
atmospheric SEM
|
|
BEI
|
backscattered electron imaging
|
|
DAPI
|
4′,6-diamidino-2-phenylindole
|
|
EM
|
electron microscopy
|
|
ER
|
endoplasmic reticulum
|
|
F-actin
|
filamentous-actin
|
|
HIM
|
helium ion microscopy
|
|
PDI
|
protein disulfide isomerase
|
|
SE
|
secondary electron
|
|
SEM
|
scanning electron microscopy
|
|
SiN
|
silicon nitride
|
|
TEM
|
transmission electron microscopy
|
Acknowledgments
The authors would like to thank Dr T. Ebihara at the
National Institute of Advanced Industrial Science and Technology
(AIST) for valuable discussions. The authors would also like to
thank Mr. T. Iijima (AIST) and Dr Y. Morita (AIST) for the
operation of the HIM at SCR station of AIST.
References
|
1
|
Ananth M, Scipioni L and Notte J: The
helium ion microscope: The next stage in nanoscale imaging. Am Lab.
40:42–46. 2008.
|
|
2
|
Boden SA, Franklin TMW, Scipioni L,
Bagnall DM and Rutt HN: Ionoluminescence in the helium ion
microscope. Microsc Microanal. 18:1253–1262. 2012. View Article : Google Scholar : PubMed/NCBI
|
|
3
|
Bell DC: Contrast mechanisms and image
formation in helium ion microscopy. Microsc Microanal. 15:147–153.
2009. View Article : Google Scholar : PubMed/NCBI
|
|
4
|
Cohen-Tanugi D and Yao N: Superior imaging
resolution in scanning helium-ion microscopy: A look at beam-sample
interactions. J Appl Phys. 104:063501–063507. 2008. View Article : Google Scholar
|
|
5
|
Inai K, Ohya K and Ishitani T: Simulation
study on image contrast and spatial resolution in helium ion
microscope. J Electron Microsc (Tokyo). 56:163–169. 2007.
View Article : Google Scholar
|
|
6
|
Postek MT, Vladar A, Archie C and Ming B:
Review of current progress in nanometrology with the helium ion
microscope. Meas Sci Technol. 22:024001–024014. 2011. View Article : Google Scholar
|
|
7
|
Morgan J, Notte J, Hill R and Ward B: An
introduction to the helium ion microscope. Micros Today. 14:24–31.
2006. View Article : Google Scholar
|
|
8
|
Notte J, Hill R, McVey S, Farkas L,
Percival R and Ward B: An introduction to the helium ion
microscope. Microsc Microanal. 12:126–127. 2006. View Article : Google Scholar
|
|
9
|
Rice WL, Van Hoek AN, Păunescu TG, Huynh
C, Goetze B, Singh B, Scipioni L, Stern LA and Brown D: High
resolution helium ion scanning microscopy of the rat kidney. PLoS
One. 8:e570512013. View Article : Google Scholar : PubMed/NCBI
|
|
10
|
Bazou D, Behan G, Reid C, Boland JJ and
Zhang HZ: Imaging of human colon cancer cells using He-Ion scanning
microscopy. J Microsc. 242:290–294. 2011. View Article : Google Scholar
|
|
11
|
Chen X, Udalagama CNB, Chen C-B, Bettiol
AA, Pickard DS, Venkatesan T and Watt F: Whole-cell imaging at
nanometer resolutions using fast and slow focused helium ions.
Biophys J. 101:1788–1793. 2011. View Article : Google Scholar : PubMed/NCBI
|
|
12
|
Maruyama Y, Ebihara T, Nishiyama H, Suga M
and Sato C: Immuno EM-OM correlative microscopy in solution by
atmospheric scanning electron microscopy (ASEM). J Struct Biol.
180:259–270. 2012. View Article : Google Scholar : PubMed/NCBI
|
|
13
|
Memtily N, Okada T, Ebihara T, Sato M,
Kurabayashi A, Furihata M, Suga M, Nishiyama H, Mio K and Sato C:
Observation of tissues in open aqueous solution by atmospheric
scanning electron microscopy: Applicability to intraoperative
cancer diagnosis. Int J Oncol. 46:1872–1882. 2015. View Article : Google Scholar : PubMed/NCBI
|
|
14
|
Nishiyama H, Suga M, Ogura T, Maruyama Y,
Koizumi M, Mio K, Kitamura S and Sato C: Atmospheric scanning
electron microscope observes cells and tissues in open medium
through silicon nitride film. J Struct Biol. 169:438–449. 2010.
View Article : Google Scholar : PubMed/NCBI
|
|
15
|
Maunsbach AB and Afzelius BA:
Immunocytochemistry. Biomedical Electron Microscopy. Academic
Press; San Diego: pp. 383–426. 1999, View Article : Google Scholar
|
|
16
|
Ward BW, Notte JA and Economou NP: Helium
ion microscope: A new tool for nanoscale microscopy and metrology.
J Vac Sci Technol B. 24:2871–2874. 2006. View Article : Google Scholar
|
|
17
|
Kataoka-Hamai C and Miyahara Y:
Field-effect detection using phospholipid membranes. Sci Technol
Adv Mater. 11:033001–033005. 2010. View Article : Google Scholar : PubMed/NCBI
|
|
18
|
Ura K: Electron beam interaction with
specimen. Electron Beam Testing Technology. Thong JT: Springer; pp.
175–209. 1993, View Article : Google Scholar
|
|
19
|
de Abajo FJG: Optical excitations in
electron microscopy. Rev Mod Phys. 82:209–275. 2010. View Article : Google Scholar
|
|
20
|
Glenn DR, Zhang H, Kasthuri N, Schalek R,
Lo PK, Trifonov AS, Park H, Lichtman JW and Walsworth RL:
Correlative light and electron microscopy using cathodoluminescence
from nanoparticles with distinguishable colours. Sci Rep.
2:8652012. View Article : Google Scholar : PubMed/NCBI
|