Introduction
Type 2 diabetes mellitus (T2DM) is a metabolic
disorder characterized by hyperglycemia, which is mainly associated
with insulin resistance and a relative lack of insulin (1). In the case of insulin resistance,
impaired insulin signaling transduction inhibits the uptake of
circulating glucose by target tissues, which leads to elevated
blood glucose levels. A high caloric diet and a sedentary lifestyle
are reported to be the primary causes of T2DM in individuals
genetically predisposed to this disease (2,3).
Furthermore, the glucose metabolic disorders are usually
accompanied by lipid metabolic disorders and chronic inflammation
(4). Treatment with insulin
sensitizers is considered to be beneficial for patients with T2DM
and related metabolic disorders, although there is limited evidence
available so far. Therefore, the present study investigated the
treatment of T2DM via reversing insulin resistance and regulating
lipid metabolism.
The insulin-stimulated uptake of glucose in target
cells, including the liver, adipose tissues and muscles, is driven
by the insulin receptor-mediated signaling transduction pathway
(4). The binding of insulin to
the membrane-localized α-subunit of the insulin receptor (IR)
activates its intracellular β-subunit by tyrosine phosphorylation,
which triggers the sequential phosphorylation and activation of
downstream signaling molecules, including insulin receptor
substrate (IRS), phosphoinositide 3-kinase (PI3K) and AKT. This, in
turn, results in the translocation of intracellular glucose
transporter (GLUT) vesicles to the plasma membrane for the
transportation of extracellular glucose into cells. Numerous
factors impair the insulin signaling transduction by suppressing
the expression, or by inhibiting the activation of signaling
molecules. For example, the protein tyrosine phosphatase
non-receptor type 1 (PTPN1) gene can negatively regulate the
insulin signaling by dephosphorylating the residues of activated IR
via encoding protein-tyrosine phosphatase 1B (PTP1B). The
overexpression of PTP1B has been reported to induce insulin
resistance and obesity in adipose tissues and skeletal muscles of
humans and rodents (5). PTP1B can
also inhibit leptin receptor signaling by the dephosphorylation of
Janus kinase 2, which is a downstream signal of leptin receptor
(6,7). Gene knockout experiments have
provided substantial evidence regarding the role of PTP1B in the
regulation of insulin signaling and development of obesity. In
studies, mice lacking functional PTP1B exhibited increased insulin
sensitivity and resistance to obesity. Furthermore, PTP1B-knockout
mice fed with high-fat diets were found to be resistant to weight
gain and had significantly lower triglyceride levels (8,9).
Therefore, PTP1B is a potential target for the treatment of
diabetes and obesity-related metabolic disorders; thus the
development of PTP1B inhibitors has attracted considerable interest
(10-12). The present study aimed to target
the treatment of T2DM via reversing insulin resistance by
inhibiting PTP1B.
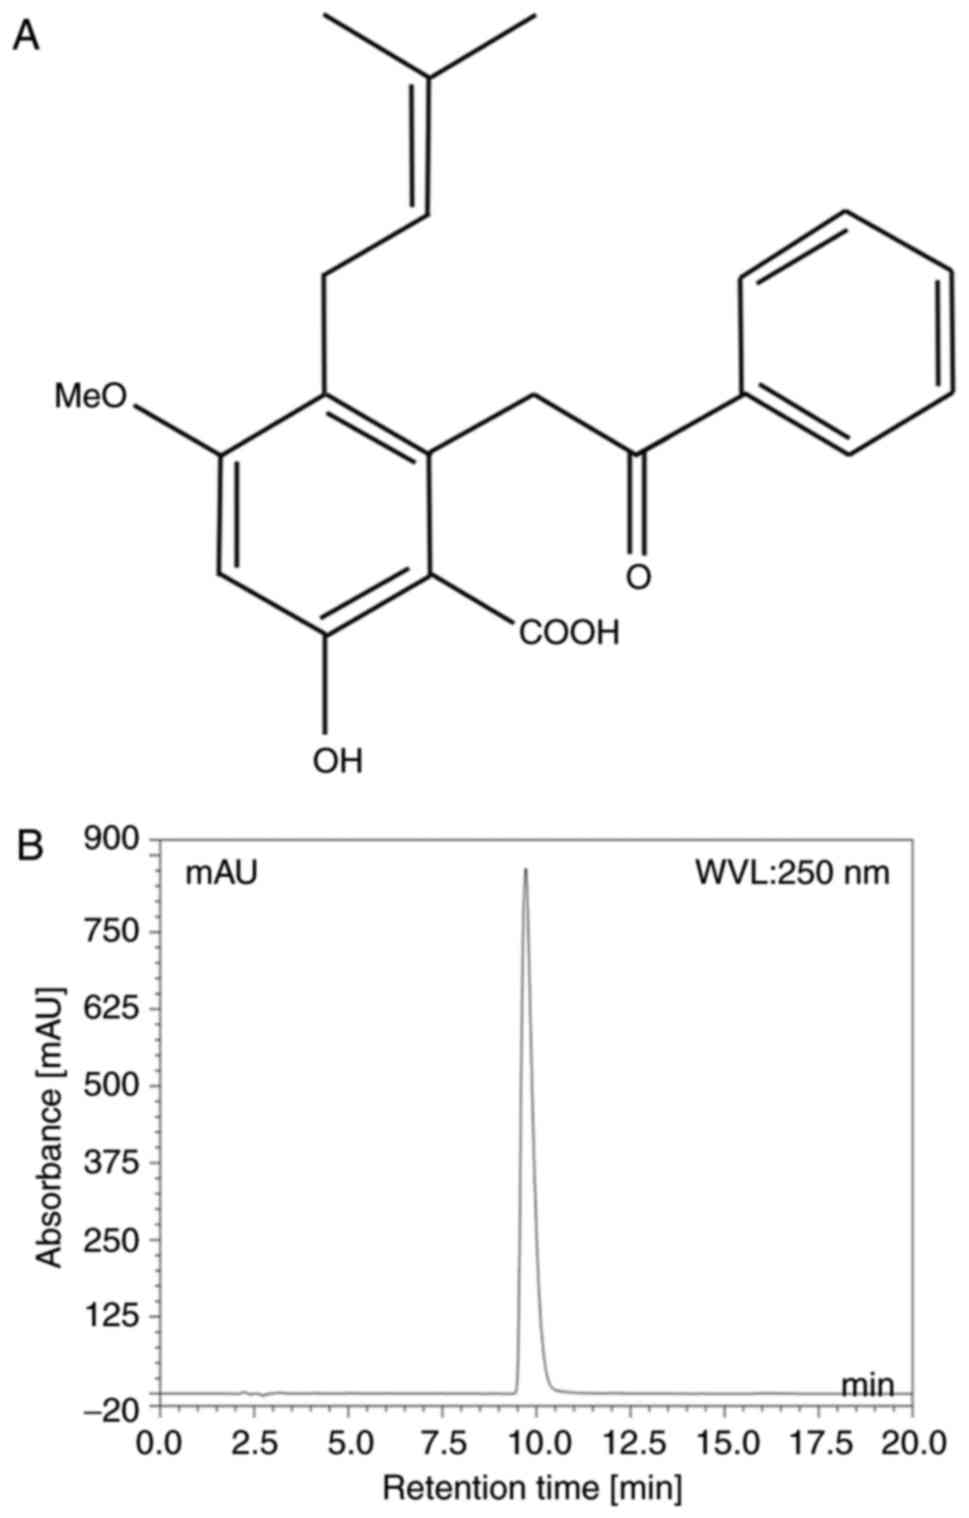
Cajanolic acid A (CAA; Fig. 1A) is a natural stilbene derivative
extracted from the leaves of Cajanus cajan (L.) Millsp. A
previous study reported that CAA can inhibit the activity of PTP1B.
Therefore, in the present study, CAA was extracted from the leaves
of C. cajan (L.) Millsp, and its effects on the regulatory
mechanisms of glucose and lipid metabolism were investigated in
cell models and animal models of T2DM. The treatment with CAA not
only actively reversed PTP1B-mediated and/or dexamethasone
(Dex)-induced insulin resistance but also inhibited hormone-induced
adipogenesis by inhibiting PTP1B and downregulating peroxisome
proliferator-activated receptor-γ (PPARγ). Furthermore, CAA
treatment in the present study exhibited significant therapeutic
effects on hyperglycemia, hyperlipidemia and obesity in animal
models.
Materials and methods
Reagents
The leaves of C. cajan (L.) Millsp. were
collected from Ledong County (Hainan, China), and CAA was extracted
according to the previously reported method (13,14).
Purity assay of CAA
The purity of CAA was analyzed using a Dionex Summit
P680 high-performance liquid chromatography (HPLC; Dionex, CA, USA;
Fig. 1B) apparatus with an Ecosil
HPLC-C18 column (4.6×250 mm, 5 µm), with a mobile phase
consisting of acetonitrile: 0.5% aqueous acetic acid (70:30, v/v)
at a temperature of 30°C and flow rate 1.0 ml/min. This was then
detected at a wavelength of 250 nm (Table I).
 | Table IParameters of high-performance liquid
chromatography of cajanonic acid A purity detection. |
Table I
Parameters of high-performance liquid
chromatography of cajanonic acid A purity detection.
| No. | Retention time
(min) | Height | Area | Relative area
(%) |
|---|
| 1 | 2.17 | 2.633 | 0.201 | 0.06 |
| 2 | 2.25 | 3.091 | 0.340 | 0.11 |
| 3 | 2.54 | 1.895 | 0.511 | 0.16 |
| 4 | 2.81 | 3.020 | 0.213 | 0.07 |
| 5 | 2.93 | 0.311 | 0.019 | 0.01 |
| 6 | 3.11 | 4.186 | 1.940 | 0.61 |
| 7 | 3.25 | 0.722 | 0.057 | 0.02 |
| 8 | 4.07 | 1.069 | 0.143 | 0.04 |
| 9 | 4.24 | 0.407 | 0.047 | 0.02 |
| 10 | 4.75 | 0.138 | 0.013 | 0.00 |
| 11 | 5.04 | 0.889 | 0.182 | 0.06 |
| 12 | 5.23 | 0.520 | 0.074 | 0.02 |
| 13 | 6.01 | 0.395 | 0.065 | 0.02 |
| 14 | 7.44 | 0.570 | 0.109 | 0.03 |
| 15 | 9.72 | 853.547 | 312.24 | 98.22 |
| 16 | 12.1 | 0.978 | 0.405 | 0.13 |
| 17 | 21.91 | 0.590 | 0.535 | 0.17 |
| 18 | 30.70 | 1.072 | 0.807 | 0.25 |
| 19 | 30.73 | 0.005 | 0.000 | 0.00 |
| Total | 161.00 | 876.038 | 317.901 | 100 |
Chemicals and reagents
Streptozotocin (STZ), insulin,
3-isobutyl-1-methylxanthine (IBMX), Dex and Oil Red O were
purchased from Sigma-Aldrich; EMD Millipore (Billerica, MA, USA).
Rosiglitazone maleate tablets (Avandia, an insulin sensitizer) were
procured from GlaxoSmithKline (Shanghai, China).
Protein tyrosine phosphatase assay
A PTP1B assay kit (Calbiochem; EMD Millipore) was
used to evaluate the effects of CAA on the activity of PTP1B,
according to the manufacturer's protocol. The kit included human
recombinant PTP1B (residues 1-322) and a phosphopeptide substrate
composed of residues 1,142-1,153 of the IRSβ, which requires
autophosphorylation to achieve full receptor kinase activation. The
free phosphate released was detected to measure the activity of
PTP1B.
Cell lines and cell culture
The 3T3-L1 mouse preadipocyte cell line was obtained
from Professor WF Fong of Hong Kong Baptist University (Hong Kong,
China). The cells were grown and maintained in Dulbecco's modified
Eagle's medium (DMEM; Gibco; Thermo Fisher Scientific, Inc.,
Waltham, MA, USA), containing 4.5 g/l glucose, supplemented with
10% fetal bovine serum (FBS; Gibco; Thermo Fisher Scientific,
Inc.), 100 U/ml penicillin and 0.1 mg/ml streptomycin, at 37°C in a
humidified atmosphere containing 5% CO2.
The HepG2 human hepatoblastoma cells were purchased
from the Laboratory Animal Center of Sun Yat-Sen University
(Guangzhou, China). The cells were maintained in Roswell Park
Memorial Institute 1640 medium (RPMI 1640; Gibco; Thermo Fisher
Scientific, Inc.), supplemented with 10% FBS, 100 U/ml penicillin
and 0.1 mg/ml streptomycin, at 37°C in a humidified atmosphere
containing 5% CO2.
Hormone-induced adipocyte
differentiation
In 96-well plates or 6-well plates, the 3T3-L1
preadipocytes were seeded (3×10⁴ cells/cm2)
and grown to confluence in the growth medium (DMEM with 10% FBS).
Subsequently, 2 days after attaining confluence, adipocyte
differentiation was induced by incubating cells in a growth medium
containing 10 µg/ml insulin, 0.25 µM Dex and 0.5 mM
IBMX for 2 days at 37°C. The differentiated cells were incubated in
a growth medium containing 10 µg/ml insulin for 2 days,
followed by the normal growth medium for 4 days. The media were
replaced every 2nd day. Following 8 days of differentiation, over
90% of the cells were differentiated into adipocytes. Fat droplets
in adipocytes were visualized using Oil Red O staining, under a
light microscope.
Dex-induced insulin resistance in 3T3-L1
and HepG2 cells
Insulin resistance was induced in the HepG2 cells
and differentiated 3T3-L1 adipocytes by incubating the cells with 1
µM Dex in their respective growth media for 48 h under the
aforementioned cell culture conditions.
Transfection of the PTP1B expression
vector into HepG2 cells
The HepG2 cells (5×10⁵) were plated into
six-well plates. On reaching 80% confluence, the cells were
maintained in serum-free Opti-MEM I media (Thermo Fisher
Scientific, Inc.), and were transfected with 4 µg of
expression vector pCMV-PTPN1 (Sino Biological, Beijing, China)
containing human PTP1B cDNA and 10 µl Lipofectamine 2000
reagent (Thermo Fisher Scientific, Inc.) premixed with serum-free
Opti-MEM I media. The transfected cells were incubated in a
CO2 incubator at 37°C for 4 h, following which the media
were replaced with standard DMEM containing 10% FBS. Following
transfection for 24 h, the stably transfected cells were collected
and screened using 150 µg/ml hygromycin (Roche Diagnostics,
Basel, Switzerland).
Glucose consumption assay
In 96-well plates, differentiated 3T3-L1 adipocytes
or 8,000 adhered HepG2 cells in 100 µl fresh media were
incubated at 37°C with 6.25, 12.5 or 25 µM CAA for either 24
or 48 h, in a CO2 incubator. The glucose residues in the
cell culture media were measured using a glucose oxidase assay kit
(Huili Biotechnologies, Changchun, China).
Animal care and diabetic rat models
A total of 50 male Sprague-Dawley (SD) rats
(4-weeks-old, weighing 60-80 g) were purchased from the Laboratory
Animal Center of Guangzhou University of Chinese Medicine
(certificate no. 0040568). Male adult ob/ob mice
(5-weeks-old, weighing 30-40 g, stock no. 000632) were purchased
from the Jackson ImmunoResearch Laboratories, Inc. (West Grove, PA,
USA).
The animals were allowed free access to food and
filtered tap water ad libitum, and were maintained at 23±2°C
with 50-70% relative humidity and 12-h dark/light cycles under
pathogen-free conditions. All experiments were approved by the
Animal Ethics Committee of Guangzhou University of Chinese Medicine
(Guangzhou, China; no. SYXY2008-0001) and were performed following
the Animal Care and Use guidelines set by the committee.
Symptoms of T2DM were induced in 42 male SD rats by
feeding a high-fat diet (60% standard diet, 20% lard, 10% yolk
powder and 10% saccharose) for 8 weeks. The rats were fasted for 16
h and subsequently injected intraperitoneally with 30 mg/kg STZ.
Meanwhile, the other 8 rats fed with a standard diet served as a
normal control (NC), and these rats were administered with an
equivalent volume of 0.1 M citrate buffer (pH 4.4) instead of STZ.
At 2 weeks post-STZ injection, the rats were subjected to fasting
for 14 h, and the fasting blood glucose (FBG) levels were measured
from the caudal vein using an Accu-Chek active blood glucose
monitoring meter (Roche Diagnostics). The animals with FBG levels
of 12-28 mM, and with symptoms of polyuria and polydipsia, were
considered diabetic.
CAA treatment
The antidiabetic properties of CAA were investigated
by randomly dividing 24 diabetic rats into three groups (n=8/group)
according to their FBG and bodyweight (BW), and were administered
with 10 mg/kg/day (a minimum effective dosage, based on our
previous experiments, data not shown) of CAA or an equivalent
volume of vehicle (5% Tween-80 and 5% DMSO in water)
intraperitoneally, or 4 mg/kg/day of Avandia (positive control)
orally for 4 weeks. All the diabetic rats continued to receive the
high-fat diet during the experiment. Furthermore, 12 male adult
ob/ob mice that had grown to 12 weeks of age were randomly
divided into two groups (n=6/group), which received CAA (8
mg/kg/day intraperitoneally, which was identified as the minimum
effective dosage based on our previous experiments (data not shown)
or an equivalent volume of vehicle (5% Tween-80 and 5% DMSO in
water) for 12 days. The FBG levels and BW were measured on day 0
(prior to the first treatment), and days 5 and 12 following the
final treatment. In addition, eight healthy rats of the same age,
fed on the standard diet, were used as the normal control (NC)
group.
Oral glucose tolerance test (OGTT) and
lipid metabolism assessment
OGTTs were performed at the start and the end of
drug treatment, respectively. Animals fasted for 12 h were orally
administered 2 g/kg of glucose; plasma glucose levels at 0, 30, 60
and 120 min following glucose administration were measured from the
caudal vein using a blood glucose monitoring meter. At the end of
experiment, blood samples from the aorta abdominalis were
centrifuged at 2,500 × g for 10 min at 4°C, and the fasting serum
levels of triglycerides (TG), total cholesterol (TC), high-density
lipoprotein cholesterol (HDL-C), low-density lipoprotein
cholesterol (LDL-D), urea, uric acid, creatinine, aspartate
transaminase (AST), alanine transaminase (ALT) and glucose (FSG)
were measured with an AU5400 automatic analyzer (Olympus
Corporation, Tokyo, Japan). The fasting insulin levels of serum
(FINS) were measured using a rat insulin ELISA kit (R&D
Systems, Inc., Minneapolis, MN, USA). The homeostatic model
assessments for insulin resistance index and β-cell function index
(HOMA-IR and HOMA-β, respectively) were calculated to evaluate
β-cell function (15), using the
following equations: HOMA-IR = FSG × FINS/22.5; HOMA-β = 20 ×
FINS/(FSG-3.5).
The livers were weighed, and the liver to body
weight (LW/BW) ratio was calculated to evaluate liver swelling.
Then tissues were then fixed in paraformaldehyde (4%) for 24 h, and
4-µm sections were used for further staining following
embedding with paraffin. The pancreas, liver and kidneys were
analyzed histopathologically using hematoxylin and eosin stain,
with 0.1% hematoxylin for 6 min at room temperature and 0.5% eosin
for 2 min at room temperature, under a light microscope.
Reverse transcription-quantitative
polymerase chain reaction (RT-qPCR) analysis
Total RNAs were isolated from the cells and reverse
transcription was performed using the RNAprep Cell/Bacteria kit
(Tiangen Biotech Co., Ltd., Beijing, China) and ReverTra Ace qPCR
RT kit (Toyobo Co., Ltd., Osaka, Japan) respectively, according to
manufacturer's protocols. The mRNA levels of the target genes were
measured using qPCR analysis with Thunderbird SYBR qPCR mix (Toyobo
Co., Ltd.). For performing the amplification, 12.5 µl of
SYBR qPCR mix, 1X ROX reference, 0.3 µM of primer pairs
each, 2.5 µl of 10-fold diluted cDNA were mixed, and the
sterile distilled water finally supplemented to 25 µl total
volume. The quantitative assay was evaluated in a 7500 Real-time
PCR system (Applied Biosystems; Thermo Fisher Scientific, Inc.)
under 2-Step Cycling (95°C for 1 min hold, 40 cycles of 95°C for 15
sec and 60°C for 40 sec). β-actin was used as the inner reference
gene, and the relative gene expression was calculated based on
2−∆∆Cq method (16).
The primers designed for amplifying target genes are listed in
Tables II and III.
| Table IIPrimers designed for quantitative
amplification in humans. |
Table II
Primers designed for quantitative
amplification in humans.
| Gene | Primer sequence
(5′-3′) | Length (bp) |
|---|
| PTP1B-F |
AGCCAGTGACTTCCCATGTAG | 257 |
| PTP1B-R |
TGTTGAGCATGACGACACCC | |
| IRS1-F |
GGAAGAGACTGGCACTGAGG | 199 |
| IRS1-R |
CTGACGGGGACAACTCATCT | |
| IRS2-F |
CAACACCTACGCCAGCATTGA | 107 |
| IRS2-R |
CTCTGACATGTGACATCCTGGTGA | |
| GSK3β-F |
AACTGCCCGACTAACACCAC | 268 |
| GSK3β-R |
TGCAGAAGCAGCATTATTGG | |
| GLUT1-F |
CGGGCCAAGAGTGTGCTAAA | 283 |
| GLUT1-R |
TGACGATACCGGAGCCAATG | |
| β-actin-F |
TGGCACCCAGCACAATGAA | 186 |
| β-actin-R |
CTAAGTCATAGTCCGCCTAGAAGCA | |
| Table IIIPrimers designed for quantitative
amplification in mice. |
Table III
Primers designed for quantitative
amplification in mice.
| Gene | Primer sequence
(5′-3′) | Length (bp) |
|---|
| PTP1B-F |
TTCAAAGTCCGAGAGTCAGG | 236 |
| PTP1B-R |
ACAGCCAGGTAGGAGAAGC | |
| PPARγ-F |
TGTCGGTTTCAGAAGTGCCTTG | 122 |
| PPARγ-R |
TTCAGCTGGTCGATATCACTGGAG | |
| C/EBPα-F |
TGCGCAAGAGCCGAGATAAAG | 115 |
| C/EBPα-R |
TCACGGCTCAGCTGTTCCAC | |
| ADD1/S-F |
TACTTCTTGTGGCCCGTACC | 129 |
| ADD1/S-R |
TCAGGTCATGTTGGAAACCA | |
| FAS-F C |
TGAGGACTTCCCAAACGG | 228 |
| FAS-R |
TGGCCTGATGAAACGACAC | |
| AP2-F |
AGCGTAAATGGGGATTTGGT | 178 |
| AP2-R |
TCGACTTTCCATCCCACTTC | |
| LPL-F |
GCCCAGCAACATTATCCAGT | 168 |
| LPL-R |
GGTCAGACTTCCTGCTACGC | |
| β-actin-F |
CATCCGTAAAGACCTCTATGCCAAC | 171 |
| β-actin-R |
ATGGAGCCACCGATCCACA | |
Western blot analysis
The cells were harvested and lysed with an ice-cold
cell lysis buffer for western and IP (Beyotime Institute of
Biotechnology, Shanghai, China), which contained the protease
inhibitor PMSF at final concentration of 1 mM.
The total concentration of extracted proteins was
determined using an Enhanced BCA Protein Assay kit (Beyotime
Instittue of Biotechnology). A total of 20 µg of the
extracted proteins were subjected to 10% SDS-PAGE, and
electrotransferred onto a PVDF membrane (Merck Millipore,
Darmstadt, Germany) at 300 mA. The membrane was incubated with
corresponding primary and secondary antibodies (Table IV), successively. The blots were
detected using a Kodak film developer (Fujifilm, Tokyo, Japan).
Protein levels were quantified by densitometry analysis using
Image-pro plus 6.0 software (Media Cybernetics, Inc., Rockville,
MD, USA), GAPDH was used as endogenous control.
| Table IVList of antibodies for western blot
analysis. |
Table IV
List of antibodies for western blot
analysis.
| Protein | Vendor | Cat. no. | Dilution | Incubation |
|---|
| PTP1B | Abcam (Cambridge,
UK) | ab52650 | 1:1,500 | RT, 1 h |
| p-IR | Abcam | ab5681 | 1:2,000 | RT, 1 h |
| p-IRS1 | Abcam | ab66153 | 1:3,000 | RT, 1 h |
| p-PI3K | Abcam | ab182651 | 1:2,000 | RT, 1 h |
| p-AKT | Santa Cruz
Biotechnology, Inc. (Dallas, TX, USA) | sc-81433 | 1:2,000 | RT, 1 h |
| GLUT1 | Abcam | ab115730 | 1:2,500 | RT, 1 h |
| GLUT4 | Santa Cruz
Biotechnology, Inc. | sc-53566 | 1:2,000 | RT, 1 h |
| GAPDH | Aksomics (Shanghai)
Biotechnology Co., Ltd. (Shanghai, China) | KC-5G5 | 1:10,000 | RT, 1 h |
| HRP Goat
anti-Rabbit IgG | Boster Biological
Technology Co., Ltd. (Wuhan, China) | BA1054 | 1:20,000 | RT, 40 min |
| HRP Goat anti-Mouse
IgG | Boster Biological
Technology Co., Ltd. | BA1051 | 1:20,000 | RT, 40 min |
Statistical analysis
The data are presented as the mean ± standard error
of the mean. Data on relating to the expression of PTP1B and
glucose consumption in the cells following transfection with the
PTP1B overexpression plasmid, glucose consumption following DEX
treatment and residual glucose concentration following CAA
treatments were analyzed using a t-test in Microsoft Excel 2013
(Microsoft Corporation, Redmon, WA, USA). The remaining data were
analyzed using one-way analysis of variance (SPSS 19.0, IBM Corp.,
Armonk, NY, USA). P<0.05 was considered to indicate a
statistically significant difference. All experiments were
performed three times (n=3).
Results
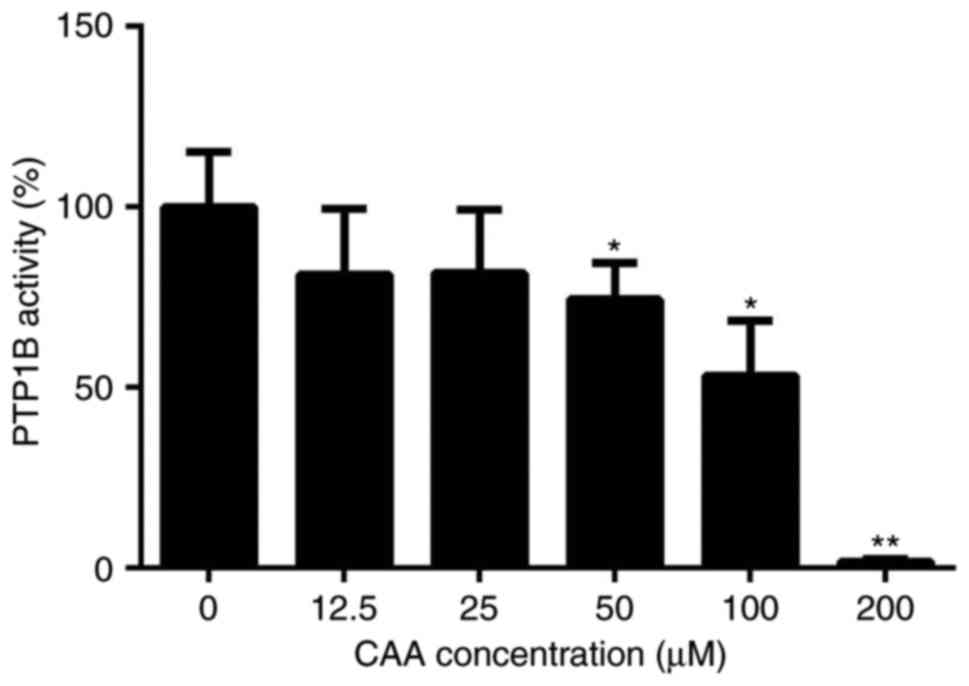
CAA inhibits the activity of PTP1B
The purity of the CAA extracted from the leaves of
C. cajan (L.) Millsp in the present study was determined to
be 98.22%. The protein tyrosine phosphatase assay for PTP1B
activity showed that CAA effectively reduced the PTP1B-catalyzed
dephosphorylation of the phosphopeptide substrate, with a half
maximal inhibitory concentration of 63.19 µM. Specifically,
treatment with 200 µM CAA decreased the activity of PTP1B to
1.8%, compared with that of in the blank (0 µM) group
(Fig. 2).
PTP1B regulates glucose consumption in
HepG2 hepatoblastoma cells
Previous studies have reported that PTP1B inhibits
the activity of insulin by catalyzing the dephosphorylation of the
IR and other key proteins in the insulin signaling pathway
(6,7). RT-qPCR analysis of the cells
transfected with the PTP1B overexpression plasmid (hereafter
referred to as HepG2/PTP1B cells), was performed to examine the
effects of the expression of PTP1B on insulin signaling pathway.
The HepG2/PTP1B cells exhibited increased expression levels of
PTP1B by ~4-fold, compared with that of non-transfected HepG2 cells
(Fig. 3A). In addition, as shown
in Fig. 3B-E, insulin stimulation
increased the transcript levels of IRS1 and GLUT1 by
1- and 2-fold in the NC group, but decreased the levels of
IRS1 by 58%, with no change in GLUT1 in the
HepG2/PTP1B cells. No significant differences were observed in the
expression levels of IRS2 or GSK3β in response to insulin
stimulation between the cells with either basal or the
overexpressed PTP1B. At the protein level, the HepG2/PTP1B cells
exhibited increased expression levels of PTP1B by 1.5-fold,
compared with that of the non-transfected HepG2 cells (Fig. 3F and G).
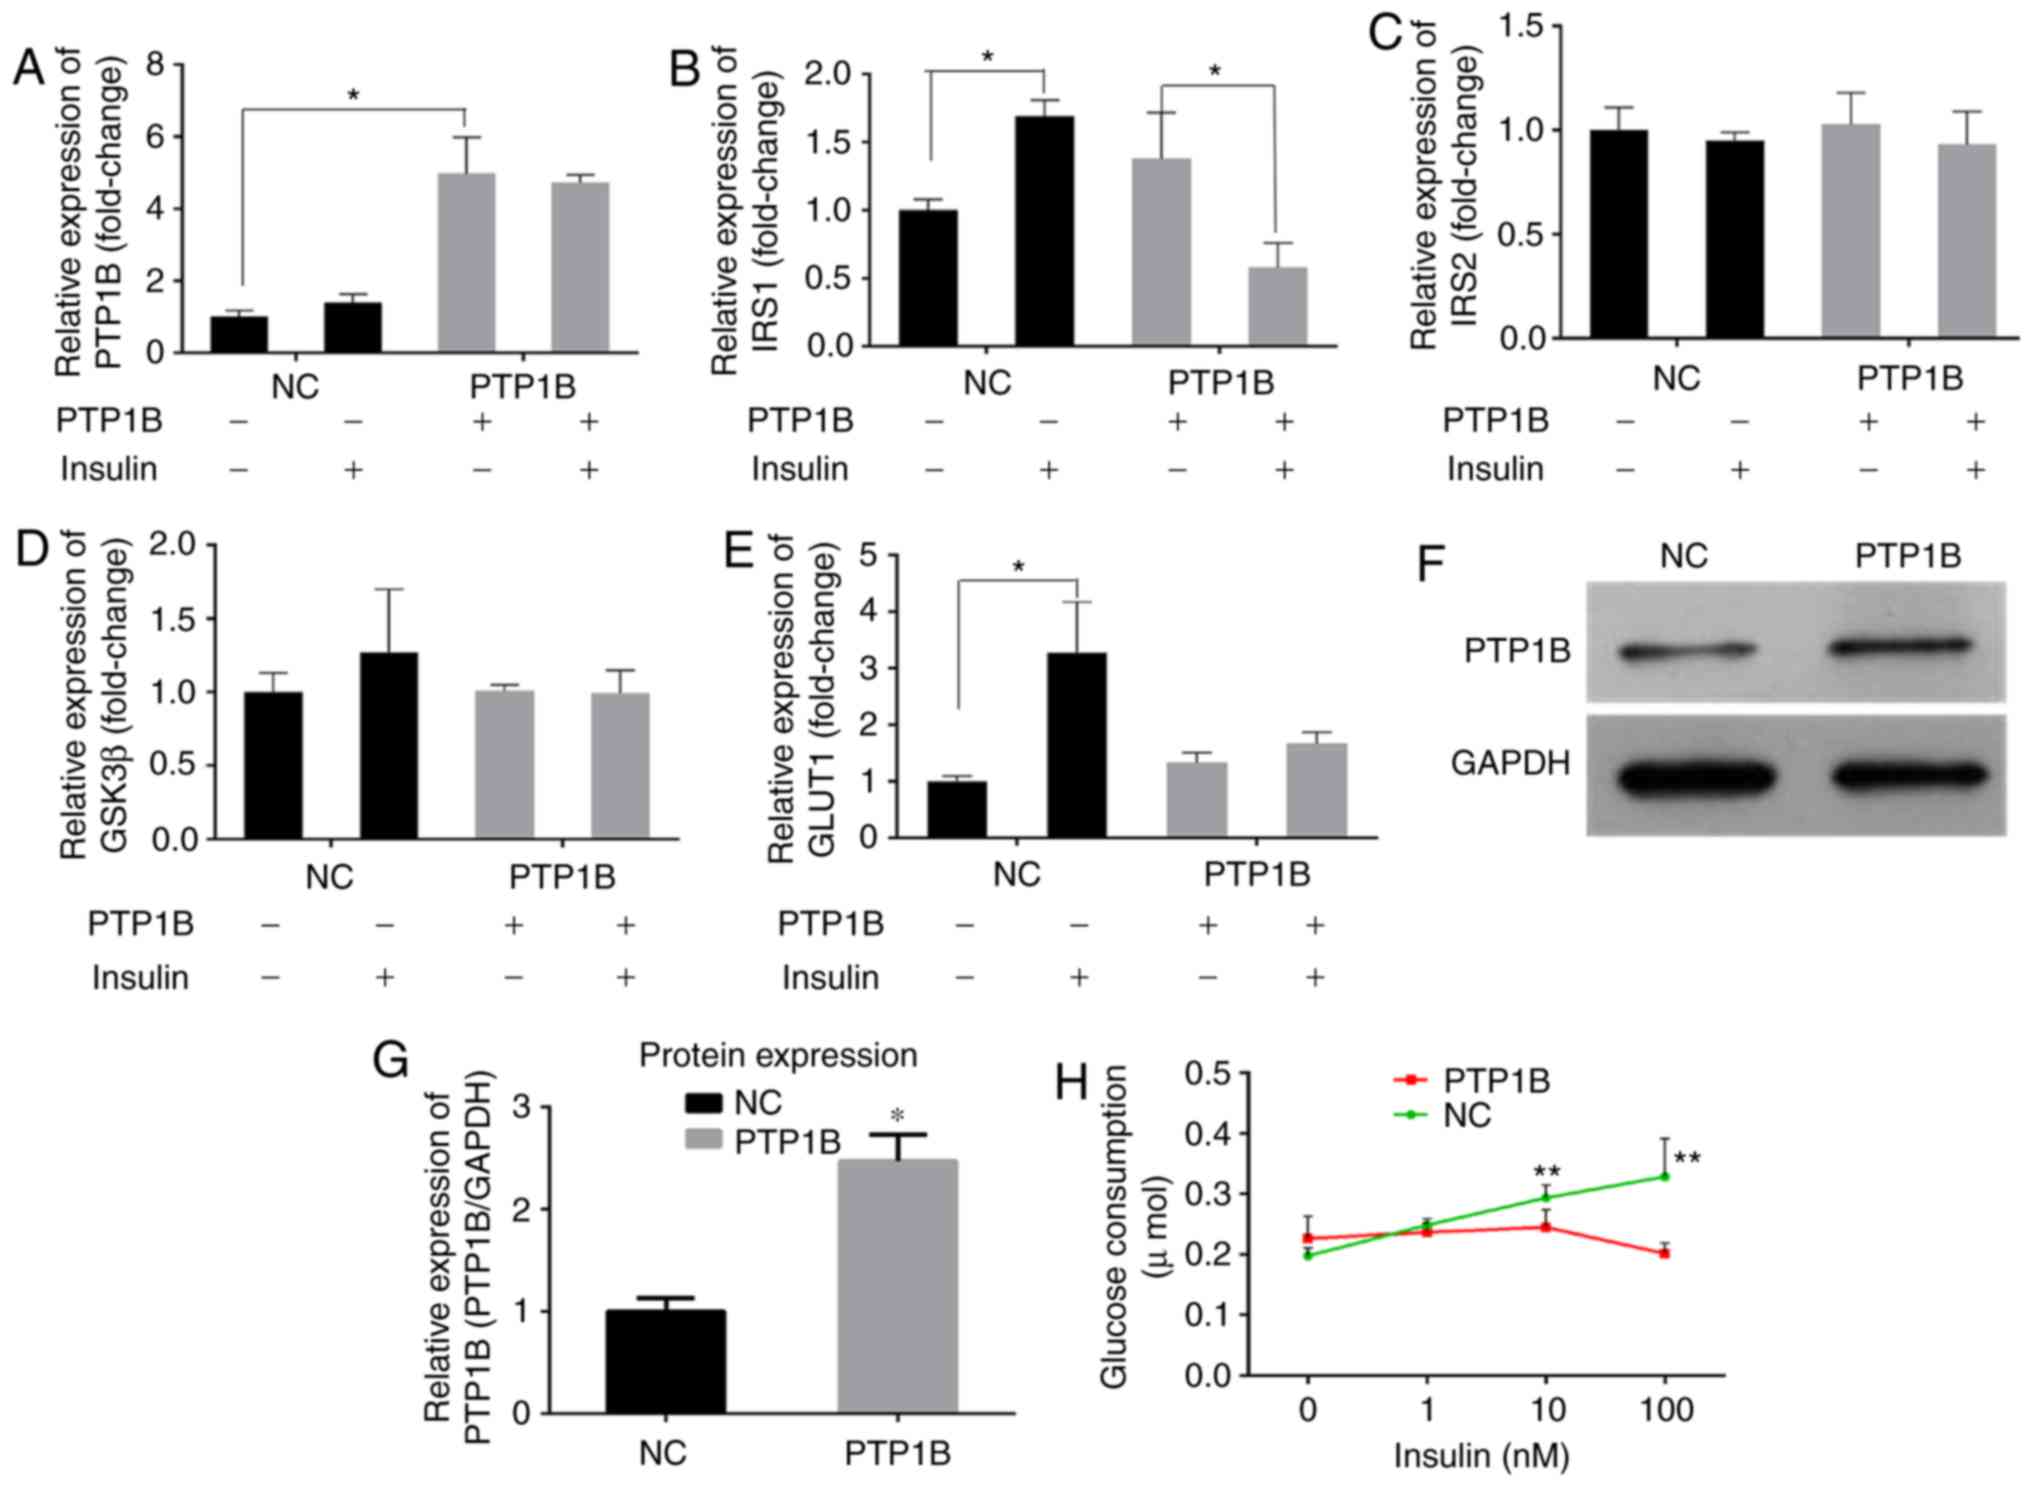 | Figure 3Overexpression of PTP1B induces
insulin resistance in HepG2 cells. The expression levels of (A)
PTP1B, (B) IRS1, (C) IRS2, (D) GSK3β and (E) GLUT1 involved in
insulin signaling were monitored using reverse
transcription-quantitative polymerase chain reaction analysis.
HepG2 cells transfected with PTP1B vectors were treated with 0 and
100 nM insulin. (F and G) Protein expression levels of PTP1B from
western blots. (H) Glucose consumption in HepG2 with PTP1B and
insulin (0, 1, 10, 100 nM) intervention for 24 h. All results are
expressed as the mean ± standard error of the mean (n=3-6).
*P<0.05, **P<0.01, vs. NC without
insulin. PTP1B, protein-tyrosine phosphatase 1B; IRS, insulin
receptor substrate; GSK3β, glycogen synthase kinase-3β; GLUT1,
glucose transporter 1; NC, normal control. |
A glucose consumption assay was performed to assess
the effects of the overexpression of PTP1B on cellular insulin
sensitivity. As shown in Fig. 3H,
the glucose consumption of NC cells following incubation with
insulin (1, 10 or 100 nM) increased but did not exhibit any
significant change in the PTP1B overexpressed cells. These results
indicated that, although the cells overexpressing PTP1B exhibited
basal glucose consumption roughly equivalent to that of HepG2
cells, they exhibited resistance towards insulin-stimulated glucose
uptake.
CAA reverses insulin-resistance in HepG2
cells
CAA treatment increased the insulin-stimulated mRNA
levels of IRS1, IRS2 and GLUT1 in the
HepG2/PTP1B cells in a dose-dependent manner. Specifically, the
mRNA levels of IRS1, IRS2 and GLUT1 were 4, 1
and 1.6 times higher in the cells treated with 25 µM CAA,
respectively, than those in the control (Fig. 4A). Although CAA treatment did not
affect the expression of PTP1B at the mRNA level (Fig. 4A), it significantly suppressed the
protein levels of PTP1B (Fig.
4B), which indicated that the inhibitory effects of CAA on the
expression of PTP1B occurred at the post-transcriptional level.
Additionally, the CAA treatment-assisted inhibition of PTP1B led to
increases in the expression of GLUT1, and the phosphorylation of
insulin-stimulated IR, IRS1, PI3K and AKT (Fig. 4B). The effects of CAA on the
resistance of HepG2/PTP1B cells to insulin were investigated using
6.25, 12.5 and 25 µM of CAA. Compared with the control group
(without CAA treatment), CAA-treated groups (Fig. 4C) exhibited time and
dose-dependent increases in insulin-stimulated glucose consumption
of the cells. These data suggested that CAA treatment in the
present study not only inhibited PTP1B, but also upregulated the
expression and activity of insulin signal transduction factors, and
thus reversed the hepatocellular insulin resistance induced by the
overexpression of PTP1B.
 | Figure 4CAA reverses the insulin resistance
induced by overexpression of PTP1B in HepG2 cells. (A) Expression
of insulin signaling genes as analyzed using reverse
transcription-quantitative polymerase chain reaction analysis. (B)
Expression and phosphorylation of insulin signaling proteins
analyzed using western blot analysis with CAA (0, 6.25, 12.5 and 25
µM) and PTP1B intervention. All results are expressed as the
mean ± standard error of the mean (n=3-6). (C) Glucose consumption
in response to insulin with CAA. *P<0.05 and
**P<0.01. 1, 2 and 3 indicate CAA concentrations of
6.25, 12.5 and 25 µM, respectively. PTP1B, protein-tyrosine
phosphatase 1B; IRS, insulin receptor substrate; GSK3β, glycogen
synthase kinase-3β; GLUT1, glucose transporter 1; PI3K,
phosphoinositide 3-kinase; IR, insulin receptor; AKT,
serine/threonine protein kinase; CAA, cajanonic acid A; p-,
phosphorylated. |
CAA improves Dex-impaired
insulin-stimulated glucose consumption in HepG2 cells and 3T3-L1
adipocytes
The ability of CAA to modulate artificially induced
insulin resistance by Dex was assessed. The HepG2 cells and mature
3T3-L1 adipocytes were treated with 1 µM Dex in a medium
containing 10% FBS for 48 h, followed by treatment with CAA in a
medium containing 0.5% FBS and 10 nM insulin for either 24 or 48 h.
The results revealed that the glucose consumption was reduced by
~30% (Fig. 5A, CAA=0) and 18%
(Fig. 5B, CAA=0) in the HepG2
cells and 3T3-L1 adipocytes following 48 h of Dex treatment,
respectively. In addition, marginally increased expression of
PTP1B, decreased expression of GLUT1 (Fig. 5C) and GLUT4 (Fig. 5D) and decreased phosphorylation of
IR, IRS1, PI3K and AKT were observed (Fig. 5C and D). These results indicated
that 1 µM Dex induced cellular insulin resistance by
inactivating the insulin signaling pathway.
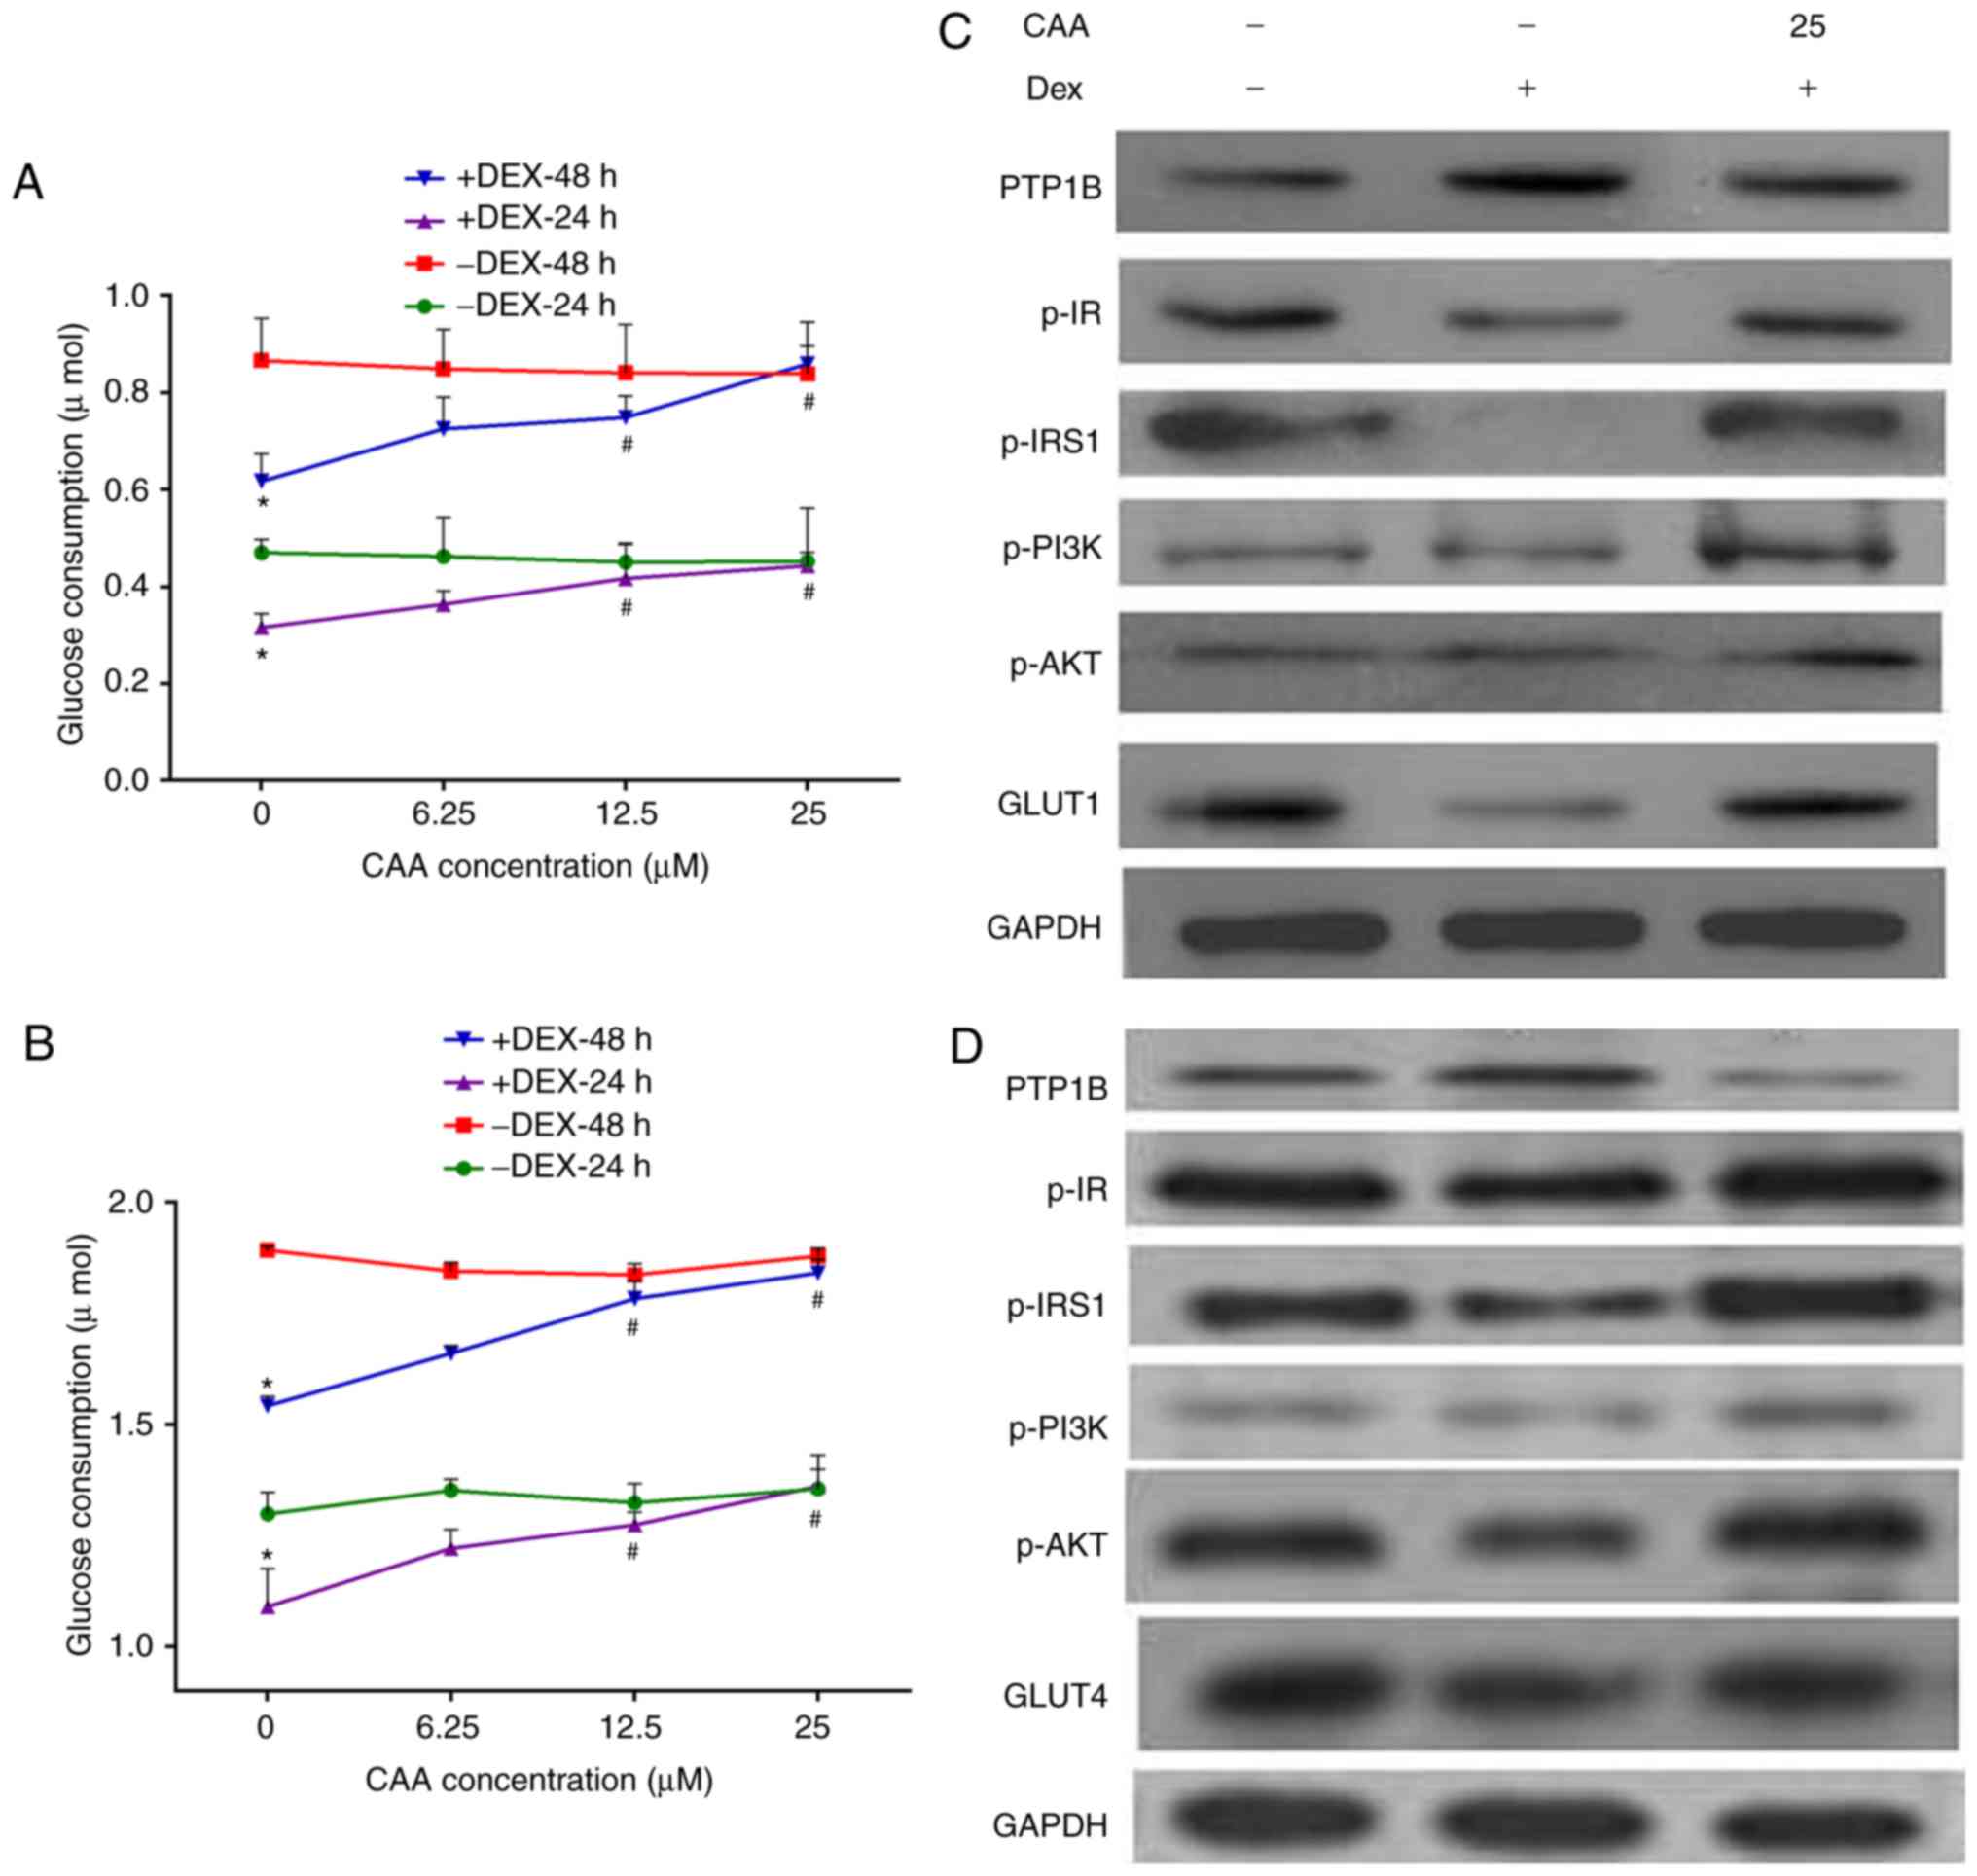 | Figure 5CAA improves the insulin sensitivity
impaired by Dex in HepG2 cells and 3T3-L1 adipocytes. (A) Glucose
consumption in response to insulin in the HepG2 cell line. (B)
Glucose consumption in response to insulin in 3T3-L1 adipocytes.
(C) Expression and phosphorylation of insulin signaling proteins in
HepG2 cells analyzed using western blot analysis. (D) Expression
and phosphorylation of insulin signaling proteins in 3T3-L1
adipocytes analyzed using western blot analysis. Prior to CAA
treatment, the cells were incubated with 0 (−) or 1 µM (+)
Dex for 48 h. For glucose consumption experiments, the cells were
treated with CAA (0, 6.25, 12.5 and 25 µM) in 0.5% fetal
calf serum and 10 nM insulin for 24 or 48 h. For western blot
analysis, the cells were treated with 25 µM CAA for 24 h
followed by 100 nM insulin for 30 min. All results are expressed as
the mean ± standard error of the mean (n=3-6).
*P<0.05, vs. cells without DEX treatment;
#P<0.01, vs. cells without CAA treatment. PTP1B,
protein-tyrosine phosphatase 1B; IR, insulin receptor; IRS, insulin
receptor substrate; GLUT1, glucose transporter 1; GLUT4, glucose
transporter 4; PI3K, phosphoinositide 3-kinase; AKT,
serine/threonine protein kinase; CAA, cajanonic acid A; p-,
phosphorylated; Dex, dexamethasone. |
By contrast, treatment with CAA did not increase the
glucose consumption of cells not exposed to Dex, but markedly
increased glucose consumption of the Dex-induced insulin-resistant
cells in a dose-dependent manner. As presented in Fig. 5, 25 µM CAA treatment
restored the glucose consumption in Dex-treated cells to the normal
levels (Fig. 5A and B).
The results of the western blot analysis revealed
that CAA treatment downregulated the expression of PTP1B, but
upregulated the expression of GLUT1 or GLUT4, and increased the
levels of phosphorylated IR, IRS1, PI3K and AKT (Fig. 5C and D), which indicated the
promotion of glycometabolism in the Dex-treated cells treated with
CAA.
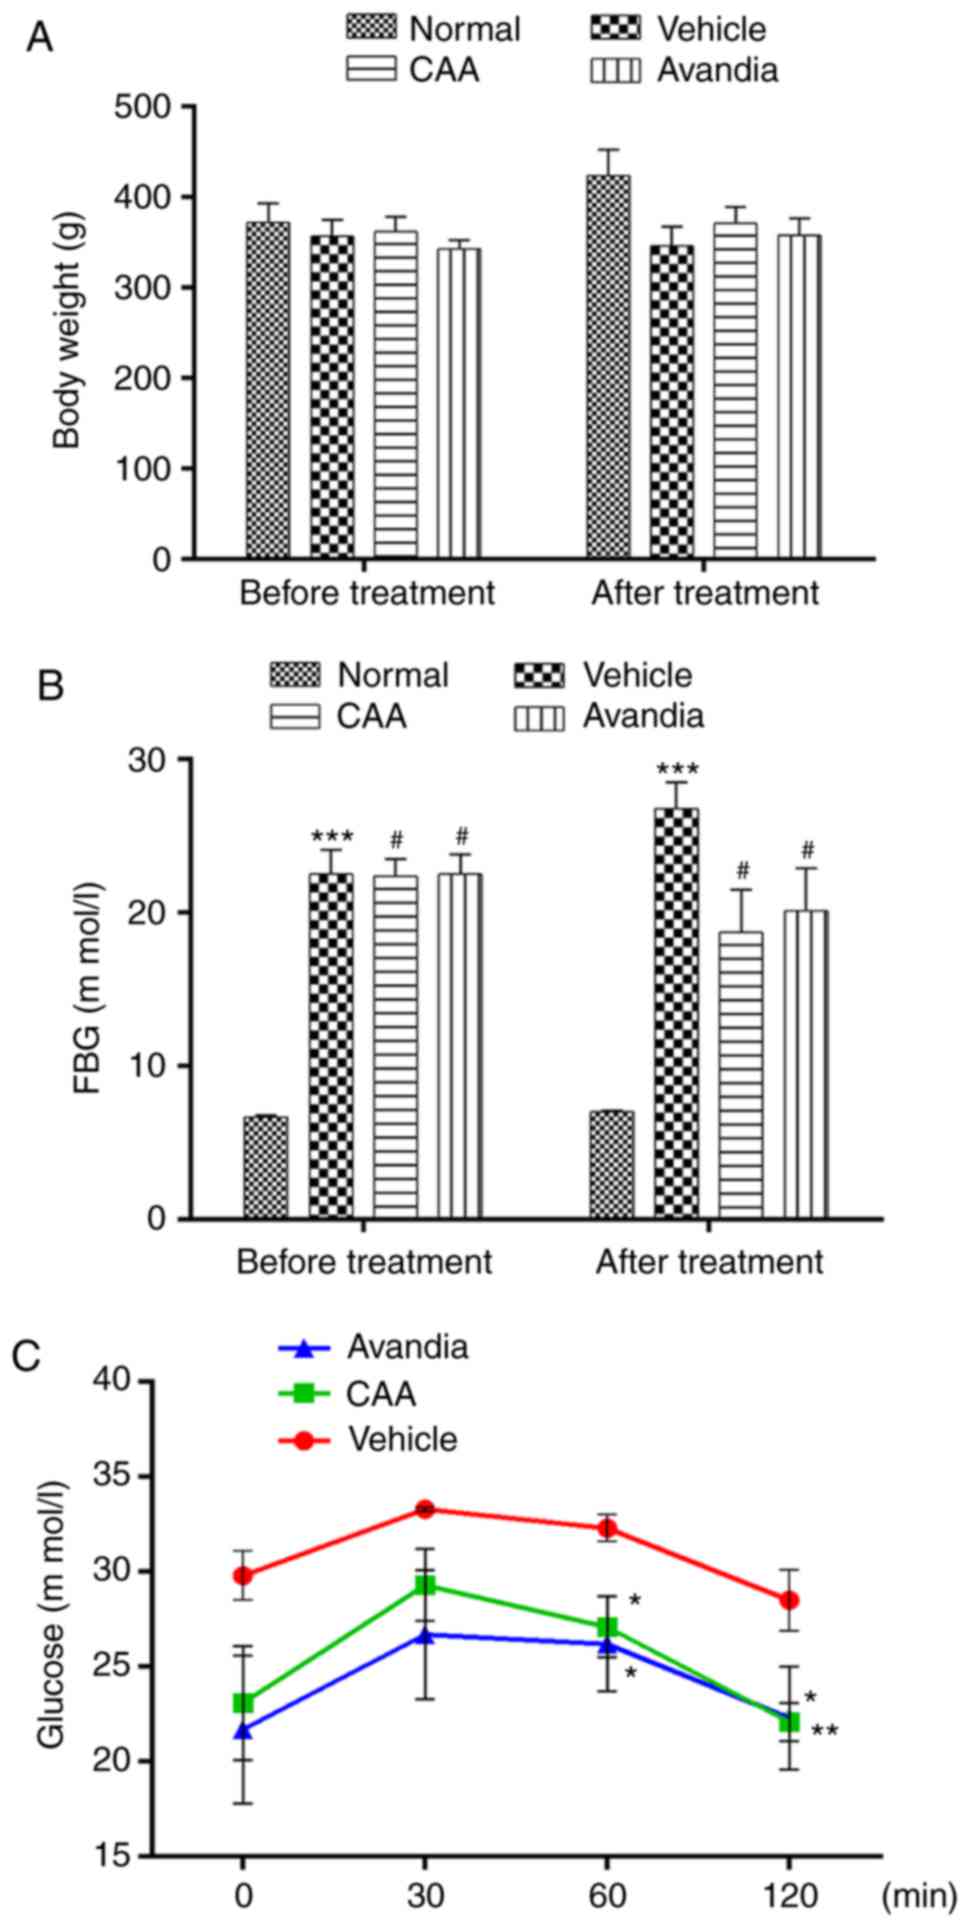
Therapeutic effects of CAA in an SD rat
model of T2DM
The present study also investigated the effects of
CAA treatment on the modulation of insulin resistance in SD rats
fed on high-fat diet, having STZ-induced T2DM. Avandia
(tosiglitazone), a clinically used insulin sensitizer, was used as
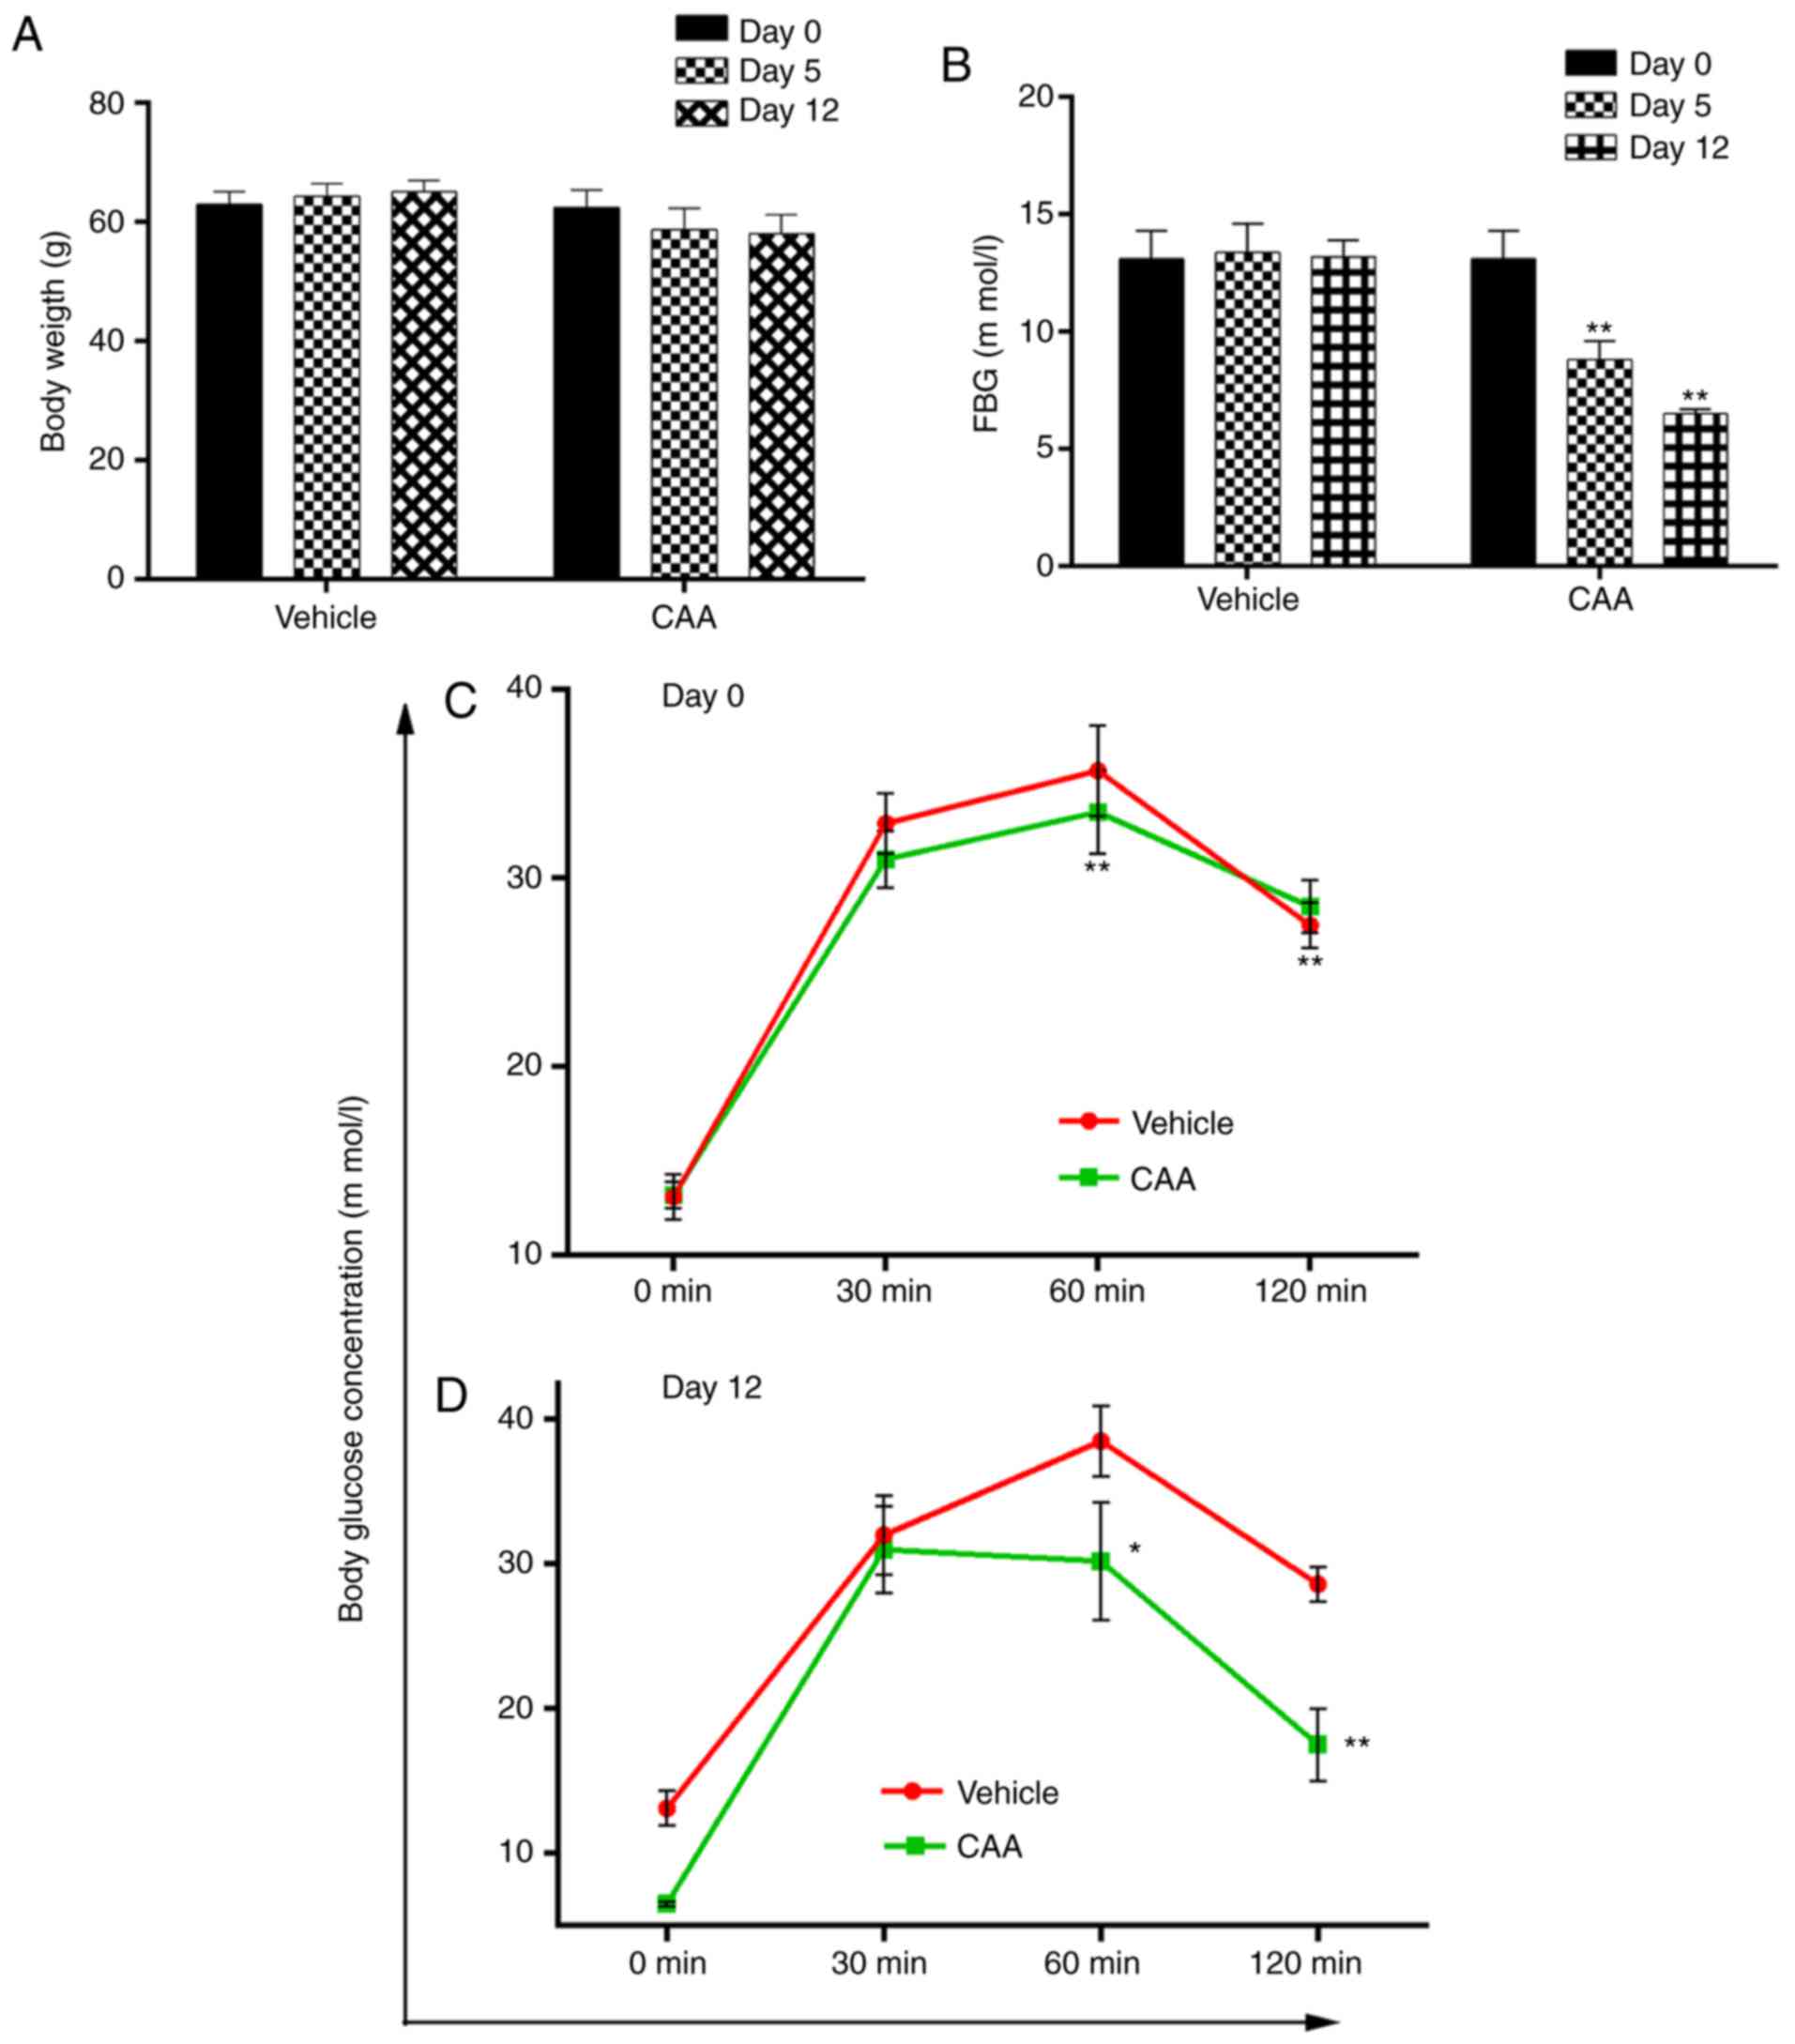
the positive control. As shown in Fig. 6A and B, over a 4-week experimental
period, the BW of the normal rats steadily increased from 372±22 to
424±29 g, but their FBG levels remained considerably low (≤7.0 mM).
By contrast, the FBG levels of the vehicle-treated diabetic rats
increased from 22.5±1.6 to 26.8±1.7 mM, whereas their BW decreased
from 357±18 to 346±21 g, which indicated a severe diabetic
condition. Compared with the diabetic rats treated with vehicle,
the rats treated with CAA or Avandia exhibited a marginally higher
BW (Fig. 6A), markedly lower FBG
levels (Fig. 6B) and improved
oral glucose tolerance (Fig.
6C).
Lifestyle-induced hyperglycemia is often accompanied
by lipid metabolic disorders. Individuals with abnormal blood lipid
profiles are more vulnerable to diabetes; improvement in lipid
metabolism can assist in alleviating the diabetic condition
(17). Therefore, the present
study further assessed lipid metabolism in the experimental rats.
The vehicle-treated T2DM rats exhibited significantly elevated
serum levels of TC (P<0.01), TG (P<0.01) and LDL-C
(P<0.001), which indicated dyslipidemia compared with the normal
group. By contrast, CAA treatment significantly reduced the levels
of lipid regulatory effects, including TG (P<0.05), TC
(P<0.01) and LDL-C (P<0.001), in the T2DM rats, similar to
the rats treated with Avandia (Fig.
7A). The levels of FINS remained unchanged in all groups
(Fig. 7B), which suggested that
CAA, as with Avandia, did not stimulate insulin secretion. In
addition, as shown in the HOMA-IR and HOMA-β data (Fig. 7B), CAA and Avandia had a
protective effect on β-cell function.
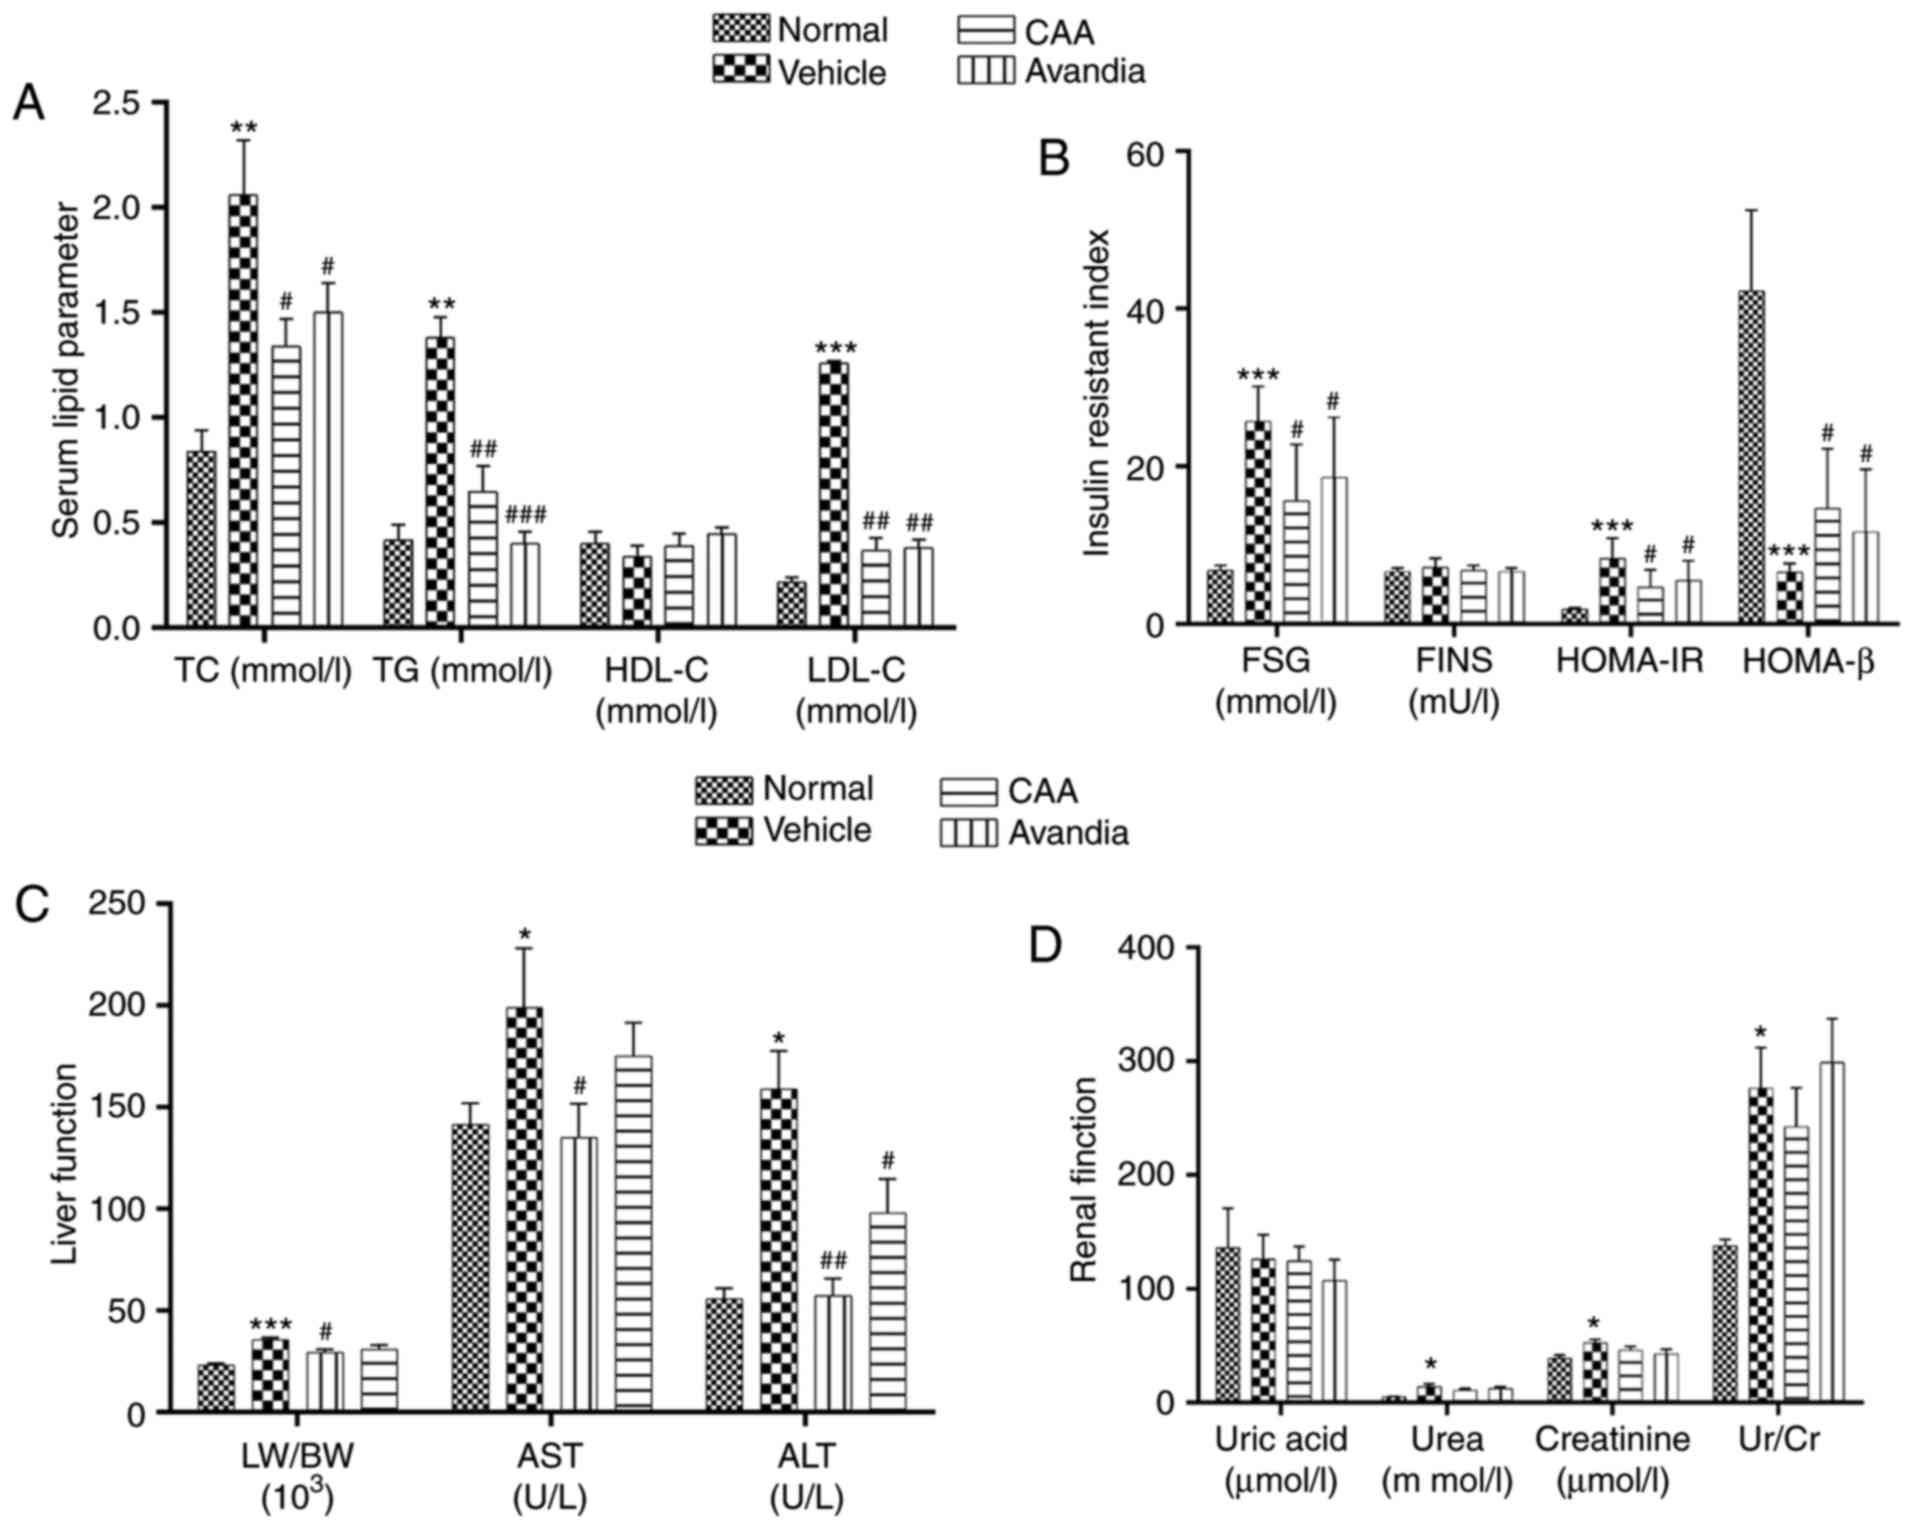 | Figure 7CAA lipid metabolism and organ
function in type II diabetes mellitus rats. Blood samples were
collected from the aorta abdominalis following 12 h of fasting at
the end of the experiment. HOMA-IR and HOMA-β were calculated. The
(A) serum lipid parameter, (B) insulin resistant index, (C) liver
function and (D) renal function were analyzed using an automatic
biochemical analyzer. Data are expressed as the mean ± standard
error of the mean (n=8). *P<0.05,
**P<0.01 and ***P<0.001, vs. normal
rats; #P<0.05, ##P<0.01 and
###P<0.001, vs. vehicle-treated rats. CAA, cajanonic
acid A; TC, total cholesterol; TG, triglycerides; HDL-C,
high-density lipoprotein cholesterol; LDL-C, low-density
lipoprotein cholesterol; FSG, fasting serum glucose; FINS, fasting
insulin in serum; HOMA-IR, homeostatic model assessments for
insulin resistance; HOMA-β, homeostatic model assessments for
β-cell function; LW/BW, liver to body weight ratio; AST, aspartate
transaminase; ALT, alanine transaminase; Ur/Cr, urea/creatinine
ratio. |
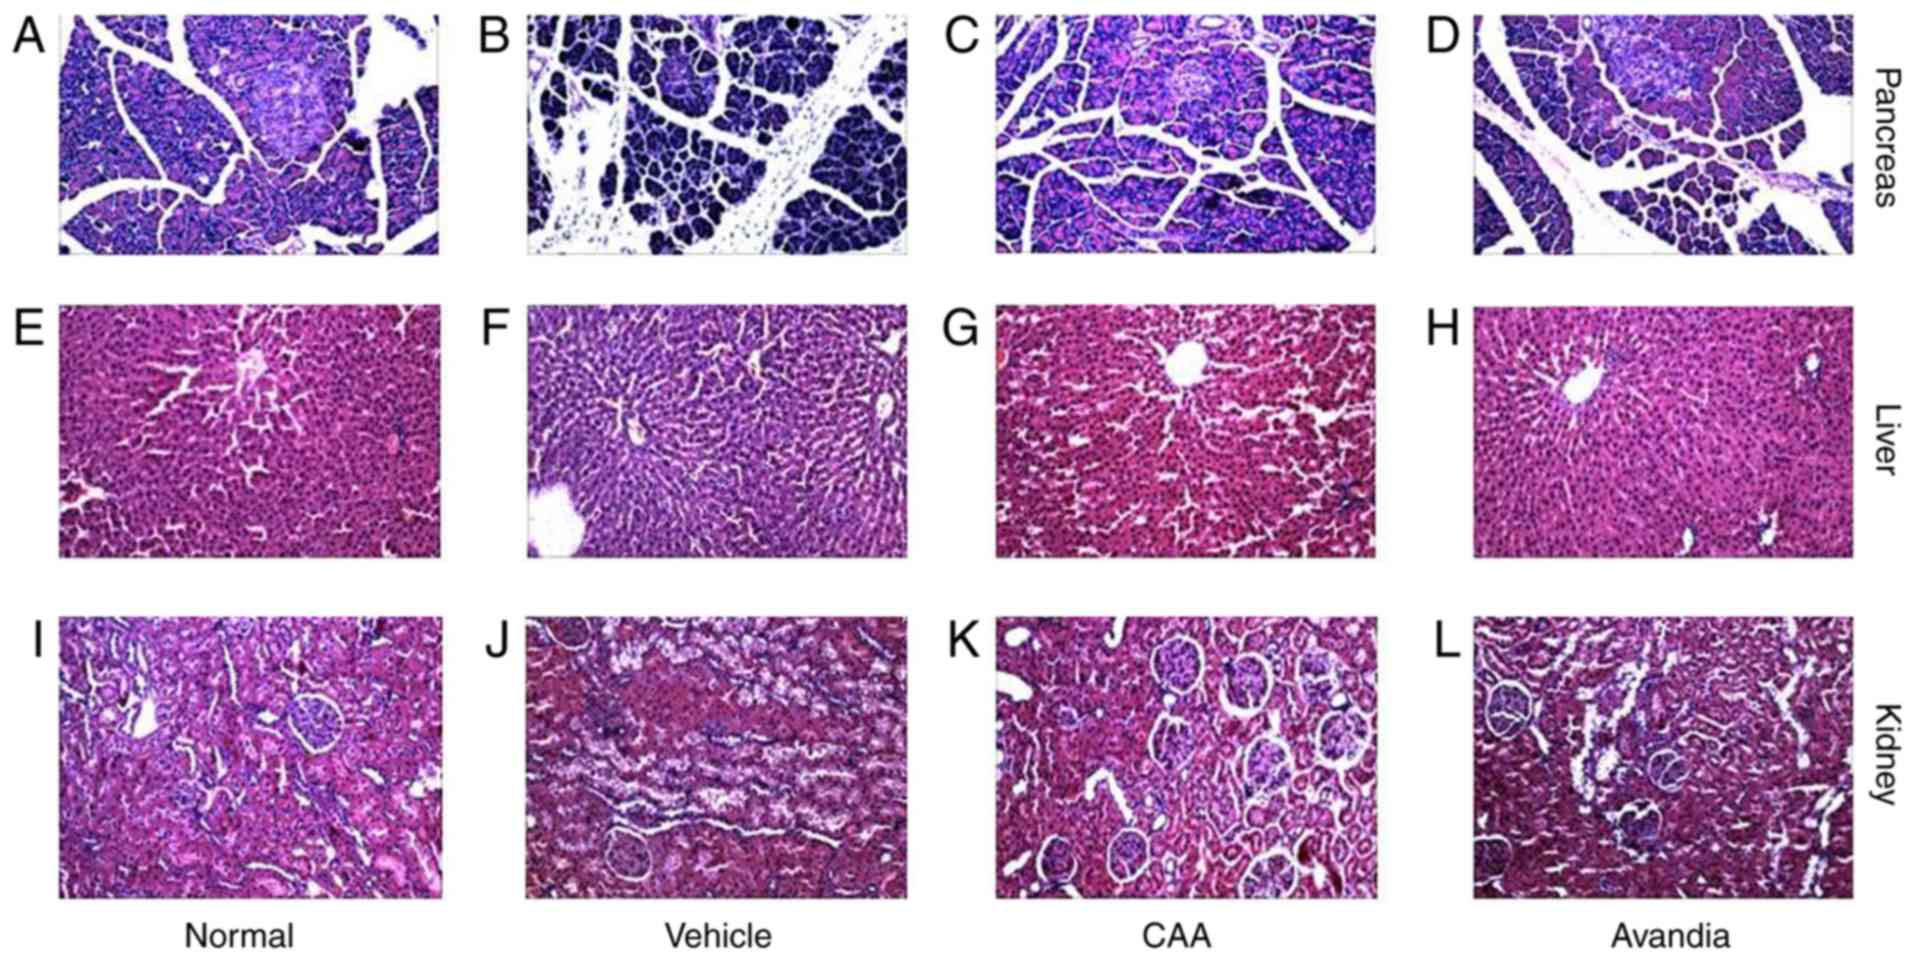
CAA mitigates the organ damage induced by
hyperglycemia and hyperlipidemia
Hyperglycemia and hyperlipidemia induce dysfunctions
and damage in important body organs, including the pancreas, liver
and kidneys. As shown in Fig. 7,
in addition to impaired β-cell function (Fig. 7B), the vehicle-treated diabetic
rats exhibited significantly (P<0.05) higher serum levels of
AST, ALT (Fig. 7C), urea and
creatinine (Fig. 7D), and
increased liver to body weight ratio (P<0.001) (Fig. 7C), all of which are indicators of
liver swelling, and liver and kidney dysfunction. Furthermore, the
histopathological analysis of these rats revealed significant
damages in the pancreas (Fig.
8A–D), including acinar atrophy, interstitial widening,
steatosis, interstitial fibers and inflammation in the pancreatic
islets, in the liver (Fig. 8E–H),
including severe spotty necrosis of liver cells and fatty
degeneration, and the kidney (Fig.
8I–L), including tubular dilatation, diffuse thickening of the
basement membrane and a large number of glycogen vacuoles on
proximal tubular epithelial cells.
Following CAA treatment, insulin secretion remained
stable, whereas the serum levels of glucose (P<0.05), AST
(P<0.05) and ALT (P<0.01) decreased significantly in the T2DM
SD rats. Treatment with 10 mg/kg/day CAA intraperitonally also
mitigated the damage to the pancreas, liver and kidney in the T2DM
SD rats, showing similar results as Avandia in increasing insulin
sensitivity, and improved β-cell and liver function (Figs. 7B-D and 8).
Effects of CAA in ob/ob mice
The efficacy of CAA in congenital obese and
hyperglycemic ob/ob mice was further investigated. As shown
in Fig. 9A and B, CAA (8
mg/kg/day intraperitoneally for 12 days) caused time-dependent
reductions in BW and FBG, compared with those of the vehicle
treated groups (P<0.01). Treatment with CAA significantly
decreased FBG on day 5 and day 12 (Fig. 9A), and BW on day 12 (Fig. 9B). In addition, CAA treatment
significantly improved the oral glucose tolerance (Fig. 9C and D). Blood glucose was
measured at 0, 30, 60 and 120 min on days 0 and 12. On day 12,
following 120 min of oral glucose tolerance tests, the blood
glucose level of the CAA-treated group was 17.5±2.5 mM, whereas
that of the vehicle treated group reached 28.5±1.4 mM (P<0.01),
which indicated the potential of CAA in treating obesity and
obesity-induced metabolic disorders.
CAA inhibits hormone-induced adipocyte
differentiation by inhibiting the expression of adipogenic
genes
To understand the mechanism of action of CAA in
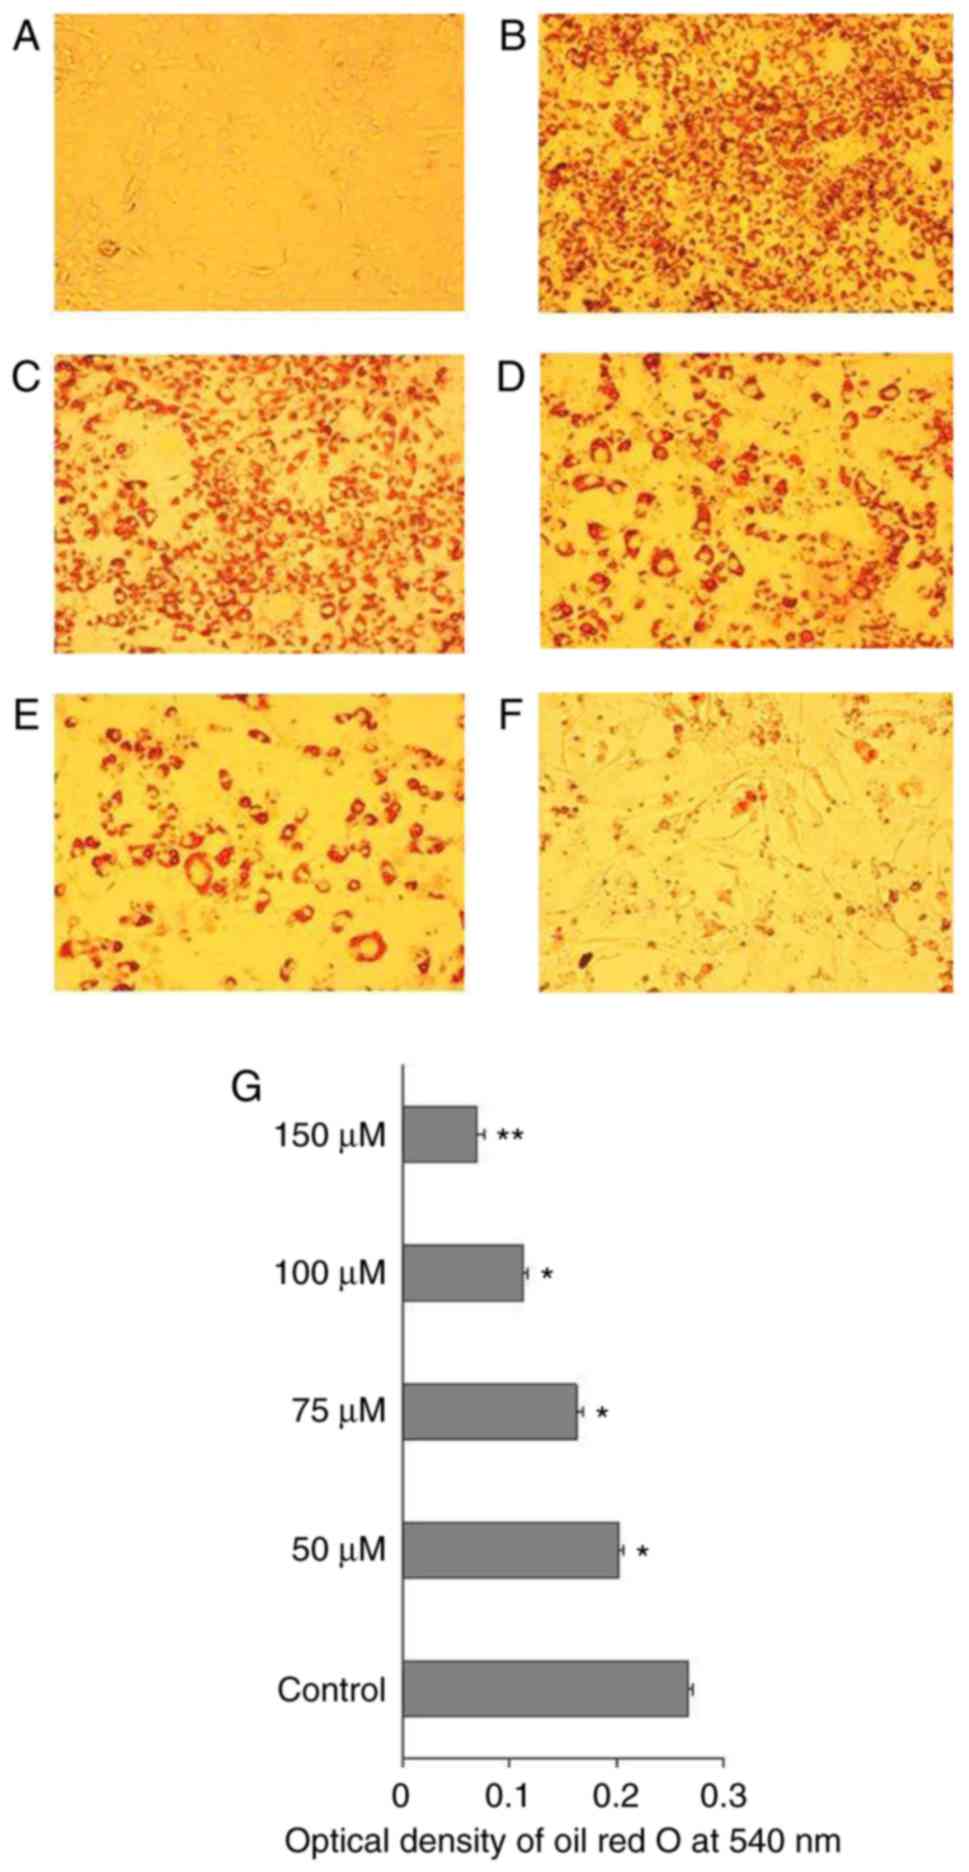
ob/ob mice, the effects of CAA on hormone-induced
adipogenesis were examined in murine 3T3-L1 preadipocytes. The Oil
Red O staining results showed that the treatment comprising a
mixture of Dex, IBMX and insulin successfully induced the
differentiation of 3T3-L1 preadipocytes (Fig. 10A) into mature adipocytes
(Fig. 10B). The addition of 150,
100, 75 or 50 µM CAA resulted in a dose-dependent reduction
in Oil Red O staining, which indicated that treatment with CAA
inhibited adipocyte differentiation (Fig. 10C-G). In order to further clarify
the role of CAA in inhibiting the adipocyte differentiation, the
mRNA expression levels of genes encoding critical factors
regulating adipose differentiation, including PPARγ, CCAAT enhancer
binding protein α (C/EBP-α), adipocyte determination and
differentiation factor 1/sterol regulatory element binding protein
1c (ADD1/SREBP1c), in addition to adipogenesis-related genes,
including adipocyte fatty acid-binding protein 2 (AP2), lipoprotein
lipase (LPL) and fatty acid synthase (FAS), were evaluated using
RT-qPCR analysis following treatment with 50, 100, and 150
µM CAA for 8 days during differentiation. As shown in
Fig. 11, compared with the cells
without differentiation media, the expression levels of PPARγ,
ADD1/SREBP1c, LPL (Fig. 11A),
C/EBP-α, AP2 and FAS (Fig. 11B)
were markedly increased in the cells in differentiation medium.
However, treatment with CAA suppressed the mRNA levels of various
adipogenic genes in a dose-dependent manner, which suggested that
CAA treatment inhibited adipocyte differentiation by downregulating
the adipogenic genes.
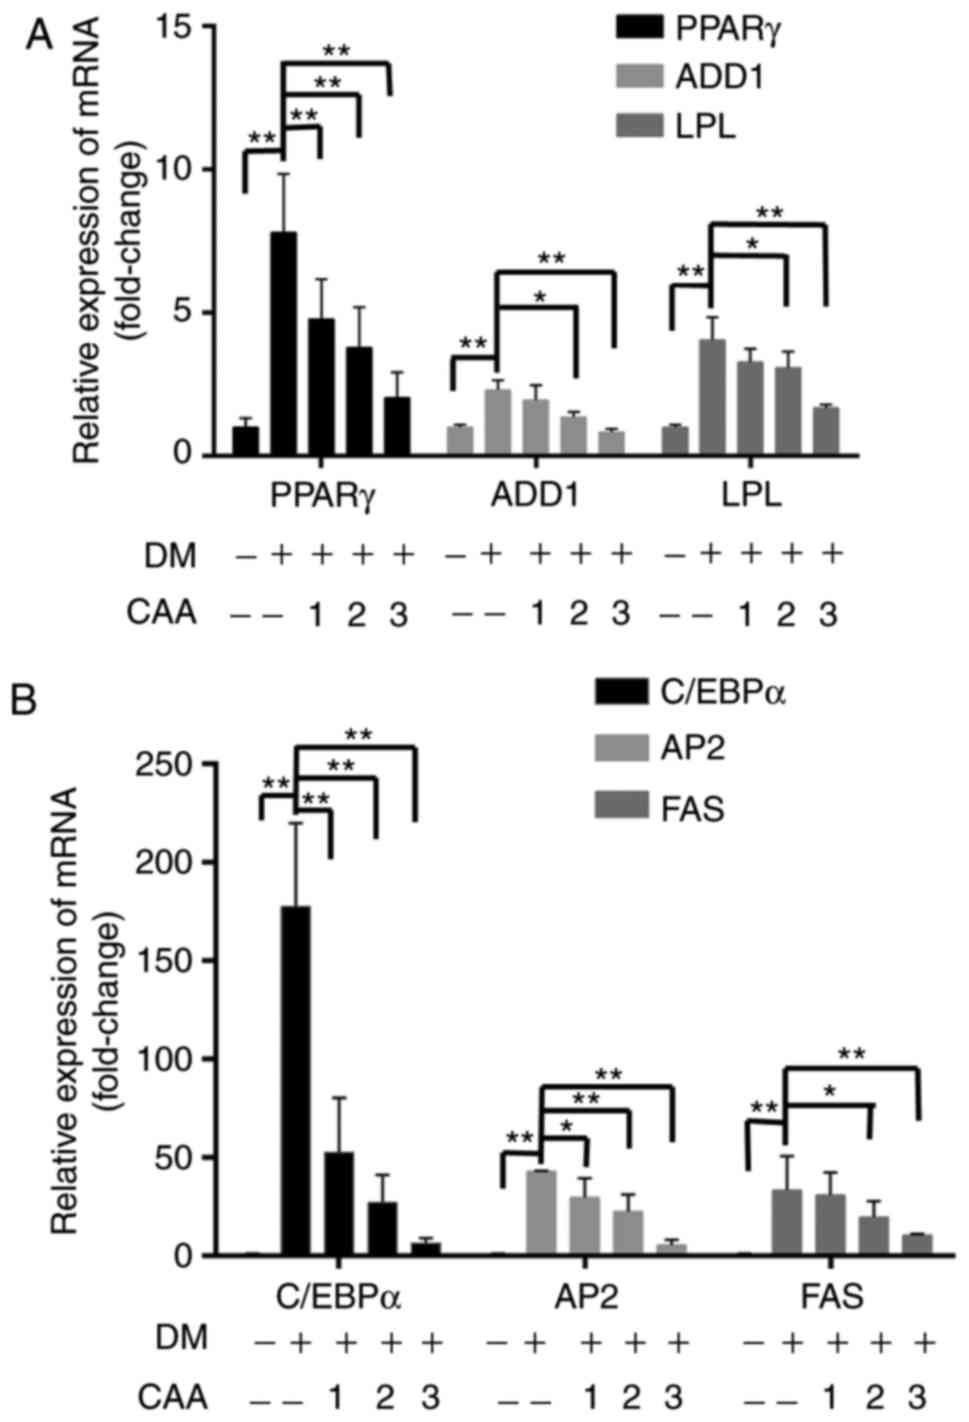 | Figure 11Effects of CAA on the expression of
adipogenic genes in 3T3-L1 cells. Post-confluent 3T3-L1
preadipocytes were differentiated in the absence or presence of CAA
for 8 days. mRNA expression levels of (A) PPARγ, ADD1, LPL and (B)
C/EBPα, AP2 and FAS were measured using reverse
transcription-quantitative polymerase chain reaction analysis. All
the results are expressed as the mean ± standard error of the mean
(n=6). *P<0.05 and **P<0.01. 1, 2 and 3
indicate CAA concentrations of 50, 100 and 150 µM,
respectively. CAA, cajanonic acid A; PPAR, peroxisome
proliferator-activated receptor γ; ADD1, adipocyte determination
and differentiation factor 1; LPL, lipoprotein lipase; C/EBPα,
CCAAT enhancer binding protein α; AP2, adipocyte fatty acid-binding
protein 2; FAS, fatty acid synthase; DM, differentiation
medium. |
Discussion
Diabetes mellitus has become a prevalent metabolic
disease worldwide (1). Insulin
resistance and impaired insulin secretion are the principal causes
of T2DM (18). Insulin resistance
is a complex metabolic abnormality and is a common cause of concern
in prediabetics and diabetics. It affects the ability of peripheral
tissues to use insulin, thus impairs peripheral glucose utilization
and results in the development of hyperglycemia and/or compensatory
hyperinsulinemia (19).
Previous studies reported high expression levels of
PTP1B in patients with T2DM and hyperlipidemia (10). PTP1B also regulates the activation
of leptin and IR (5,7). Therefore, the present study
investigated the ability of PTP1B to regulate insulin resistance.
The results of the present study revealed that CAA functioned as an
insulin sensitizer by inhibiting PTP1B. In addition, the results
indicated that CAA treatment inhibited the activity of PTP1B and
affected the expression of associated insulin signaling factors in
the PTP1B overexpression-induced insulin resistance. Additionally,
the CAA treatments used in the present study exhibited hypoglycemic
and hypolipidemic effects in vivo. In the SD rats fed on a
high-fat diet and with STZ-induced T2DM, treatment with CAA and but
also protected the animals from organ damage. In the
leptin-deficient ob/ob mice, which were congenitally obese
and hyperglycemic, treatment with CAA reduced blood glucose and led
to weight loss, showing the potential of CAA to treat
obesity-associated diabetes.
The insulin signaling pathway is important in
regulating glucose metabolism and maintaining glucose homeostasis.
In target cells, the binding of extracellular insulin to the
α-subunit of plasma membrane-located IR activates the β-subunit by
autophosphorylation, which leads to the successive phosphorylation
and activation of downstream signaling molecules, including IRS,
PI3K and AKT (20). The
activation of PI3K/AKT in adipose cells stimulates the
translocation of intracellular GLUT4 vesicles to the membrane to
transport glucose for storage. However, the activation of PI3K/AKT
in liver cells promotes glycogen synthesis by inactivating GSK3β
and increasing glucose transport by GLUT1 (21-23). The dephosphorylation of actively
signaling molecules by the overexpression of PTP1B impairs
insulin-stimulated signal transduction, which leads to a state of
reduced glucose uptake, a condition known as insulin resistance
(24). The findings of the
present study were in accordance with this hypothesis, as the same
results were observed in each of the PTP1B-transfected HepG2 cells,
Dex-induced insulin-resistant HepG2 cells and 3T3-L1 adipocytes. In
the present study, insulin alone was unable to promote the glucose
consumption of cells overexpressing PTP1B; however, it was markedly
increased in the presence of CAA, which indicated the ability of
CAA to function as an insulin sensitizer. Mechanistic experiments
revealed that CAA inhibited the activity and expression of PTP1B.
CAA also increased the phosphorylation of IR, IRS1, PI3K and AKT,
and the expression of GLUT1, in the insulin-resistant HepG2 cells.
Additionally, CAA treatment increased the expression of GLUT4 in
the insulin-resistant 3T3-L1 adipocytes, suggesting the potential
of CAA to activate insulin signaling. In the present study,
treatment with CAA reversed insulin sensitivity through the
PI3K/AKT pathway by regulating the expression levels of IRS and
GLUT in vitro. In addition, the mice lacking PTP1B exhibited
an advantage towards blood glucose homeostasis in specific tissues.
The liver-specific downregulation of PTP1B in the mice resulted in
enhanced glucose homeostasis and improved lipid profiles in liver,
irrespective of the changes taking place in adiposity (25). In addition, treatment with CAA not
only improved the functions of the liver, kidney and pancreas in
the mice with T2DM, it also exerted a positive effect against T2DM.
The HepG2 cell line was used in the present study, and this cell
line has been demonstrated as a hepatoblastoma line (26). However, this misidentification is
not likely to affect the outcomes or conclusions of the present
study.
The expression of PTP1B has been reported to be key
in regulating obesity (8,27,28). PTP1B−/− mice have been
reported to produce reduced hepatic secretions of apolipoprotein B
(apoB100) lipoproteins, one of the hallmarks of the lipid
abnormalities of the metabolic syndrome (29). In the present study, the serum
levels of TC (P<0.01), TG (P<0.01) and LDL-C (P<0.001) in
the vehicle-treated T2DM rats were increased, and these factors
were successfully reduced by CAA treatment. This indicated that CAA
regulated the lipid metabolism via downregulating the expression of
PTP1B. In addition, the efficacy of CAA in the congenitally obese
and hyperglycemic ob/ob mice indicated the potential of CAA
to treat obesity and obesity-induced metabolic disorder. PPARγ and
C/EBPα are key transcription factors involved in adipocyte
differentiation and adipogenesis. Their activity is essential for
inducing adipogenesis. Furthermore, the transcription factor ADD1
can positively regulate the expression of PPARγ by binding to the
PPARγ promoter (30), FAS,
and LPL are typical factors in adipocyte differentiation and
adipo-genesis (31). Therefore,
PPARγ, C/EBPα, ADD1/SREBP1c, AP2, Fas and LPL, were selected as
indicators of lipid metabolism in the present study. CAA treatment
in the present study inhibited adipocyte differentiation,
accompanied by decreased mRNA levels of the adipogenic genes,
including PPARγ, C/EBPα, ADD1/SREBP1c, AP2, FAS and LPL. These
results indicated that the treatment with CAA decreased the
expression of adipogenic genes, thus inhibited the adipocyte
differentiation and adipogenesis in ob/ob mice by
downregulating PPARγ (32).
However, Avandia is a clinically used insulin sensitizer, which
functions as a PPARγ agonist. The results of the present study
suggested that CAA also served as an insulin sensitizer, but that
its mode of action was different from that of Avandia. Therefore,
treatment of CAA may be used to restore insulin signaling
transduction by inactivating PTP1B, and by downregulating PPARγ to
avoid the side-effects of Avandia, including weight gain and fluid
retention.
In conclusion, CAA treatment restored insulin
signaling transduction by inhibiting the activity of PTP1B and
activating insulin signaling transduction. Additionally, treatment
with CAA was not only important in reducing blood glucose and
preventing organ damage caused by hyperglycemia and hyperlipidemia,
but also inhibited adipocyte differentiation and adipogenesis. The
results of the present study indicated that CAA serves as a
candidate for drug design and clinical applications and offers
potential to restore insulin resistance and treat
obesity-associated diabetes.
Funding
This study was financially supported by China
National Major Projects of Science and Technology (grant nos.
2009ZX09103-436 and 2014ZX10005002), the National Natural Science
Foundation of China (grant no. 81202968) and the Project of
Guangzhou University of Chinese Medicine (grant nos.
E1-KFD015141K05 and A 1-AFD01816Z1516).
Availability of data and materials
The datasets used and/or analyzed during the current
study are available from the corresponding author on reasonable
request.
Authors' contributions
LW, JX, XL, SQ and SL performed the experiments and
collected the data. XS, RY and YH conceived the study, performed
the experiments, analyzed the data and wrote the paper with input
from all authors.
Ethics approval and consent to
participate
All experiments were approved by the Animal Ethics
Committee of Guangzhou University of Chinese Medicine (no.
SYXY2008-0001) and were performed following the Animal Care and Use
guidelines set by the committee.
Patient consent for publication
Not applicable.
Competing interests
The authors declare that they have no competing
interests.
Acknowledgments
Not applicable.
References
|
1
|
Kahn BB: Type 2 diabetes: When insulin
secretion fails to compensate for insulin resistance. Cell.
92:593–596. 1998. View Article : Google Scholar : PubMed/NCBI
|
|
2
|
Kahn SE, Hull RL and Utzschneider KM:
Mechanisms linking obesity to insulin resistance and type 2
diabetes. Nature. 444:840–846. 2006. View Article : Google Scholar : PubMed/NCBI
|
|
3
|
Mayer-Davis EJ, D'Agostino R Jr, Karter
AJ, Haffner SM, Rewers MJ, Saad M and Bergman RN: Intensity and
amount of physical activity in relation to insulin sensitivity: The
insulin resistance atherosclerosis study. JAMA. 279:669–674. 1998.
View Article : Google Scholar : PubMed/NCBI
|
|
4
|
Kaur J: A comprehensive review on
metabolic syndrome. Cardiol Res Pract. 2014:9431622014. View Article : Google Scholar : PubMed/NCBI
|
|
5
|
Ma YM, Tao RY, Liu Q, Li J, Tian JY, Zhang
XL, Xiao ZY and Ye F: PTP1B inhibitor improves both insulin
resistance and lipid abnormalities in vivo and in vitro. Mol Cell
Biochem. 357:65–72. 2011. View Article : Google Scholar : PubMed/NCBI
|
|
6
|
Seely BL, Staubs PA, Reichart DR, Berhanu
P, Milarski KL, Saltiel AR, Kusari J and Olefsky JM: Protein
tyrosine phosphatase 1B interacts with the activated insulin
receptor. Diabetes. 45:1379–1385. 1996. View Article : Google Scholar : PubMed/NCBI
|
|
7
|
Knobler H and Elson A: Metabolic
regulation by protein tyrosine phosphatases. J Biomed Res.
28:157–168. 2014.PubMed/NCBI
|
|
8
|
Elchebly M, Payette P, Michaliszyn E,
Cromlish W, Collins S, Loy AL, Normandin D, Cheng A, Himms-Hagen J,
Chan CC, et al: Increased insulin sensitivity and obesity
resistance in mice lacking the protein tyrosine phosphatase-1B
gene. Science. 283:1544–1548. 1999. View Article : Google Scholar : PubMed/NCBI
|
|
9
|
Klaman LD, Boss O, Peroni OD, Kim JK,
Martino JL, Zabolotny JM, Moghal N, Lubkin M, Kim YB, Sharpe A, et
al: Increased energy expenditure, decreased adiposity, and
tissue-specific insulin sensitivity in protein-tyrosine phosphatase
1B-deficient mice. Mol Cell Biol. 20:5479–5489. 2000. View Article : Google Scholar : PubMed/NCBI
|
|
10
|
Koren S and Fantus IG: Inhibition of the
protein tyrosine phosphatase PTP1B: Potential therapy for obesity,
insulin resistance and type-2 diabetes mellitus. Best Pract Res
Clin Endocrinol Metab. 21:621–640. 2007. View Article : Google Scholar : PubMed/NCBI
|
|
11
|
Sun C, Zhang F, Ge X, Yan T, Chen X, Shi X
and Zhai Q: SIRT1 improves insulin sensitivity under
insulin-resistant conditions by repressing PTP1B. Cell Metab.
6:307–319. 2007. View Article : Google Scholar : PubMed/NCBI
|
|
12
|
Obanda DN and Cefalu WT: Modulation of
cellular insulin signaling and PTP1B effects by lipid metabolites
in skeletal muscle cells. J Nutr Biochem. 24:1529–1537. 2013.
View Article : Google Scholar : PubMed/NCBI
|
|
13
|
Qiu SX and Shen XL: A hypoglycemic and
slimming stilbenoidal natureal medicine. CN Patent 101422450. Filed
October 9, 2008; issued May 6, 2009.
|
|
14
|
Cai JZ, Tang R, Ye GF, Qiu SX, Zhang NL,
Hu YJ and Shen XL: A Halogen-containing stilbene derivative from
the leaves of Cajanus cajan that induces osteogenic differentiation
of human mesenchymal stem cells. Molecules. 20:10839–10847. 2015.
View Article : Google Scholar : PubMed/NCBI
|
|
15
|
Yuan J, Lin J, Xu C, Ye Q, Xiong Y, Huang
L and Yuan H: Experimental research on prevention of
glucocorticoid-induced avascular necrosis of the femoral head with
tongluo shenggu capsule. Tradit Chin Drug Res Clin Pharmacol.
16:185–188. 2005.In Chinese.
|
|
16
|
Livak KJ and Schmittgen TD: Analysis of
relative gene expression data using real-time quantitative PCR and
the 2(−delta delta C(T)) method. Methods. 25:402–408. 2001.
View Article : Google Scholar
|
|
17
|
Samuel VT, Petersen KF and Shulman GI:
Lipid-induced insulin resistance: Unravelling the mechanism.
Lancet. 375:2267–2277. 2010. View Article : Google Scholar : PubMed/NCBI
|
|
18
|
Nandi A, Kitamura Y, Kahn CR and Accili D:
Mouse models of insulin resistance. Physiol Rev. 84:623–647. 2004.
View Article : Google Scholar : PubMed/NCBI
|
|
19
|
Duque-Guimaraes DE and Ozanne SE:
Nutritional programming of insulin resistance: Causes and
consequences. Trends Endocrinol Metab. 24:525–535. 2013. View Article : Google Scholar : PubMed/NCBI
|
|
20
|
Krook A, Wallberg-Henriksson H and Zierath
JR: Sending the signal: molecular mechanisms regulating glucose
uptake. Med Sci Sports Exerc. 36:1212–1217. 2004. View Article : Google Scholar : PubMed/NCBI
|
|
21
|
Huang S and Czech MP: The GLUT4 glucose
transporter. Cell Metab. 5:237–252. 2007. View Article : Google Scholar : PubMed/NCBI
|
|
22
|
Lochhead P, Coghlan M, Rice S and
Sutherland C: Inhibition of GSK-3 selectively reduces
glucose-6-phosphatase and phosphatase and phosphoenolypyruvate
carboxykinase gene expression. Diabetes. 50:937–946. 2001.
View Article : Google Scholar : PubMed/NCBI
|
|
23
|
Chi YJ, Li J, Guan YF and Yang JC:
PI3K/Akt signaling axis in regulation of glucose homeostasis. Chin
J Biochem Mol Biol. 26:879–885. 2010.In Chinese.
|
|
24
|
Bhattacharya S, Dey D and Roy SS:
Molecular mechanism of insulin resistance. J Biosci. 32:405–413.
2002. View Article : Google Scholar
|
|
25
|
Delibegovic M, Zimmer D, Kauffman C, Rak
K, Hong EG, Cho YR, Kim JK, Kahn BB, Neel BG and Bence KK:
Liver-specific deletion of protein-tyrosine phosphatase 1B (PTP1B)
improves metabolic syndrome and attenuates diet-induced endoplasmic
reticulum stress. Diabetes. 58:590–599. 2009. View Article : Google Scholar :
|
|
26
|
López-Terrada D, Cheung SW, Finegold MJ
and Knowles BB: Hep G2 is a hepatoblastoma-derived cell line. Hum
Pathol. 40:1512–1515. 2009. View Article : Google Scholar : PubMed/NCBI
|
|
27
|
Cheng A, Uetani N, Simoncic PD, Chaubey
VP, Lee-Loy A, McGlade CJ, Kennedy BP and Tremblay ML: Attenuation
of leptin action and regulation of obesity by protein tyrosine
phosphatase 1B. Dev Cell. 2:497–503. 2002. View Article : Google Scholar
|
|
28
|
Bence KK, Delibegovic M, Xue B, Gorgun CZ,
Hotamisligil GS, Neel BG and Kahn BB: Neuronal PTP1B regulates body
weight, adiposity and leptin action. Nat Med. 12:917–924. 2006.
View Article : Google Scholar : PubMed/NCBI
|
|
29
|
Goldstein BJ: Regulation of insulin
receptor signaling by protein-tyrosine dephosphorylation. Receptor.
3:1–15. 1993.PubMed/NCBI
|
|
30
|
Lee JE and Ge K: Transcriptional and
epigenetic regulation of PPARγ expression during adipogenesis. Cell
Biosci. 4:1–11. 2014. View Article : Google Scholar
|
|
31
|
Song DD, Chen Y, Li ZY, Guan YF, Zou DJ
and Miao CY: Protein tyrosine phosphatase 1B inhibits adipocyte
differentiation and mediates TNFα action in obesity. Biochim
Biophys Acta. 1831:1368–1376. 2013. View Article : Google Scholar : PubMed/NCBI
|
|
32
|
Gregoire FM, Smas CM and Sul HS:
Understanding adipocyte differentiation. Physiol Rev. 78:783–809.
1998. View Article : Google Scholar : PubMed/NCBI
|