Introduction
Although endometrial carcinoma (EC) is one of the
most frequent malignant gynaecological diseases in developed
countries, its occurrence in developing countries is lower
(1). EC in North American and
European female populations accounts for almost 6% of all cancer
cases and 3% of all cases of cancer-associated mortality, and the
incidence varies between 19 and 25/100,000 women (2). Although ~10% of diagnosed EC is
hereditary (3), the remaining 90%
is sporadic; with EC typical in older, postmenopausal women.
Statistics also show that 15% of women are diagnosed before the age
of 50 years, and 5% before the age of 40 years (4).
The formation of EC is associated with the presence
of polycystic ovary syndrome (5),
obesity (6), nulliparity
(7), hyperinsulinaemia (8) and excessive exposure to oestrogen
manifested in earlier menarche (9). The therapeutic use of tamoxifen in
women with, or at high risk of, breast cancer is also potentiality
implicated in increased EC incidence (10) and there are further
inter-connections, including in vitro-fertilisation
treatment and higher frequencies of miscarriages and abortions
(11).
Endometrial hyperplasia is another important risk
factor in EC as it can develop into adenocarcinoma. There are four
types of endometrial hyperplasia: Simple hyperplasia (progressing
to cancer in 1% of cases), complex hyperplasia (progressing to
cancer in 3%), simple atypical hyperplasia (progressing to cancer
in 8%), and complex atypical hyperplasia (progressing to cancer in
29%) (12).
Endometrial malignancies are traditionally
classified under types I and II, dependent on hyperplasia formation
(13). Type I distinguishes
70–80% of tumours and these are characterised as
oestrogen-dependent and preceded by hyperplasia formation. They are
low grade, diploid and highly differentiated and more common in
obese women. The remaining 20–30% is classified as Type II, which
is considered oestrogen-independent and associated with atrophy and
aneuploidy. These are high-grade, poorly differentiated and linked
to higher metastatic risk and resultant poor prognosis (14).
Types of EC are differentiated by histopathological
characteristics into endometrioid carcinoma (up to 75%, typically
associated with type I tumours), serous carcinoma, carcinosarcoma
and clear-cell carcinoma (15).
Although this classification remains the main diagnostic tool,
studies have highlighted the importance of incorporating genetic
profile and risk determination models (16–18). Molecular approaches may also
describe EC biological characteristics and features more
accurately, distinguish between subtypes, and substantially improve
predictive and treatment approaches (16,18–22) as each EC subtype has a distinct
mutation profile (17,18,23).
In addition to genetic factors, several epigenetic
mechanisms are involved in endometrial carcinogenesis (24,25). Previous analyses have
predominantly focused on methylation changes in the promoter
regions of genes involved in oestrogen metabolism, the DNA mismatch
repair system and signalling pathways, including human mutL homolog
1 (26,27), cyclin-dependent kinase inhibitor
2A (27), estrogen receptor 1
(28), progesterone receptor-B
(29), phosphatase and tensin
homolog (30), Ras association
domain family member 1A (31),
O-6-methylguanine-DNA methyltransferase (32) and adenomatous polyposis coli
(33,34).
For the purpose of the present study, the kruppel
like factor 4 (KLF4) and heparan sulfate-glucosamine
3-sulfotransferase 2 (HS3ST2) cancer-related genes were
analysed. KLF4 is part of the Kruppel-like gene family with
‘zinc-finger’ transcription factor. The main role of this gene is
to maintain cell cycle integrity (35) and thus influence the growth,
differentiation, proliferation and programmed apoptosis of somatic
cells (36). KLF4 inhibits
cell proliferation as a control protein via the activation of p21,
which normally inhibits cyclin-dependent kinases (37). It also acts as a mediator in
arresting the cell cycle following recognition of damage in the
G1/S phase and eventually at the G2/M
checkpoint, with this process being mediated by p53 activity
(35,38). The methylation levels of
KLF4 are generally lower in certain types of cancer,
including oesophageal (39),
pancreatic (40), lung (41), brain (42) and gastric cancer (43).
By contrast, the HS3ST2 gene encodes the
heparansulfate 3-O-sulfotransferase 2 enzyme, which is a key
component in heparansulfate (HS) fine structure biosynthesis
involved in multiple biologic activities (44). Each enzyme in this cascade has a
tissue-specific role and serves as a substrate for the subsequent
reaction. Therefore, change in even one enzyme, including
heparansulfate 3-O-sulfotransferase 2, leads to the diverse
HS structure (45) involved in
several types of cancer (44,46).
The present case-control study is unique in that it
involves comparison of KLF4 and HS3ST2 methylation
status in EC, hyperplasia and normal endometrial tissue; by the
investigation of other clinical and histopathological data roles in
methylation status, and by the quantification of predictor
diagnostic accuracy by the area under the ROC curve (AUC).
Materials and methods
Patients and clinical pathological
characteristics
The sample group comprised 172 Caucasian women
hospitalised at the Department of Obstetrics and Gynaecology at
Martin University Hospital (Martin, Slovakia) between 2011 and
2017. Tissue was analysed from 91 patients with EC, 36 with
hyperplasia and 45 with normal endometrial tissue. Each tissue
underwent standard histopathological analyses at the Department of
pathology at Martin University Hospital. This provided histological
type, degree of differentiation (G), and parameters of
tumour-node-metastasis classification (Table I). Information on personal and
gynaecological anamnesis was obtained during medical examination.
This comprised body mass index (BMI), hypertension, diabetes
mellitus, age at menarche, parity, abnormal uterine bleeding and
abortion, and smoking habit.
 | Table IHistopathological characteristics of
the endometrial cancer and hyperplasia groups. |
Table I
Histopathological characteristics of
the endometrial cancer and hyperplasia groups.
| Characteristic | n | % |
|---|
| Endometrial cancer
(n=91) | | |
| Endometroid | 78 | 85.7 |
| Endometroid with
squamous differentiation | 9 | 9.9 |
| Othera | 4 | 4.4 |
| Stage (pT) | | |
| T0 | 1 | 1.1 |
| T1a | 35 | 38.4 |
| T1b | 35 | 38.4 |
| T2 | 11 | 12.2 |
| T3a | 6 | 6.6 |
| T3b | 3 | 3.3 |
| Lymph node
metastasis (pN) | | |
| N0 | 34 | 37.0 |
| N1 | 6 | 6.5 |
| Nx | 51 | 56.5 |
| Histological
grade | | |
| G1 | 19 | 20.9 |
| G2 | 49 | 53.8 |
| G3 | 23 | 25.3 |
| Hyperplasia
(n=36) | | |
| Simplex
hyperplasia | 21 | 58.3 |
| Simplex hyperplasia
with atypia | 5 | 13.9 |
| Complex hyperplasia
with atypia | 10 | 27.8 |
DNA isolation and bisulfide
modification
Tissue samples were stabilised in RNAlater solution
immediately following sectioning and frozen at −20°C. DNA was then
extracted by the column method (DNeasy Blood and Tissue
Kit®, Qiagen GmbH, Hilden Germany). The qualitative
parameters of the isolated DNA were assessed by 1.5% agarose gel
electrophoresis and the DNA concentration was measured using a
Nanodrop® device. Only samples with sufficient
concentration of at least 100 ng/µl were considered for
further processing. Genomic DNA (1 µg) was used for the
bisulfite conversion performed using the Epitect bisulfite
kit® (Qiagen GmbH): 1 µg of DNA dissolved in
nuclease-free water was mixed with 85 µl of bisulfite mix
and 35 µl of DNA protect buffer and amplified. The
concentration of bisulfite modified samples was measured
spectrophotometrically and samples were frozen to −20°C.
Methylation analyses
The methylation levels of three CpG sites in the
HS3ST2 gene and six CpG sites in the KLF4 gene were
analysed by pyrosequencing (Pyromark Q96 ID device). This is a
quantitative, precise real-time sequencing methodology. The visible
light emitted in the final step of the enzymatic cascade was
scanned using a CCD camera; with the rate of light emission
retaining continuous proportion with the number of incorporated
nucleotides.
Pyro-sequencing has PCR amplification and sequencing
phases; DNA amplification required 25 µl total volume
(Pyromark PCR Kit® Qiagen GmbH) containing 2X pyromark
PCR master mix, 10X coral load concentrate, 1 µl 25 mM
MgCl2, 5X Q solution, 0.24 µM primer mix, RNase
free water and bisulfide-modified DNA). The PCR reaction steps were
as follows: Activation of polymerase (95°C, 15 min); 45 cycles of:
Denaturation (94°C, 15 sec), annealing (56°C, 30 sec), extension
(72°C, 30 sec) and final extension at 72°C for 10 min. The
ampli-cons were then assessed by 1.5% agarose gel
electrophoresis.
The PCR product (20 µl) was mixed with
streptavidin-coated sepharose beads (GE Healthcare Life Sciences,
Chalfont, UK), binding buffer and nuclease free water in a total
volume of 80 µl. The 5′-biotiniled strand for sequencing was
immobilised, transferred to 0.4 M sequencing primer and binding
buffer solution (Qiagen GmbH) and incubated for 2 min at 80°C. The
samples were analysed by Pyromark Q96 ID and interpreted by
Pyromark Q96 software v. 2.5.8 (Qiagen GmbH) via calculation of the
C/T ratio and the peak-high of each CpG site. The samples were
analysed in duplicate, and controls comprised commercial methylated
and unmethylated DNAs (diluted to series of 100, 75, 50, 25 and
0%). Commercially available Pyromark CpG assays® (Qiagen
GmbH) provided methylation analyses of the following regulation
sequences: KLF4 5′-CCCGACATACTGACGTGCTGGCGGGCCACGCGCGA-3′;
HS3ST2 5′-TTGGCGAGATGTCGAGAGCGGGGGGA-3′.
Statistical analysis
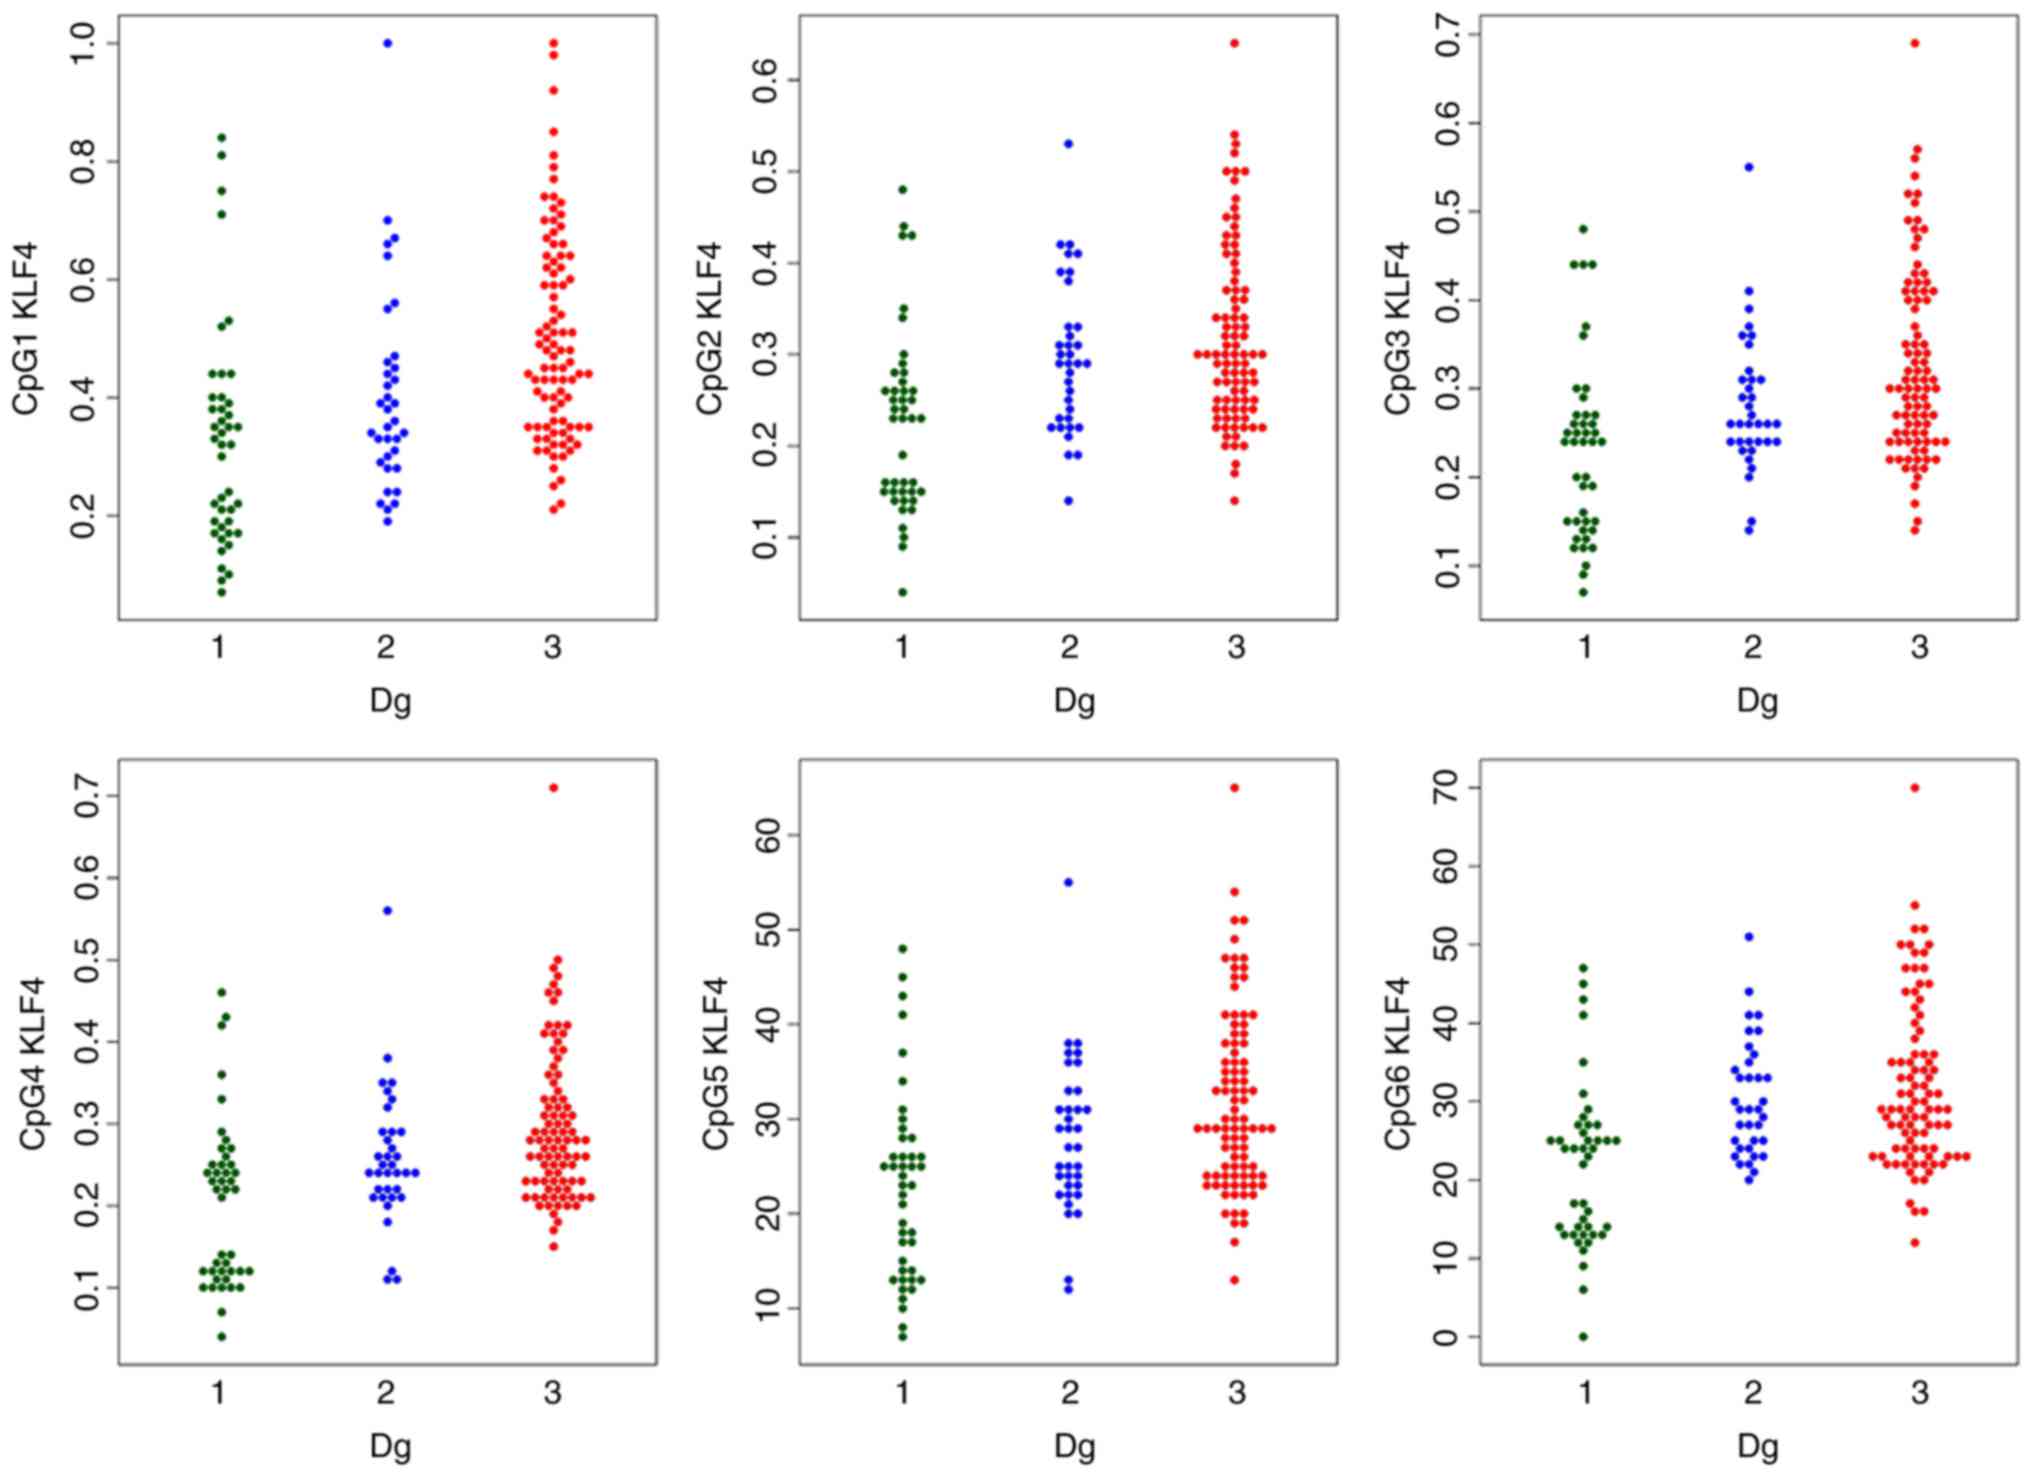
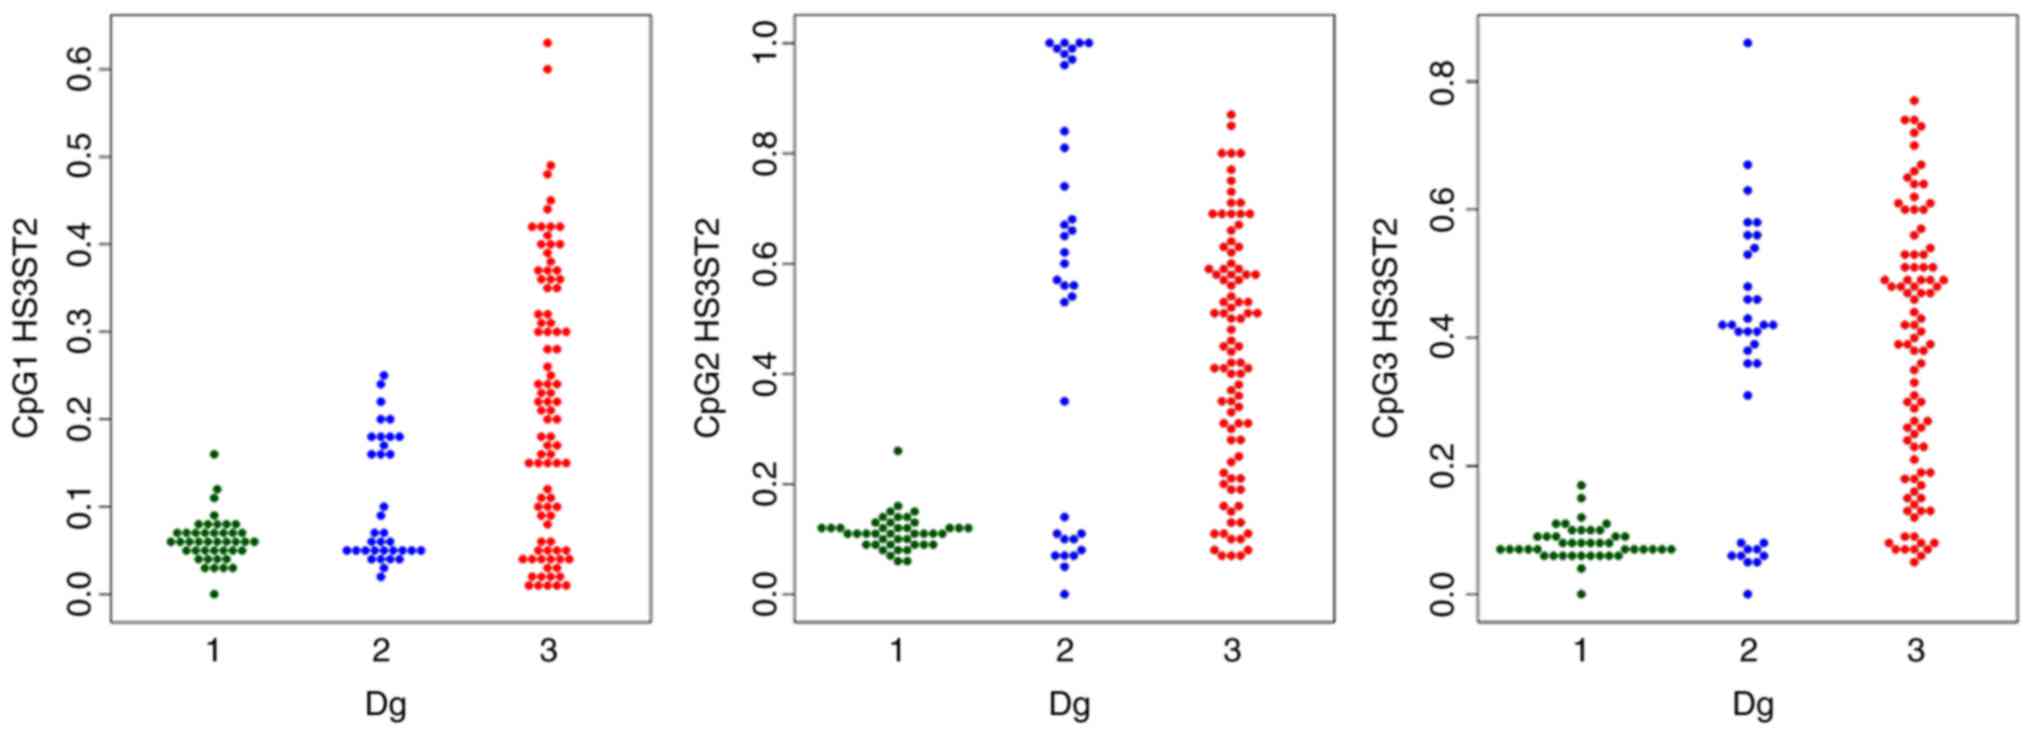
The methylation levels were visualised by swarmplots
(47) (Figs. 1 and 2). The data was not Gaussian, so robust
one-way analysis of variance (ANOVA) (48) was used instead of simple ANOVA to
determine the equality of the CpG methylation population median
levels across the diagnostic groups. Rejection of the ANOVA
hypothesis was followed by Tukey’s HSD post hoc test. Spearman’s
correlation coefficient was used to quantify the strength of the
linear association between quantitative variables.
The methylation index (MI) was calculated as the
mean-percent-methylation across all gene CpG sites (three CpG sites
of the HS3ST2 gene and six CpG sites of the KLF4
gene). The promoter methylation status was theoretically classified
as unmethylated (0–9%), methylated (10–29%) and highly methylated
(30–100%) (49,50). Multinomial logistic regression
then modelled dependence of the diagnosis on age, BMI, menarche,
parity, CpGs and smoking. The model identified CpGs which are
statistically significant predictors of diagnosis, while
controlling the effect of other predictors.
The Random Forest algorithm assessed the diagnostic
accuracy of the predictors. The subset of important predictors was
identified by the minimum tree depth criterion in the nested
cross-validation feature selection (51). The diagnostic accuracy was
quantified by the ROC curve and summarised by the AUC. Finally, the
Younden criterion identified the optimal sensitivity and
specificity. Categorical variable independence was established
using a χ2 test. The analyses were performed in R ver.
3.2.1. (52) and IBM SPSS ver.
21.
Results
Gynaecological anamnesis and risk
factors
The statistically different characteristics in the
EC, hyperplasia and control groups are listed in Table II. The statistics were also
age-adjusted to eliminate age-effect on the variables examined.
| Table IIMean values of age, BMI and menarche
in the three study groups. |
Table II
Mean values of age, BMI and menarche
in the three study groups.
| Factor | Control (n=45) | Hyperplasia
(n=36) | Cancer (n=91) |
χ2/P-value |
|---|
| Age (years) | | | | |
| Mean ± SD | 48.53±11.11 | 53.39±9.64 | 64.16±9.64 | P<0.001 |
| Median | 47.00 | 52.00 | 65.00 | |
| Menarche | | | | |
| Mean ± SD | 13.22±2.01 | 13.17±1.87 | 13.21±1.42 | P=0.375 |
| Median | 13.00 | 14.00 | 13.00 | |
| BMI | | | | |
| Mean ± SD | 28.09±4.82 | 32.05±5.07 | 35.57±3.81 | P<0.001 |
| Median | 28.41 | 32.16 | 35.60 | |
| Menopausal status,
n (%) | | | | |
| Pre | 17 (65.4) | 4 (28.6) | 2 (4.0) |
χ2=42.22 |
| Peri | 4 (15.4) | 3 (21.4) | 3 (6.0) | P<0.001 |
| Post | 5 (19.2) | 7 (50.0) | 45 (90.0) | |
| Parity, n (%) | | | | |
| Yes | 43 (95.6) | 36 (100.0) | 80 (87.9) |
χ2=6.240 |
| No | 2 (4.4) | 0 (0.0) | 11 (12.1) | P=0.044 |
| Bleeding, n
(%) | | | | |
| Yes | 10 (38.5) | 11 (78.6) | 39 (78.0) |
χ2=13.09 |
| No | 16 (61.5) | 3 (21.4) | 11 (22.0) | P=0.001 |
| Hypertension, n
(%) | | | | |
| Yes | 9 (34.6) | 7 (50.0) | 38 (76.0) |
χ2=12.90 |
| No | 17 (65.4) | 7 (50.0) | 12 (24.0) | P=0.002 |
| Diabetes, n
(%) | | | | |
| Yes | 3 (11.5) | 3 (24.1) | 19 (38.0) |
χ2=6.303 |
| No | 23 (88.5) | 11 (78.6) | 31 (62.0) | P=0.043 |
| Smoking, n (%) | | | | |
| Yes | 9 (20.0) | 9 (25.0) | 8 (8.8) |
χ2=6.415 |
| No | 36 (80.0) | 27 (75.0) | 83 (91.2) | P=0.040 |
The following statistically significant differences
were observed in gynaecological anamneses and reproductive
characteristics: 90% of women with cancer were postmenopausal and
65.4% of the control group were premenopausal; 84.6% of women
without children had cancer and the remaining 15.4% nulliparous
women were in the control group, thus indicating the importance of
nulliparity in EC. The statistics regarding abnormal bleeding were
dominated by women from the cancer group (65.0%), followed by 18.3%
of women with hyperplasia and 16.7% of controls. Menarche age was
the only variable to have no significant impact on diagnostic
typology in the study (P>0.05).
Analyses of other risk factors, including BMI, DM
and hypertension, indicated higher cardiovascular risk, in addition
to EC, as these metabolic parameters are also important
cardiovascular risk variables. Women with cancer dominated the
hypertension category (70.4% of cancer patients, 13.0% with
hyperplasia and 16.7% of controls, P=0.002) and the diabetes
mellitus category (76.0% prevailing in cancer sufferers, 12.0% in
the hyperplasia group and 12.0% in the control group, P=0.043). The
mean BMI values of classified women with cancer in class II on the
obesity scale indicated severe obesity, and the women with
hyperplasia were in class I obesity. The BMI values were not
influenced by age (P=0.735), however, GLM analysis revealed they
were influenced by diagnosis (P<0.001). Smoking results showed
that 8.8% of women with cancer smoked; plus 25% with hyperplasia
and 20% of controls (P=0.040).
Methylation levels
The MI of the two genes was statistically
significantly different in the three study groups; with increasing
tendency towards the EC group (Table III). The detailed comparison of
groups using robust one-way ANOVA with Tukey’s HSD test confirmed a
statistically significant difference in the HS3ST2 and
KLF4 genes between median methylations levels of normal
tissues, vs. hyperplasia, normal tissues, vs. cancer, and
hyperplasia, vs. cancer. The only exception was HS3ST2 gene
hyperplasia and cancer coincidence, where no significant difference
was observed (P=0.847).
| Table IIIMean methylation values and medians
of the MI and each CpG site in KLF4 and HS3ST2 genes
according to diagnosis. |
Table III
Mean methylation values and medians
of the MI and each CpG site in KLF4 and HS3ST2 genes
according to diagnosis.
| Site | Normal (n=43) | Hyperplasia
(n=35) | Cancer (n=91) | P-value |
|---|
| MI
KLF4a | 23.83±11.39 | 30.40±8.52 | 34.72±10.79 | |
| 25.33 | 29.50 | 31.83 | 0.001 |
| CpG1 | 32.65±18.77 | 40.49±17.07 | 50.22±17.42 | |
| 32.00 | 36.00 | 47.00 | <0.001 |
| CpG2 | 22.51±9.96 | 29.69±8.29 | 31.91±9.80 | |
| 23.00 | 29.00 | 30.00 | <0.001 |
| CpG3 | 23.05±10.05 | 28.14±7.69 | 32.76±10.68 | |
| 24.00 | 26.00 | 30.00 | <0.001 |
| CpG4 | 20.30±10.01 | 25.69±8.23 | 29.78±9.31 | |
| 22.00 | 24.00 | 28.00 | <0.001 |
| CpG5 | 22.79±10.01 | 28.09±8.05 | 31.85±9.52 | |
| 23.00 | 27.00 | 29.00 | <0.001 |
| CpG6 | 21.70±10.32 | 30.34±7.35 | 31.80±10.47 | |
| 24.00 | 29.00 | 29.00 | <0.001 |
| MI
HS3ST2a | 8.52±2.57 | 33.76±20.66 | 34.49±18.39 | |
| 8.33 | 36.67 | 35.00 | <0.001 |
| CpG1 | 6.21±2.63 | 10.43±7.11 | 21.59±15.35 | |
| 6.00 | 6.00 | 21.00 | <0.001 |
| CpG2 | 11.33±3.26 | 54.77±36.14 | 43.88±21.81 | |
| 11.00 | 60.00 | 45.00 | <0.001 |
| CpG3 | 8.02±2.76 | 36.09±21.96 | 38.00±20.26 | |
| 7.00 | 41.00 | 40.00 | <0.001 |
The comparison of each CpG site methylation
highlighted statistically significant differences between the
cancer, hyperplasia and control samples in the KLF4 gene
CpG1, CpG3, CpG4 and CpG5 sites, and the HS3ST2 CpG1 site.
Differences in KLF4 gene CpG2 and CpG6 and HS3ST2
CpG2 and CpG3 were observed only in the control, vs. hyperplasia
and control, vs. cancer groups, but not in the hyperplasia, vs.
cancer group (Figs. 1 and
2).
The comparison of methylation in the EC histological
subtypes and the hyperplasia subtypes in the two genes revealed no
statistically different median methylation levels at P<0.05; nor
were there differences in each CpG site or MIs. The HS3ST2
CpG1 site methylation levels were different between tumour stage
status (pT) (0.027), however, no increasing or decreasing tendency
in stage severity was detected. Similarly lacking any tendency,
significant differences were established in lymph node metastasis
status (pN) in the KLF CpG1 site (P=0.045), in the grading
of all HS3ST2 CpG sites (CpG1 P=0.001, CpG2 P=0.008, CpG3
P=0.043) and in the HS3ST2 MI (P=0.004) (data not
shown).
Correlation analysis
Correlation analysis of the entire sample confirmed
the association between mean HS3ST2 and KLF4 gene
methylation values and age (r=0.316, P<0.001; r=0.317,
P<0.001), BMI (r=0.386, P<0.001; r=0.191, P=0.013) and
diagnosis (r=0.496, P<0.001; r=0.387, P<0.001). The CpG sites
in each gene correlated significantly with each other; with
correlation coefficients varying between 0.677 and 0.934 for the
HS3ST2 gene and between 0.850 and 0.944 for the KLF4
gene. This indicated a correlation in single CpG site methylation
status (Table IV).
| Table IVCorrelation analyses between CpG
sites of KLF4 and HS3ST2 gene. |
Table IV
Correlation analyses between CpG
sites of KLF4 and HS3ST2 gene.
| KLF4
|
|---|
| CpG1 C | pG2 C | pG3 | CpG4 C | pG5 C | pG6 |
|---|
| HS3ST2 | | | | | | |
| CpG1 | | r=0.914 | r=0.927 | r=0.868 | r=0.916 | r=0.889 |
| CpG2 | r=0.677 | | r=0.933 | r=0.850 | r=0.923 | r=0.914 |
| CpG3 | r=0.760 | r=0.934 | | r=0.850 | r=0.944 | r=0.904 |
| CpG4 | – | – | | | r=0.900 | r=0.873 |
| CpG5 | – | – | – | – | | r=0.938 |
Multinomial logistic regression
The P-values of the predictors in Table V highlight the importance of age,
BMI and the KLF4 CpG2 site as cancer predictors, and
HS3ST2 CpG1 methylation was a significant factor in
hyperplasia prediction.
| Table VMultinomial logistic regression
P-value coefficients of predictors in hyperplasia and cancer. |
Table V
Multinomial logistic regression
P-value coefficients of predictors in hyperplasia and cancer.
| Predictor |
Hyperplasia
(P-value) | Endometrial
cancer
(P-value) |
|---|
| KLF4 | | |
| CpG1 | 0.464 | 0.106 |
| CpG2 | 0.263 | <0.001 |
| CpG3 | 0.101 | 0.470 |
| CpG4 | 0.846 | 0.892 |
| CpG5 | 0.821 | 0.926 |
| CpG6 | 0.058 | 0.164 |
| HS3ST2 | | |
| CpG1 | 0.044 | 0.247 |
| CpG2 | 0.434 | 0.806 |
| CpG3 | 0.225 | 0.149 |
| Age | 0.932 | 0.015 |
| Menarche | 0.812 | 0.964 |
| BMI | 0.057 | 0.001 |
| Smoking | 0.365 | 0.897 |
| Parity | 0.302 | 0.787 |
| Abort/UPT | 0.600 | 0.402 |
Selection of the diagnostic predictors
and discrimination accuracy
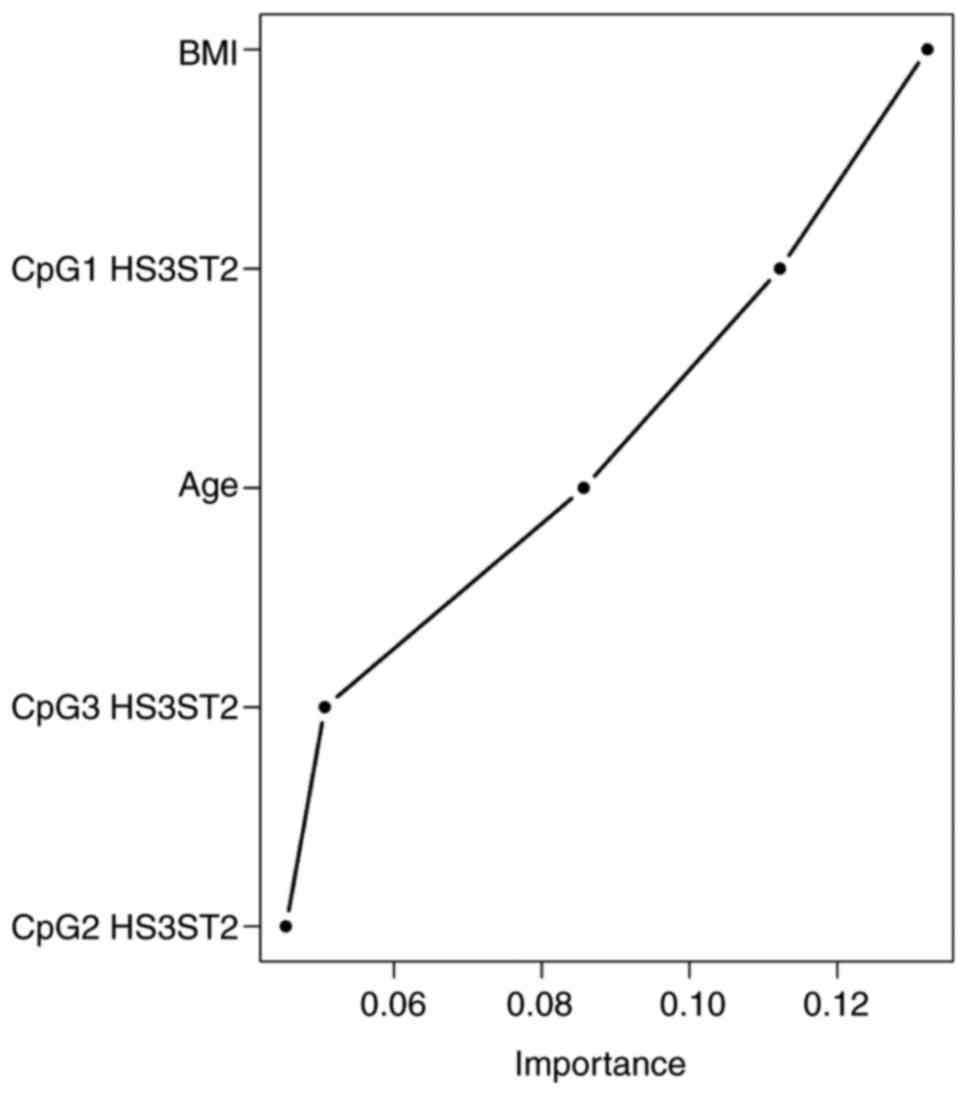
The Random Forest classification algorithm plot
schematically visualised and ordered variables by their importance
in diagnostic prediction (Fig.
3). On considering CpG methylation status together with
clinical variables, the BMI was identified as the most important
predictor, followed by CpG1 HS3ST2 dinucleotide methylation
status, age and HS3ST2 CpG3 and CpG2 dinucleotides. Other
parameters, including smoking, menarche and parity, had no
significant impact on diagnostic prediction and were therefore
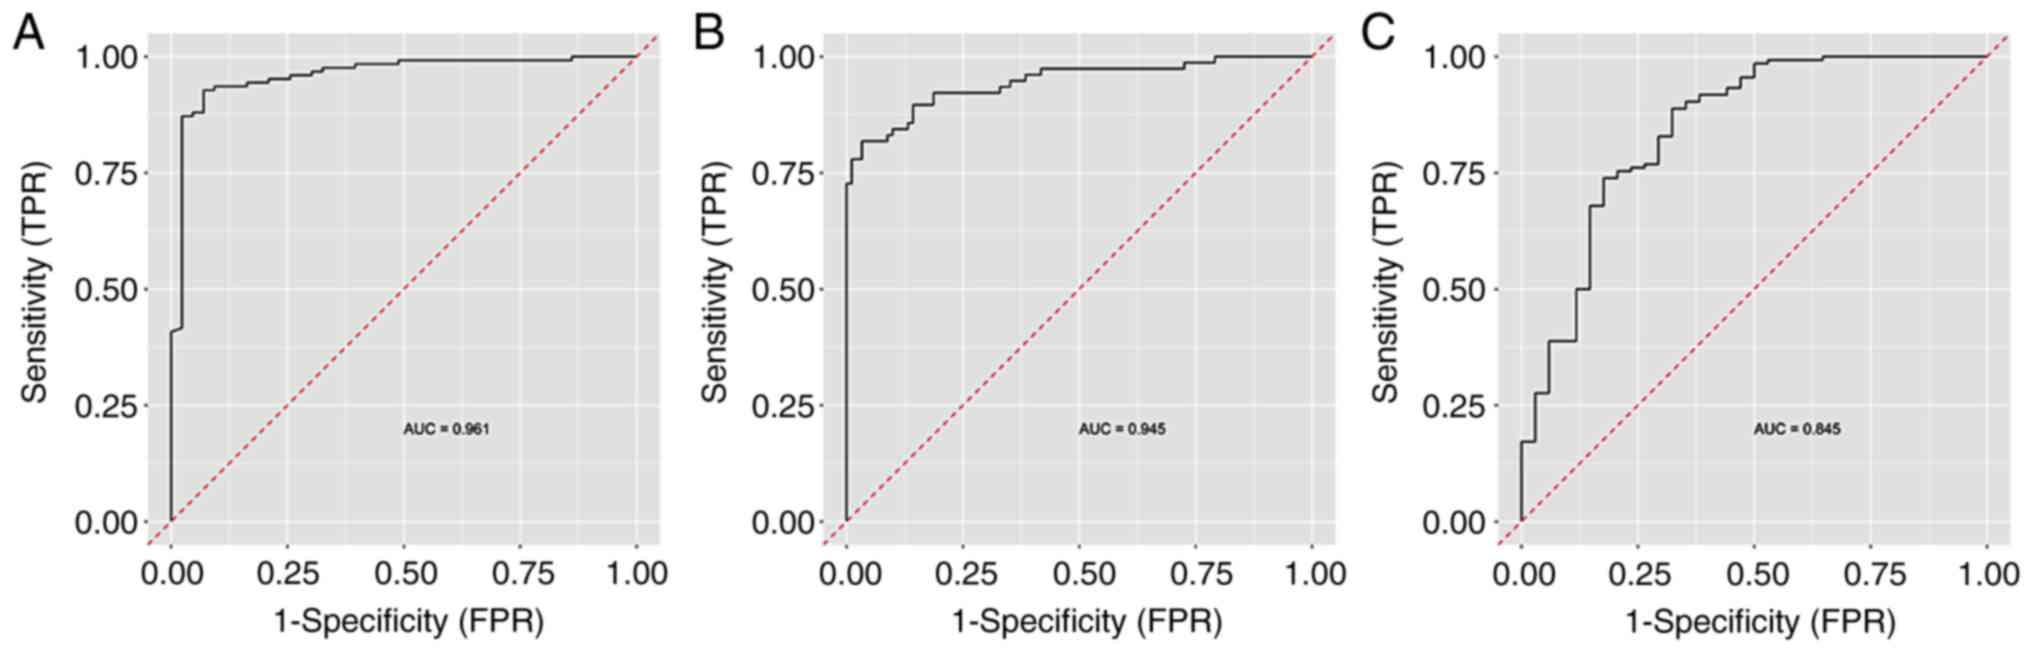
omitted from the final model. The Random Forest algorithm with
nested cross validation determined the predictive performance of
this model with the selected important variables. The highest AUC
value of 0.961 was attained in the discrimination of controls from
the other groups, followed by the discrimination between the EC
group and other groups (AUC 0.945). The lowest AUC (0.845) was
determined in the discrimination of women with hyperplasia from the
other groups (Fig. 4).
The model produced exclusively from the CpG
methylation status determined that the HS3ST2 CpG sites were
the most important predictors; followed by CpG1, CpG2 and CpG4 in
the KLF4 gene. The 0.95 AUC value indicated the perfect
discrimination accuracy of the CpG model between normal tissue and
other diagnoses.
Cut off value
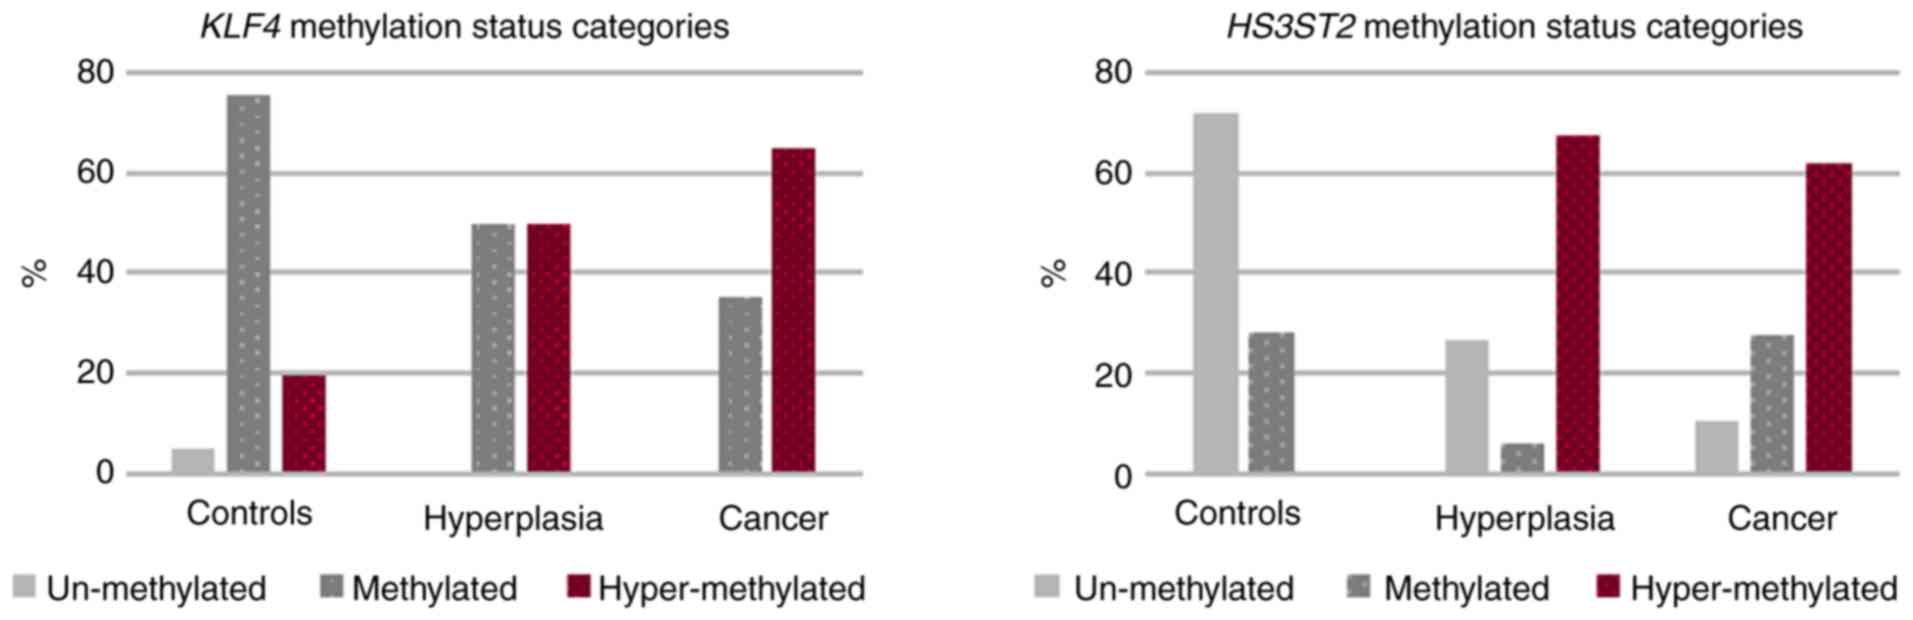
The methylation status in the three diagnostic
categories is shown in Fig. 5.
Unmethylated KLF4 gene status was detected only in normal
tissue (4.9%). Although methylation and hypermethylation occurred
at identical 50% frequency in hyperplasia, 35.2% of EC sufferers
were identified as methylated and the remaining 64.8% were
hypermethylated. Additional results were as follows: i)
HS3ST2 gene analysis identified the high 71.8% unmethylated
state in control tissue, but without hypermethylation; ii) there
was high 64.9% hypermethylation in the hyperplasia group and 62.1%
in the EC group. These differences were statistically significant
(P<0.001).
The Youden method calculated the cut-off value of
class probability differentiating health status from the other two
conditions. This was established at 0.5, with the diagnostic
sensitivity and specificity of 88.8 and 60.5% for the KLF4
gene and 53.3 and 83.5% for the HS3ST2 gene. The
corresponding cut-off for average methylation was 34.3 for
KLF4 and 41.0 for HS3ST2. The Random Forest algorithm
also assessed each pair of diagnostic groups, and the average
methylation cut-offs remained the same in each gene, whereas the
specificity and sensitivity varied. The best AUC values were
obtained in the diagnosis status models distinguishing health and
cancer in these genes; the KLF4 gene recorded an AUC of
0.751, 76.74% specificity and 73.52% sensitivity, and HS3ST2
returned an AUC of 0.789, 71.11% specificity and 86.81%
sensitivity. It was not possible to differentiate between
hyperplasia and cancer in the KLF4 gene due to its AUC of
0.488 (data not shown).
Discussion
It is evident that aberrant DNA methylation is a
common factor in endometrial carcinogenesis. Decreased DNA
methylation occurs early in carcinogenesis, and promoter
hypermethylation leads to gene silencing and loss of gene
expression. Therefore, carcinogenesis can be induced when the
tumour suppressor gene or a critical gene involved in the cell
cycle or in DNA repair is affected (53,54).
Aberrant methylation
The methylation of three CpG sites in the
KLF4 gene and six CpG sites in the HS3ST2 gene were
analysed in the present study. These are novel genes, and there
have been few reports on their association with hyperplasia and EC
(55–58). The functions of the protein
products of these genes indicate the likelihood of increased
methylation levels in cancer tissues, however, aberrant methylation
also requires detection in types of hyperplasia that can evolve
into EC. Consequently, there was increasing tendency of average
gene methylation from normal endometrial tissue through hyperplasia
to cancer (Table III).
The difference in methylation of each CpG and the MI
in the two genes were statistically significant between normal
tissue, hyperplasia and EC tissue. However, the difference between
hyperplasia and EC tissues was less distinct as only one of the
HS3ST2 gene CpG sites and four of the six KLF4 sites
had statistically significant methylation levels at P<0.05. In
addition, the comparison of hyperplasia and cancer MI revealed
statistically significant difference only for the KLF4 gene
(P=0.04). These results accentuate the importance of these genes in
the genesis of cancer and hyperplasia, and they further support
hyperplasia as a pre-cancerous tissue form (59,60). Similar results were recorded by
Nieminen et al (61), who
observed increasing methylation tendency from normal endometrial
tissue through simple hyper-plasia to the complex type in 24
tumoursuppressor genes.
Although the methylation analyses of hyperplasia and
carcinoma histological subtypes in the present study revealed no
statistically significant differences in methylation levels, a
difference was found between simple and complex hyperplasia. This
inconsistency is likely due to unbalanced subtype incidence, as
simple hyperplasia at 58.3% and endometroid adenocarcinoma at 85.7%
formed the majority of the respective conditions, with the
remaining subtypes registering at only minor frequencies. The small
sample size in the present study limited statistical analyses to a
certain extent; it was not possible to compare endometrial and
hyperplasia sub-types, and the comparison of methylation mean
values between hyperplasia and cancer was under-powered. Sample
size determination analysis revealed the optimal sample size for
HS3ST2 and KLF4 gene methylation is 11,268 and 80
individuals in each diagnostic group. In order to compare single
CpG sites, the required number of individuals are as follows:
HS3ST2 CpG1 19, CpG2 118 and CpG3 1,921, and KLF4
CpG1 50, CpG2 263, CpG3 64, CpG4 73, CpG5 87 and CpG6 603 in each
diagnostic group. In the present study, only the analysis of
HS3ST2 CpG1 site methylation between hyperplasia and cancer
had adequate statistical power, and it was not possible to
determine whether hypermethylated hyperplasia tissue is a
prerequisite step in the carcinoma cascade. A higher sample size is
also essential in terms of the detailed analysis of aberrant
methylation in specific hyperplasia and cancerous subtypes.
However, data from the preliminary analyses may be utilised by
those who design investigations on the methylation status of these
genes and include predominantly Caucasian subjects.
Methylation cut-offs
The literature surveys identified a lack of
consistency in determining methylation cut-off values. A number of
authors depend on three categories; unmethylated 0–9%, methylated
10–29% and highly methylated 30–100% (49,50), whereas others rely on two;
unmethylated <15% and methylated >15% (62–64). In addition, several studies use
ROC curve analysis to establish the optimal methylation threshold
in discriminating diagnostic categories, cancer types, treatment
decisions and outcomes, and patient survival (62,65,66). This highlights the importance of
methylation status, which may be useful as a biomarker in cancer
management.
In the present study, ROC analysis was performed
using the Random Forest Algorithm with nested cross validation, as
this provides realistic results. It was established that the model
distinguishing control samples from hyperplasia and cancer provided
the highest discriminatory ability at AUC=0.961, and that
hyperplasia comparison with the other two conditions had the least
discriminatory ability at AUC=0.845.
Pyrosequencing method
Several methods are available to analyse promoter
region methylation status, and selection of the optimal method
depends on the following: Relevant gene identification, gene
analysis range, robustness, DNA quantity, the inclusion of
bisulfite conversion and the availability of detection devices.
Kurdyukov and Bullock (67)
compared several methods and described their exploitation in
practice. In the present study, pyrosequencing was selected as it
is the standard technique in cancer research, detects small
differences in methylation, is suitable for heterogeneous samples
and provides quantitative results (67,68). However, it was not possible to
determine whether it provides information on allele specificity or
hemi-methylation, which may differentiate de novo
methylation events from maintenance factors (69,70).
Risk factors
Risk factor analysis investigated the significant
effects of metabolic factors, including BMI, hypertension and
diabetes mellitus, in EC development. The high mean BMI values
indicated severe obesity in women with cancer (35.57±3.81),
compared with those in the control group (28.09±4,82, P<0.001).
This risk factor is also often connected with hypertension,
hypercholesterolaemia and diabetes mellitus. The high occurrence of
hypertension and diabetes mellitus was noted in cancer patients
(76.0 and 38.0%, respectively) and in hyperplasia (50.0 and 24.1%,
respectively); therefore, future lipid profile analysis is
worthwhile in determining the cluster effect of these factors and
their combination in metabolic syndrome formation (71). These three conditions, high BMI,
hypertension and diabetes mellitus, are also the main risk factors
in cardiovascular disease (CVD) (72). Although cancer is considered
second only to CVD in recently determined leading causes of
mortality in Europe, America and Asia, current publications suggest
that cancer, rather than CVD, is the most common cause of mortality
(73–77). The results of the present study
highlight the similarities and interactions between these diseases.
The most common feature is inflammation as it contributes to both
diseases and is specific in obesity, diabetes, hypertension and
dyslipidaemia (74). Due to the
high mortality rates of these diseases, it is paramount to unify
preventive programmes to control and eliminate these risk factors
and thus reduce risks of cancer and CVD.
Although smoking presents an unequivocal negative
risk factor, certain independent studies have suggested that it may
be a protective mechanism against the development of EC (9,78).
The present study did not confirm association between smoking and
EC; although the number of smokers in the different diagnostic
groups was significantly different (P=0.040), the identical smoking
rate of 34.6% was recorded in the control group and hyperplasia
group; with 30.8% incidence in the patients diagnosed with
cancer.
In conclusion, to the best of our knowledge, the
present study is the first report discriminating EC from
hyperplasia and normal tissue using the AUC and to analyse
KLF4 and HS3ST2 methylation cut-off points. The CpG
methylation model revealed perfect discrimination accuracy between
the control samples and other diagnoses. The AUC value was
marginally higher when clinical variables, including BMI and age,
were included. The aberrant CpG1 dinucleotide methylation level in
the HS3ST2 gene regulation sequence was determined to be an
important predictor in hyperplasia formation; similar to the
KLF4 regulation sequence CpG2 dinucleotide effect in EC
prediction.
The present study also confirmed the prominent role
of BMI and other metabolic risk factors in EC formation. As these
factors are important also in CVDs, this study sample is considered
at high risk in the terms of morbidity and mortality rates for the
two most common causes of mortality, CVD and cancer. Therefore, the
implantation of effective and mutual preventive programs is
required.
Funding
This study was supported by Scientific Grant Agency
VEGA (1/0199/17), Slovak Research and Development Agency
(APVV-0224-12), ‘Biomedical Centre Martin’ project co-financed from
EU sources (ITMS code: 26220220187) and by Comenius University
Grants UK/22/2018 and UK/20/2018.
Availability of data and materials
The datasets used and/or analysed during the current
study are available from the corresponding author on reasonable
request.
Authors’ contributions
PŽ, DB, DD and ZD conceived the study; DD, DB, ZD
and VH performed laboratory analyses; MŇ, RF and TB were
responsible for the collection of samples and clinicopathological
data; ZD and MG performed statistical analyses, MG designed the
figures; ZD, DB and DD designed and wrote the paper in consultation
with PK, JH, EH and PŽ.
Ethics approval and consent to
participate
The study was approved by The Regional Ethics
Committee of the Jessenius Faculty of Medicine (code 169/2011,
1933/2016) and the research was performed in compliance with the
Declaration of Helsinki. Informed consent was obtained from all
participants.
Patient consent for publication
Not applicable.
Competing interests
The authors declare that they have no competing
interests.
Acknowledgments
Not applicable.
References
|
1
|
Ferlay J, Soerjomataram I, Dikshit R, Eser
S, Mathers C, Rebelo M, Parkin DM, Forman D and Bray F: Cancer
incidence and mortality worldwide: Sources methods and major
patterns in GLOBOCAN 2012. Int J Cancer. 136:E359–E386. 2015.
View Article : Google Scholar
|
|
2
|
Siegel R, Naishadham D and Jemal A: Cancer
statistics, 2013. CA Cancer J Clin. 63:11–30. 2013. View Article : Google Scholar : PubMed/NCBI
|
|
3
|
Bansal N, Yendluri V and Wenham RM: The
molecular biology of endometrial cancers and the implications for
pathogenesis, classification, and targeted therapies. Cancer Contr.
16:8–13. 2009. View Article : Google Scholar
|
|
4
|
Sherman ME and Devesa SS: Analysis of
racial differences in incidence, survival, and mortality for
malignant tumors of the uterine corpus. Cancer. 98:176–186. 2003.
View Article : Google Scholar : PubMed/NCBI
|
|
5
|
Hardiman P, Pillay OC and Atiomo W:
Polycystic ovary syndrome and endometrial carcinoma. Lancet.
361:1810–1812. 2003. View Article : Google Scholar : PubMed/NCBI
|
|
6
|
Schouten LJ, Goldbohm RA and van den
Brandt PA: Anthropometry, physical activity, and endometrial cancer
risk: Results from the Netherlands cohort study. J Natl Cancer
Inst. 96:1635–1638. 2004. View Article : Google Scholar : PubMed/NCBI
|
|
7
|
Kjaer SK, Mellemkjaer L, Brinton LA,
Johansen C, Gridley G and Olsen JH: Tubal sterilization and risk of
ovarian, endometrial and cervical cancer. A Danish population-based
follow-up study of more than 65 000 sterilized women. Int J
Epidemiol. 33:596–602. 2004. View Article : Google Scholar : PubMed/NCBI
|
|
8
|
Troisi R, Potischman N, Hoover RN, Siiteri
P and Brinton LA: Insulin and endometrial cancer. Am J Epidemiol.
146:476–482. 1997. View Article : Google Scholar : PubMed/NCBI
|
|
9
|
Gong TT, Wang YL and Ma XX: Age at
menarche and endome-trial cancer risk: A dose-response
meta-analysis of prospective studies. Sci Rep. 5:140512015.
View Article : Google Scholar
|
|
10
|
Fisher B, Costantino JP, Redmond CK,
Fisher ER, Wickerham DL and Cronin WM: Endometrial cancer in
tamoxifen-treated breast cancer patients: Findings from the
National Surgical Adjuvant Breast and Bowel Project (NSABP) B-14. J
Natl Cancer Inst. 86:527–537. 1994. View Article : Google Scholar : PubMed/NCBI
|
|
11
|
Ali AT: Reproductive factors and the risk
of endometrial cancer. Int J Gynecol Cancer. 24:384–393. 2014.
View Article : Google Scholar : PubMed/NCBI
|
|
12
|
Kurman RJ and Norris HJ: Evaluation of
criteria for distinguishing atypical endometrial hyperplasia from
well-differentiated carcinoma. Cancer. 49:2547–2559. 1982.
View Article : Google Scholar : PubMed/NCBI
|
|
13
|
Bokhman JV: Two pathogenetic types of
endometrial carcinoma. Gynecol Oncol. 15:10–17. 1983. View Article : Google Scholar : PubMed/NCBI
|
|
14
|
Felix AS, Weissfeld JL, Stone RA, Bowser
R, Chivukula M, Edwards RP and Linkov F: Factors associated with
type I and type II endometrial cancer. Cancer Causes Control.
21:1851–1856. 2010. View Article : Google Scholar : PubMed/NCBI
|
|
15
|
Prat J: Prognostic parameters of
endometrial carcinoma. Hum Pathol. 35:649–662. 2004. View Article : Google Scholar : PubMed/NCBI
|
|
16
|
Bendifallah S, Daraï E and Ballester M:
Predictive modeling: A new paradigm for managing endometrial
cancer. Ann Surg Oncol. 23:975–988. 2016. View Article : Google Scholar
|
|
17
|
McConechy MK, Ding J, Cheang MC, Wiegand
K, Senz J, Tone A, Yang W, Prentice L, Tse K, Zeng T, et al: Use of
mutation profiles to refine the classification of endometrial
carcinomas. J Pathol. 228:20–30. 2012.PubMed/NCBI
|
|
18
|
Talhouk A and McAlpine JN: New
classification of endometrial cancers: The development and
potential applications of genomic-based classification in research
and clinical care. Gynecol Oncol Res Pract. 3:142016. View Article : Google Scholar : PubMed/NCBI
|
|
19
|
Karateke A, Tug N, Cam C, Selcuk S, Asoglu
MR and Cakir S: Discrepancy of pre- and postoperative grades of
patients with endometrial carcinoma. Eur J Gynaecol Oncol.
32:283–285. 2011.PubMed/NCBI
|
|
20
|
Sany O, Singh K and Jha S: Correlation
between preoperative endometrial sampling and final endometrial
cancer histology. Eur J Gynaecol Oncol. 33:142–144. 2012.PubMed/NCBI
|
|
21
|
Batista TP, Cavalcanti CL, Tejo AA and
Bezerra AL: Accuracy of preoperative endometrial sampling diagnosis
for predicting the final pathology grading in uterine endometrioid
carcinoma. Eur J Surg Oncol. 42:1367–1371. 2016. View Article : Google Scholar : PubMed/NCBI
|
|
22
|
Han G, Sidhu D, Duggan MA, Arseneau J,
Cesari M, Clement PB, Ewanowich CA, Kalloger SE and Köbel M:
Reproducibility of histological cell type in high-grade endometrial
carcinoma. Mod Pathol. 26:1594–1604. 2013. View Article : Google Scholar : PubMed/NCBI
|
|
23
|
Banno K, Nogami Y, Kisu I, Yanokura M,
Umene K, Masuda K, Kobayashi Y, Yamagami W, Susumu N and Aoki D:
Candidate biomarkers for genetic and clinicopathological diagnosis
of endometrial cancer. Int J Mol Sci. 14:12123–12137. 2013.
View Article : Google Scholar : PubMed/NCBI
|
|
24
|
Stampoliou A, Arapantoni-Dadioti P and
Pavlakis K: Epigenetic mechanisms in endometrial cancer. J BUON.
21:301–306. 2016.PubMed/NCBI
|
|
25
|
Banno K, Yanokura M, Iida M, Masuda K and
Aoki D: Carcinogenic mechanisms of endometrial cancer: Involvement
of genetics and epigenetics. J Obstet Gynaecol Res. 40:1957–1967.
2014. View Article : Google Scholar : PubMed/NCBI
|
|
26
|
Banno K, Yanokura M, Susumu N, Kawaguchi
M, Hirao N, Hirasawa A, Tsukazaki K and Aoki D: Relationship of the
aberrant DNA hypermethylation of cancer-related genes with
carcinogenesis of endometrial cancer. Oncol Rep. 16:1189–1196.
2006.PubMed/NCBI
|
|
27
|
Guida M, Sanguedolce F, Bufo P, Di Spiezio
Sardo A, Bifulco G, Nappi C and Pannone G: Aberrant DNA
hypermethylation of hMLH-1 and CDKN2A/p16 genes in benign,
premalignant and malignant endometrial lesions. Eur J Gynaecol
Oncol. 30:267–270. 2009.PubMed/NCBI
|
|
28
|
Sasaki M, Kotcherguina L, Dharia A,
Fujimoto S and Dahiya R: Cytosine-phosphoguanine methylation of
estrogen receptors in endometrial cancer. Cancer Res. 61:3262–3266.
2001.PubMed/NCBI
|
|
29
|
Ren Y, Liu X, Ma D, Feng Y and Zhong N:
Down-regulation of the progesterone receptor by the methylation of
progesterone receptor gene in endometrial cancer cells. Cancer
Genet Cytogenet. 175:107–116. 2007. View Article : Google Scholar : PubMed/NCBI
|
|
30
|
Salvesen HB, Stefansson I, Kretzschmar EI,
Gruber P, MacDonald ND, Ryan A, Jacobs IJ, Akslen LA and Das S:
Significance of PTEN alterations in endometrial carcinoma: A
population-based study of mutations, promoter methylation and PTEN
protein expression. Int J Oncol. 25:1615–1623. 2004.PubMed/NCBI
|
|
31
|
Arafa M, Kridelka F, Mathias V,
Vanbellinghen JF, Renard I, Foidart JM, Boniver J and Delvenne P:
High frequency of RASSF1A and RARb2 gene promoter methylation in
morphologically normal endometrium adjacent to endometrioid
adenocarcinoma. Histopathology. 53:525–532. 2008.PubMed/NCBI
|
|
32
|
Esteller M, Hamilton SR, Burger PC, Baylin
SB and Herman JG: Inactivation of the DNA repair gene
O6-methylguanine-DNA methyltransferase by promoter hypermethylation
is a common event in primary human neoplasia. Cancer Res.
59:793–797. 1999.PubMed/NCBI
|
|
33
|
Ignatov A, Bischoff J, Ignatov T,
Schwarzenau C, Krebs T, Kuester D, Costa SD, Roessner A, Semczuk A
and Schneider-Stock R: APC promoter hypermethylation is an early
event in endometrial tumorigenesis. Cancer Sci. 101:321–327. 2010.
View Article : Google Scholar
|
|
34
|
Moreno-Bueno G, Hardisson D, Sánchez C,
Sarrió D, Cassia R, García-Rostán G, Prat J, Guo M, Herman JG,
Matías-Guiu X, et al: Abnormalities of the APC/beta-catenin pathway
in endometrial cancer. Oncogene. 21:7981–7990. 2002. View Article : Google Scholar : PubMed/NCBI
|
|
35
|
Ghaleb AM and Yang VW: Krüppel-like factor
4 (KLF4): What we currently know. Gene. 611:27–37. 2017. View Article : Google Scholar : PubMed/NCBI
|
|
36
|
El-Karim EA, Hagos EG, Ghaleb AM, Yu B and
Yang VW: Krüppel-like factor 4 regulates genetic stability in mouse
embryonic fibroblasts. Mol Cancer. 12:892013. View Article : Google Scholar
|
|
37
|
Hagos EG, Ghaleb AM, Dalton WB, Bialkowska
AB and Yang VW: Mouse embryonic fibroblasts null for the
Krüppel-like factor 4 gene are genetically unstable. Oncogene.
28:1197–1205. 2009. View Article : Google Scholar : PubMed/NCBI
|
|
38
|
Yoon HS, Chen X and Yang VW: Kruppel-like
factor 4 mediates p53-dependent G1/S cell cycle arrest in response
to DNA damage. J Biol Chem. 278:2101–2105. 2003. View Article : Google Scholar
|
|
39
|
Yang Y, Goldstein BG, Chao HH and Katz JP:
KLF4 and KLF5 regulate proliferation, apoptosis and invasion in
esophageal cancer cells. Cancer Biol Ther. 4:1216–1221. 2005.
View Article : Google Scholar : PubMed/NCBI
|
|
40
|
Zammarchi F, Morelli M, Menicagli M, Di
Cristofano C, Zavaglia K, Paolucci A, Campani D, Aretini P, Boggi
U, Mosca F, et al: KLF4 is a novel candidate tumor suppressor gene
in pancreatic ductal carcinoma. Am J Pathol. 178:361–372. 2011.
View Article : Google Scholar : PubMed/NCBI
|
|
41
|
Yu T, Chen X, Zhang W, Liu J, Avdiushko R,
Napier DL, Liu AX, Neltner JM, Wang C, Cohen D and Liu C: KLF4
regulates adult lung tumor-initiating cells and represses
K-Rasmediated lung cancer. Cell Death Differ. 23:207–215. 2016.
View Article : Google Scholar
|
|
42
|
Ray SK: The transcription regulator
Krüppel-like factor 4 and its dual roles of oncogene in
glioblastoma and tumor suppressor in neuroblastoma. For
Immunopathol Dis Therap. 7:127–139. 2016. View Article : Google Scholar
|
|
43
|
Wei D, Gong W, Kanai M, Schlunk C, Wang L,
Yao JC, Wu TT, Huang S and Xie K: Drastic down-regulation of
Krüppel-like factor 4 expression is critical in human gastric
cancer development and progression. Cancer Res. 65:2746–2754. 2005.
View Article : Google Scholar : PubMed/NCBI
|
|
44
|
Vijaya Kumar A, Salem Gassar E, Spillmann
D, Stock C, Sen YP, Zhang T, Van Kuppevelt TH, Hülsewig C,
Koszlowski EO, Pavao MS, et al: HS3ST2 modulates breast cancer cell
invasiveness via MAP kinase- and Tcf4 (Tcf7l2)-dependent regulation
of protease and cadherin expression. Int J Cancer. 135:2579–2592.
2014. View Article : Google Scholar : PubMed/NCBI
|
|
45
|
Suhovskih AV, Domanitskaya NV, Tsidulko
AY, Prudnikova TY, Kashuba VI and Grigorieva EV: Tissue-specificity
of heparan sulfate biosynthetic machinery in cancer. Cell Adhes
Migr. 9:452–459. 2015. View Article : Google Scholar
|
|
46
|
Nikolova V, Koo CY, Ibrahim SA, Wang Z,
Spillmann D, Dreier R, Kelsch R, Fischgräbe J, Smollich M, Rossi
LH, et al: Differential roles for membrane-bound and soluble
syndecan-1 (CD138) in breast cancer progression. Carcinogenesis.
30:397–407. 2009. View Article : Google Scholar : PubMed/NCBI
|
|
47
|
Eklund A: Bee swarm: The Bee Swarm plot,
an alternative to stripchart. R package version 0.2.3. 2016,
https://CRAN.R-project.org/package=beeswarm.
|
|
48
|
Mair P and Schoenbrodt F: WRS2: Wilcox
robust estimation and testing. R package version 0.9.2. 2017.
|
|
49
|
Brigliadori G, Foca F, Dall’Agata M,
Rengucci C, Melegari E, Cerasoli S, Amadori D, Calistri D and Faedi
M: Defining the cutoff value of MGMT gene promoter methylation and
its predictive capacity in glioblastoma. J Neurooncol. 128:333–339.
2016. View Article : Google Scholar : PubMed/NCBI
|
|
50
|
Gurrieri L, De Carlo E, Gerratana L, De
Maglio G, Macerelli M, Pisa FE, Masiero E, Aprile G, Follador A,
Puglisi F, et al: MGMT pyrosequencing-based cut-off methylation
level and clinical outcome in patients with glioblastoma
multiforme. Future Oncol. 14:699–707. 2018. View Article : Google Scholar : PubMed/NCBI
|
|
51
|
Ishwaran H, Kogalur UB, Blackstone EH and
Lauer MS: Random survival forests. Ann Appl Stat. 2:841–860. 2008.
View Article : Google Scholar
|
|
52
|
R Development Core Team: R: A language and
environment for statistical computing. The R Foundation for
Statistical Computing; Vienna: http://www.R-project.org,
Accessed February 10, 2015.
|
|
53
|
Takeda T, Banno K, Yanokura M, Adachi M,
Iijima M, Kunitomi H, Nakamura K, Iida M, Nogami Y, Umene K, et al:
Methylation analysis of DNA mismatch repair genes using DNA derived
from the peripheral blood of patients with endometrial cancer:
Epimutation in endometrial carcinogenesis. Genes (Basel). 7. pp.
E862016, View Article : Google Scholar
|
|
54
|
Jiang SW, Li J, Podratz K and Dowdy S:
Application of DNA methylation biomarkers for endometrial cancer
management. Expert Rev Mol Diagn. 8:607–616. 2008. View Article : Google Scholar : PubMed/NCBI
|
|
55
|
Chang CC, Wang HC, Liao YP, Chen YC, Weng
YC, Yu MH and Lai HC: The feasibility of detecting endometrial and
ovarian cancer using DNA methylation biomarkers in cervical
scrapings. J Gynecol Oncol. 29:e172018. View Article : Google Scholar
|
|
56
|
Lai HC, Wang YC, Yu MH, Huang RL, Yuan CC,
Chen KJ, Wu CC, Chiang KJ and Chao TK: DNA methylation as a
biomarker for the detection of hidden carcinoma in endometrial
atypical hyperplasia. Gynecol Oncol. 135:552–559. 2014. View Article : Google Scholar : PubMed/NCBI
|
|
57
|
Wentzensen N, Bakkum-Gamez JN, Killian JK,
Sampson J, Guido R, Glass A, Adams L, Luhn P, Brinton LA, Rush B,
et al: Discovery and validation of methylation markers for
endometrial cancer. Int J Cancer. 135:1860–1868. 2014. View Article : Google Scholar : PubMed/NCBI
|
|
58
|
Zhang B, Xing X, Li J, Lowdon RF, Zhou Y,
Lin N, Zhang B, Sundaram V, Chiappinelli KB, Hagemann IS, et al:
Comparative DNA methylome analysis of endometrial carcinoma reveals
complex and distinct deregulation of cancer promoters and
enhancers. BMC Genomics. 15:8682014. View Article : Google Scholar : PubMed/NCBI
|
|
59
|
Chen YC, Tsao CM, Kuo CC, Yu MH, Lin YW,
Yang CY, Li HJ, Yan MD, Wang TJ, Chou YC and Su HY: Quantitative
DNA methylation analysis of selected genes in endometrial
carcinogenesis. Taiwan J Obstet Gynecol. 54:572–579. 2015.
View Article : Google Scholar : PubMed/NCBI
|
|
60
|
Trimble CL, Method M, Leitao M, Lu K,
Ioffe O, Hampton M, Higgins R, Zaino R and Mutter GL; Society of
Gynecologic Oncology Clinical Practice Committee: Management of
endo-metrial precancers. Obstet Gynecol. 120:1160–1175.
2012.PubMed/NCBI
|
|
61
|
Nieminen TT, Gylling A, Abdel-Rahman WM,
Nuorva K, Aarnio M, Renkonen-Sinisalo L, Järvinen HJ, Mecklin JP,
Bützow R and Peltomäki P: Molecular analysis of endometrial
tumorigenesis: Importance of complex hyperplasia regardless of
atypia. Clin Cancer Res. 15:5772–5783. 2009. View Article : Google Scholar : PubMed/NCBI
|
|
62
|
Yuan XL, Zhang Z, Li B, Gao N, Zhang H,
Sangild PT and Li JQ: Genome-wide DNA methylation analysis of the
porcine hypothalamus-pituitary-ovary axis. Sci Rep. 7:42772017.
View Article : Google Scholar : PubMed/NCBI
|
|
63
|
Siegel EM, Riggs BM, Delmas AL, Koch A,
Hakam A and Brown KD: Quantitative DNA methylation analysis of
candidate genes in cervical cancer. PLoS One. 10:e01224952015.
View Article : Google Scholar : PubMed/NCBI
|
|
64
|
Dvorakova E, Chmelarova M, Laco J, Palicka
V and Spacek J: Methylation analysis of tumor suppressor genes in
endometroid carcinoma of endometrium using MS-MLPA. Biomed Pap Med
Fac Univ Palacky Olomouc Czech Repub. 157:298–303. 2013. View Article : Google Scholar : PubMed/NCBI
|
|
65
|
Dong X, Hou Q, Chen Y and Wang X:
Diagnostic value of the methylation of multiple gene promoters in
serum in hepatitis B virus-related hepatocellular carcinoma. Dis
Markers. 2017.2929381:2017.
|
|
66
|
Boers A, Wang R, van Leeuwen RW, Klip HG,
de Bock GH, Hollema H, van Criekinge W, de Meyer T, Denil S, van
der Zee AGJ, et al: Discovery of new methylation markers to improve
screening for cervical intraepithelial neoplasia grade 2/3. Clin
Epigenetics. 8:292016. View Article : Google Scholar : PubMed/NCBI
|
|
67
|
Kurdyukov S and Bullock M: DNA methylation
analysis: Choosing the right method. Biology (Basel). 5:E32016.
|
|
68
|
Delaney C, Garg SK and Yung R: Analysis of
DNA methylation by pyrosequencing. Methods Mol Biol. 1343:249–264.
2015. View Article : Google Scholar : PubMed/NCBI
|
|
69
|
Patiño-Parrado I, Gómez-Jiménez Á,
López-Sánchez N and Frade JM: Strand-specific CpG hemimethylation,
a novel epigenetic modification functional for genomic imprinting.
Nucleic Acids Res. 45:8822–8834. 2017. View Article : Google Scholar : PubMed/NCBI
|
|
70
|
Qin W, Wolf P, Liu N, Link S, Smets M, La
Mastra F, Forné I, Pichler G, Hörl D, Fellinger K, et al: DNA
methylation requires a DNMT1 ubiquitin interacting motif (UIM) and
histone ubiquitination. Cell Res. 25:911–929. 2015. View Article : Google Scholar : PubMed/NCBI
|
|
71
|
Grundy SM, Cleeman JI, Daniels SR, Donato
KA, Eckel RH, Franklin BA, Gordon DJ, Krauss RM, Savage PJ, Smith
SC Jr, et al: Diagnosis and management of the metabolic syndrome:
An American Heart Association/National Heart, Lung, and Blood
Institute scientific statement. Circulation. 112:2735–2752. 2005.
View Article : Google Scholar : PubMed/NCBI
|
|
72
|
Expert Panel on Detection, Evaluation
Treatment of High Blood Cholesterol in Adults: Executive summary of
the third report of The National Cholesterol Education Program
(NCEP) expert panel on detection, evaluation, and treatment of high
blood cholesterol in adults (Adult Treatment Panel III). JAMA.
285:2486–2497. 2001. View Article : Google Scholar : PubMed/NCBI
|
|
73
|
Wilson L, Bhatnagar P and Townsend N:
Comparing trends in mortality from cardiovascular disease and
cancer in the United Kingdom, 1983–2013 Joinpoint regression
analysis. Popul Health Metr. 15:232017. View Article : Google Scholar
|
|
74
|
Koene RJ, Prizment AE, Blaes A and Konety
SH: Shared risk factors in cardiovascular disease and cancer.
Circulation. 133:1104–1114. 2016. View Article : Google Scholar : PubMed/NCBI
|
|
75
|
Weir HK, Anderson RN, Coleman King SM,
Soman A, Thompson TD, Hong Y, Moller B and Leadbetter S: Heart
disease and cancer deaths-trends and projections in the United
States 1969–2020. Prev Chronic Dis. 13:E1572016. View Article : Google Scholar
|
|
76
|
Nichols M, Townsend N, Scarborough P and
Rayner M: Trends in age-specific coronary heart disease mortality
in the European Union over three decades: 1980–2009. Eur Heart J.
34:3017–3027. 2013. View Article : Google Scholar : PubMed/NCBI
|
|
77
|
Bosetti C, Bertuccio P, Malvezzi M, Levi
F, Chatenoud L, Negri E and La Vecchia C: Cancer mortality in
Europe, 2005–2009 and an overview of trends since 1980. Ann Oncol.
24:2657–2671. 2013. View Article : Google Scholar : PubMed/NCBI
|
|
78
|
Merritt MA, Tzoulaki I, Tworoger SS, De
Vivo I, Hankinson SE, Fernandes J, Tsilidis KK, Weiderpass E,
Tjønneland A, Petersen KE, et al: Investigation of dietary factors
and endometrial cancer risk using a nutrient-wide association study
approach in the EPIC and Nurses’ Health Study (NHS) and NHSII.
Cancer Epidemiol Biomarkers Prev. 24:466–471. 2015. View Article : Google Scholar : PubMed/NCBI
|