Introduction
Fatty acids (FAs) are major constituents of lipids
and play essential roles in the diverse biological functions of the
human body. They are key components of the cell membrane, provide
an essential source of cellular fuel and energy storage and are
involved in critical signal transduction pathways. Depending on the
chemical structure, an FA can be a saturated FA (SFA), a
monounsaturated FA (MUFA), or a polyunsaturated FA (PUFA). Apart
from the essential PUFAs [i.e., linoleic acid (LA) and
alpha-linolenic acid (ALA)], the human body can synthesize the
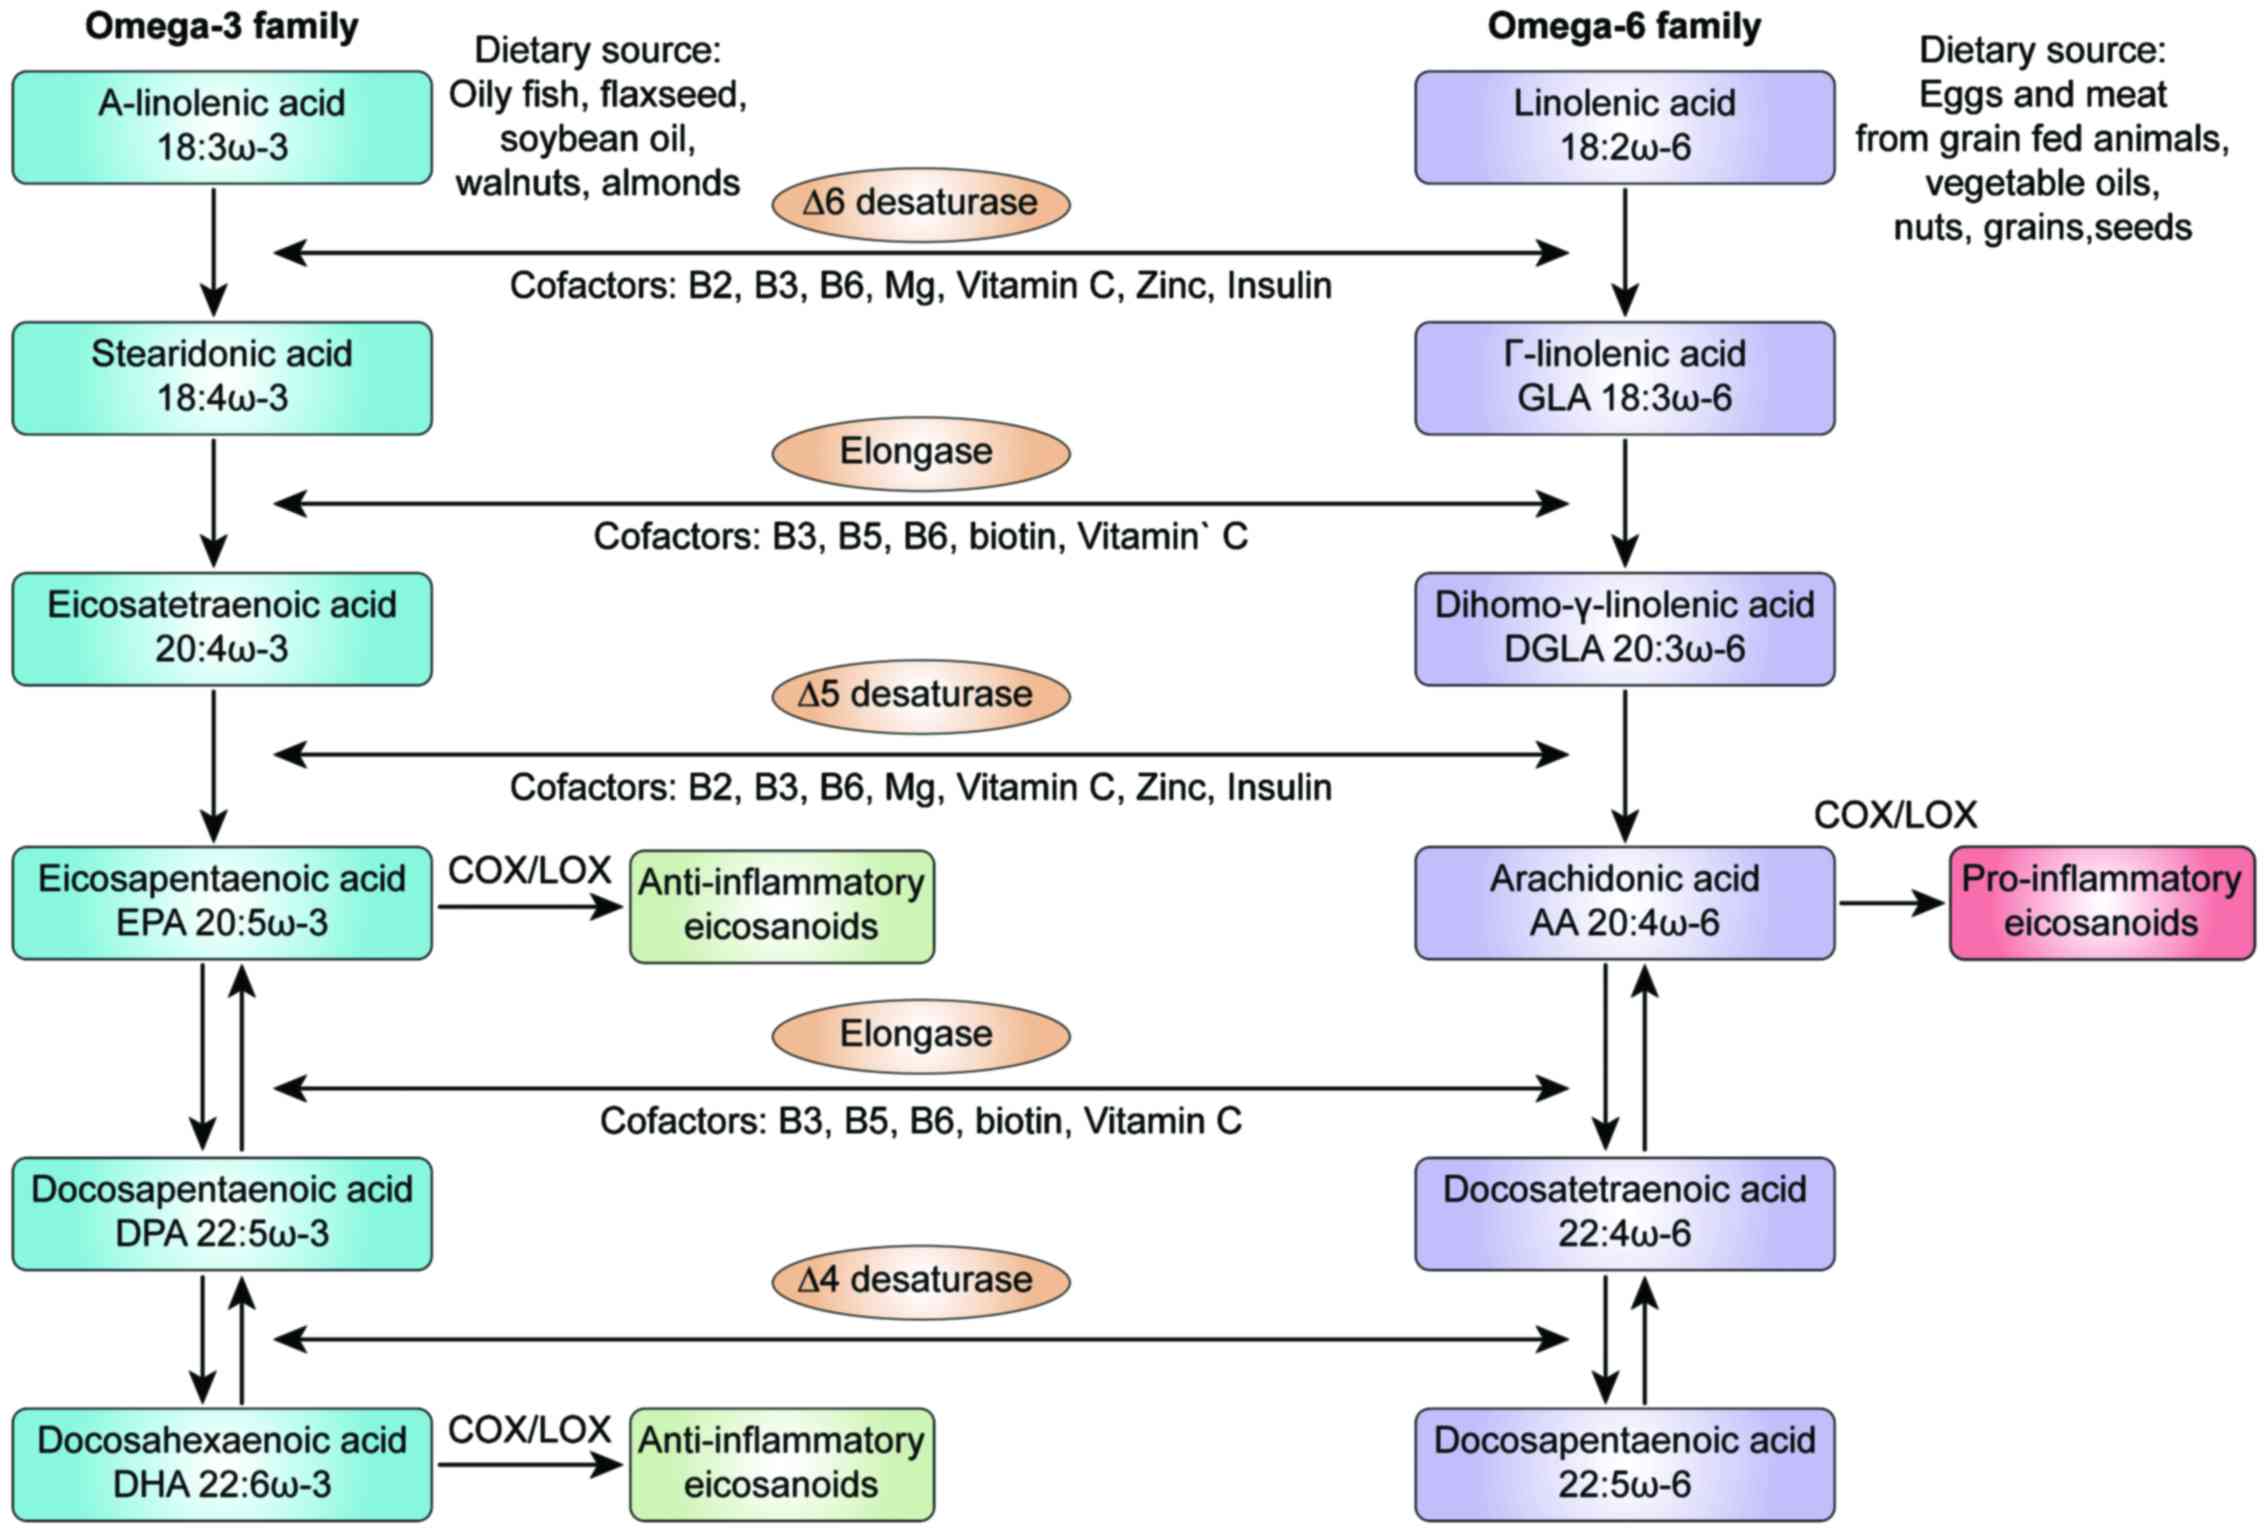
majority of FAs. LA and ALA are precursors for omega-3 and omega-6
FAs, respectively, and can only be obtained from the diet. LA is
metabolized to arachidonic acid (AA) and is mainly found in meat
and eggs from grain-fed animals, vegetable oils, nuts and seeds
(1). ALA and its derivatives,
eicosapentaenoic acid (EPA) and docosahexaenoic acid (DHA), are
found in fish oil, flaxseeds, walnuts, and seeds (2). Eicosanoids are metabolites produced
from AA, EPA and DHA under the activity of cyclooxygenases (COXs),
lipoxygenases (LOXs) and cytochrome P450s (CYPs). Eicosanoids play
critical roles in the inflammation process (Fig. 1). The Western diet now provides a
15:1 ratio of omega-6/omega-3 ratio that is markedly higher
compared with such levels a century ago (3). The consumption of a Westernized diet
is associated with a higher risk of the onset of chronic disease
(4,5). An unbalanced omega-6 to omega-3
ratio results in an increased production of AA and pro-inflammatory
eicosanoids (6). Due to the
enzyme competition, the production of anti-inflammatory
EPA/DHA-derived eicosanoids is reduced. Overall, therefore, this
imbalance promotes a pro-inflammatory profile (7). It is already known that type-2
diabetes and its complications are associated with lipid metabolism
disorder and Farnesoid X receptor (FXR) plays an important role in
regulating lipid and glucose metabolism. Liu et al
demonstrated that the activation of FXR in mice induced the
activation of the AMPK-ACC-CPT1 pathway, a signaling pathway
promoting fatty acid oxidation and achieving its lipid-lowering
effect (8). Additionally, it has
been established that in individuals with high-fat diet-induced
type 2 diabetes, monounsaturated free fatty acids (FFAs) can serve
as a predictive indicator of vascular restenosis following
interventional therapy (9).
Chronic diseases often occur when inflammation is persistent or has
not been effectively resolved (10).
Disorders such as cardiovascular disease, diabetes,
several forms of cancer and autoimmune diseases have the hallmarks
of chronic non-resolving inflammation, and the altered metabolic
pathways play crucial roles that contribute to the pathogenesis of
inflammation (11-14). Genomic studies have contributed to
the identification of genes that can affect the risk of these
diseases. For example, genetic variations of paraoxonase genes have
been shown to be associated with cardiovascular disease and the
differential FA composition in human adipose tissue (15). However, the clinical application
of these findings is limited due to the fact that genetic
alterations do not always manifest as phenotypic variations
(16,17). A more targeted approach includes
the study of metabolism, particularly the use of tools developed
for the study of FA metabolism (18).
The evaluation of the FA status as part of
metabolomics profiling can provide invaluable input for the
identification of metabolic disruption prior to the onset of
symptoms, and can predict disease risk (19-21). Metabolites are products of gene
expression regulated by epigenetic factors (e.g., nutrition, stress
and exercise). Metabolites reflect the current state of health and
provide evidence of previous conditions (22-24). The simultaneous profiling of
distinct biological pathways that includes many metabolites can
provide an overview of the metabolic status. This approach can be
used for the accurate identification of specific biomarkers that
correspond to different clinical conditions (25).
The clinical evaluation of the FA levels associated
with acquired metabolic diseases requires the generation of
sensitive reference values (RVs). RVs limited to a narrow range are
necessary for the reliable detection of small differences in FA
levels in a population. Population studies have been used to
examine baseline FA levels in different populations (26-28). However, variabilities in the
evaluation methods used, population characteristics and units used
to express the results of FAs (29) hinders the establishment of
reference ranges that could be used as complementary diagnostic
tools. To the best of our knowledge, the concentration of total FAs
(TFAs) in the Greek population has not yet been defined. The
findings of a previous study included only selected unsaturated FAs
(30). The quantification of many
FAs and the assessment of their relative levels can provide a more
comprehensive description of FA metabolism than the study of a few
selected FAs (19).
A reliable and valid method with which to evaluate
the FA composition that can be used in large clinical studies as
markers of deficiency or excess is needed (31). Previous clinical studies on the
roles of FAs in health and disease have revealed differences in
factors, including demographics, the background diet of the study
population, the use of supplements, differences in FA analysis
methods, variability in clinical parameters and disease background
(32,33). Additionally, the levels of FAs
must be comparable to a set of RVs that reflect the
sociodemo-graphic characteristics of the general population,
adjusted for location and dietary habits (34).
As part of a targeted FA profiling approach, we used
a highly sensitive method to detect very low quantities of FA
molecules. The high resolving power of gas chromatography (GC) and
the extended possibility for identification of metabolites inherent
in mass spectroscopy (MS) methods can be applied in large-scale
studies; the use of these methods results in a short turnaround
time for the analysis of samples (35-37). In a previous population study, we
used this approach to analyze organic acids (OAs) in healthy Greek
individuals and found that we could detect small differences among
metabolites (38).
The aim of this study was to evaluate 24 total
plasma Fas (i.e., omega-3 and omega-6 PUFAs, MUFAs and SFAs) to
obtain a comprehensive quantitative and qualitative assessment of
FA values.
Materials and methods
Subjects
The 159 participants enrolled in this study were
outpatients admitted to a private clinic in Athens in the period of
January, 2013 to July, 2015. From each of the participants a blood
sample was collected and their medical records were obtained.
Patients were eligible for the study if they were healthy, not
suffering from any chronic disease, non-obese and fasted. The
results of the medical examinations indicated that all study
participants were healthy. No chronic diseases were diagnosed in
the population, and none of the participants used medication or
supplements at the time of the clinic visit. Patients that did not
meet the inclusion criteria (e.g., disease, obesity or non-fasting)
were not included in this study. All procedures performed in
studies involving human participants were under the ethical
standards with the 1964 Helsinki declaration and its later
amendments, or comparable ethical standards. An informed consent
was obtained from all participants for this study according to the
EU General Data Protection Regulation (GDPR).
Chemicals
Methyl nonadecanoate (74208, Honeywell Fluka™;
Honeywell, Seelze, Germany) was used as an internal standard. A
mixture of FA methyl esters (47885-U; Supelco-Sigma-Aldrich, St.
Louis, MO, USA) was used for the calibration of the standard
mixture. All other solvents used were of the highest purity
available [methanol, n-hexane (both from Merck KGaA, Darmstadt,
Germany), HCl (301721] and 2,6-i-tert-butyl-4-methylphenol (BHT,
B1378l) (both from Sigma-Aldrich).
Sample preparation
The analysis of TFAs includes the hydrolysis of the
ester bonds and the simultaneous formation of FA methyl esters that
are separated using GC-MS. Blood samples were obtained from adults
following a 12-h fast. The samples were centrifuged at 1,500 × g at
4°C, and the plasma specimens were stored at −20°C until analysis,
but no longer than 24 h to avoid degradation. If hemolysis occurred
during collection, the sample was discarded, and blood collection
was repeated. Following the addition of the standard internal
mixture (200 µl methyl nonadecanoate in hexane containing
BHT) to 100 µl plasma, the FAs were hydrolyzed and
derivatized into methyl esters by the addition of 5% v/v methanolic
HCl. Transmethylation was performed at 90°C for 60 min. The samples
were then brought to room temperature, and the FA methyl esters
were extracted using hexane and transferred to GC injection vials
with a crimp cap. As previously described, sample preparation did
not include lipid extraction prior to methylation as MS allows the
direct detection and identification of FAs in plasma without
affecting quantity or quality (39).
GC-MS
The sample injection volume was 1 µl, and
helium was used as a carrier gas. The analysis was performed on an
Agilent 6890/5975C GC-MS operating in electron ionization mode
(Agilent Technologies, Santa Clara, CA, USA). The separation of FA
methyl esters was accomplished using an HP-5 ms capillary column
(30 m × 250 µm × 0.25 µm). The initial oven
temperature was 70°C, the ramp rate was 4°C/min, and the final
temperature was 290°C, held for 4 min. The acquisition was in the
scan mode.
Statistical analysis
The results of the descriptive statistics analysis
for the 24 FAs are presented as measures of tendency, including
values for minimum, maximum, median, quartiles (1st and 3rd), and
90th percentile and dispersion (95% confidence intervals) were
estimated. The sums of the saturated, unsaturated (e.g., MUFA and
PUFA), omega-3 and omega-6 FAs were calculated. The FA RVs were set
using the approximate 95% confidence intervals for the mean values
(mean ± 1.96 × standard deviation). In cases where negative values
were estimated, the lower levels were presented as below zero
(<0). Between-group differences in the FA level were tested
using the non-parametric Mann-Whitney test for 2 groups and the
Kruskal-Wallis test for >2 groups. A Dunn’s t-test followed the
Kruskal-Wallis test for post hoc bivariate comparisons. IBM SPSS
Statistics V22.0 software (IBM SPSS, Armonk, NY, USA) was used for
the analysis of the data. Levels of a=0.05 was set as cut-off
values for the level of significance.
Results
The evaluation of the FA levels was performed using
plasma samples of 159 healthy adults (males, 44.7%, n=71; females,
55.3%, n=88). The mean age (± standard deviation) of the
participants was 39.7 (±9.1) years. The age distribution did not
differ significantly between the sexes (P=0.307) (data not shown).
The mean values of BMI and waist circumference were 25.5 and 73 cm,
respectively. The samples were divided into 4 groups according to
age for the statistical analysis [i.e., adults ≤30 years (16.4%),
31-40 years (34.6%), 41-50 years (37.7%) and >50 years
(11.3%)].
The mean, max, quartiles, 90th percentile and 95%
confidence interval of the mean are presented in Table I. Based on these measures, the
physiological levels of an individual should be included between
1149.1-3349.5 µmol/l for TFAs, 228.5-1942.4 µmol/l
for MUFAs and 947.6-3528.0 µmol/l for PUFAs. A more detailed
list of percentiles and quartiles is presented in Table S1.
 | Table IDescriptive statistics for plasma
fatty acid concentrations (µmol/l). |
Table I
Descriptive statistics for plasma
fatty acid concentrations (µmol/l).
| Fatty acids | Min | 25 | Median | 75 | 90 | Max | 95% LL-95% UL |
|---|
| Total
saturated | 728.7 | 1895.3 | 2169.0 | 2525.2 | 3022.6 | 4192.3 | 1149.1-3349.5 |
| C12:0 | 0.3 | 6.4 | 13.2 | 22.8 | 41.4 | 66.7 | <0-46.7 |
| C14:0 | 16.7 | 35.7 | 51.0 | 71.1 | 87.5 | 183.6 | <0-115.8 |
| C15:0 | 3.4 | 10.0 | 12.3 | 15.3 | 20.3 | 39.8 | 3.5-23.0 |
| C16:0 | 781.3 | 1306.7 | 1478.0 | 1725.2 | 2080.4 | 2704.1 | 806.1-2291.5 |
| C17:0 | 8.5 | 13.6 | 16.8 | 19.6 | 23.7 | 45.5 | 7.7-26.9 |
| C18:0 | 8.5 | 528.8 | 625.1 | 702.5 | 771.0 | 1054.7 | 357.0-885.8 |
| C20:0 | 3.5 | 11.8 | 14.3 | 17.3 | 19.9 | 56.8 | 4.1-25.7 |
| C22:0 | 7.5 | 29.7 | 35.9 | 44.7 | 50.6 | 76.2 | 14.6-59.4 |
| C24:0 | 14.1 | 26.1 | 30.6 | 38.4 | 43.2 | 66.6 | 15.3-49.2 |
| MUFAs | 389.0 | 739.5 | 980.3 | 1302.5 | 1703.9 | 2576.1 | 228.5-1942.4 |
| C14:1 | 0.0 | 1.0 | 1.0 | 1.0 | 2.7 | 13.2 | <0-4.6 |
| C15:1 | 0.1 | 1.0 | 1.0 | 1.0 | 13.3 | 40.1 | <0-15.7 |
| C16:1n-7 | 7.8 | 30.9 | 46.7 | 72.2 | 100.0 | 864.3 | <0-206.4 |
| C18:1n-9cis | 310.7 | 639.2 | 864.5 | 1147.0 | 1471.7 | 2365.1 | 169.6-1734.2 |
| C20:1n-9 | 0.1 | 1.0 | 2.0 | 4.0 | 7.6 | 20.4 | <0-9.1 |
| C22:1n-9 | 0.1 | 1.0 | 1.0 | 1.0 | 1.5 | 26.3 | <0-5.9 |
| C24:1n-9 | 8.0 | 59.0 | 69.0 | 83.0 | 91.8 | 149.0 | 33.1-108.8 |
| PUFAs | 968.0 | 1746.1 | 2123.7 | 2574.9 | 3134.3 | 4262.5 | 947.6-3528.0 |
| C18:2n-6 | 588.6 | 1141.7 | 1420.5 | 1804.2 | 2216.4 | 3317.3 | 520.8-2494.8 |
| C18:3n-3 | 0.8 | 2.5 | 7.7 | 18.1 | 29.4 | 53.4 | <0-36.2 |
| C18:3n-6 | 0.6 | 3.1 | 9.2 | 21.1 | 32.2 | 58.8 | <0-40.3 |
| C20:3n-6 | 24.6 | 73.5 | 96.8 | 124.0 | 160.9 | 269.4 | 17.3-187.8 |
| C20:4n-6 | 188.2 | 296.3 | 349.7 | 443.0 | 517.7 | 732.5 | 160.8-587.3 |
| C22:6n-3 | 18.9 | 79.0 | 113.2 | 156.1 | 183.7 | 437.7 | <0-251.2 |
| C20:5n-3 | 9.3 | 27.9 | 34.3 | 54.4 | 91.4 | 245.3 | <0-123.8 |
| C20:3n-3 | 1.0 | 42.5 | 61.1 | 79.6 | 101.7 | 180.0 | <0-127.8 |
| Ratio AA:EPA | 1.8 | 6.8 | 10.1 | 14.1 | 17.6 | 26.7 | 0.0-21.5 |
| Total ω6 | 880.4 | 1580.1 | 1896.2 | 2307.7 | 2801.7 | 3894.3 | 833.1-3161.1 |
| Total ω3 | 47.4 | 176.8 | 217.3 | 281.3 | 366.3 | 774.6 | 20.9-464.5 |
| ω6:ω3 | 3.3 | 7.2 | 8.6 | 10.7 | 13.4 | 36.2 | 1.4-17.3 |
| Total FA | 3097.0 | 4526.1 | 5240.1 | 6244.2 | 8123.7 | 10322.8 | 2639.8-8504.2 |
Table II presents
the results of the differences in FA composition among the distinct
age groups, expressed as TFA percentage (% TFAs). There was a
decreasing trend in the mean relative levels of saturated
pentadecanoic acid (C15:0; P=0.031) and stearic acid (C18:0;
P=0.005) in the adults from the different age groups. The highest
values were found in adults <30 years of age. Conversely, the
relative levels of cis-10 pentadecanoic acid (C15:1; P=0.011)
increased considerably with age. In other two monosaturated fatty
acids there was a statistically significant difference (P<0.05)
when median values instead of means were compared. These acids
were: Myristoleic acid (C14:1; P=0.050) and dihomo-gamma-lino-lenic
acid (C20:3n6; P=0.046). The decreasing fact with age, was not
observable when mean values were presented.
| Table IIAge group differences in measured FAs
as % total FA composition. |
Table II
Age group differences in measured FAs
as % total FA composition.
| Fatty acids | Age groupsa
| P-value |
|---|
| ≤30 years
(n=26) | 31-40 years
(n=55) | 41-50 years
(n=60) | ≥51 years
(n=18) |
|---|
| Total
saturated | 41.3 (4.4) | 41.5 (5.0) | 40.1 (5.6) | 40.9 (7.4) | 0.566 |
| C12:0 | 0.3 (0.3) | 0.3 (0.3) | 0.3 (0.3) | 0.3 (0.3) | 0.722 |
| C14:0 | 1 (0.4) | 1 (0.4) | 1.1 (0.4) | 0.9 (0.2) | 0.193 |
| C15:0 | 0.3 (0.1) | 0.2 (0.1) | 0.2 (0.1) | 0.2 (0.1) | 0.031 |
| C16:0 | 28.5 (3.0) | 28.4 (3.5) | 27.4 (5.5) | 27.4 (5.1) | 0.189 |
| C17:0 | 0.3 (0.1) | 0.3 (0.1) | 0.3 (0.1) | 0.3 (0.1) | 0.090 |
| C18:0 | 13.5 (3.1) | 12.6 (4.2) | 10.8 (3.6) | 11.2 (4.2) | 0.005 |
| C20:0 | 0.3 (0.1) | 0.3 (0.1) | 0.3 (0.1) | 0.3 (0.1) | 0.105 |
| C22:0 | 0.6 (0.3) | 0.7 (0.2) | 0.7 (0.1) | 0.7 (0.2) | 0.719 |
| C24:0 | 0.6 (0.2) | 0.6 (0.2) | 0.6 (0.1) | 0.6 (0.1) | 0.825 |
| MUFAs | 17.9 (4.1) | 18.9 (4.1) | 19.6 (3.8) | 19.3 (3.9) | 0.144 |
| C14:1 | 0.03 (0.02) | 0.03 (0.02) | 0.02 (0.02) | 0.02 (0.01) | 0.050 |
| C15:1 | 0 (0.1) | 0.1 (0.1) | 0.1 (0.2) | 0.1 (0.1) | 0.011 |
| C16:1n-7 | 1 (0.5) | 1.3 (2.3) | 1.1 (0.6) | 0.8 (0.3) | 0.156 |
| C18:1n-9cis | 15.6 (3.9) | 16.4 (3.9) | 17.3 (3.7) | 17.1 (3.9) | 0.161 |
| C20:1n-9 | 0.1 (0) | 0.1 (0) | 0.1 (0.1) | 0.1 (0.1) | 0.219 |
| C22:1n-9 | 0.05 (0.04) | 0.06 (0.4) | 0.05 (0.05) | 0.07 (0.06) | 0.009 |
| C24:1n-9 | 1.3 (0.4) | 1.2 (0.4) | 1.2 (0.4) | 1.3 (0.3) | 0.545 |
| PUFAs | 40.9 (3.5) | 39.6 (4.4) | 40.3 (4.5) | 39.8 (4.6) | 0.807 |
| C18:2n6 | 27.5 (3.8) | 26.4 (5) | 27.2 (4.5) | 26.9 (5.3) | 0.835 |
| C18:3n3 | 0.2 (0.1) | 0.2 (0.2) | 0.2 (0.2) | 0.2 (0.2) | 0.913 |
| C18:3n6 | 0.2 (0.1) | 0.2 (0.2) | 0.2 (0.2) | 0.2 (0.2) | 0.745 |
| C20:3n6 | 177 (0.7) | 2 (0.7) | 1.8 (0.6) | 1.6 (0.5) | 0.046 |
| C20:4n6 | 7.1 (0.9) | 7.1 (1.4) | 6.6 (1.8) | 6.4 (1.1) | 0.053 |
| C22:6n3 | 2.2 (1) | 2 (0.8) | 2.3 (1.1) | 2.6 (0.7) | 0.051 |
| C20:5n3 | 0.9 (0.7) | 0.6 (0.3) | 1 (0.7) | 1 (0.6) | 0.006 |
| C20:3n3 | 1.1 (0.5) | 1.2 (0.5) | 1 (0.5) | 1 (0.5) | 0.057 |
| Ratio AA:EPA | 0.2 (0.1) | 0.3 (0.1) | 0.2 (0.1) | 0.2 (0.1) | <0.001 |
| Total ω6 | 36.5 (3.7) | 35.6 (4.8) | 35.9 (4.3) | 35.1 (4.9) | 0.914 |
| Total ω3 | 4.4 (1.4) | 4.1 (1.2) | 4.4 (1.7) | 4.8 (1.2) | 0.244 |
| Ratio ω6:ω3 | 0.2 (0.1) | 0.2 (0.1) | 0.2 (0.1) | 0.2 (0.1) | 0.027 |
Between ratios the omega-6/omega-3ratios, examined
as medians, revealed a significant difference between age groups
(P=0.027). The decreasing age trend was not clear when mean ratios
were presented. with a decreasing trend with the strongest
statistically significant finding found for the comparison between
the AA/EPA ratio and age (P<0.001); there was a trend in an
increasing value in the ratio until 40 years of age, and then a
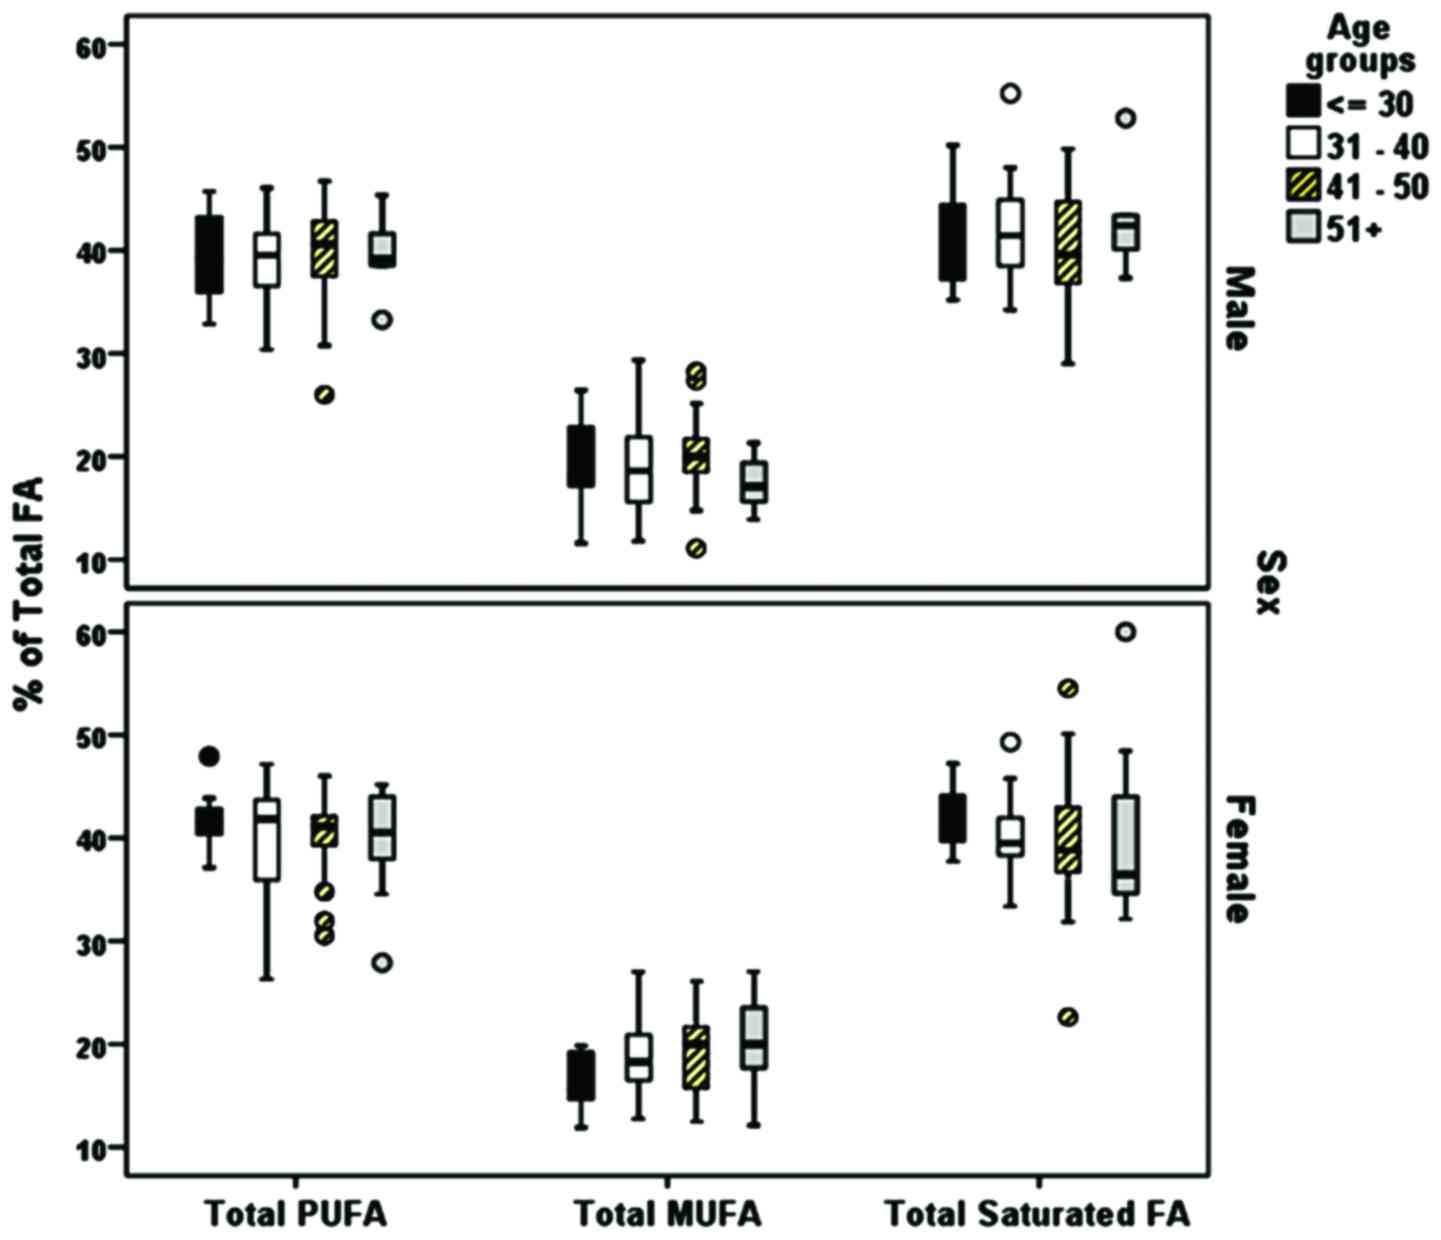
decline in the older participants. The total relative levels of the
SFAs, MUFAs and PUFAs expressed as the % ratio of the TFAs were not
markedly altered with age in males or females (Fig. 2). Statistically significant
differences between the FA composition and sex were found for
myristic acid (C14:0; P=0.017 and DPA (C22:6n3; P=0.033) (Table III).
| Table IIISex group differences in measured
fatty acids as % total fatty acid composition. |
Table III
Sex group differences in measured
fatty acids as % total fatty acid composition.
| Fatty acids | Sex
| P-value |
|---|
Female (n=88)
| Male (n=71)
|
|---|
| Mean (SD) | Median | Mean (SD) | Median |
|---|
| Total
saturated | 40.6 (5.7) | 39.48 | 41.3 (5.1) | 41.0 | 0.308 |
| C12:0 | 0.3 (0.2) | 0.2 | 0.4 (0.3) | 0.3 | 0.094 |
| C14:0 | 1.0 (0.4) | 0.9 | 1.1 (0.4) | 1.0 | 0.017 |
| C15:0 | 0.2 (0.1) | 0.2 | 0.2 (0.1) | 0.2 | 0.246 |
| C16:0 | 27.7 (5.2) | 27.0 | 28.2 (3.4) | 27.8 | 0.281 |
| C17:0 | 0.3 (0.1) | 0.3 | 0.3 (0.1) | 0.3 | 0.254 |
| C18:0 | 11.4 (3.9) | 10.3 | 12.5 (3.8) | 12.8 | 0.077 |
| C20:0 | 0.3 (0.1) | 0.3 | 0.3 (0.1) | 0.3 | 0.846 |
| C22:0 | 0.7 (0.2) | 0.7 | 0.7 (0.2) | 0.7 | 0.458 |
| C24:0 | 0.6 (0.1) | 0.6 | 0.6 (0.2) | 0.6 | 0.058 |
| MUFAs | 18.8 (3.8) | 18.6 | 19.4 (4.2) | 19.0 | 0.528 |
| C14:1 | 0 (0.0) | 0.0 | 0 (0.0) | 0.0 | 0.657 |
| C15:1 | 0.1 (0.1) | 0.0 | 0.1 (0.2) | 0.0 | 0.402 |
| C16:1n-7 | 1 (0.4) | 0.9 | 1.2 (2.1) | 0.8 | 0.568 |
| C18:1n-9cis | 16.6 (3.7) | 16.4 | 16.8 (3.9) | 16.7 | 0.726 |
| C20:1n-9 | 0.1 (0.1) | 0.0 | 0.1 (0.1) | 0.0 | 0.849 |
| C22:1n-9 | 0 (0.1) | 0.0 | 0 (0.0) | 0.0 | 0.300 |
| C24:1n-9 | 1.2 (0.4) | 1.2 | 1.3 (0.4) | 1.2 | 0.935 |
| PUFAs | 40.6 (4.4) | 41.3 | 39.4 (4.3) | 39.7 | 0.057 |
| C18:2n6 | 27.5 (4.4) | 27.7 | 26.2 (4.8) | 26.3 | 0.072 |
| C18:3n3 | 0.2 (0.2) | 0.1 | 0.2 (0.2) | 0.2 | 0.337 |
| C18:3n6 | 0.2 (0.2) | 0.2 | 0.2 (0.2) | 0.2 | 0.291 |
| C20:3n6 | 1.8 (0.6) | 1.8 | 1.9 (0.6) | 1.9 | 0.188 |
| C20:4n6 | 6.8 (1.5) | 6.7 | 6.9 (1.5) | 6.8 | 0.572 |
| C22:6n3 | 2.3 (0.9) | 2.3 | 2.1 (1.0) | 1.9 | 0.033 |
| C20:5n3 | 0.9 (0.6) | 0.7 | 0.8 (0.6) | 0.6 | 0.469 |
| C20:3n3 | 1 (0.5) | 1.1 | 1.1 (0.5) | 1.1 | 0.148 |
| Ratio AA:EPA | 0.2 (0.1) | 0.2 | 0.2 (0.1) | 0.2 | 0.392 |
| Total ω6 | 36.3 (4.4) | 36.8 | 35.2 (4.5) | 35.3 | 0.127 |
| Total ω3 | 4.4 (1.5) | 4.2 | 4.2 (1.4) | 4.0 | 0.186 |
| ω6:ω3 | 0.2 (0.1) | 0.2 | 0.2 (0.1) | 0.2 | 0.318 |
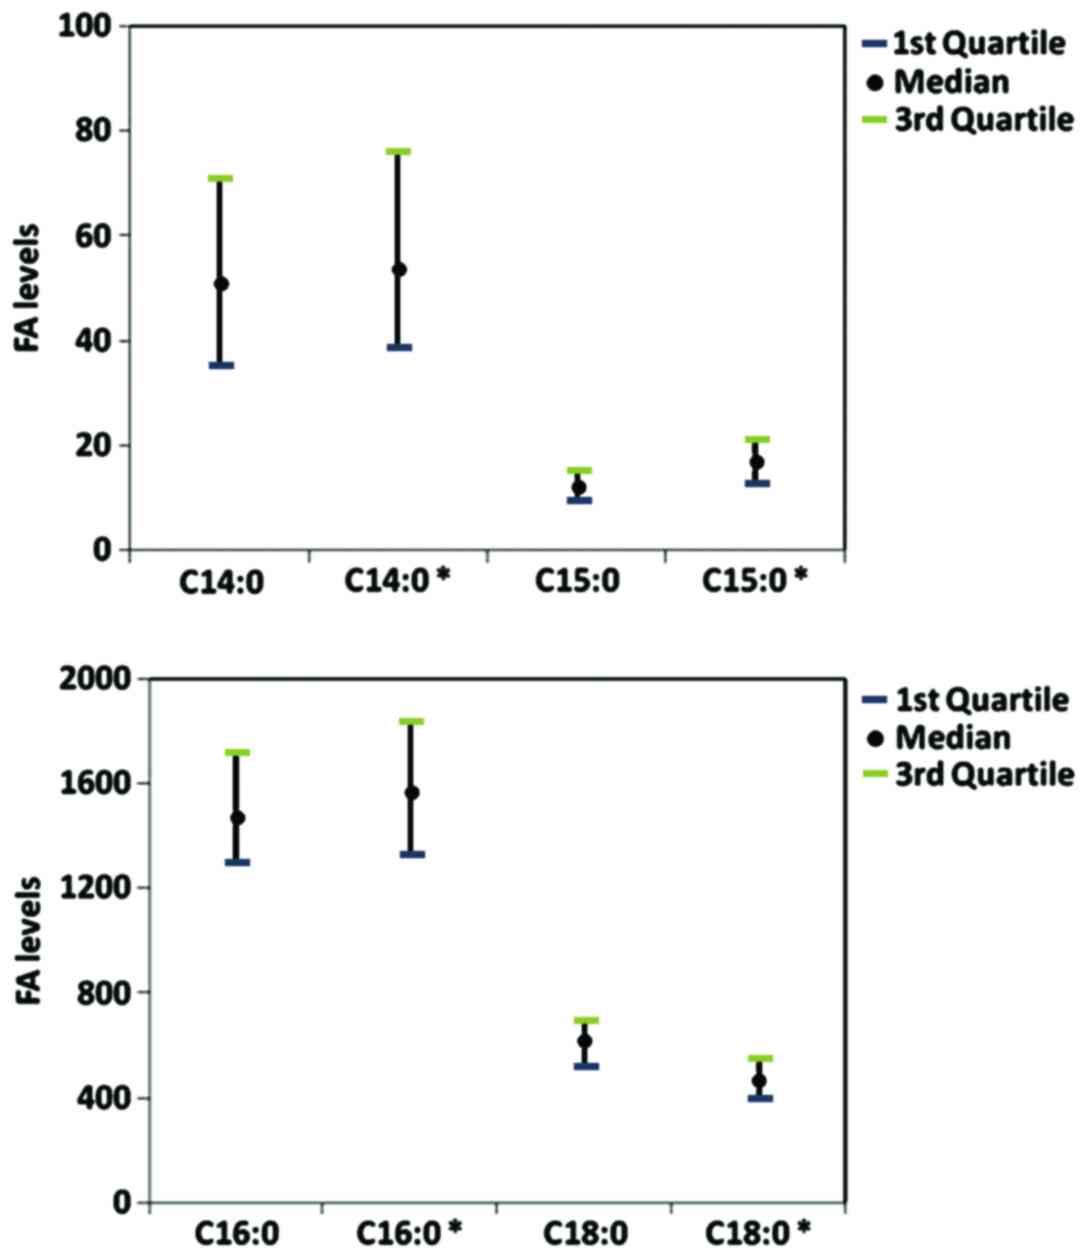
A comparative analysis of the relative FA levels (%
TFAs) was performed for our population dataset and a group of
Canadian adults (n=826) (27).
The interquartile ranges (1st and 3rd quartile) were estimated, and
similar levels were found for myristic acid (C14:0), pentadecanoic
acid (C15:0), palmitic acid (C16:0) and stearic acid (C18:0)
(Fig. 3). Further analysis of the
mean relative FA levels compared with the results from 374 healthy
Greek individuals from the ATTICA health and nutrition survey
revealed similar levels in the majority of the FA groups (30) (Table S2).
Discussion
In the present study, metabolomic profiling of 24
FAs, including omega-3 and omega-6 PUFAs, MUFAs and SFAs was
performed on a Greek population of 159 healthy adults to estimate
sensitive RV ranges Metabolomic analysis has extensive application
in the identification of variations in metabolite levels caused by
nutritional deficiencies or inflammation (19,23,40). It thus can be a valuable tool for
assessing the metabolic background of chronic inflammatory
disorders prior to the onset of symptoms (41,42).
The approach used in this study focused on the
quantification of 24 FAs and evaluation of their relative levels.
Thus, it allowed the estimation of intake via different sources and
provided a reliable assessment of nutritional status and dietary
habits. Unlike dietary frequency questionnaires, FA profiling
enables the estimation of dietary intake and endogenous FA
synthesis (6). The clinical
importance of measuring FAs is associated with their essential
roles in inflammation (43).
An analysis of PUFA levels in 1,123 healthy adults
by Ferrucci et al revealed a strong negative correlation
between omega-6/omega-3 ratiosand IL-10, an anti-inflammatory
cytokine; omega-3 levels positively correlated with the levels of
anti-inflammatory cytokines (44). The results of studies of the
associations between omega-3 intake and inflammation suggested that
these FAs are associated with the prevention of cardiovascular
disease (45,46), Parkinson’s symptoms and metabolic
state (47). The omega-6/omega-3
ratio has long been used as a representative measure of dietary fat
intake with multiple implications for chronic disease severity
(48). Most interventional
studies on the supplementation of omega-3 FAs in patients with
chronic disorders have examined the beneficial anti-inflammatory
properties of these FAs, particularly for rheumatoid arthritis
(49). However, dietary
recommendations on omega-3 FA intake are not consistent and vary in
FA source and dose (33).
The roles of omega-6 FAs are not yet fully
understood (50,51). LA, the major omega-6 FA, has long
been regarded as harmful and atherogenic. However, LA may be highly
beneficial as part of a low-SFA diet (50). LA is the precursor of many
bioactive molecules, including pro-inflammatory eicosanoids and
inflammation suppression molecules. By contrast, the LA-produced
dihomo-gamma-linolenic acid (DGLA) mostly acts as a substrate for
anti-inflammatory molecules. However, at high levels, it is
desaturated to AA to participate in the formation of inflammatory
eicosanoids (52). Increased
levels of DGLA are associated with high insulin levels and insulin
resistance in patients with type 2 diabetes (53,54). Our study revealed DGLA RVs of
73.5-124 µmol/l in a healthy population. Tissue sensitivity
to insulin is associated with the AA/EPA ratio. Thus, AA production
is regulated in an insulin-dependent manner. EPA is an AA
antagonist and a substrate for anti-inflammatory eicosanoid
production (i.e., series-3 prostaglandins, thromboxanes, and
5-series leukotrienes). Therefore, the AA/EPA ratio is a sensitive
marker of the balance between omega-6 and omega-3 and the trend in
pro-inflammatory eicosanoid production (55). High AA/EPA levels are associated
with arterial stiffness in patients with obesity and dyslipidemia
(56) and acute coronary
syndrome; this ratio may be useful as a diagnostic marker for
cardiovascular disease (57,58). Our results indicated that the
range in values for the AA/EPA ratio was 6.8-14.1 for a healthy
population; these values were likely associated with modern dietary
habits. Omega-9 MUFAs are produced endogenously from SFAs and are
subsequently catalyzed by the delta-9 desaturase. When insulin
levels or insulin resistance are elevated, the inhibition of
desaturase results in elevated levels of palmitic and stearic acid.
Hence, FA composition and desaturase activity are associated with
insulin resistance (54).
Compared with intake of a diet high in carbohydrates, the
consumption of a MUFA-rich diet is associated with beneficial
effects on values for metabolic parameters including blood
pressure, glycemic levels, and serum lipids (59).
One strength of this study was the presentation of
RV results as FA concentrations. These results can be compared and
applied in future clinical studies. To eliminate differences in
total FA levels among individuals that could affect the FA
profiling results, differences among age groups and sex were
evaluated using relative values within the FA pool. In most similar
studies, RVs are reported as percent composition; the value of each
FA depends on the relative levels of the other measured FAs.
However, this type of approach is more appropriate for nutrition
studies or comparisons between groups in a well-defined population
in which FA values are affected by total FAs. The use of
concentration values is a more reliable approach for the study of
the direct association between a specific FA and a biological
mechanism or outcome, and thus can be used as biomarkers (60).
The assessment of FA composition can be performed in
adipose tissue, erythrocytes, platelets, whole blood and plasma
(29). Circulating FAs mainly
reflect the dietary intake several weeks before sampling. FA values
obtained from erythrocytes and adipose tissue reveal habits of
months and years, respectively. Plasma contains all lipid
fractions, including triglycerides, cholesteryl esters and free
FAs. To achieve an overall evaluation of FA levels, the total FA
composition should be assessed (61). Consistent with this requirement,
we used a GC-MS method in this study; the lipid fractions were
hydrolyzed, and the FAs were esterified to methylesters, which
allowed estimation of the total FAs contained in plasma (37).
This study had some limitations. As the population
consisted of Greek individuals, the results should be interpreted
with caution when applied to individuals from other geographical
areas. In a systematic review, Stark et al found wide
fluctuations in physiological blood FA levels between individuals
around the globe, particularly for EPA and DHA; different dietary
habits accounted for most of the differences (26). FA levels are primarily affected by
dietary habits. This association can be illustrated by the elevated
levels of stearic acid (P=0.005) and omega-6/omega-3 ratios
(P=0.027) found in the participants <30 years of age (Table I). Adults in this age group tend
to consume carbohydrate-rich diets with a low or no intake of
vegetables, fruits, nuts, fish and other sources of beneficial fats
(62). Compared with the male
participants, female participants in the age group >30 years had
lower total SFA and increased MUFA levels (Fig. 2). However, there were no
between-group differences in PUFA levels for age or sex. The
differences in the AA/EPA ratio (P<0.0001) and in DGLA (P=0.046)
also indicated the effects of diet on the metabolic profile results
(63). Many of the plasma FA
concentrations found in a study of healthy adults in Canada were
similar to the RV results observed in our population (27). The results for myristic acid,
pentadecanoic acid, palmitic acid, and stearic acid were almost
identical between the two datasets (Fig. 3). Therefore, despite demographic
differences, the levels of some FAs may be similar among
populations and can thus be used as biomarkers.
In the healthy Greek population examined in the
ATTICA study, the results for the relative levels of the major FAs
were also very similar to the results of our study (30). The mean relative values for total
omega-6 (33.75%) and total omega-3 (2.66%) were identical to the
values for our population set (35.74 and 4.32%), respectively. The
results for AA (5.17%) and DHA (1.56%) were also not markedly
different from the results obtained in our study (6.82 and 2.2%,
respectively) (Table S2). The ATTICA sample size was larger, and
the FAs were evaluated using a different laboratory method.
However, the results of this comparison with the results of the
ATTICA study emphasizes the strength of the metabolomics approach
and the consistency among population sets. Even though we cannot
extrapolate our findings to other populations, results from
previous and present studies highlight the value of metabolomics
and FAs for biomarker identification.
In conclusion, the identification of FA imbalances
through metabolomics analysis will allow the early detection of
metabolism dysfunction. Its application may be useful for both the
diagnosis and prevention of chronic inflammatory diseases. The data
of this study contribute to the establishment of sensitive RVs for
FAs. These RVs can be combined with the RVs for organic acids
(38) and can be examined in
clinical studies to assess their validity and reliability as
biomarkers for various chronic diseases in different populations.
For successful application to clinical practice, further research
based on the current approach is required in order to develop a
standardized methodology and RVs for panels of FAs.
Acknowledgments
The authors would like to thank all the
administrative, technical and medical staff of Toxplus, the
Metabolomic Clinic, and the Laboratory of Toxicology for their
dedicated involvement in this study.
Funding
This study was funded by Metabolomic Clinic S.A. and
Toxplus S.A. and supported by the Special Research Account of
University of Crete (ELKE nos. 4602, 4920 and 3963).
Availability of data and materials
The datasets presented in this study are available
from the corresponding author upon reasonable request.
Authors’ contributions
DT, AT and DAS conceived and designed the study; DT
and GT collected the samples and performed clinical measurements;
EP performed the serum FA targeted metabolomic analysis; PF and ES
performed the data processing and quality control assessment; AKA,
DN and FG performed the statistical analysis. All authors reviewed
and approved the manuscript before submission.
Ethics approval and consent to
participate
All procedures performed in studies involving human
participants were under the ethical standards with the 1964
Helsinki declaration and its later amendments, or comparable
ethical standards. An informed consent was obtained from all
participants for this study according to the EU General Data
Protection Regulation (GDPR).
Patient consent for publication
Not applicable.
Competing interests
DAS is the Editor-in-Chief for the journal, but had
no personal involvement in the reviewing process, or any influence
in terms of adjudicating on the final decision, for this
article.
Abbreviations:
|
FA
|
fatty acid
|
|
MUFA
|
monounsaturated fatty acid
|
|
PUFA
|
polyunsaturated fatty acid
|
|
LA
|
linoleic acid
|
|
ALA
|
alpha-linolenic acid
|
|
AA
|
arachidonic acid
|
|
EPA
|
eicosapentaenoic acid
|
|
DHA
|
docosahexaenoic acid
|
|
COX
|
cyclooxygenase
|
|
LOX
|
lipoxygenase
|
|
CYP
|
cytochrome P450
|
|
RV
|
reference value
|
|
OA
|
organic acid
|
|
GC-MS
|
gas chromatography-mass
spectrometry
|
|
SFA
|
saturated fatty acid
|
|
DGLA
|
LA-produced dihomo-gamma-linolenic
acid
|
|
FXR
|
Farnesoid X receptor
|
|
FFAs
|
free fatty acids
|
References
|
1
|
Daley CA, Abbott A, Doyle PS, Nader GA and
Larson S: A review of fatty acid profiles and antioxidant content
in grass-fed and grain-fed beef. Nutr J. 9:102010. View Article : Google Scholar : PubMed/NCBI
|
|
2
|
Kris-Etherton PM, Harris WS, Appel LJ and
Nutrition Committee: Fish consumption, fish oil, omega-3 fatty
acids, and cardiovascular disease. Arterioscler Thromb Vasc Biol.
23:e20–e30. 2003.PubMed/NCBI
|
|
3
|
Blasbalg TL, Hibbeln JR, Ramsden CE,
Majchrzak SF and Rawlings RR: Changes in consumption of omega-3 and
omega-6 fatty acids in the United States during the 20th century.
Am J Clin Nutr. 93:950–962. 2011. View Article : Google Scholar : PubMed/NCBI
|
|
4
|
Bosma-den Boer MM, van Wetten ML and
Pruimboom L: Chronic inflammatory diseases are stimulated by
current lifestyle: How diet, stress levels and medication prevent
our body from recovering. Nutr Metab (Lond). 9:322012. View Article : Google Scholar
|
|
5
|
Engin AB, Tsatsakis AM, Tsoukalas D and
Engin A: Do flavanols-rich natural products relieve obesity-related
insulin resistance. Food Chem Toxicol. 112:157–167. 2018.
View Article : Google Scholar
|
|
6
|
Simopoulos AP and DiNicolantonio JJ: The
importance of a balanced ω-6 to ω-3 ratio in the prevention and
management of obesity. Open Heart. 3:e0003852016. View Article : Google Scholar
|
|
7
|
Patterson E, Wall R, Fitzgerald GF, Ross
RP and Stanton C: Health implications of high dietary omega-6
polyunsaturated Fatty acids. J Nutr Metab. 2012.539426:2012.
|
|
8
|
Liu Y, Song A, Yang X, Zhen Y, Chen W,
Yang L, Wang C and Ma H: Farnesoid X receptor agonist decreases
lipid accumulation by promoting hepatic fatty acid oxidation in
db/db mice. Int J Mol Med. 42:1723–1731. 2018.PubMed/NCBI
|
|
9
|
Feng L, Dou C, Wang J, Jiang C, Ma X and
Liu J: Upregulated 14 3 3β aggravates restenosis by promoting cell
migration following vascular injury in diabetic rats with elevated
levels of free fatty acids. Int J Mol Med. 42:1074–1085.
2018.PubMed/NCBI
|
|
10
|
Nathan C and Ding A: Nonresolving
inflammation. Cell. 140:871–882. 2010. View Article : Google Scholar : PubMed/NCBI
|
|
11
|
Tabas I: Macrophage death and defective
inflammation resolution in atherosclerosis. Nat Rev Immunol.
10:36–46. 2010. View
Article : Google Scholar :
|
|
12
|
Chimenti MS, Triggianese P, Conigliaro P,
Candi E, Melino G and Perricone R: The interplay between
inflammation and metabolism in rheumatoid arthritis. Cell Death
Dis. 6:e18872015. View Article : Google Scholar : PubMed/NCBI
|
|
13
|
Roxburgh CS and McMillan DC: Cancer and
systemic inflammation: Treat the tumour and treat the host. Br J
Cancer. 110:1409–1412. 2014. View Article : Google Scholar : PubMed/NCBI
|
|
14
|
Donath MY and Shoelson SE: Type 2 diabetes
as an inflammatory disease. Nat Rev Immunol. 11:98–107. 2011.
View Article : Google Scholar : PubMed/NCBI
|
|
15
|
Zafiropoulos A, Linardakis M, Jansen EHJM,
Tsatsakis AM, Kafatos A and Tzanakakis GN: Paraoxonase 1 R/Q
alleles are associated with differential accumulation of saturated
versus 20:5n3 fatty acid in human adipose tissue. J Lipid Res.
51:1991–2000. 2010. View Article : Google Scholar : PubMed/NCBI
|
|
16
|
Nicholson JK: Global systems biology,
personalized medicine and molecular epidemiology. Mol Syst Biol.
2:522006. View Article : Google Scholar : PubMed/NCBI
|
|
17
|
Karczewski KJ and Snyder MP: Integrative
omics for health and disease. Nat Rev Genet. 19:299–310. 2018.
View Article : Google Scholar : PubMed/NCBI
|
|
18
|
Wenk MR: The emerging field of lipidomics.
Nat Rev Drug Discov. 4:594–610. 2005. View
Article : Google Scholar : PubMed/NCBI
|
|
19
|
Zhao L, Ni Y, Ma X, Zhao A, Bao Y, Liu J,
Chen T, Xie G, Panee J, Su M, et al: A panel of free fatty acid
ratios to predict the development of metabolic abnormalities in
healthy obese individuals. Sci Rep. 6:284182016. View Article : Google Scholar : PubMed/NCBI
|
|
20
|
Matthan NR, Ooi EM, Van Horn L, Neuhouser
ML, Woodman R and Lichtenstein AH: Plasma phospholipid fatty acid
biomarkers of dietary fat quality and endogenous metabolism predict
coronary heart disease risk: A nested case-control study within the
Women’s Health Initiative observational study. J Am Heart Assoc.
3:14–16. 2014. View Article : Google Scholar
|
|
21
|
Harris WS, Luo J, Pottala JV, Margolis KL,
Espeland MA and Robinson JG: Red blood cell fatty acids and
incident diabetes mellitus in the women’s health initiative memory
study. PLoS One. 11:e01478942016. View Article : Google Scholar
|
|
22
|
Shaw J: Fathoming metabolism. The study of
metabolites does an end run around genomics to provide telling
clues to your future health. Harv Mag. 3:27–31. 2011.
|
|
23
|
Wang TJ, Larson MG, Vasan RS, Cheng S,
Rhee EP, McCabe E, Lewis GD, Fox CS, Jacques PF, Fernandez C, et
al: Metabolite profiles and the risk of developing diabetes. Nat
Med. 17:448–453. 2011. View
Article : Google Scholar : PubMed/NCBI
|
|
24
|
Cheng S, Larson MG, Mccabe EL, Murabito
JM, Rhee EP, Ho JE, Jacques PF, Ghorbani A, Magnusson M, Souza AL,
et al: Distinct metabolomic signatures are associated with
longevity in humans. Nat Commun. 6:67912015. View Article : Google Scholar : PubMed/NCBI
|
|
25
|
Clish CB: Metabolomics: An emerging but
powerful tool for precision medicine. Cold Spring Harb Mol Case
Stud. 1:a0005882015. View Article : Google Scholar
|
|
26
|
Stark KD, Van Elswyk ME, Higgins MR,
Weatherford CA and Salem N Jr: Global survey of the omega-3 fatty
acids, docosa-hexaenoic acid and eicosapentaenoic acid in the blood
stream of healthy adults. Prog Lipid Res. 63:132–152. 2016.
View Article : Google Scholar : PubMed/NCBI
|
|
27
|
Abdelmagid SA, Clarke SE, Nielsen DE,
Badawi A, El-Sohemy A, Mutch DM and Ma DW: Comprehensive profiling
of plasma fatty acid concentrations in young healthy Canadian
adults. PLoS One. 10:e01161952015. View Article : Google Scholar : PubMed/NCBI
|
|
28
|
Perreault M, Roke K, Badawi A, Nielsen DE,
Abdelmagid SA, El-Sohemy A, Ma DW and Mutch DM: Plasma levels of
14:0, 16:0, 16:1n-7, and 20:3n-6 are positively associated, but
18:0 and 18:2n-6 are inversely associated with markers of
inflammation in young healthy adults. Lipids. 49:255–263. 2014.
View Article : Google Scholar
|
|
29
|
Risé P, Eligini S, Ghezzi S, Colli S and
Galli C: Fatty acid composition of plasma, blood cells and whole
blood: Relevance for the assessment of the fatty acid status in
humans. Prostaglandins Leukot Essent Fatty Acids. 76:363–369. 2007.
View Article : Google Scholar : PubMed/NCBI
|
|
30
|
Kalogeropoulos N, Panagiotakos DB,
Pitsavos C, Chrysohoou C, Rousinou G, Toutouza M and Stefanadis C:
Unsaturated fatty acids are inversely associated and n-6/n-3 ratios
are positively related to inflammation and coagulation markers in
plasma of apparently healthy adults. Clin Chim Acta. 411:584–591.
2010. View Article : Google Scholar : PubMed/NCBI
|
|
31
|
Baum SJ: A survey of internists and
cardiologists: Are discoveries in fatty acids truly being
translated into clinical practice. Prostaglandins Leukot Essent
Fatty Acids. 88:3–4. 2013. View Article : Google Scholar
|
|
32
|
Hudita A, Galateanu B, Dinescu S, Costache
M, Dinischiotu A, Negrei C, Stan M, Tsatsakis A, Nikitovic D,
Lupuliasa D, et al: In vitro effects of cetylated fatty acids
mixture from celadrin on chondrogenesis and inflammation with
impact on osteoarthritis. Cartilage. May 1–2018.Epub ahead of
print. View Article : Google Scholar : PubMed/NCBI
|
|
33
|
Weylandt KH, Serini S, Chen YQ, Su HM, Lim
K, Cittadini A and Calviello G: Omega-3 polyunsaturated fatty
acids: The way forward in times of mixed evidence. Biomed Res Int.
2015.143109:2015.
|
|
34
|
Simopoulos AP: An increase in the
Omega-6/Omega-3 fatty acid ratio increases the risk for obesity.
Nutrients. 8:1282016. View Article : Google Scholar : PubMed/NCBI
|
|
35
|
Yang YJ, Choi MH, Paik MJ, Yoon HR and
Chung BC: Gas chromatographic-mass spectrometric determination of
plasma saturated fatty acids using pentafluorophenyldimethylsilyl
derivatization. J Chromatogr B Biomed Sci Appl. 742:37–46. 2000.
View Article : Google Scholar : PubMed/NCBI
|
|
36
|
Ruiter AF, Ackermans MT and Endert E:
Simultaneous gas chromatographic determination of concentration and
isotopic enrichment of fatty acids in human plasma using flame
ionization and mass spectrometric detection. J Chromatogr B Biomed
Sci Appl. 759:169–174. 2001. View Article : Google Scholar : PubMed/NCBI
|
|
37
|
Ecker J, Scherer M, Schmitz G and Liebisch
G: A rapid GC-MS method for quantification of positional and
geometric isomers of fatty acid methyl esters. J Chromatogr B
Analyt Technol Biomed Life Sci. 897:98–104. 2012. View Article : Google Scholar : PubMed/NCBI
|
|
38
|
Tsoukalas D, Alegakis A, Fragkiadaki P,
Papakonstantinou E, Nikitovic D, Karataraki A, Nosyrev AE,
Papadakis EG, Spandidos DA, Drakoulis N, et al: Application of
metabolomics: Focus on the quantification of organic acids in
healthy adults. Int J Mol Med. 40:112–120. 2017. View Article : Google Scholar : PubMed/NCBI
|
|
39
|
Stellaard F, ten Brink HJ, Kok RM, van den
Heuvel L and Jakobs C: Stable isotope dilution analysis of very
long chain fatty acids in plasma, urine and amniotic fluid by
electron capture negative ion mass fragmentography. Clin Chim Acta.
192:133–144. 1990. View Article : Google Scholar : PubMed/NCBI
|
|
40
|
Cheng S, Rhee EP, Larson MG, Lewis GD,
McCabe EL, Shen D, Palma MJ, Roberts LD, Dejam A, Souza AL, et al:
Metabolite profiling identifies pathways associated with metabolic
risk in humans. Circulation. 125:2222–2231. 2012. View Article : Google Scholar : PubMed/NCBI
|
|
41
|
Calder PC, Albers R, Antoine JM, Blum S,
Bourdet-Sicard R, Ferns GA, Folkerts G, Friedmann PS, Frost GS,
Guarner F, et al: Inflammatory disease processes and interactions
with nutrition. Br J Nutr. 101(Suppl 1): S1–S45. 2009. View Article : Google Scholar : PubMed/NCBI
|
|
42
|
Holmes E, Wilson ID and Nicholson JK:
Metabolic phenotyping in health and disease. Cell. 134:714–717.
2008. View Article : Google Scholar : PubMed/NCBI
|
|
43
|
Galli C and Calder PC: Effects of fat and
fatty acid intake on inflammatory and immune responses: A critical
review. Ann Nutr Metab. 55:123–139. 2009. View Article : Google Scholar : PubMed/NCBI
|
|
44
|
Ferrucci L, Cherubini A, Bandinelli S,
Bartali B, Corsi A, Lauretani F, Martin A, Andres-Lacueva C, Senin
U and Guralnik JM: Relationship of plasma polyunsaturated fatty
acids to circulating inflammatory markers. J Clin Endocrinol Metab.
91:439–446. 2006. View Article : Google Scholar
|
|
45
|
Bersch-Ferreira ÂC, Sampaio GR, Gehringer
MO, Ross-Fernandes MB, Kovacs C, Alves R, Pereira JL, Magnoni CD,
Weber B and Rogero MM: Association between polyunsaturated fatty
acids and inflammatory markers in patients in secondary prevention
of cardiovascular disease. Nutrition. 37:30–36. 2017. View Article : Google Scholar : PubMed/NCBI
|
|
46
|
Harris WS, Del Gobbo L and Tintle NL: The
Omega-3 Index and relative risk for coronary heart disease
mortality: Estimation from 10 cohort studies. Atherosclerosis.
262:51–54. 2017. View Article : Google Scholar : PubMed/NCBI
|
|
47
|
Taghizadeh M, Tamtaji OR, Dadgostar E,
Daneshvar Kakhaki R, Bahmani F, Abolhassani J, Aarabi MH, Kouchaki
E, Memarzadeh MR and Asemi Z: The effects of omega-3 fatty acids
and vitamin E co-supplementation on clinical and metabolic status
in patients with Parkinson’s disease: A randomized, double-blind,
placebo-controlled trial. Neurochem Int. 108:183–189. 2017.
View Article : Google Scholar : PubMed/NCBI
|
|
48
|
Simopoulos AP: The importance of the
omega-6/omega-3 fatty acid ratio in cardiovascular disease and
other chronic diseases. Exp Biol Med (Maywood). 233:674–688. 2008.
View Article : Google Scholar
|
|
49
|
Miles EA and Calder PC: Influence of
marine n-3 polyunsaturated fatty acids on immune function and a
systematic review of their effects on clinical outcomes in
rheumatoid arthritis. Br J Nutr. 107(Suppl 2): S171–S184. 2012.
View Article : Google Scholar : PubMed/NCBI
|
|
50
|
Farvid MS, Ding M, Pan A, Sun Q, Chiuve
SE, Steffen LM, Willett WC and Hu FB: Dietary linoleic acid and
risk of coronary heart disease: A systematic review and
meta-analysis of prospective cohort studies. Circulation.
130:1568–1578. 2014. View Article : Google Scholar : PubMed/NCBI
|
|
51
|
Harris WS, Mozaffarian D, Rimm E,
Kris-Etherton P, Rudel LL, Appel LJ, Engler MM, Engler MB and Sacks
F: Omega-6 fatty acids and risk for cardiovascular disease: A
science advisory from the American Heart Association nutrition
subcommittee of the council on nutrition, physical activity, and
metabolism; council on cardiovascular nursing; and council on
epidem. Circulation. 119:902–907. 2009. View Article : Google Scholar : PubMed/NCBI
|
|
52
|
Kohli P and Levy BD: Resolvins and
protectins: Mediating solutions to inflammation. Br J Pharmacol.
158:960–971. 2009. View Article : Google Scholar : PubMed/NCBI
|
|
53
|
Yamashita K, Higa M, Kunishita R, Kanazawa
K, Tasaki M, Doi A, Yoshifuji A, Ichijo T, Ouchi H and Hirose T:
Ayumi Yoshifuji, Takamasa Ichijo, Hiromi Ouchi and Takahisa Hirose:
Dihomo-gamma-linolenic acid levels and obesity in patients with
type 2 diabetes. Diabetol Int. 6:206–211. 2015. View Article : Google Scholar
|
|
54
|
Kurotani K, Sato M, Ejima Y, Nanri A, Yi
S, Pham NM, Akter S, Poudel-Tandukar K, Kimura Y, Imaizumi K, et
al: High levels of stearic acid, palmitoleic acid, and
dihomo-γ-linolenic acid and low levels of linoleic acid in serum
cholesterol ester are associated with high insulin resistance. Nutr
Res. 32:669–675.e3. 2012. View Article : Google Scholar
|
|
55
|
Greene ER, Huang S, Serhan CN and
Panigrahy D: Regulation of inflammation in cancer by eicosanoids.
Prostaglandins Other Lipid Mediat. 96:27–36. 2011. View Article : Google Scholar : PubMed/NCBI
|
|
56
|
Ito R, Satoh-Asahara N, Yamakage H, Sasaki
Y, Odori S, Kono S, Wada H, Suganami T, Ogawa Y, Hasegawa K, et al:
An increase in the EPA/AA ratio is associated with improved
arterial stiffness in obese patients with dyslipidemia. J
Atheroscler Thromb. 21:248–260. 2014. View Article : Google Scholar
|
|
57
|
Iwamatsu K, Abe S, Nishida H, Kageyama M,
Nasuno T, Sakuma M, Toyoda S and Inoue T: Which has the stronger
impact on coronary artery disease, eicosapentaenoic acid or
docosa-hexaenoic acid. Hypertens Res. 39:272–275. 2016. View Article : Google Scholar : PubMed/NCBI
|
|
58
|
Wakabayashi Y, Funayama H, Ugata Y,
Taniguchi Y, Hoshino H, Ako J and Momomura S: Low eicosapentaenoic
acid to arachidonic acid ratio is associated with thin-cap
fibroatheroma determined by optical coherence tomography. J
Cardiol. 66:482–488. 2015. View Article : Google Scholar : PubMed/NCBI
|
|
59
|
Qian F, Korat AA, Malik V and Hu FB:
Metabolic effects of monounsaturated fatty acid-enriched diets
compared with carbohydrate or polyunsaturated fatty acid-enriched
diets in patients with type 2 diabetes: A systematic review and
meta-analysis of randomized controlled trials. Diabetes Care.
39:1448–1457. 2016. View Article : Google Scholar : PubMed/NCBI
|
|
60
|
Schwertner HA and Mosser EL: Comparison of
lipid fatty acids on a concentration basis vs weight percentage
basis in patients with and without coronary artery disease or
diabetes. Clin Chem. 39:659–663. 1993.PubMed/NCBI
|
|
61
|
Lagerstedt SA, Hinrichs DR, Batt SM,
Magera MJ, Rinaldo P and McConnell JP: Quantitative determination
of plasma c8-c26 total fatty acids for the biochemical diagnosis of
nutritional and metabolic disorders. Mol Genet Metab. 73:38–45.
2001. View Article : Google Scholar : PubMed/NCBI
|
|
62
|
Poobalan A and Aucott L: Obesity among
young adults in developing countries: A systematic overview. Curr
Obes Rep. 5:2–13. 2016. View Article : Google Scholar : PubMed/NCBI
|
|
63
|
Li K, Brennan L, McNulty BA, Bloomfield
JF, Duff DJ, Devlin NF, Gibney MJ, Flynn A, Walton J and Nugent AP:
Plasma fatty acid patterns reflect dietary habits and metabolic
health: A cross-sectional study. Mol Nutr Food Res. 60:2043–2052.
2016. View Article : Google Scholar : PubMed/NCBI
|