Introduction
Hepatocyte nuclear factor 4 α (HNF-4α; also
known an nuclear receptor subfamily 2 group A member 1) is a
nuclear receptor and a major mediator of liver-specific gene
expression (1). HNF-1α
acts as a transcription factor that mediates hepatic genes, and
HNF-4α protein can regulate the expression of HNF-1α
(2,3). HNF-4α is critical for the
development of the kidney, liver and intestines (4). By regulating HNF-4α, nuclear
receptor subfamily 1 group H member 3 can promote the hepatic
differentiation of hepatocyte-like cells (5). HNF-4α also influences the
expression and synthesis of sex-hormone-binding globulin, a key
glycoprotein that is mainly produced by the liver (6,7).
WB-F344 cells, which originate from monoclonal epithelial cells of
the rat liver, are analogous to liver precursor cells (8,9).
WB-F344 cells acquire some phenotypic and functional
characteristics of hepatocytes when they are transplanted into the
liver (10,11). However, the roles and mechanisms
of action of HNF-4α on WB-F344 cell differentiation remain
to be fully elucidated.
Bone morphogenetic protein 4 (BMP4), belongs
to the transforming growth factor-β (TGF-β) superfamily. It
can promote the differentiation of WB-F344 cells to the hepa-tocyte
lineage (12). WB-F344 cells
cultured on Matrigel can differentiate to biliary cells, during
which the expression of Ras homolog family member A (RhoA)
is increased and the RhoA-Rho-associated protein kinase-stress
fiber system is essential (10,13). The canonical Wnt signaling pathway
has a positive effect on self-renewal and proliferation of rat
WB-F344 cells (14). Through
suppression of the Hes family bHLH transcription factor 1 signaling
pathway, matrine (an alkaloid constituent of plants in the genus
Sophora) can stimulate the differentiation of WB-F344 cells
into hepatocytes (11).
Although the above studies have reported that
several genes are correlated with the hepatic differentiation of
WB-F344 cells, the mechanism of action of HNF-4α on WB-F344
cell differentiation remains to be elucidated. To address this gap
in knowledge, the present study experimentally investigated the
roles of HNF-4α on WB-F344 cells and examined the potential
mechanisms of action using comprehensive bioinformatics
analyses.
Materials and methods
Vector construction
The WB-F344 cells were purchased from Shanghai
Bioleaf Biotech Co., Ltd. (Shanghai, China). Full-length
HNF-4α was synthesized from the cDNA of WB-F344 cells using
the forward primer 5'-CCG GGC TGC AGA TCG ATG ATA ATG ATC AAG AGA
TCA TTA TCA TCG ATC TGC AGC TTT TTG GAT CC-3' and the reverse
primer 3'-CGA CGT CTA GCT ACT ATT ACT AGT TCT CTA GTA ATA GTA GCT
AGA CGT CGA AAA ACC TAG GTT AA-5'. The HNF-4α fragment was
inserted into the AgeI and EcoRI sites of the
pLKO.1-EGFP-Puro vector (Takara Bio, Inc., Otsu, Japan) to
construct the recombinant plasmid. The recombinant plasmids were
amplified, purified, and finally verified by agarose gel
electrophoresis and DNA sequencing.
Virus packaging and the identification of
stably transfected WB-F344 cells
The cells were digested in pancreatin and plated in
culture dishes (60×15 mm, 2.5×10⁶ cells/dish). Following
growth to 80% confluence in Dulbecco's modified Eagle medium (DMEM;
Gibco; Thermo Fisher Scientific, Inc., Waltham, MA, USA) in a
humidified 5% CO2 incubator (Thermo Fisher Scientific,
Inc.), the cells were used for transfection experiments. Into tube
1 4 µg pCDH plasmid/recombinant plasmid, 3 µg psPAX2,
and 2 µg pMD2.G were dissolved in 600 µl opti-MEM and
were placed at room temperature for 5 min following gentle mixing.
In tube 2, 600 µl serum-free medium was mixed with 20
µl Lipofectamine 2000 (Thermo Fisher Scientific, Inc.) and
left at room temperature for 5 min. The solutions in tubes 1 and 2
were mixed again and left for 20 min. The mixture was cultured in a
humidified 5% CO2 incubator (Thermo Fisher Scientific,
Inc.) at 37˚C and the medium was replaced with complete medium
after 6 h. Following culture for 48 h, the supernatant was
collected in a 15-ml centrifuge tube and maintained at 4˚C.
Subsequently, the supernatant was added to 4 ml complete medium and
cultured in an incubator for 24 h. The supernatant was transferred
into a 15-ml centrifuge tube and mixed with the virus suspension
collected the previous day. The virus suspension was
concentrated.
The cells were spread on medium in 12-well plates
and cultured at 37˚C overnight. The original medium was replaced
with a half-volume of fresh medium, and the virus solution was
mixed with the cells. Following infection at 37˚C for 4 h, the
medium was supplemented to the normal volume. The medium containing
the virus was replaced with fresh medium on the second day
following infection, and cultivation of the cells was continued at
37˚C. Following infection for 48 h, fluorescence microscopy
examination (Olympus Corporation, Tokyo, Japan) was used to detect
viruses harboring the green fluorescent protein (GFP)
reporter gene to observe the expression efficiency of GFP.
For the viruses carrying the puromycin resistance gene, the medium
was replaced with fresh medium containing an appropriate
concentration of puromycin to identify the stably transfected
cells.
Reverse transcription-quantitative
polymerase chain reaction (RT-qPCR) analysis
Total RNA was extracted using RNAiso Plus (Takara
Bio, Inc.) according to the manufacturer's protocol. The density
and purity of RNA were measured by spectrophotometry (Merinton,
Beijing, China). Total RNA was reverse transcribed into cDNA using
PrimeScript™ RT Master mix (Takara Bio, Inc.). The primer sequences
for the RT-qPCR experiments were produced by Sangon Biotech Co.,
Ltd. (Shanghai, China) and are listed in Table I. Using the SYBR Green master mix
kit (Applied Biosystems; Thermo Fisher Scientific, Inc.), RT-qPCR
amplification was performed using the following amplification
system: 10 µl SYBR Premix Ex Taq (2X), 2 µl cDNA
template, 0.4 µl forward primer, 0.4 µl reverse
primer, and RNase-free distilled water up to 20 µl. The
reaction processes were as follows: 95°C for 10 min; 95°C for 15
sec and 60°C for 1 min for 40 cycles. The subsequent melting
processes were 95°C for 15 sec, 60°C for 1 min, and 95°C for 15
sec. All samples had three repeats, with actin as the reference
gene. The relative gene expression was calculated using the
2−ΔΔCq method (15).
 | Table IPrimer sequences used for reverse
transcription- quantitative polymerase chain reaction analysis. |
Table I
Primer sequences used for reverse
transcription- quantitative polymerase chain reaction analysis.
| Primer name | Primer sequence
(5'-3') |
|---|
| HNF-4α-F |
CAGTATGACTCTCGGGGTCGTTTTG |
| HNF-4α-R |
CCATGCCAAAGAGCTTGATGAACTG |
| Actin-F |
CCCATCTATGAGGGTTACGC |
| Actin-R |
TTTAATGTCACGCGATTTC |
Cell Counting kit-8 (CCK-8) assay
Following culture of the cells for 12, 24 and 48 h,
they were digested to prepare the cell suspension
(1.5×10⁵ cells/ml). Subsequently, 100 µl of each
cell suspension was inoculated into 96-well plates (ABI; Thermo
Fisher Scientific, Inc.; 1.5×10⁴ cells/well). The cells
were divided into the WB-F344 normal cell group (WB-F344), empty
vector control group (PLKO), and gene silencing group (PLKO-SH).
Each group had three replicate wells. The 96-well plates were
cultured in an incubator (Thermo Fisher Scientific, Inc.) for 0, 24
and 48 h, following which 10 ml CCK-8 solution (Tongren, Shanghai,
China) was added. The plates were incubated in an incubator (Thermo
Fisher Scientific, Inc.) for 1.5 h. Using a microplate reader
(BioTek Instruments, Inc., Winooski, VT, USA), the absorbance of
each well at an optical density of 450 nm was detected. The
absorbance value with time was plotted.
Western blot analysis
The cells were lysed in radioimmunoprecipitation
assay lysis buffer (Beyotime Institute of Biotechnology, Shanghai,
China) on ice for 30 min. The lysates were centrifuged at low
temperature (4°C, 12,000 × g, 15 min) and the supernatants were
transferred to sterile centrifuge tubes. Protein concentrations
were measured using a bicinchoninic acid protein assay kit (Sangon
Biotech Co., Ltd., Shanghai, China). The cell lysates (15 µl
each hole) were used for SDS-PAGE on 10% polyacrylamide and
resolved proteins were transferred onto a polyvinylidene fluoride
membrane (Merck KGaA, Darmstadt, Germany). The membranes were
blocked in 5% skim milk (0.75 g milk powder in 15 ml phosphate
buffered saline) at 37°C for 1-2 h, following which they were
incubated at 4°C overnight with the primary antibodies (ProteinTech
Group, Inc., Chicago, IL, USA). The primary antibodies included
albumin (ALB; cat. no. 16475-1-AP; 1:2,000), α-fetoprotein (AFP;
cat. no. 14550-1-AP; 1:1,000), and cytokeratin 19 (CK-19; cat. no.
10712-1-AP; 1:500). The membranes were incubated with horseradish
peroxidase-labeled goat anti-rabbit secondary antibody (1:1,000;
Beyotime Institute of Biotechnology; cat. no. A0208) at 37°C for 2
h. The blots were developed using ECL detection reagent, and a gel
imaging analysis system (Bio-Rad Laboratories Inc., Richmond, CA,
USA) was utilized to detect the results.
Periodic acid-Schiff (PAS) staining
The slides of cells were prepared and PAS staining
was performed using PAS/Glycogen Stain kit (Nanjing Jiancheng
Bioengineering Institute, Nanjing, China). The cells were incubated
with reagent 1 at room temperature for 10 min and washed with tap
water for 3-5 min. They were then incubated with reagent 2 at room
temperature for 10-15 min and rinsed for 30-60 sec. Counterstaining
was performed with reagent 3 for 20-30 sec. Following rinsing in
tap water, the slides were covered and observed using an inverted
microscope (Olympus Corporation).
RNA extraction and RNA-seq library
construction
Total RNA of the three HNF-4α-silenced
WB-F344 cells and three normal WB-F344 cells were extracted using
TRIzol reagent (Takara Bio, Inc.) and measured using a Nanodrop
spectrophotometer. An RNA-seq library was constructed with
sequencing performed separately using a NEBNext® Ultra™
RNA Library Prep kit (New England Biolabs, Inc., Ipswich, MA, USA)
and a Hiseq 4000 system, (PE150; Illumina, Inc., San Diego, CA,
USA). The sequencing data were deposited into the Sequence Read
Archive database (http://www.ncbi.nlm.nih.gov/sra/), under accession no.
SRP135721.
Differential expression and enrichment
analyses
To filter out unreliable bases and reads, the raw
data were quality control analyzed. The barcode and adaptor
sequences were removed from the reads. Subsequently, any reads with
>5% of N content were eliminated. Bases with continuous quality
<10 were eliminated from the 5' or 3' end. The low-quality
reads, in which the number of the bases with quality <20
exceeded 20%, and the short reads, which had a length <30 nt,
were filtered out. These steps allowed the acquisition of clean
reads of the six samples. Using Tophat software (version 2.0.8,
with default parameters; http://www.ccb.jhu.edu/software/tophat/) (16), the clear reads were mapped to the
rat reference genome downloaded from the Ensembl database (version
6.0; http://www.ensembl.org/) (17). Based on the rat gene annotation
information in the Ensembl database, the raw reads corresponding to
each gene were obtained using the Htseq-count tool (version
0.6.1p2; http://www-huber.embl.de/users/anders/HTSeq/doc/count.html)
(18).
Using trimmed mean of M values normalization in the
R package edgeR (http://www.bioconductor.org/packages/release/bioc/html/edgeR.html)
(19,20), the read count data of gene
expression were preprocessed. Subsequently, the preprocessed data
were converted into gene expression matrices using the voom method
(21) in the R package limma
(http://www.bioconductor.org/packages/release/bioc/html/limma.html)
(22). Differential expression
analysis was performed using the linear model method in the limma
package (22) and the significant
P-values were calculated via moderated t-statistics (23). Differentially expressed genes
(DEGs) were defined as genes with P<0.05 and
|log2fold change (FC)|≥0.58. Using the DAVID tool
(version 6.8, https://david.ncifcrf.gov/) (24). Gene Ontology (GO; http://www.geneontology.org) functional terms
(25) and Kyoto Encyclopedia of
Genes and Genomes (https://www.genome.jp/kegg/pathway.html) pathways
(26) were enriched for the DEGs.
A count of genes in each term ≥2 and P<0.05 were taken as the
thresholds for selecting significant results.
Protein-protein interaction (PPI) network
and microRNA (miRNA)-target regulatory network analyses
Using the STRING database (version 10.0, https://string-db.org) (27), the interactions among the proteins
encoded by the DEGs were predicted. The parameter PPI score was set
at 0.4. The PPI network was constructed based on Cytoscape software
(version 3.4.0, http://www.cytoscape.org) (28). Using the CytoNCA plug-in
(http://apps.cytoscape.org/apps/cytonca) (29) in the software, the importance of
the network nodes were analyzed combined with the Degree centrality
(DC) (30), Betweenness
centrality (BC) (31), and
Closeness centrality (CC) (32).
Nodes with higher scores were considered key nodes in the PPI
network.
Based on the Webgestalt tool (http://www.webgestalt.org) (33), miRNAs targeting the PPI network
nodes were predicted. P<0.05 and a count of target genes ≥4 were
defined as the thresholds. Finally, the miRNA-target regulatory
network was visualized in Cytoscape software (28).
Statistical analysis
Based on GraphPad Prism software (version 5.0;
GraphPad Software, Inc., San Diego, CA, USA), statistical analysis
was performed using one-way analysis of variance with a two-tailed
t-test and Bonferroni post hoc test. All data are presented as the
mean ± standard error of the mean. P<0.05 was considered to
indicate a statistically significant difference.
Results
HNF-4α promotes the differentiation of
WB-F344 cells into hepatocytes
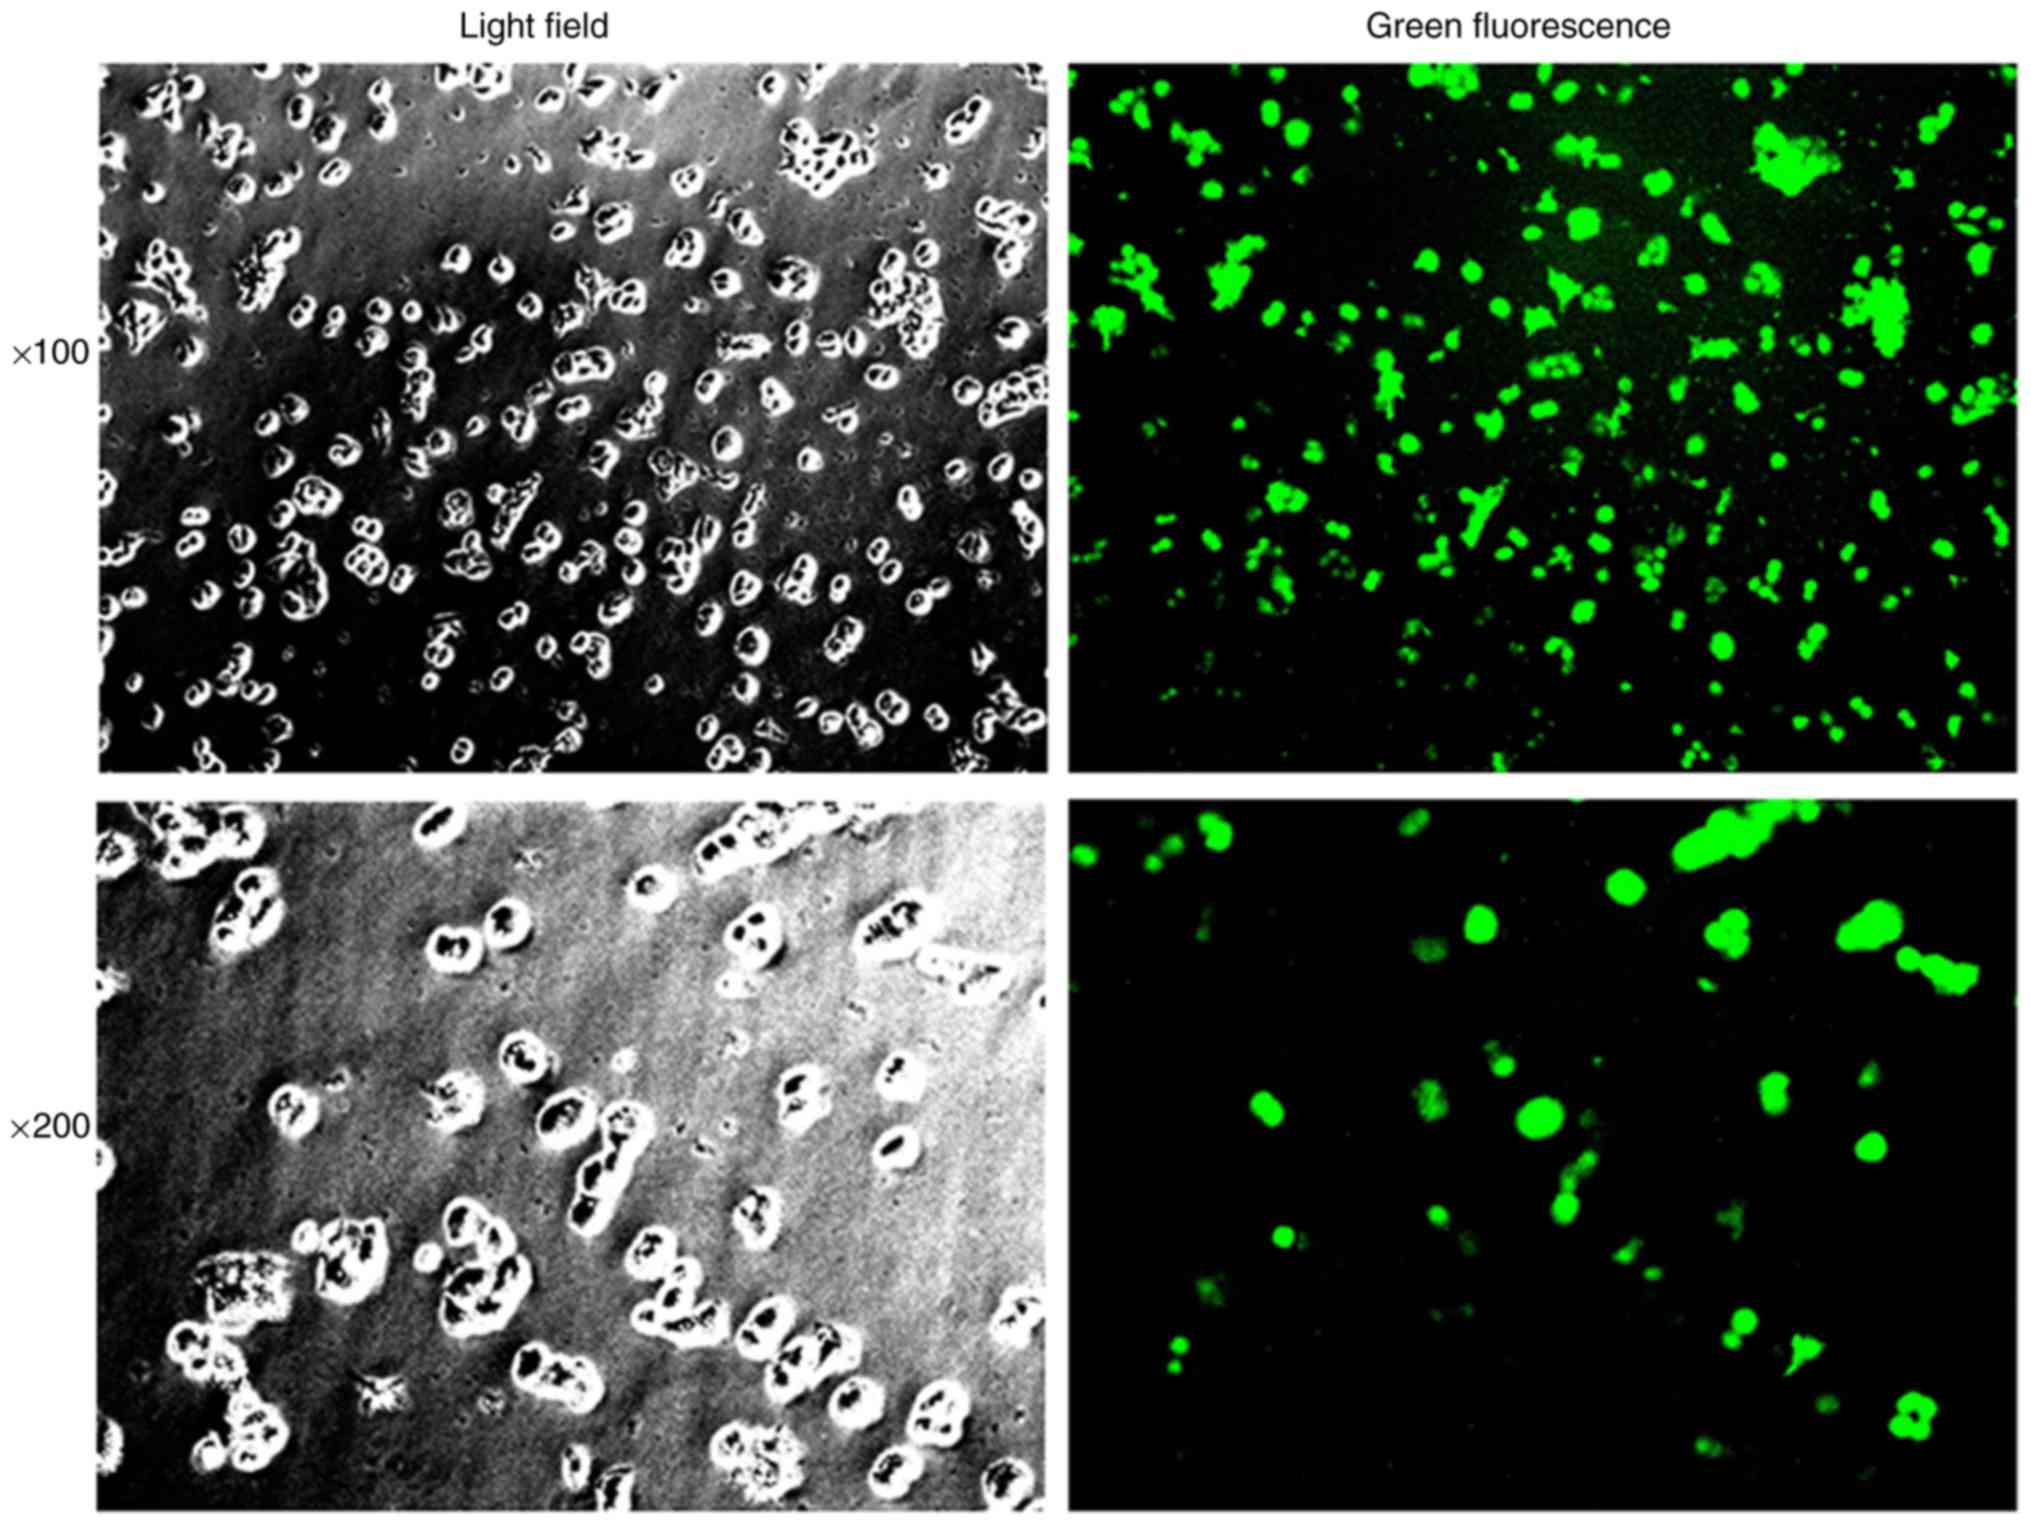
Following transfection of the WB-F344 cells with the
packaged virus, >95% of the cells expressed GFP protein
(Fig. 1). This infection
efficiency of >95% indicated that the stably transfected WB-F344
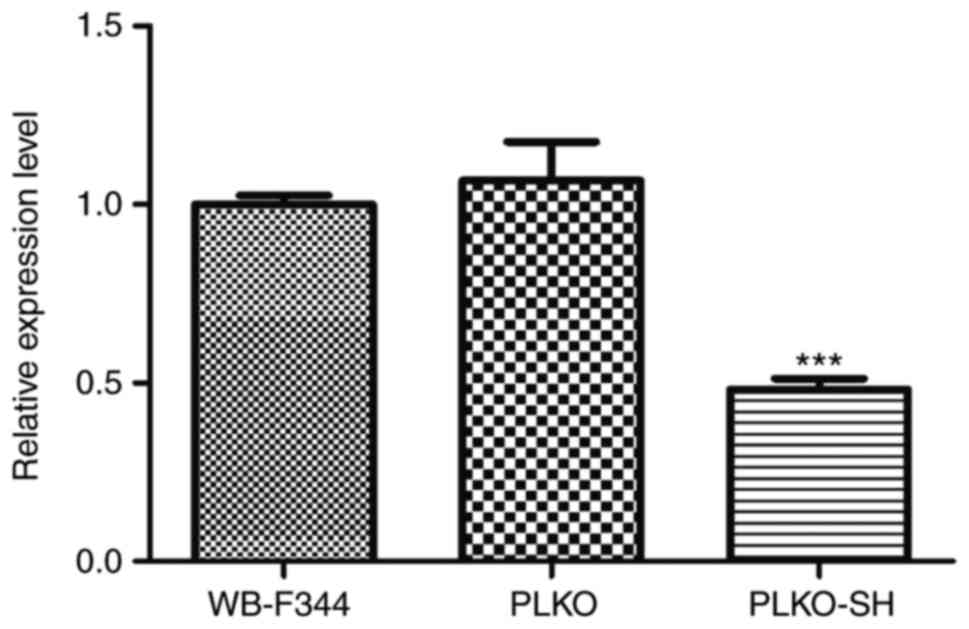
cells were suitable for used in subsequent experiments. Compared
with the WB-F344 and PLKO groups, HNF-4α was significantly
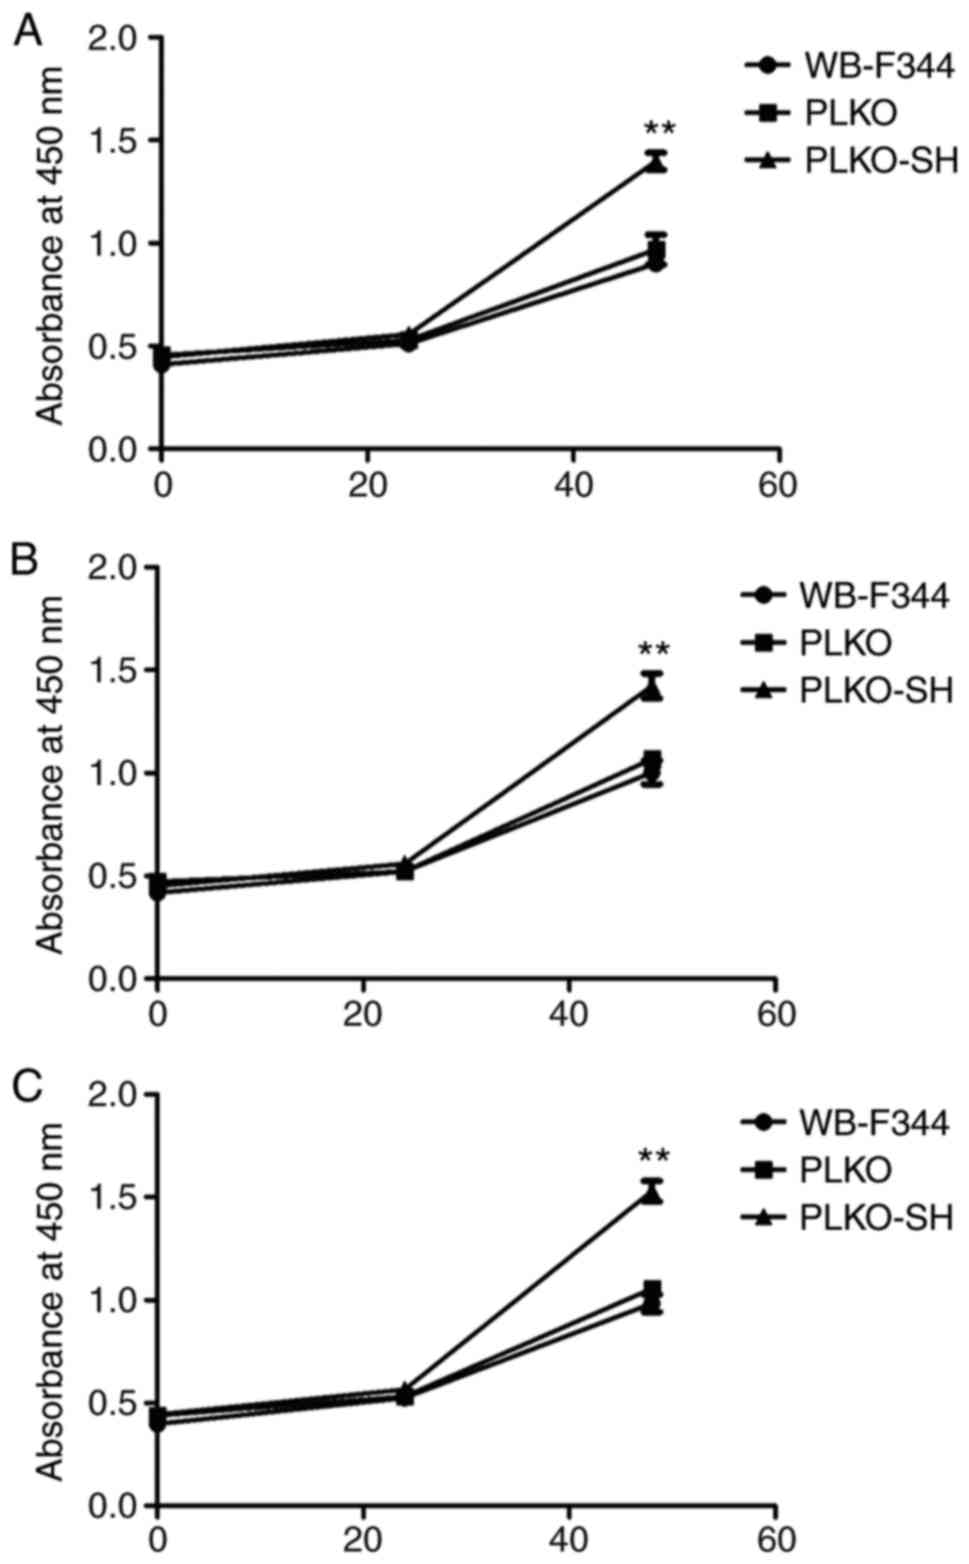
downregulated in the PLKO-SH group (P<0.0001, Fig. 2). The CCK-8 assay indicated that
the proliferation of cells in the PLKO-SH group was increased
relative to those in the WB-F344 and PLKO groups (Fig. 3A-C). Cells in the PLKO-SH group
exhibited higher protein levels of AFP and lower protein levels of
ALB and CK19 compared with cells in the WB-F344 and PLKO groups
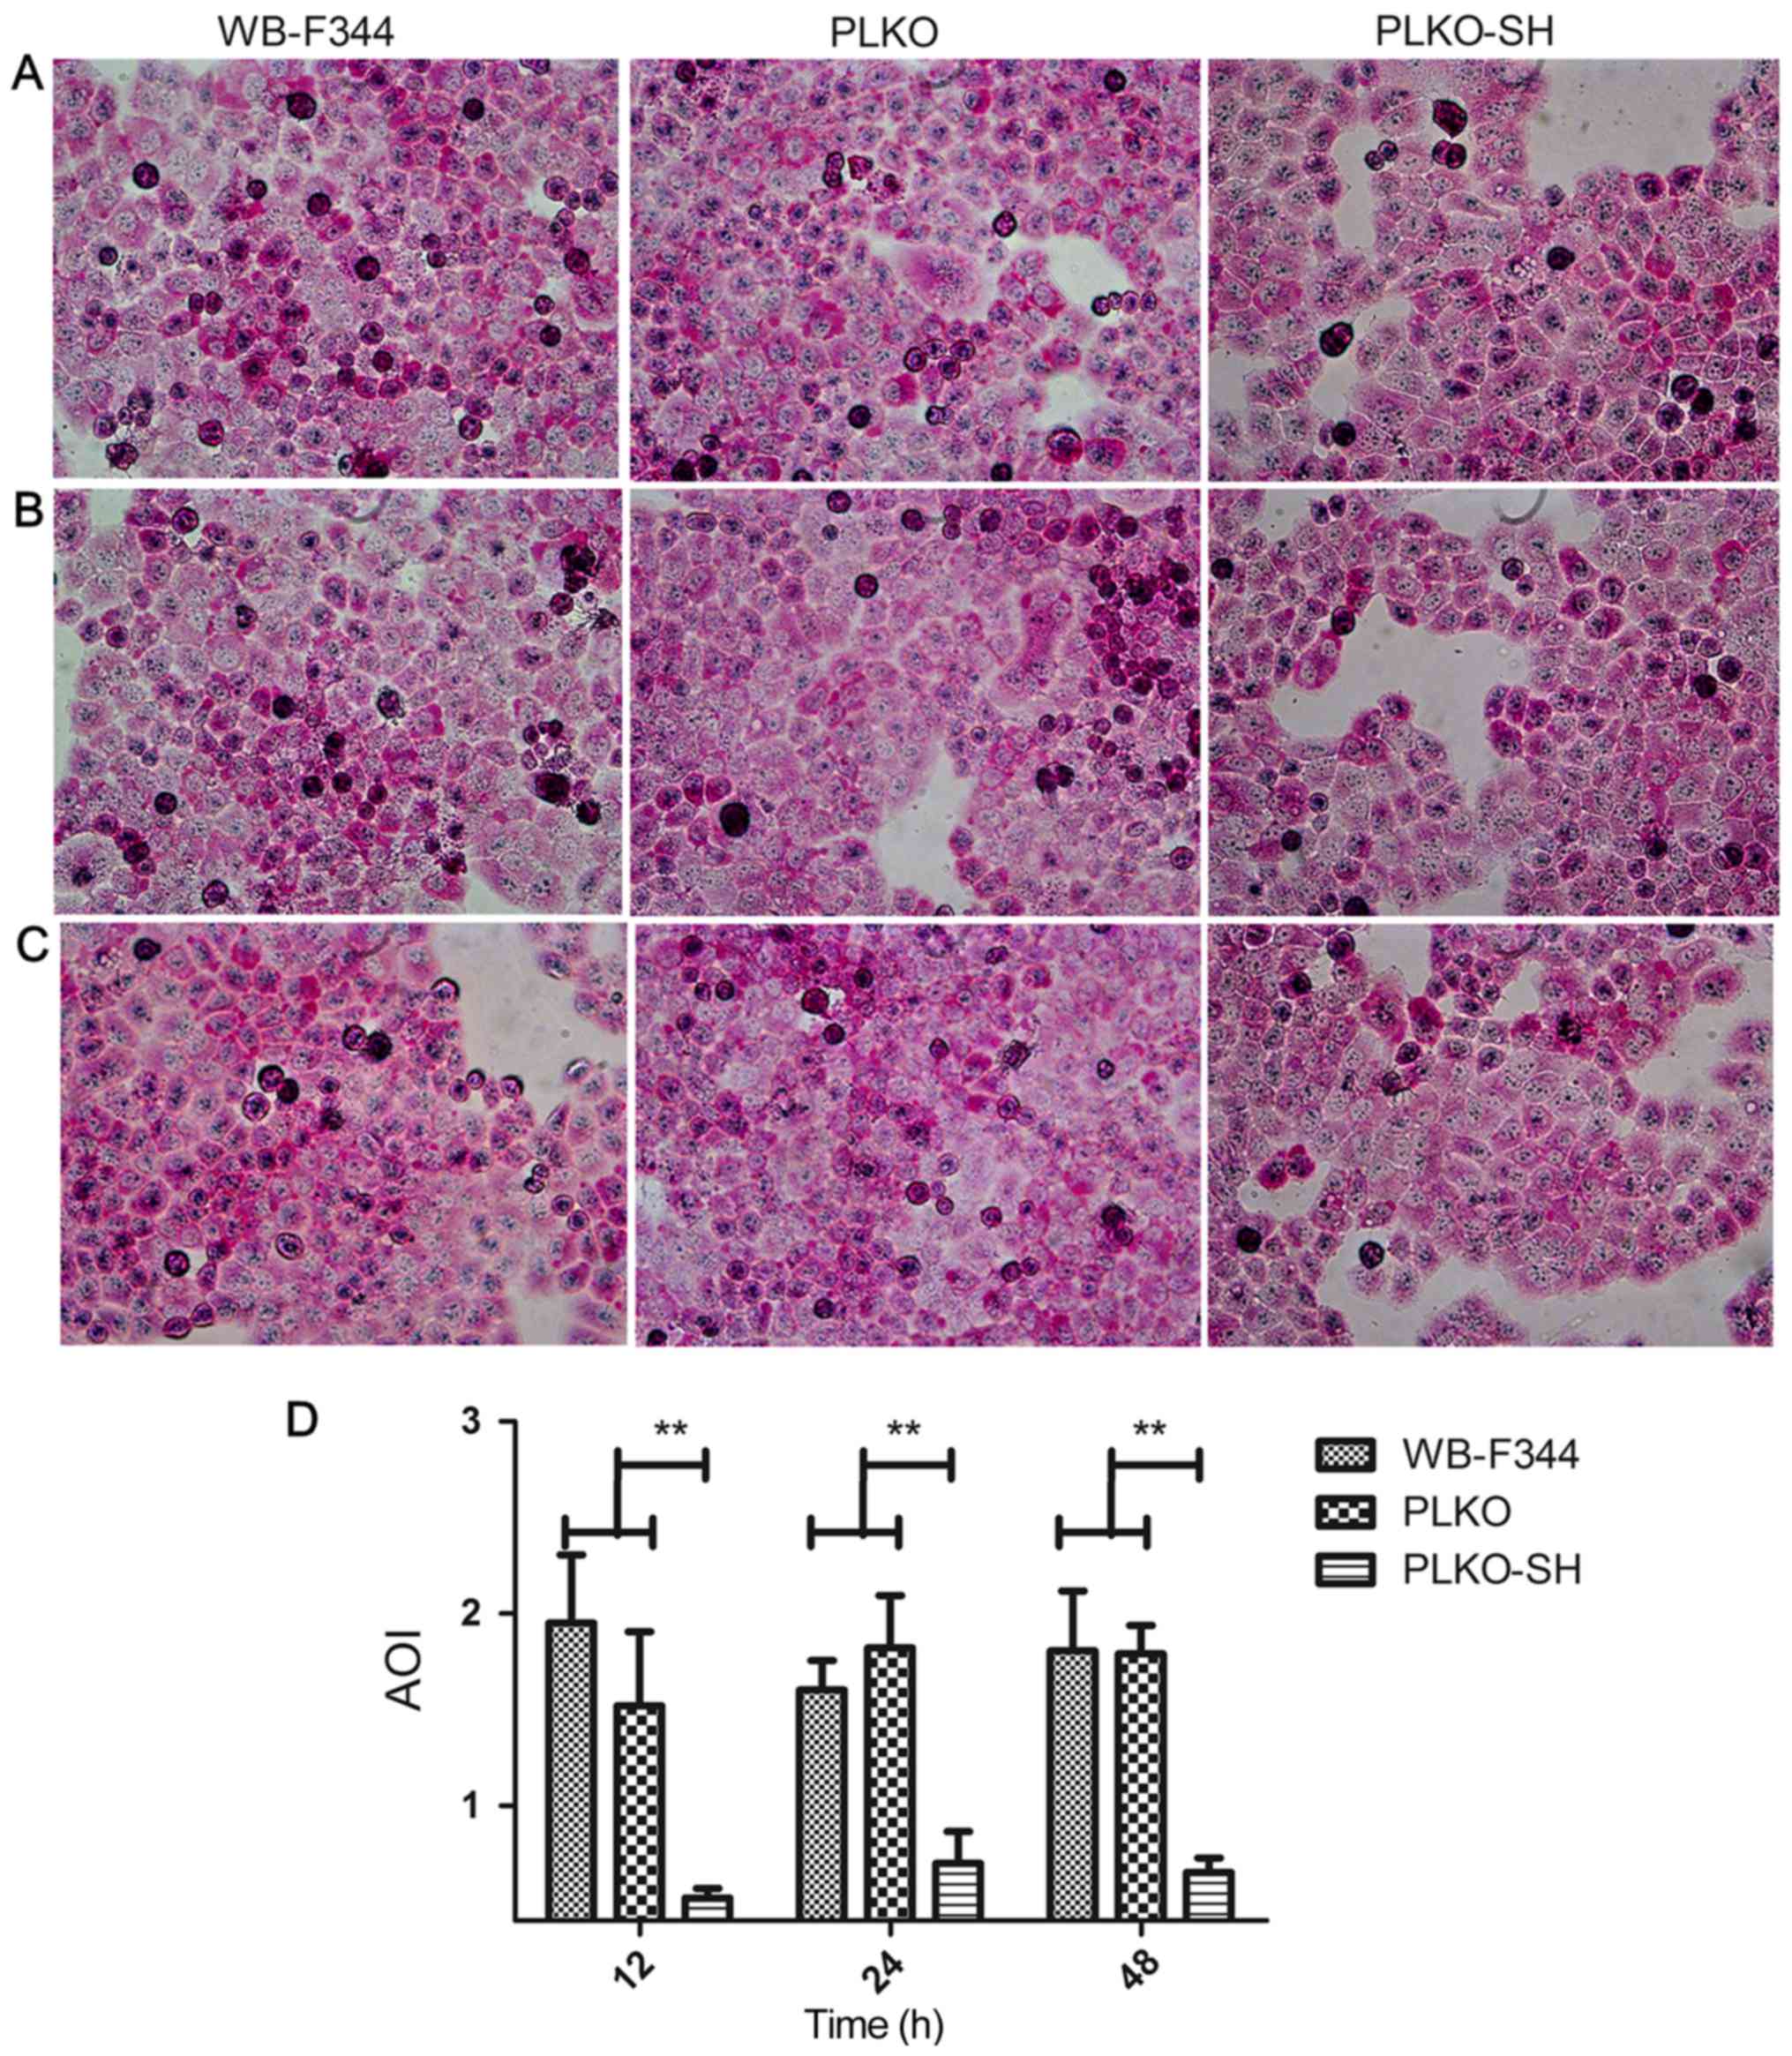
(Fig. 4A-C). PAS staining
indicated that the rate of positive cells in the PLKO-SH group was
lower than the rate in the WB-F344 and PLKO groups (Fig. 5A-D). These results demonstrated
that HNF-4α contributed to the hepatocyte differentiation of
WB-F344 cells.
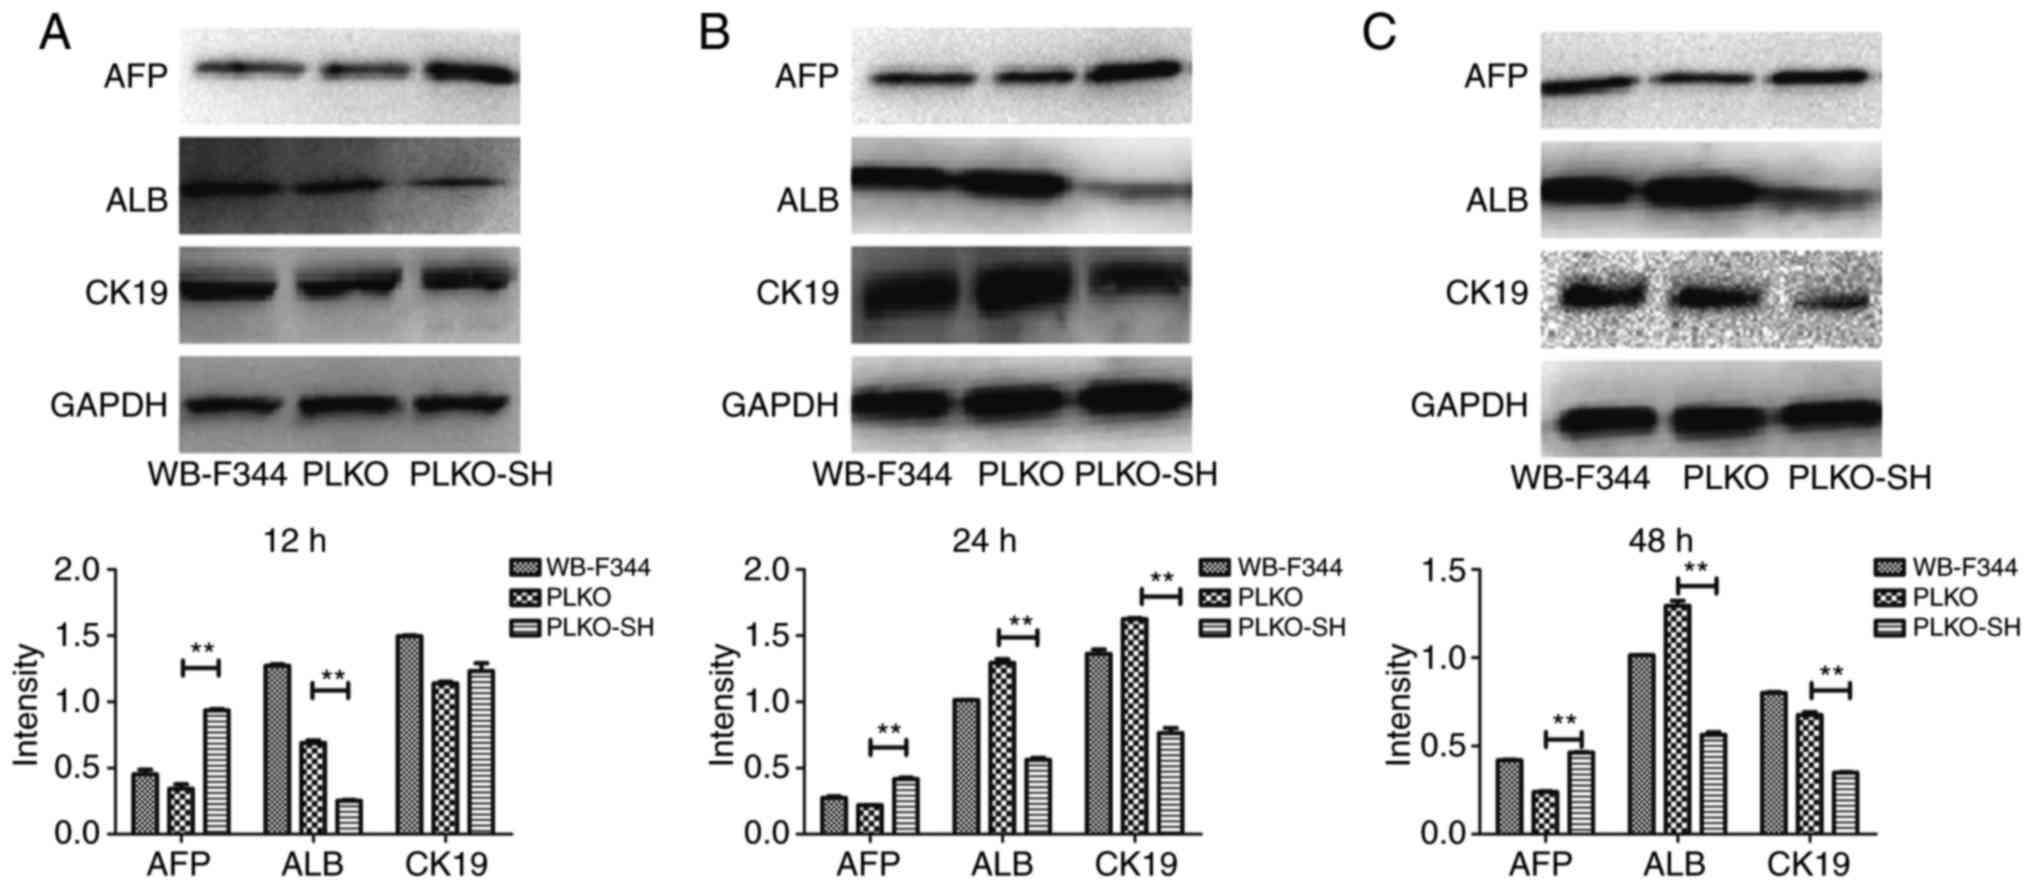 | Figure 4Protein expression levels of AFP,
ALB, CK19 and GAPDH. Protein levels were determined in different
groups of cells following culture for (A) 12 h, (B) 24 h and (C) 48
h. **P<0.01, compared with the WB-F344 and PLKO
groups. WB-F344, normal cell group; PLKO, empty vector control
group; PLKO-SH, gene silencing group; AFP, α-fetoprotein; ALB,
albumin; CK19, cytokeratin 19; GAPDH, glyceraldehyde-3-phosphate
dehydrogenase. |
Differential expression and enrichment
analyses
There were 499 DEGs (305 upregulated and 194
downregulated) in the HNF-4α-silenced samples compared with
the normal samples. The top five terms enriched for the upregulated
genes and the downregulated genes are presented in Table IIA and B,
respectively. The upregulated genes were mainly involved in
response to drug (GO term) and chemical carcinogenesis (pathway).
The downregulated genes were implicated in angiogenesis (GO term)
and protein processing in the endoplasmic reticulum (pathway).
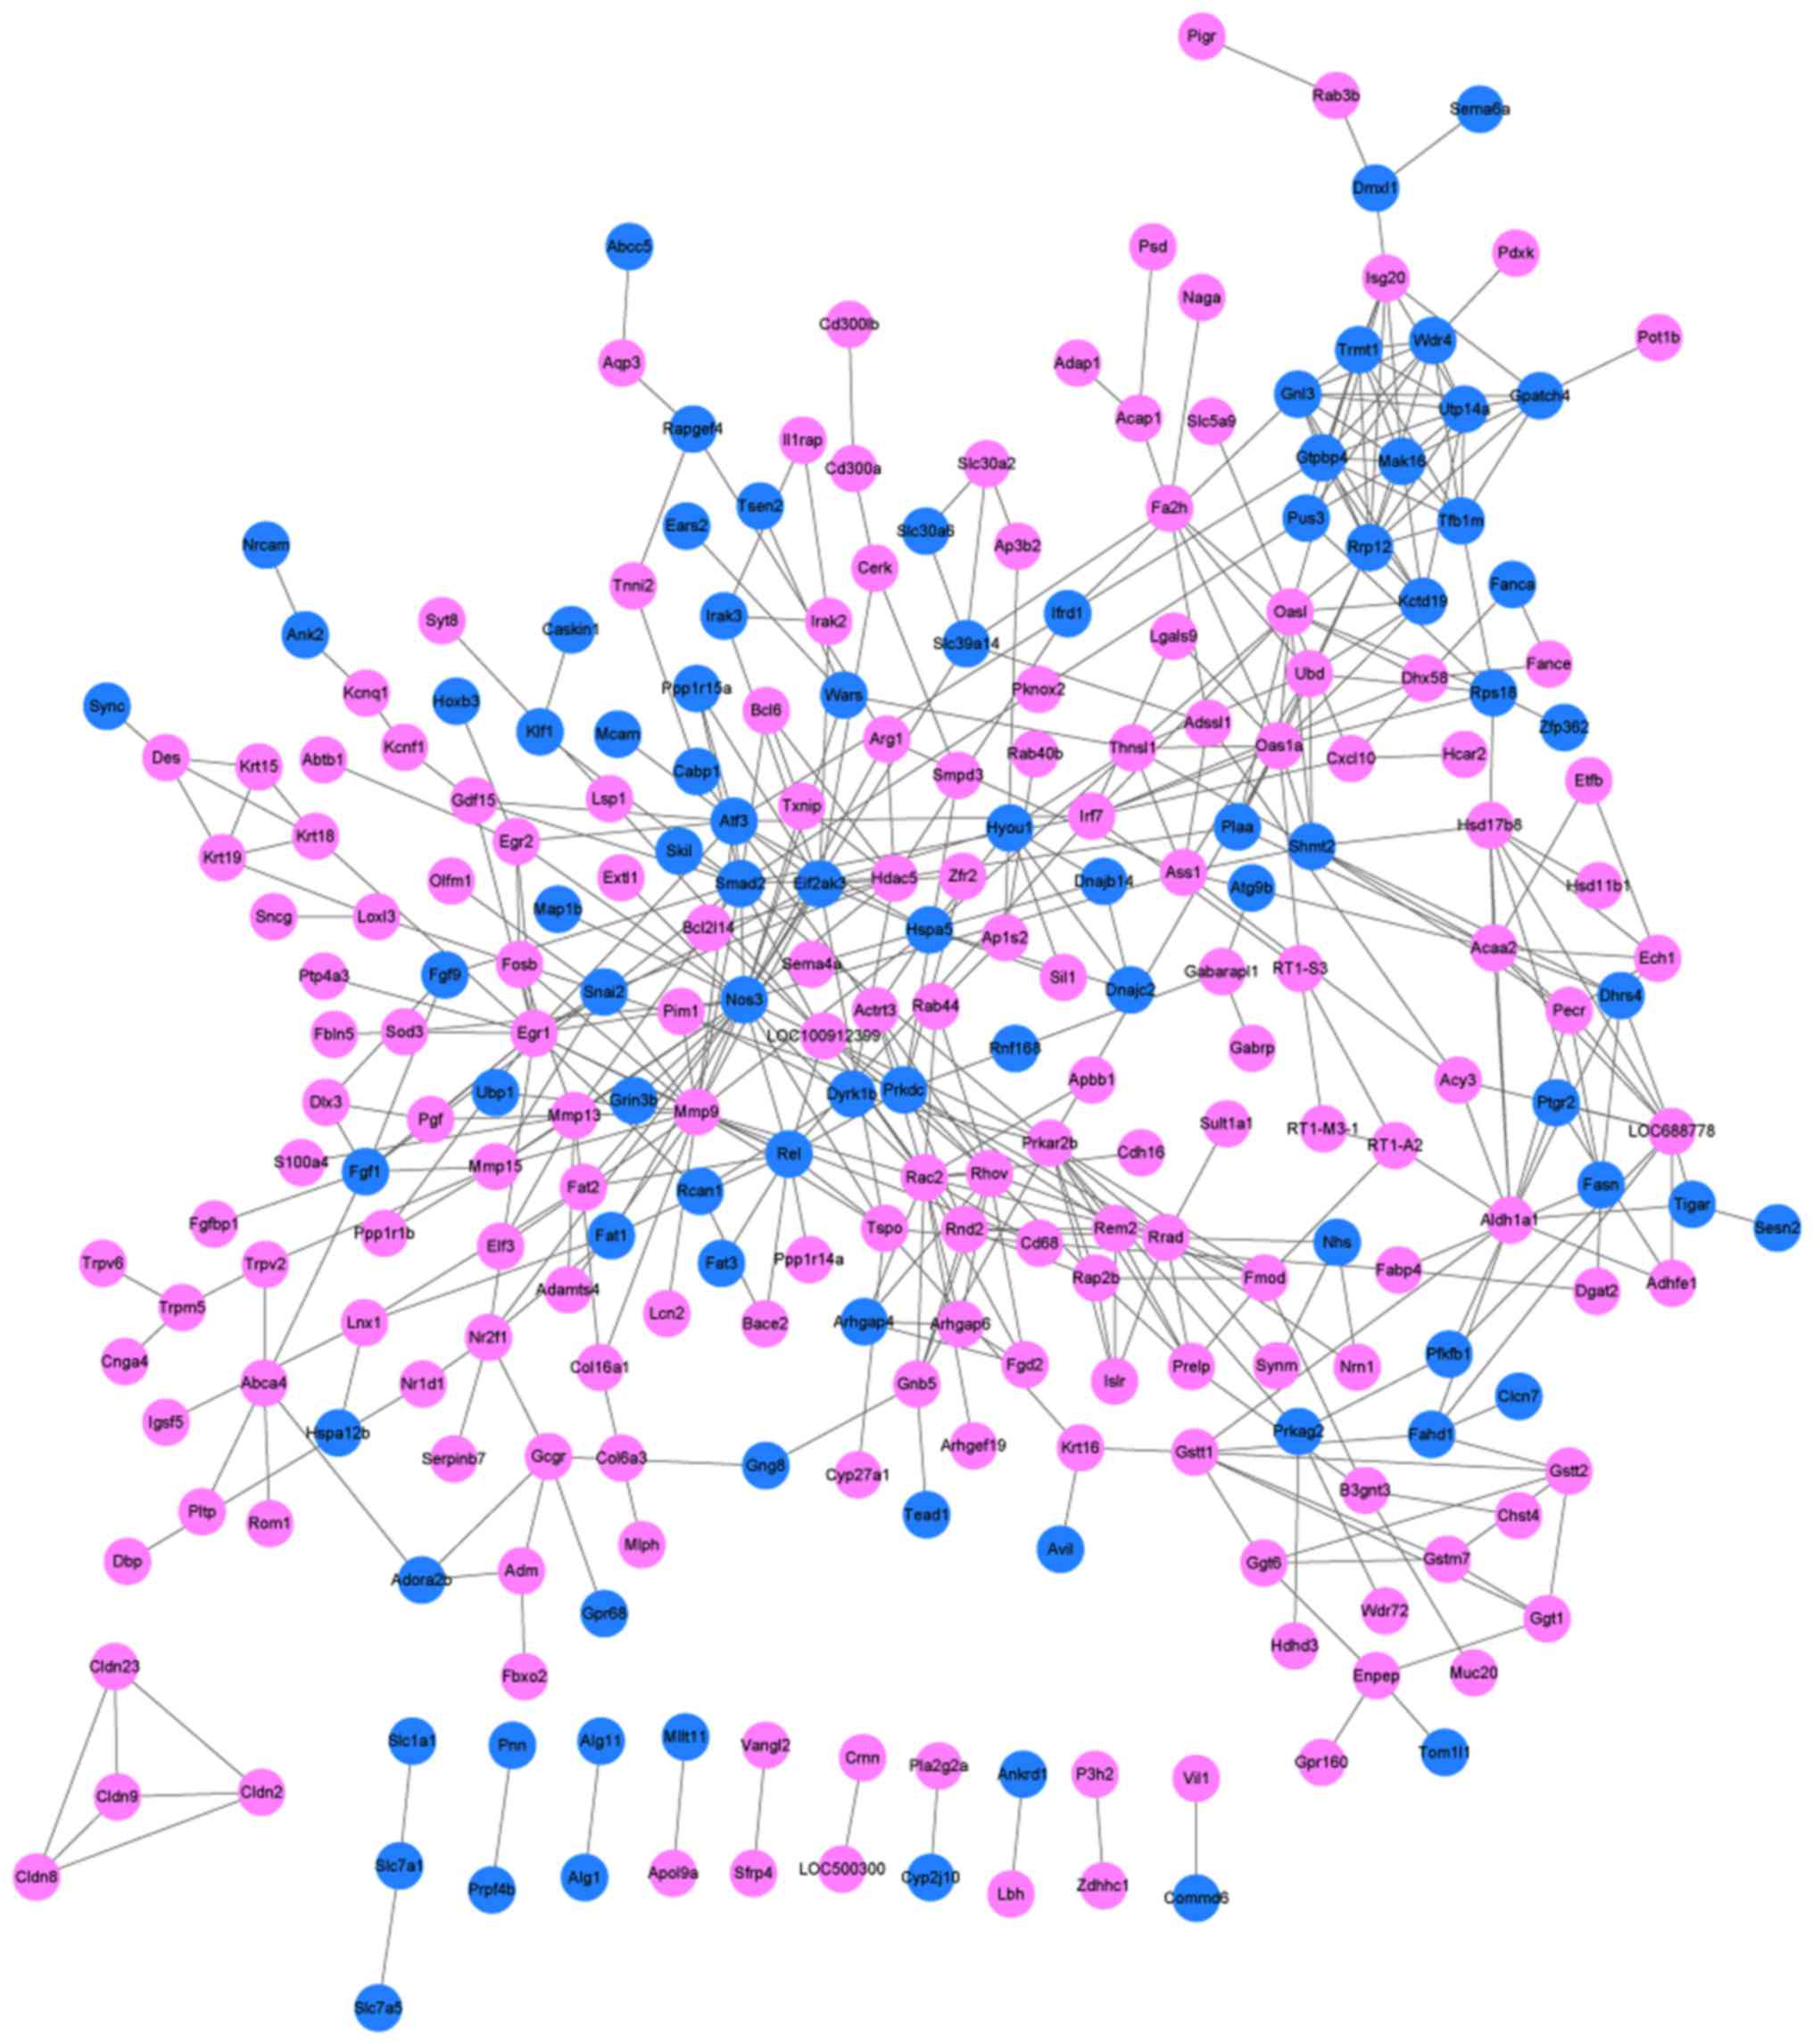
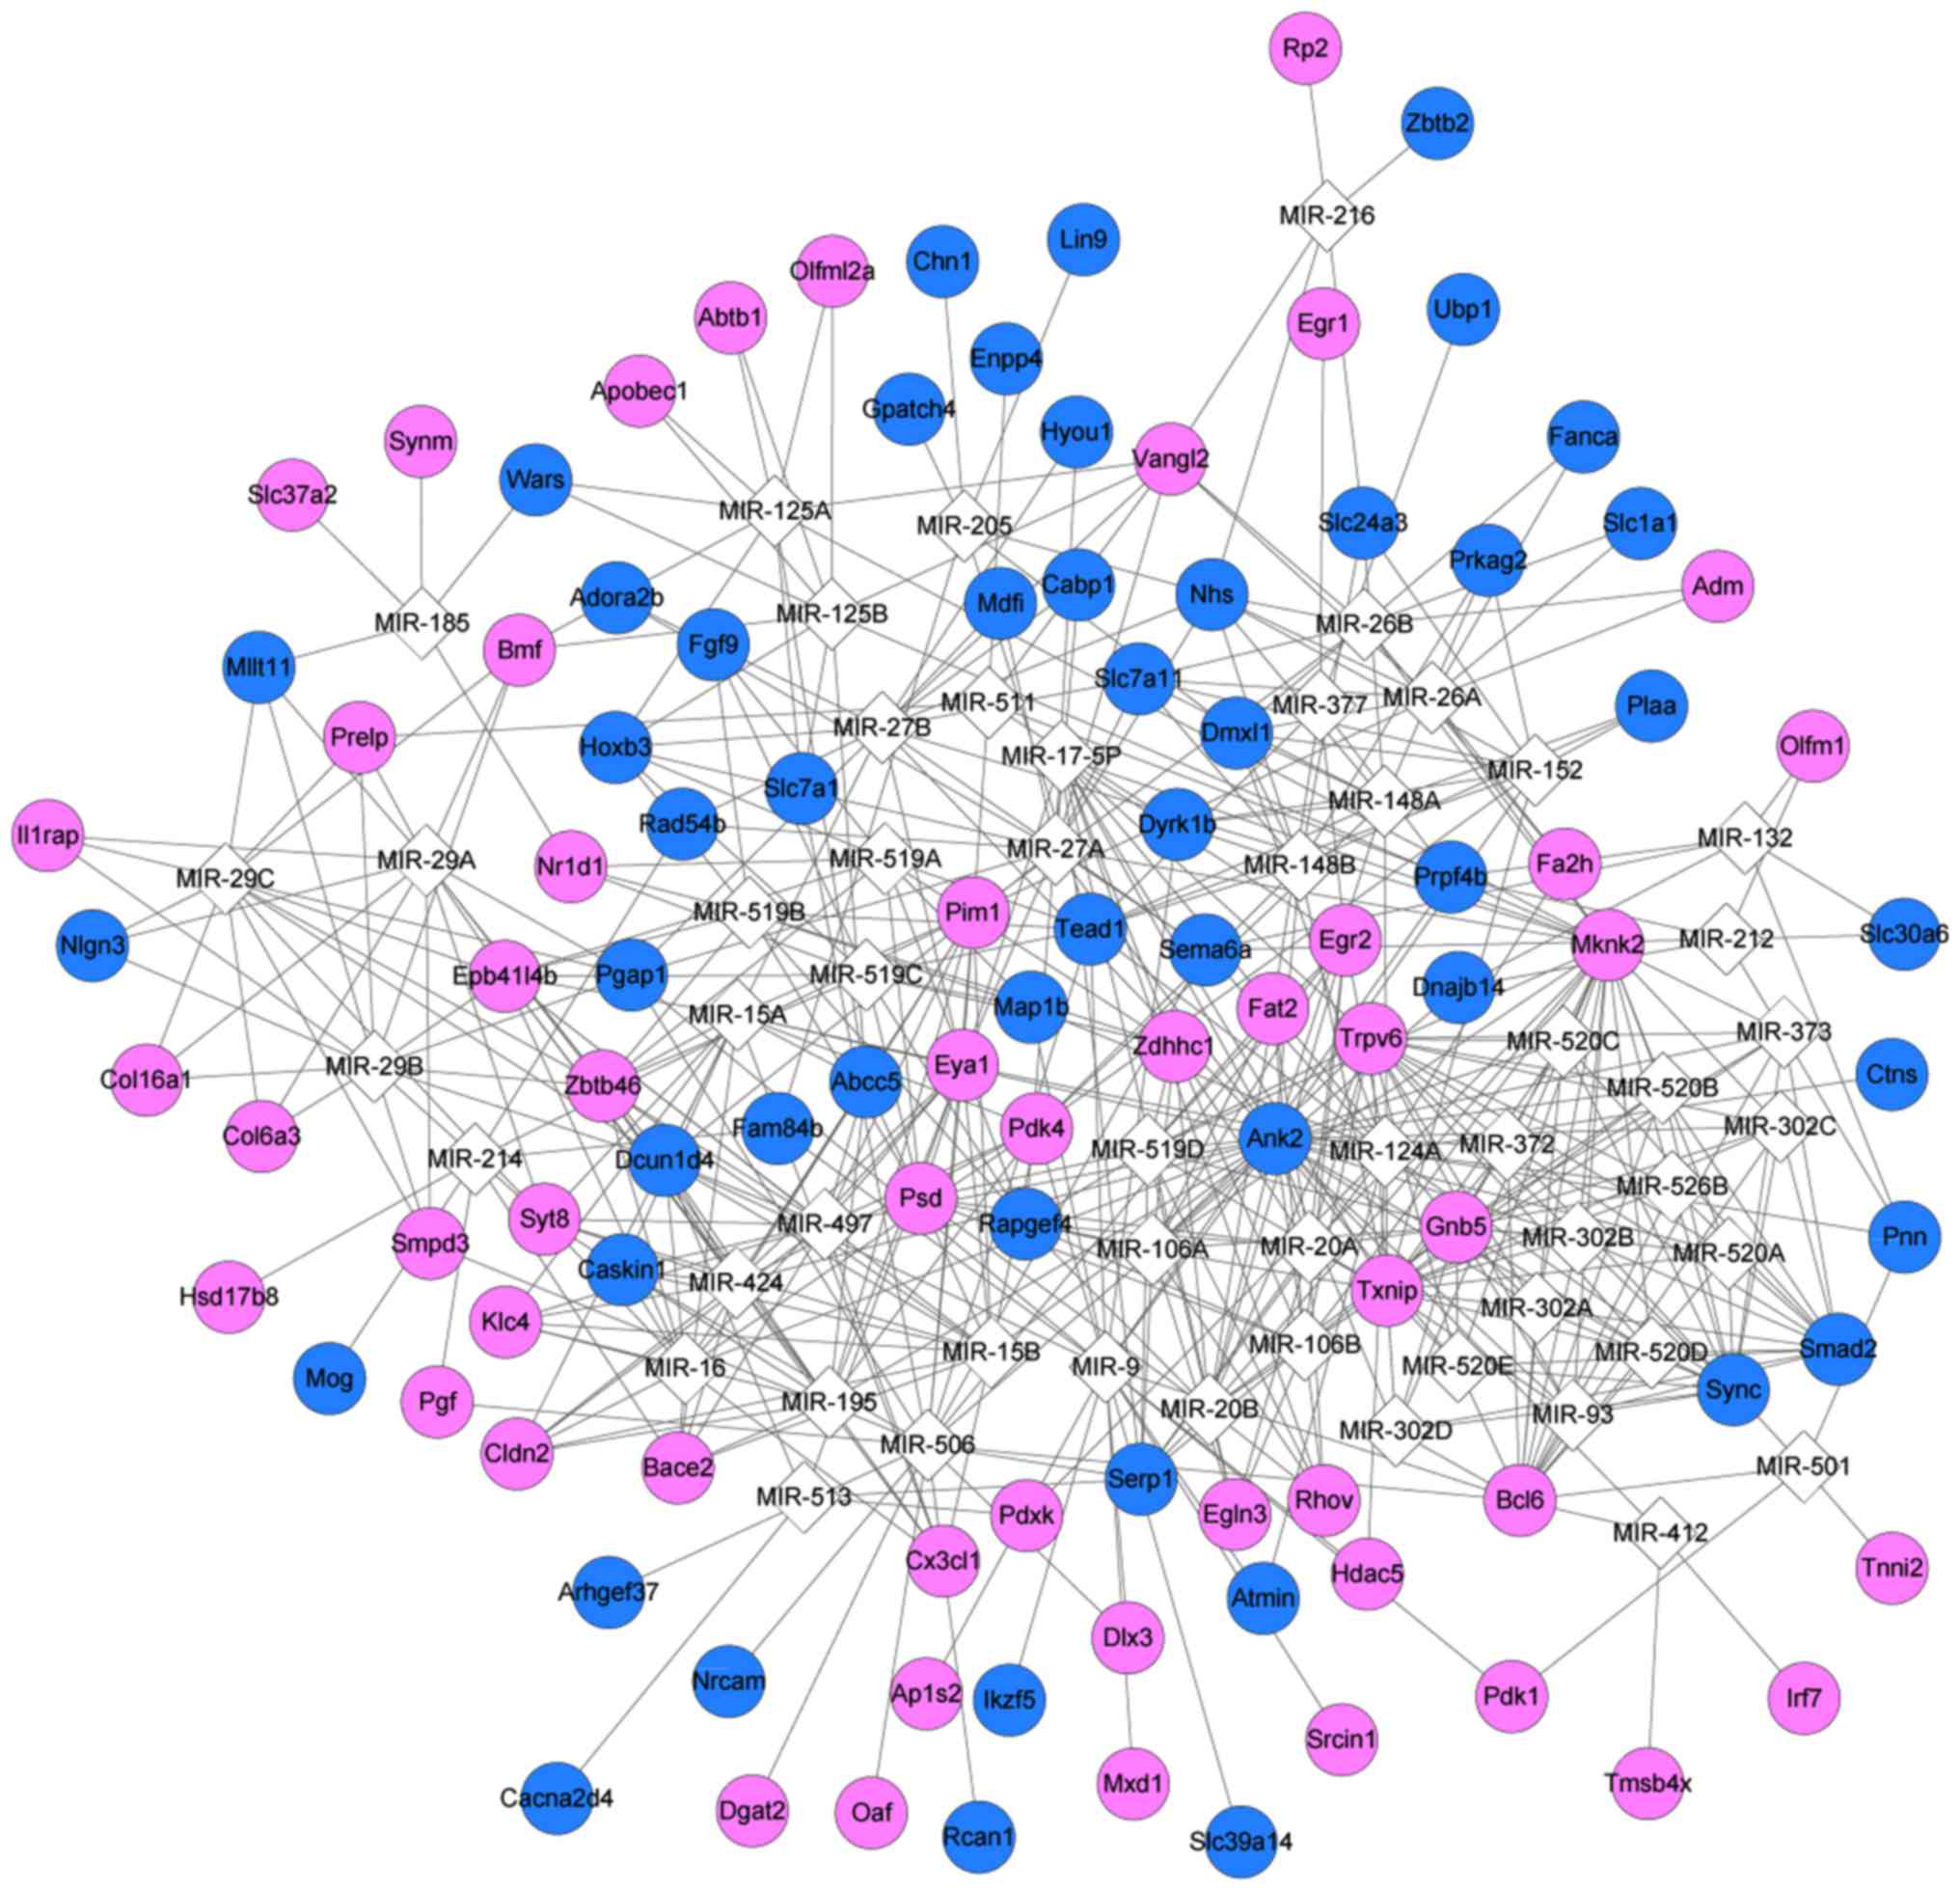
PPI network and miRNA-target regulatory
network analyses
The PPI network had 255 nodes and 485 edges
(Fig. 6). According to the BC, CC
and DC scores, matrix metallopeptidase 9 (MMP9), early growth
response 1 (EGR1), SMAD family member 2 (SMAD2), and RAS-related C3
botulinum substrate 2 (RAC2) were among the top 15 nodes (Table III). Enrichment analysis for the
nine key nodes indicated that RAC2, MMP9 and
SMAD2 were enriched in pathways in cancer (Table IV). A total of 55 miRNAs
targeting the PPI network nodes were obtained (Table V), which were used for
constructing the miRNA-target regulatory network (Fig. 7).
| Table IIITop 15 protein-protein interaction
network nodes according to Degree centrality, Betweenness
centrality, and Closeness centrality. |
Table III
Top 15 protein-protein interaction
network nodes according to Degree centrality, Betweenness
centrality, and Closeness centrality.
| Gene | Degree |
|---|
| Degree
centrality | |
| Nos3 | 24.00 |
| Mmp9 | 21.00 |
| Egr1 | 17.00 |
| Smad2 | 16.00 |
| Rac2 | 15.00 |
| Oasl | 13.00 |
| Rrp12 | 13.00 |
| Rrad | 12.00 |
| Prkar2b | 12.00 |
| Rel | 12.00 |
| Oas1a | 12.00 |
| Aldh1a1 | 12.00 |
| Eif2ak3 | 12.00 |
| Atf3 | 11.00 |
| Prkdc | 10.00 |
| Betweenness
centrality | |
| Nos3 | 15,488.65 |
| Mmp9 | 6,738.23 |
| Prkar2b | 6,486.67 |
| Egr1 | 5,810.34 |
| Smad2 | 5,786.24 |
| Rac2 | 5,224.65 |
| Rel | 4,200.35 |
| Irf7 | 4,080.12 |
| Ass1 | 4,069.44 |
| Eif2ak3 | 3,783.77 |
| Oasl | 3,774.34 |
| Oas1a | 3,735.38 |
| Tspo | 3,703.37 |
| Gstt1 | 3,385.96 |
| Atf3 | 3,226.96 |
| Closeness
centrality | |
| Nos3 | 0.04 |
| Mmp9 | 0.04 |
| Smad2 | 0.04 |
| Prkar2b | 0.04 |
| Rel | 0.04 |
| Egr1 | 0.04 |
| Eif2ak3 | 0.04 |
| Hdac5 | 0.04 |
| Atf3 | 0.04 |
| Ass1 | 0.04 |
| Snai2 | 0.04 |
| Tspo | 0.04 |
| Rac2 | 0.04 |
| Irf7 | 0.04 |
| Mmp13 | 0.04 |
| Table IVTop five GO terms and pathways
enriched for the nine key nodes. |
Table IV
Top five GO terms and pathways
enriched for the nine key nodes.
| Category | Term | P-value | Gene |
|---|
| GO | GO:0010033~response
to organic substance | 1.21E-04 | EGR1, PRKAR2B,
MMP9, NOS3, SMAD2, EIF2AK3 |
| GO | GO:0048771~tissue
remodeling | 7.56E-04 | RAC2, MMP9,
NOS3 |
| GO |
GO:0044057~regulation of system
process | 9.23E-04 | EGR1, MMP9,
NOS3, EIF2AK3 |
| GO |
GO:0007242~intracellular signaling
cascade | 1.85E-03 | PRKAR2B, REL,
RAC2, SMAD2, EIF2AK3 |
| GO |
GO:0051969~regulation of transmission of
nerve impulse | 5.57E-03 | EGR1, MMP9,
EIF2AK3 |
| PATHWAY | rno05200:Pathways
in cancer | 4.13E-02 | RAC2, MMP9,
SMAD2 |
| Table VResults of miRNA prediction. |
Table V
Results of miRNA prediction.
| miRNA | Adjusted
P-value | Target |
|---|
| miR-506 | 0.0013 | Pgap1, Bcl6, Dlx3,
Pim1, Eya1, Oaf, Tead1, Egr2, Smpd3, Pgf, Dnajb14, Dgat2, Caskin1,
Slc7a1, Sema6a, Nrcam, Rcan1, Serp1, Arhgef37 |
| miR-27A,
miR-27B | 0.0013 | Adora2b, Pgap1,
Mknk2, Vangl2, Slc7a11, Ank2, Hoxb3, Dcun1d4, Eya1, Nhs, Sema6a,
Cabp1, Rad54b, Mdfi, Hyou1 |
| miR-148A, miR-152,
miR-148B | 0.0028 | Prkag2, Dmxl1,
Pdk4, Slc7a11, Ank2, Dyrk1b, Nhs, Txnip, Plaa, Tead1, Slc24a3 |
| miR-205 | 0.0083 | Gpatch4, Tead1,
Dmxl1, Lin9, Fam84b, Nhs, Chn1 |
| miR-124A | 0.0083 | Map1b, Dmxl1,
Hdac5, Fa2h, Eya1, Sema6a, Pdxk, Atmin, Tead1, Sync, Egr2, Serp1,
Ctns, Pnn |
| miR-26A | | |
| miR-26B | 0.0083 | Slc1a1, Dmxl1,
Mknk2, Vangl2, Slc7a11, Pim1, Adm, Fa2h, Nhs, Fanca |
| miR-29A,
miR-29B | | |
| miR-29C | 0.0107 | Il1rap, Pgap1,
Col6a3, Smpd3, Col16a1, Dcun1d4, Syt8, Prelp, Mllt11, Nlgn3,
Epb41l4b, Bmf, Zbtb46 |
| miR-125B,
miR-125A | 0.0109 | Abcc5, Wars, Mknk2,
Vangl2, Hoxb3, Slc7a1, Abtb1, Olfml2a, Apobec1, Bmf |
| miR-15A, miR-16,
miR-15B, miR-195, miR-424, miR-497 | 0.0111 | Abcc5, Cx3cl1,
Cldn2, Pdk4, Klc4, Ank2, Dcun1d4, Pim1, Eya1,Caskin1, Syt8, Bace2,
Epb41l4b, Zbtb46 |
| miR-9 | 0.0163 | Map1b, Pgap1, Pdk4,
Hdac5, Bcl6, Ank2, Dlx3, Dcun1d4, Dyrk1b, Ikzf5, Slc39a14,
Ap1s2 |
| miR-17-5P, miR-20A,
miR-106A, miR-106B, miR-20B, miR-519D | 0.0208 | Fat2, Trpv6, Mknk2,
Psd, Ank2, Rapgef4, Zdhhc1, Txnip, Rhov,Egr2, Serp1, Gnb5,
Egln3 |
| miR-412 | 0.0208 | Tmsb4x, Bcl6, Ank2,
Irf7 |
| miR-212,
miR-132 | 0.0232 | Sema6a, Prpf4b,
Slc30a6, Olfm1, Dnajb14, Pnn |
| miR-216 | 0.0232 | Zbtb2, Vangl2,
Slc24a3, Rp2, Nhs |
| miR-513 | 0.0338 | Pdxk, Cacna2d4,
Serp1, Dcun1d4, Eya1 |
| miR-9 | 0.0338 | Mxd1, Tead1, Atmin,
Prpf4b, Pdk1, Fam84b, Srcin1 |
| miR-214 | 0.0338 | Hsd17b8, Bace2,
Mog, Rad54b, Pgf, Pim1, Fam84b |
| miR-185 | 0.0338 | Mllt11, Wars,
Nr1d1, Slc37a2, Synm |
| miR-519C, miR-519B,
miR-519A | 0.0338 | Fgf9, Map1b, Nr1d1,
Psd, Hoxb3, Rapgef4, Zdhhc1, Tead1, Epb41l4b, Zbtb46 |
| miR-501 | 0.0338 | Sync, Pdk1, Tnni2,
Bcl6, Pnn |
| miR-511 | 0.0472 | Prelp, Prpf4b,
Enpp4, Vangl2, Dyrk1b, Eya1 |
| miR-93, miR-302A,
miR-302B, miR-302C, miR-302D, miR-372, miR-373, miR-520E, miR-520A,
miR-526B, miR-520B, miR-520C, miR-520D | 0.0472 | Trpv6, Mknk2, Bcl6,
Ank2, Smad2, Txnip, Sync, Gnb5 |
| miR-377 | 0.0473 | Fat2, Tead1,
Prpf4b, Egr2, Ubp1, Egr1 |
Discussion
The PLKO-SH group exhibited a lower mRNA level of
HNF-4α, increased cell proliferation, and lower a
PAS-positive cell rate compared with the WB-F344 and PLKO groups.
The cells in the PLKO-SH group had lower protein levels of ALB and
CK19 compared with the cells in the WB-F344 and PLKO groups,
indicating that the number of mature liver cells in the liver stem
cells was decreased. Although the protein level of AFP, a
differentiated hepatocyte marker, was not reduced in the PLKO-SH
group, the WB-F344 cell was considered a suitable cell line for
examining hepatocyte differentiation. A total of 499 DEGs (305
upregulated and 194 downregulated) between the
HNF-4α-silenced samples and normal samples were identified.
Based on the BC, CC and DC scores, MMP9, EGR1, SMAD2 and RAC2 were
selected as the key nodes in the PPI network. Furthermore, 55
miRNAs were predicted for the PPI network nodes and used for
constructing the miRNA-target regulatory network.
HNF-4α is critical in the
transdifferentiation process of hematopoietic cells into
hepatocytes (34). As an orphan
nuclear receptor, HNF-4α is important in hepatic
differentiation through the regulation of hepatocyte marker genes
(35,36). A previous study demonstrated that
HNF-4α, Snail, miR-200, and miR-34a are
epistatic elements that regulate the maintenance and
differentiation of hepatic stem cells (37). HNF-4α functions in
hepatocyte differentiation and can suppress hepatocyte
proliferation by inhibiting pro-mitogenic genes (38). These observations support the
hypothesis that HNF-4α stimulates the hepatic
differentiation of WB-F344 cells.
Activated MMPs control hepatic matrix
remodeling, which helps to mediate the environment surrounding
hepatocytes in the processes of liver regeneration (39,40). The MMP activation cascade
and the positive feedback loop of MMP9 contribute to the
transdifferentiation of hepatic stel-late cells induced by
interleukin 1, indicating that MMPs are involved in liver
injury and repair (41,42). By regulating the
mesenchymal-to-epithelial transition (MET) process, EGR1
stimulates the hepatic differentiation of bone marrow-derived
mesenchymal stem cells (43).
EGR1, which is a key mediator of liver fibrosis-associated
genes, is regulated by a feedback loop between HNF-4α and
small heterodimer partner (44).
Therefore, MMP9 and EGR1 may be targets of
HNF-4α during the hepatic differentiation of WB-F344
cells.
SMAD2 inhibits the growth and
dedifferentiation of hepatocytes through a TGF-β
signaling-independent pathway (45). The cyclin D1-SMAD2/3-SMAD4
signaling pathway contributes to the self-renewal of liver cancer
stem cells, and TGF-β/SMAD inhibitor can induce liver cancer stem
cell differentiation (46).
RAC1 is correlated with actin polymerization, and its
inhibition can promote MET and enhance the differentiation of
mesenchymal stromal cells toward hepatocytes (47). These observations indicate that
HNF-4α may also promote the differentiation of WB-F344 cells
into hepatocytes by targeting SMAD2 and RAC2.
In conclusion, HNF-4α contributes to the
differentiation of WB-F344 cells into hepatocytes. MMP9,
EGR1, SMAD2 and RAC2 may be targets of
HNF-4α during the hepatic differentiation of WB-F344 cells.
However, further experiments, including RT-qPCR analysis, are
required to confirm the targets of HNF-4α in the hepatic
differentiation of WB-F344 cells.
Funding
No funding was received.
Availability of data and materials
The datasets generated and/or analyzed during the
current study are available in the Sequence Read Archive database
repository (http://www.ncbi.nlm.nih.gov/sra/) under accession no.
SRP135721.
Authors' contributions
YS and BS contributed to the study design, DehZ and
DerZ contributed to data collection, BW and DehZ contributed to
data analysis and interpretation, YS conducted statistical
analysis. All authors read and approved the final manuscript.
Ethics approval and consent to
participate
Not applicable.
Patient consent for publication
Not applicable.
Competing interests
The authors declare that they have no competing
interests.
Acknowledgments
Not applicable.
References
|
1
|
Chandra V, Huang P, Potluri N, Wu D, Kim Y
and Rastinejad F: Multidomain integration in the structure of the
HNF-4α nuclear receptor complex. Nature. 495:394–398. 2013.
View Article : Google Scholar : PubMed/NCBI
|
|
2
|
Saha SK, Parachoniak CA, Ghanta KS,
Fitamant J, Ross KN, Najem MS, Gurumurthy S, Akbay EA, Sia D,
Cornella H, et al: Mutant IDH inhibits HNF-4α to block hepatocyte
differentiation and promote biliary cancer. Nature. 513:110–114.
2014. View Article : Google Scholar
|
|
3
|
Li J, Ning G and Duncan SA: Mammalian
hepatocyte differentiation requires the transcription factor
HNF-4α. Genes Dev. 14:464–474. 2000.
|
|
4
|
Takayama K, Inamura M, Kawabata K,
Katayama K, Higuchi M, Tashiro K, Nonaka A, Sakurai F, Hayakawa T,
Furue MK and Mizuguchi H: Efficient generation of functional
hepatocytes from human embryonic stem cells and induced pluripotent
stem cells by HNF4α transduction. Mol Ther. 20:127–137. 2012.
View Article : Google Scholar
|
|
5
|
Chen KT, Pernelle K, Tsai YH, Wu YH, Hsieh
JY, Liao KH, Guguen-Guillouzo C and Wang HW: Liver X receptor α
(LXRα/NR1H3) regulates differentiation of hepatocyte-like cells via
reciprocal regulation of HNF4α. J Hepatol. 61:1276–1286. 2014.
View Article : Google Scholar : PubMed/NCBI
|
|
6
|
Simó R, Barbosa-Desongles A, Hernandez C
and Selva DM: IL1β down-regulation of sex hormone-binding globulin
production by decreasing HNF-4α via MEK-1/2 and JNK MAPK pathways.
Mol Endocrinol. 26:1917–1927. 2012. View Article : Google Scholar
|
|
7
|
Simó R, Barbosadesongles A, Sáezlopez C,
Lecube A, Hernandez C and Selva DM: Molecular mechanism of
TNFα-induced down-regulation of SHBG expression. Mol Endocrinol.
26:438–446. 2012. View Article : Google Scholar
|
|
8
|
Li WQ, Li YM, Guo J, Liu YM, Yang XQ, Ge
HJ, Xu Y, Liu HM, He J and Yu HY: Hepatocytic precursor (stem-like)
WB-F344 cells reduce tumorigenicity of hepatoma CBRH-7919 cells via
TGF-beta/Smad pathway. Oncol Rep. 23:1601–1607. 2010.
|
|
9
|
Liu J, Liu Y, Wang H, Hao H, Han Q, Shen
J, Shi J, Li C, Mu Y and Han W: Direct differentiation of hepatic
stem-like WB cells into insulin-producing cells using small
molecules. Sci Rep. 3:11852013. View Article : Google Scholar : PubMed/NCBI
|
|
10
|
Couchie D, Holic N, Chobert MN, Corlu A
and Laperche Y: In vitro differentiation of WB-F344 rat liver
epithelial cells into the biliary lineage. Differentiation.
69:209–215. 2002. View Article : Google Scholar : PubMed/NCBI
|
|
11
|
Yang Z, Wang L and Wang X: Matrine induces
the hepatic differentiation of WB-F344 rat hepatic progenitor cells
and inhibits Jagged 1/HES1 signaling. Mol Med Rep. 14:3841–3847.
2016. View Article : Google Scholar
|
|
12
|
Vasilescu C, Rossi S, Shimizu M, Tudor S,
Veronese A, Ferracin M, Nicoloso MS, Barbarotto E, Popa M,
Stanciulea O, et al: MicroRNA fingerprints identify miR-150 as a
plasma prognostic marker in patients with sepsis. PLoS One.
4:e74052009. View Article : Google Scholar : PubMed/NCBI
|
|
13
|
Yao H, Jia Y, Zhou J, Wang J, Li Y, Wang
Y, Yue W and Pei X: RhoA promotes differentiation of WB-F344 cells
into the biliary lineage. Differentiation. 77:154–161. 2009.
View Article : Google Scholar
|
|
14
|
Zhang Y, Li XM, Zhang FK and Wang BE:
Activation of canonical Wnt signaling pathway promotes
proliferation and self-renewal of rat hepatic oval cell line
WB-F344 in vitro. World J Gastroenterol. 14:6673–6680. 2008.
View Article : Google Scholar : PubMed/NCBI
|
|
15
|
Arocho A, Chen B, Ladanyi M and Pan Q:
Validation of the 2-DeltaDeltaCt calculation as an alternate method
of data analysis for quantitative PCR of BCR-ABL P210 transcripts.
Diagn Mol Pathol. 15:56–61. 2006. View Article : Google Scholar
|
|
16
|
Kim D, Pertea G, Trapnell C, Pimentel H,
Kelley R and Salzberg SL: TopHat2: Accurate alignment of
transcriptomes in the presence of insertions, deletions and gene
fusions. Genome Biol. 14:R362014. View Article : Google Scholar :
|
|
17
|
Strozzi F and Aerts J: A Ruby API to query
the Ensembl database for genomic features. Bioinformatics.
27:1013–1014. 2011. View Article : Google Scholar
|
|
18
|
Anders S, Pyl PT and Huber W: HTSeq-a
Python framework to work with high-throughput sequencing data.
Bioinformatics. 31:166–169. 2015. View Article : Google Scholar
|
|
19
|
Nikolayeva O and Robinson MD: edgeR for
differential RNA-seq and ChIP-seq analysis: An application to stem
cell biology. Methods Mol Biol. 1150:45–79. 2014. View Article : Google Scholar
|
|
20
|
Robinson MD, Mccarthy DJ and Smyth GK:
edgeR: A Bioconductor package for differential expression analysis
of digital gene expression data. Bioinformatics. 26:139–140. 2010.
View Article : Google Scholar
|
|
21
|
Law CW, Chen Y, Shi W and Smyth GK: voom:
Precision weights unlock linear model analysis tools for RNA-seq
read counts. Genome Biol. 15:R292014. View Article : Google Scholar : PubMed/NCBI
|
|
22
|
Ritchie ME, Phipson B, Wu D, Hu Y, Law CW,
Shi W and Smyth GK: limma powers differential expression analyses
for RNA-sequencing and microarray studies. Nucleic Acids Res.
43:e472015. View Article : Google Scholar
|
|
23
|
Yu L, Gulati P, Fernandez S, Pennell M,
Kirschner L and Jarjoura D: Fully moderated T-statistic for small
sample size gene expression arrays. Stat Appl Genet Mol Biol.
10:1–22. 2011. View Article : Google Scholar
|
|
24
|
Huang DW, Sherman BT and Lempicki RA:
Systematic and integrative analysis of large gene lists using DAVID
bioinformatics resources. Nat Protoc. 4:44–57. 2009. View Article : Google Scholar
|
|
25
|
Gene Ontology Consortium: Gene Ontology
Consortium: Going forward. Nucleic Acids Res. 43(Database Issue):
D1049–D1056. 2015. View Article : Google Scholar :
|
|
26
|
Kanehisa M, Sato Y, Kawashima M, Furumichi
M and Tanabe M: KEGG as a reference resource for gene and protein
annotation. Nucleic Acids Res. 44:D457–D462. 2016. View Article : Google Scholar
|
|
27
|
Franceschini A, Szklarczyk D, Frankild S,
Kuhn M, Simonovic M, Roth A, Lin J, Minguez P, Bork P, von Mering C
and Jensen LJ: STRING v9.1: Protein-protein interaction networks,
with increased coverage and integration. Nucleic Acids Res.
41(Database Issue): D808–D815. 2013. View Article : Google Scholar
|
|
28
|
Saito R, Smoot ME, Ono K, Ruscheinski J,
Wang PL, Lotia S, Pico AR, Bader GD and Ideker T: A travel guide to
Cytoscape plugins. Nat Methods. 9:1069–1076. 2012. View Article : Google Scholar : PubMed/NCBI
|
|
29
|
Tang Y, Li M, Wang J, Pan Y and Wu FX:
CytoNCA: A cytoscape plugin for centrality analysis and evaluation
of protein interaction networks. Biosystems. 127:67–72. 2015.
View Article : Google Scholar
|
|
30
|
Rito T, Deane CM and Reinert G: The
importance of age and high degree, in protein-protein interaction
networks. J Comput Biol. 19:785–795. 2012. View Article : Google Scholar : PubMed/NCBI
|
|
31
|
Goh KI, Oh E, Kahng B and Kim D:
Betweenness centrality correlation in social networks. Phys Rev E
Stat Nonlin Soft Matter Phys. 67:0171012003. View Article : Google Scholar : PubMed/NCBI
|
|
32
|
Okamoto K, Chen W and Li XY: Ranking of
closeness centrality for large-scale social networks. International
Workshop on Frontiers in Algorithmics. Front Algorithmics. 186–195.
2008. View Article : Google Scholar
|
|
33
|
Wang J, Duncan D, Shi Z and Zhang B:
WEB-based GEne SeT analysis toolkit (WebGestalt): Update 2013.
Nucleic Acids Res. 41:W77–W83. 2013. View Article : Google Scholar
|
|
34
|
Khurana S, Jaiswal AK and Mukhopadhyay A:
Hepatocyte nuclear factor-4α induces transdifferentiation of
hematopoietic cells into hepatocytes. J Biol Chem. 285:4725–4731.
2010. View Article : Google Scholar
|
|
35
|
Walesky C and Apte U: Role of hepatocyte
nuclear factor 4α (HNF4α) in cell proliferation and cancer. Gene
Expr. 16:101–108. 2015. View Article : Google Scholar
|
|
36
|
Kimata T, Nagaki M, Tsukada Y, Ogiso T and
Moriwaki H: Hepatocyte nuclear factor-4alpha and -1 small
interfering RNA inhibits hepatocyte differentiation induced by
extracellular matrix. Hepatol Res. 35:3–9. 2006. View Article : Google Scholar
|
|
37
|
Garibaldi F, Cicchini C, Conigliaro A,
Santangelo L, Cozzolino AM, Grassi G, Marchetti A, Tripodi M and
Amicone L: An epistatic mini-circuitry between the transcription
factors Snail and HNF4α controls liver stem cell and hepatocyte
features exhorting opposite regulation on stemness-inhibiting
microRNAs. Cell Death Differ. 19:937–946. 2012. View Article : Google Scholar
|
|
38
|
Walesky C, Gunewardena S, Terwilliger EF,
Edwards G, Borude P and Apte U: Hepatocyte-specific deletion of
hepatocyte nuclear factor-4α in adult mice results in increased
hepatocyte proliferation. Am J Physiol Gastrointest Liver Physiol.
304:G26–G37. 2013. View Article : Google Scholar
|
|
39
|
Kim TH, Mars WM, Stolz DB and
Michalopoulos GK: Expression and activation of pro-MMP-2 and
pro-MMP-9 during rat liver regeneration. Hepatology. 31:75–82.
2000. View Article : Google Scholar
|
|
40
|
Pham Van T, Couchie D, Martin-Garcia N,
Laperche Y, Zafrani ES and Mavier P: Expression of matrix
metalloproteinase-2 and -9 and of tissue inhibitor of matrix
metalloproteinase-1 in liver regeneration from oval cells in rat.
Matrix Biol. 27:674–681. 2008. View Article : Google Scholar : PubMed/NCBI
|
|
41
|
Han YP, Yan C, Zhou L, Qin L and Tsukamoto
H: A matrix metalloproteinase-9 activation cascade by hepatic
stellate cells in trans-differentiation in the three-dimensional
extracellular matrix. J Biol Chem. 282:12928–12939. 2007.
View Article : Google Scholar
|
|
42
|
Kollet O, Shivtiel S, Chen YQ, Suriawinata
J, Thung SN, Dabeva MD, Kahn J, Spiegel A, Dar A, Samira S, et al:
HGF, SDF-1, and MMP-9 are involved in stress-induced human
CD34+ stem cell recruitment to the liver. J Clin Invest.
112:160–169. 2003. View Article : Google Scholar : PubMed/NCBI
|
|
43
|
Kim HL, Cha JH, Park NR, Bae SH, Choi JY
and Yoon SK: 304 EGR1 promotes the differentiation of bm-derived
mesenchymal stem cells into functional hepatocyte with
mesenchymal-to-epithelial transition. J Hepatol. 58:S1282013.
View Article : Google Scholar
|
|
44
|
Zhang Y, Bonzo JA, Gonzalez FJ and Wang L:
Diurnal regulation of the early growth response 1 (Egr-1) protein
expression by hepatocyte nuclear factor 4alpha (HNF4alpha) and
small heterodimer partner (SHP) cross-talk in liver fibrosis. J
Biol Chem. 286:29635–29643. 2011. View Article : Google Scholar : PubMed/NCBI
|
|
45
|
Ju W, Ogawa A, Heyer J, Nierhof D, Yu L,
Kucherlapati R, Shafritz DA and Böttinger EP: Deletion of Smad2 in
mouse liver reveals novel functions in hepatocyte growth and
differentiation. Mol Cell Biol. 26:654–667. 2006. View Article : Google Scholar
|
|
46
|
Jiang F, Mu J, Wang X, Ye X, Si L, Ning S,
Li Z and Li Y: The repressive effect of miR-148a on TGF beta-SMADs
signal pathway is involved in the glabridin-induced inhibition of
the cancer stem cells-like properties in hepatocellular carcinoma
cells. PLoS One. 9:e966982014. View Article : Google Scholar :
|
|
47
|
Teng NY, Liu YS, Wu HH, Liu YA, Ho JH and
Lee OK: Promotion of mesenchymal-to-epithelial transition by Rac1
inhibition with small molecules accelerates hepatic differentiation
of mesenchymal stromal cells. Tissue Eng Part A. 21:1444–1454.
2015. View Article : Google Scholar
|