Introduction
It is well known that increases in the multidrug
resistance of Gram-negative bacteria, in particular, Pseudomonas
aeruginosa, Acinetobacter baumannii and Klebsiella
pneumonia, are a clinical problem. Colistin is a drug used
clinically for infection caused by multidrug-resistant
Gram-negative bacteria (1,2).
Its use was abandoned in the early 1970s due to severe adverse
effects on the kidney, however, the drug has been reintroduced to
treat multidrug-resistant infections (3,4).
Colistin is now commercially available as colistin sulfate and
colistin methane-sulfonate sodium (CMS). CMS is the prodrug form of
colistin most commonly used in clinical applications, and is less
toxic than colistin sulfate (5,6).
Most of the administered CMS is excreted by renal clearance, and
the rest is converted into the active form of colistin within the
urinary tract and reabsorbed by the renal tubule (1,7).
Colistin has been used recently due to the increase
in nosocomial infections; although the frequency of nephrotoxicity
has reduced, adverse effects continue to be reported in clinical
studies (8,9). The nephrotoxicity induced by
colistin treatment is dose-dependent and reversible, and acute
tubular necrosis can occur in the kidneys of patients (6,9,10).
Histopathological studies involving animals have shown that
colistin is involved in focal irregular dilation of the renal
tubules and the degeneration and regeneration of epithelial cells
(6). It has also been reported
that colistin treatment results in proteinuria and hematuria, and
increases the concentrations of urea and creatinine in the blood
(11). Acute tubular necrosis
occurs as a result of a colistin-dependent increase in cell
membrane permeability of the tubular epithelium (12).
Although the nephrotoxicity of colistin has been
reported, the molecular mechanism underlying its nephrotoxicity
remains to be fully elucidated. Several toxic mechanisms underlying
the nephrotoxicity induced by colistin treatment have been
suggested. Ozkan et al (13), reported that caspase-mediated
apoptosis occurred following colistin treatment, and several genes,
including caspase 1, calpain 1, inducible nitric oxide synthase and
endothelial nitric oxide synthase, were identified as key
regulators. Dai et al (14), reported that apoptosis was induced
following colistin treatment via the mitochondrial, death receptor
and endoplasmic reticulum pathways. An enriched gene signature of
cell cycle arrest was also found according to the relevance of the
nephrotoxicity of colistin (15).
Among the suggested mechanisms, oxidative stress is considered to
be key factor associated with colistin-induced nephrotoxicity. In
support of this, nephrotoxicity is prevented by treatment with
several antioxidants, including melatonin, ascorbic acid,
astaxanthin and vitamin E (12,16,17). Lycopene reportedly activates the
nuclear factor erythroid-2-related factor-2 (Nrf2)/heme oxygenase-1
pathway and has a protective effect on colistin-induced
nephrotoxicity (18).
Although several mechanisms have been suggested,
previous investigations have been limited to the evaluation of
initiating events of colistin-induced nephrotoxicity. Whole genome
and gene networking analysis may provide additional information
regarding the mechanisms of toxicity, and analysis of the master
regulators and transcription factors of regulated genes may provide
key clues to the regulation of this toxicity (19). To understand the events during
initial nephrotoxicity induced by colistin, the present study
analyzed a comprehensive gene expression profile in rat kidneys
exhibiting nephrotoxicity induced by colistin treatment. Adverse
outcome pathways (AOPs) are conceptual frameworks of the biological
events leading to adverse effects, and provide a systematic
approach for organizing mechanisms of toxicity (20,21). Genomic datasets can provide clues
to determining potential molecular initiating events (MIEs) and key
events (KEs) at the molecular level, and can be used to develop the
AOP framework (22). Based on
integrated analysis of gene networking in the rat kidney following
colistin treatment, the toxicity pathway was evaluated and a
putative AOP framework was developed for colistin-induced renal
toxicity. This AOP framework provides a better understanding of the
mode of action of renal toxicity induced by antibiotics including
colistin.
Materials and methods
Animals and drug treatment
All animal experiments were performed under the
guidance of the Institutional Animal Care and Use Committee (IACUC)
of the Korea Institute of Toxicology (Daejeon, China).
Sprague-Dawley rats (24 males, 8 weeks old, 240–260 g) were
purchased from Orient Bio, Inc. (Seongnam, Korea) and acclimated
for 1 week prior to the experiment. All rats were housed under
standard laboratory conditions on a 12-h light/dark cycle, under
controlled temperature (23±3°C) and humidity (50±20%). The rats
were divided into groups of eight and were fed standard food
pellets and water ad libitum. The CMS was purchased from
Samchundang Pharm (Seoul, Korea), diluted with 0.9% saline (Dai Han
Pharm, Co., Ansan, Korea), and administered at concentrations of 0,
25, and 50 mg/kg body weight. Each rat was injected with 0.9%
saline (a vehicle control) or CMS via intraperitoneal injection
daily for 7 days. Prior to sacrifice, all rats were fasted
overnight and anesthetized by isoflurane inhalation. All
experiments were approved by the IACUC of the Korea Institute of
Toxicology (approval no. 1404-0120) and conducted in accordance
with the Association of Assessment and Accreditation of Laboratory
Animal Care International guidelines.
Organ weights, serum biochemistry and
histopathology
The total body weight and weights of the right and
left kidneys were measured, and the relative organ weight ratio was
calculated. Blood samples of ~1.5 ml were drawn from the inferior
vena cava and serum samples were separated by centrifugation at
2,000 × g for 10 min at room temperature. The serum chemistry
parameters were measured using a Toshiba 120 FR chemistry analyzer
(Toshiba Corporation, Tokyo, Japan). For histopathological
evaluation, the tissues were fixed in paraformaldehyde (4%) and
embedded in paraffin. The paraffin blocks were sectioned at 4
µm thickness using a microtome. The sectioned tissues were
stained with hematoxylin and eosin. All histopathological results
were reviewed by pathology experts at Korea Institute of Toxicology
in a blinded-manner.
RNA extraction
Following animal sacrifice, the whole right kidneys
were extracted and frozen immediately in liquid nitrogen. The
frozen samples were homogenized with a TissueLyser (Qiagen GmbH,
Hilden, Germany) and total RNA was purified using an
RNeasy® Mini kit (Qiagen GmbH) according to the
manufacturer's protocol. The concentration and quality of total RNA
were determined using a NanoDrop™ spectrophotometer (NanoDrop
Technologies; Thermo Fisher Scientific, Inc., Waltham, MA, USA) and
the RNA integrity was measured using a 2100 Bioanalyzer (Agilent
Technologies, Inc., Santa Clara, CA, USA).
Microarray experiments
The Affymetrix GeneChip Rat 230 2.0 (Affymetrix;
Thermo Fisher Scientific, Inc.) was used for microarray analysis.
Three rats were randomly selected from each CMS-treated group (0,
25, and 50 mg/kg). Microarray analysis was conducted according to
the GeneChip® 3′ expression array user guide
(Affymetrix; Thermo Fisher Scientific, Inc.). cDNA synthesis, cRNA
synthesis, biotin labeling, cRNA purification and fragmentation
were performed according to the manufacturer's protocols
(Affymetrix; Thermo Fisher Scientific, Inc.). The microarrays were
hybridized at 45°C at 60 rpm for 16 h. The microarrays were stained
and washed using a Fluidics Station 450 system (Affymetrix; Thermo
Fisher Scientific, Inc.). A GeneChip® Scanner 3000
(Affymetrix; Thermo Fisher Scientific, Inc.) was used to scan the
microarrays. The reproducibility of the microarray experiments was
confirmed using well-defined quality control criteria according to
the manufacturer's protocol. The micro-array data was deposited
into the Gene Expression Omnibus database (https://www.ncbi.nlm.nih.gov/geo/; no. GSE121792).
Bioinformatics analysis of differentially
expressed genes (DEGs)
To perform the preprocessing and statistical
analysis of the microarray data, GeneSpring GX v.13.0 analysis
software was used (Agilent Technologies, Inc.). Normalization was
performed using robust multichip average quantile median
normalization. To determine significance, one-way analysis of
variance was used (P≤0.05) followed by Tukey's honest significant
difference (HSD) post hoc test, and the Benjamini-Hochberg false
discovery rate (FDR; P≤0.05) multiple testing correction was
performed. The DEGs were selected based on a 1.3-fold-change
compared with the control samples, as described previously
(23). Venn diagram analysis was
used to determine the expressed genes that were common among
groups. Functional enrichment of the DEGs was analyzed using
Ingenuity Pathway Analysis (IPA) software v.9.0 (Ingenuity Systems,
Redwood City, CA, USA) (24). The
enriched canonical pathways were generated through the Ingenuity
Systems Knowledge Base and calculated using a right-tailed Fisher's
exact test. Upstream regulators were selected via IPA causal
analysis. Cytoscape software iRegulon v.3.2 (www.cytoscape.org) (25) was used to select the transcription
factors, as described previously (26).
The protein-protein interactions (PPIs) of the
common expressed genes were analyzed using STRING software v.10
(http://string-db.org) (27). The medium confidence score (0.400)
was used to select the network of PPIs of the DEGs (25 mg/kg). This
score is the approximate probability that a predicted link exists
between two proteins in the same Kyoto Encyclopedia of Genes and
Genomes (KEGG) pathway (www.genome.jp/kegg/) (28). The PPI network was also selected
using a high confidence score (0.700) in the DEGs (50 mg/kg-treated
group) due to the high number of DEGs.
Validation via reverse
transcription-quantitative polymerase chain reaction (RT-qPCR)
analysis
The DEGs were validated by RT-qPCR analysis. The
primers were purchased from Bioneer Corporation (Daejeon, Korea).
Total RNA (2 µg) was reverse transcribed with SuperScript™
II (Invitrogen; Thermo Fisher Scientific, Inc.) using an oligo-dT
primer according to the manufacturer's protocol. The cDNA samples
were stored at −20°C until use. The RT-qPCR procedure was performed
using a 20-µl reaction volume containing 2 µl (5 pM)
forward- and reverse-specific primers, 10 µL of
SYBR®-Green Master mix (Applied Biosystems; Thermo
Fisher Scientific, Inc.), 2 µl of cDNA and 6 µl of
nuclease-free water. The cDNA was amplified using a StepOne™ and
StepOnePlus™ Real-Time PCR system (Applied Biosystems; Thermo
Fisher Scientific, Inc.) according to the manufacturer's protocol.
The following amplification protocol was used: Denaturation program
(10 min at 95°C for 10 min, 60°C for 10 sec, 72°C for 60 sec),
melting curve program (60–95°C with a heating rate of 0.1 per
second and a continuous fluorescence measurement) and a final
cooling step to 40°C. The sequences of the primers used were as
follow: DnaJ heat shock protein family (Hsp40) member B1
(Dnajb1; Hsp40), forward 5′-GTCCCTGTCAACTACTGCCT-3′
and reverse 5′-TGAGTCGAATGGTCAGAGCA′; heat shock protein
(Hsp)h1, forward 5′-CCAAGATCGCAGCAGACTTC-3′ and
reverse 5′-TCATCCACTCCATCACCTCG-3′; Hsp90aa1, forward
5′-GCCAGTTTGGTGTTGGTTTT-3′ and reverse 5′-ACCCATTGGTTCACCTGTGT-3′;
glutathione peroxidase 2 (Gpx2) forward
5′-ATATTGTCCCCTTGCCTTCC-3′ and reverse 5′-CAGACTTAGAGCCCCCAGTG-3′;
glutathione-disulfide reductase (Gsr), forward
5′-CAACATCCCTACCGTGGTCT-3′ and reverse 5′-TGAAGGCGGTCGAGTAGATT-3′;
glutathione S-transferase (Gst)a3, forward
5′-GGAGGCCAACACGTTTTCTA-3′ and reverse 5′-CCAAATAGCATCCCAGCAAT-3′;
Gstm2, forward 5′-CACAAGATCACCCAGAGCAA-3′ and reverse
5′-AAACGTCCACACGAATCCTC-3′; Gstt2, forward
5′-TTTTCTGGCTCCTTTTCTGG-3′ and reverse 5′-GGGTCTCCTATTGGTTGTGC-3′;
superoxide dismutase 1 (Sod1), forward
5′-ATTGGCCGTACTATGGTGGT-3′ and reverse 5′-CCAATCACACCACAAGCCAA-3′;
β-actin, forward 5′-GTCGTACCACTGGCATTGTG-3′ and reverse
5′-CTCTCAGCTGTGGTGGTGAA-3′. The β-actin primers were used as an
internal control and fold changes in expression were calculated
according to the 2−ΔΔCq method (29).
AOP construction
The structure of an AOP is composed of MIEs,
measurable KEs, KE relationships (KERs) and adverse outcomes (AOs).
The MIE initiates toxicity through the interaction between a
chemical initiator and a molecular target within cells. The KEs are
initiated by the MIE and connected by KERs, which are sequentially
effected from cells to tissues. Therefore, the KEs are individual
cellular toxicity response pathways that connect the MIE with the
AO. The KEs and the KERs were selected using pathway analysis. An
AOP is basically composed of an MIE, KEs, an AO and KERs, and this
framework is a modular system in which multiple AOPs share a
network. The -omics data together with biochemical and
histopathological results were used to build the AOP framework.
Relevant data from the literature were also used to support and
connect this model.
Statistical analysis
Organ weights, and the concentrations and activity
levels of substrates and proteins in the serum were analyzed using
one-way analysis of variance following by Dunnet's post hoc test
for multiple comparison analysis. Statistical analyses were
performed with SAS 9.4 (SAS institute, Cary, NC, USA; 8 replicates
per group). P<0.05 indicated a statistically significant
difference.
Results and Discussion
Serum biochemical analysis and
histopathology
In clinical studies, it is recommended that CMS is
administrated to patients at ~6.67–13.3 mg/kg/day (2.5–5 mg/kg/day
colistin base activity) in 2–4 intravenous doses (5). Based on pharmacokinetics, CMS at 9
mg/kg/24 h in humans is equivalent to 30 mg/kg/12 h in the rat via
jugular vein (6). A previous
clinical study reported that intravenous injection of 2.5–5
mg/kg/day CMS for 14 days induced renal injury in a patient
(8). An animal study showed that
intraperitoneal injection of 16 mg/kg/day CMS for 15 days induced
nephrotoxicity in a murine model, and that there was no significant
difference in toxicity between intraperitoneal and intravenous
injection (15). Therefore, the
dosage and duration of CMS for the Sprague-Dawley rats were
determined from preliminary studies that showed nephrotoxicity. In
the present study, the dosages for inducing initial and moderate
damage were selected for analysis of the initial molecular events
causing nephrotoxicity. The respective doses of CMS were set to 25
and 50 mg/kg via intraperitoneal injection, and each rat was
injected with a vehicle control or CMS via intra-peritoneal
injection daily for 7 days. The total body weights were decreased
and the relative kidney ratio was increased in the 50 mg/kg
CMS-treated group, with no significant change detected in the 25
mg/kg CMS-treated group (Table
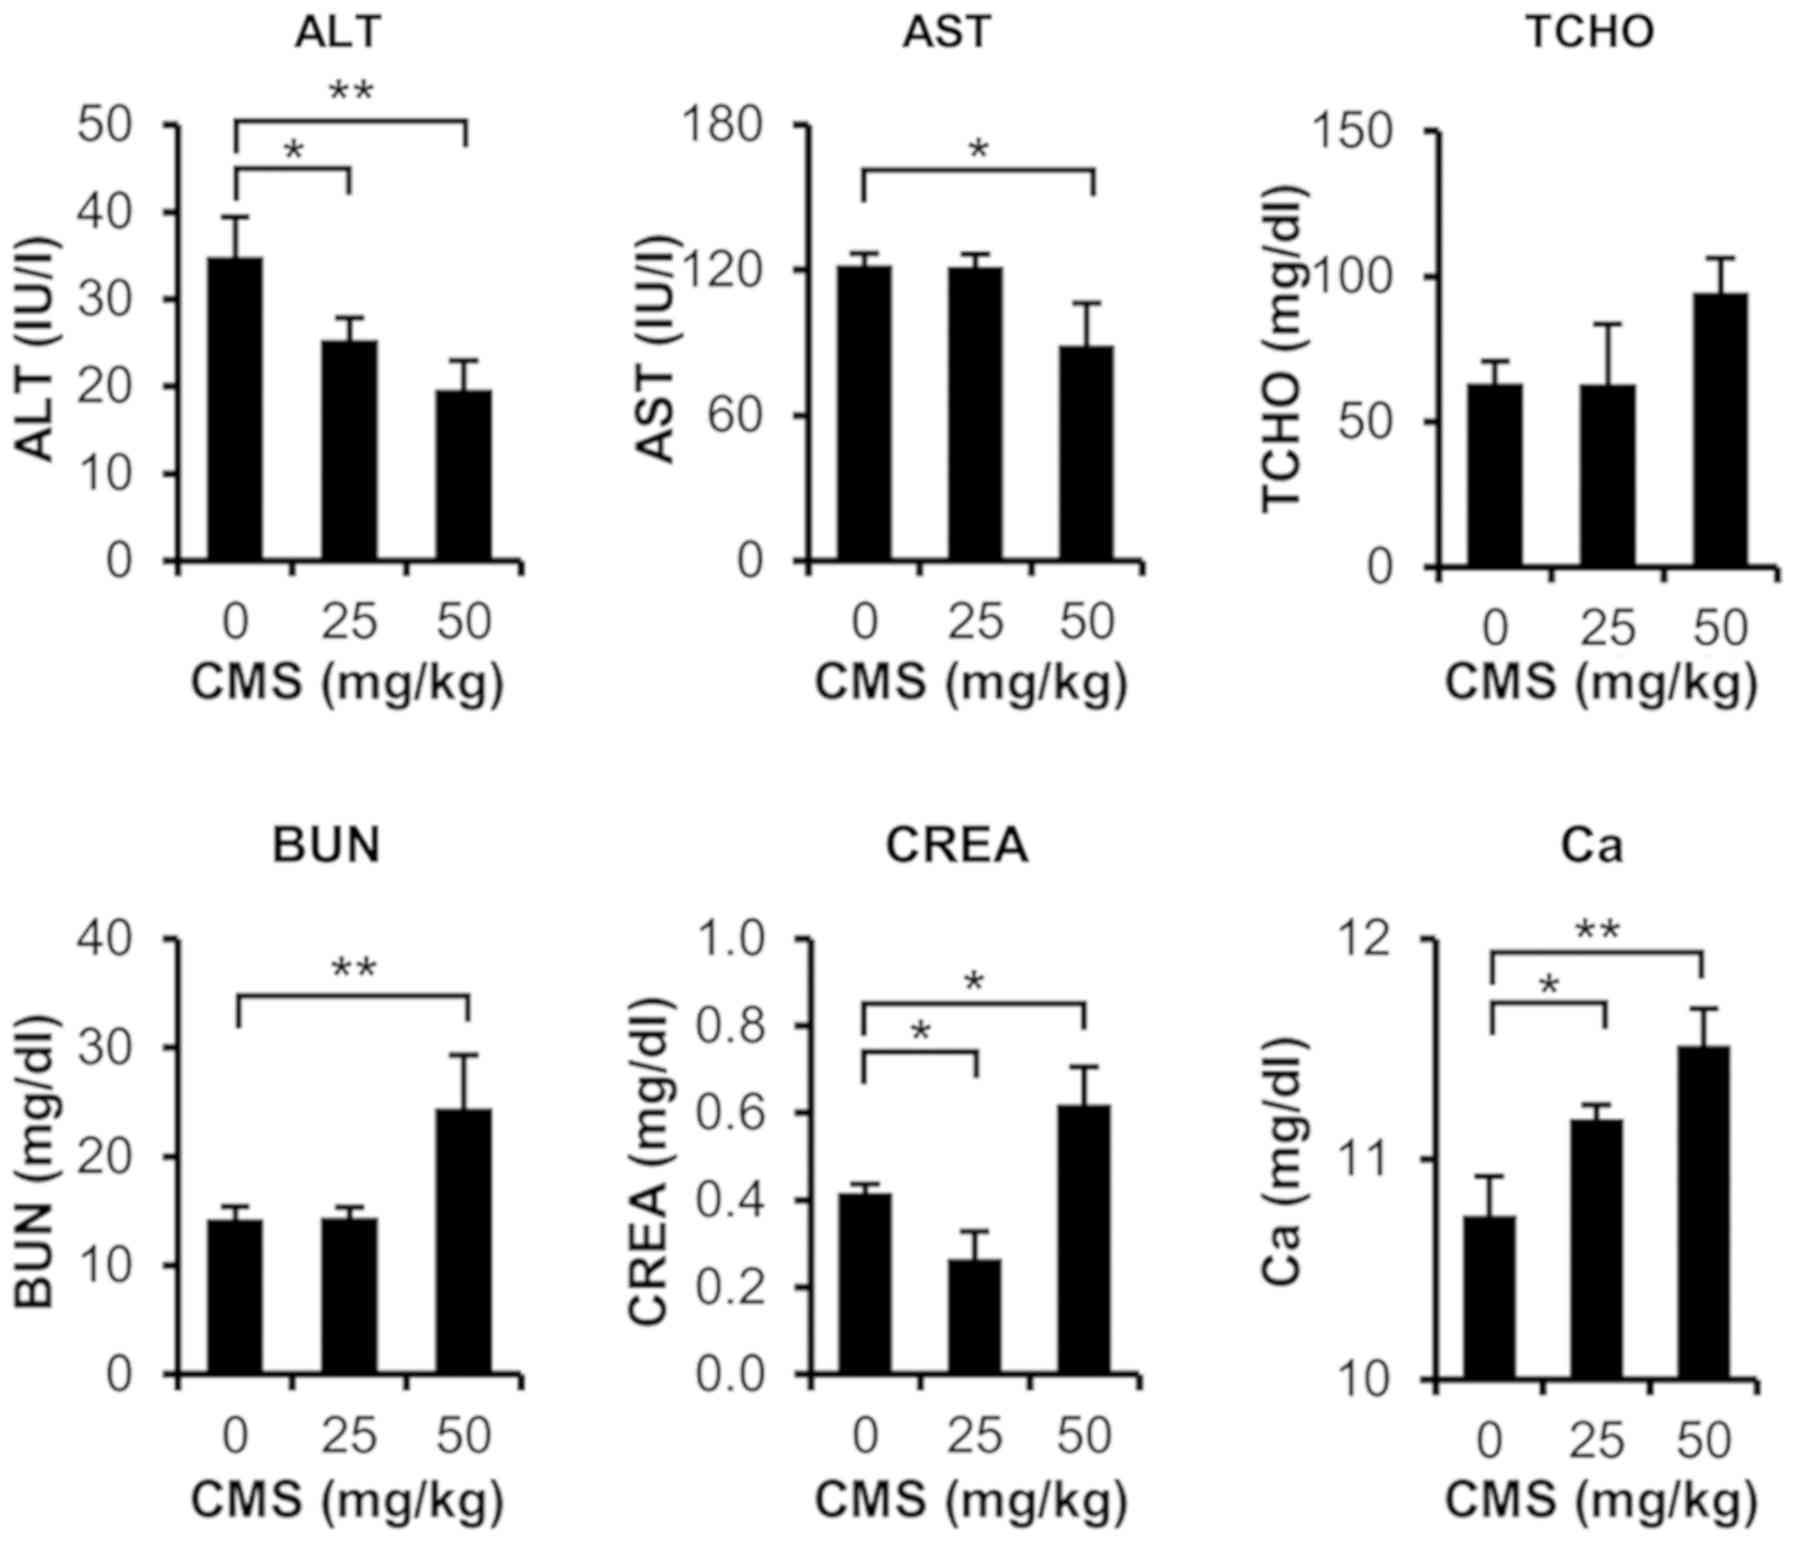
I). As shown in Fig. 1, serum
biochemical analysis indicated that total cholesterol, blood urea
nitrogen (BUN), serum creatinine (CREA), and blood calcium were
significantly increased in the 50 mg/kg CMS-treated rats. BUN and
CREA are representative serum markers of nephrotoxicity, and it is
known that calcium increases following kidney dysfunction.
Histopathological analysis revealed that there were no significant
lesions in the liver, but renal toxicity was observed in the
CMS-treated rats (Table II). In
the 25 mg/kg CMS-treated group, tubular basophilia and dilated
tubules were observed. Renal tubular cell necrosis, tubular
degeneration/dilatation and eosinophilic casts were observed in the
50 mg/kg CMS-treated group. In the 25 mg/kg CMS-treated group,
calcium levels were significantly increased, although no
histopathological renal toxicity was observed. In the 50 mg/kg
CMS-treated group, the BUN, CREA and calcium levels were increased,
and renal lesions were observed in the histopathological
analyses.
 | Table IAbsolute and relative organ weights
in rats following 7 days of CMS administration. |
Table I
Absolute and relative organ weights
in rats following 7 days of CMS administration.
| CMS (mg/kg) | Terminal body
weight (g) | Liver | Kidney |
|---|
|
|---|
| Absolute weight
(g) | Relative weight
(%) | Absolute weight
(g) | Relative weight
(%) |
|---|
| 0 | 337.8±12.4 | 10.09±0.67 | 2.99±0.13 | 2.68±0.20 | 0.79±0.06 |
| 25 | 323.4±18.6 | 9.43±0.61a | 2.95±0.12 | 2.58±0.24 | 0.81±0.05 |
| 50 | 280.7±30.7b | 8.29±0.62b | 3.05±0.13 | 3.93±1.15a | 1.47±0.53b |
| Table IIHistology of CMS-treated rat
kidneys. |
Table II
Histology of CMS-treated rat
kidneys.
| Histopathological
findig | Degree of presence
(n)
|
|---|
| 0 | 25 mg/kg CMS | 50 mg/kg CMS |
|---|
| Tubular
degeneration/dilatation | − | − | ++ (2), +++ (4), ++++ (2) |
| Tubular cell
necrosis | − | − | + (1), ++ (5), +++ (2) |
| Mineralization,
tubules | − | − | ++ (1), +++ (1) |
| Eosinophilic
casts | − | − | + (5), ++ (1) |
| Infiltration,
mononuclear | + (1) | + (1) | + (4) |
| Infiltration,
mixed, pelvis | − | − | + (1), ++ (1) |
| Tubular
basophilia | + (1) | + (3) | − |
| Dilated
tubules | − | + (1) | − |
Overall, severe renal injury occurred in the 50
mg/kg CMS-treated rats, and renal injury was initiated by subacute
treatment of 25 mg/kg CMS. Colistin has been shown to increase
serum CREA levels in previous clinical and animal studies (8,16).
The biochemical and histopathological observations following CMS
treatment in the present study are consistent with those of
previous studies (6,11). These results suggest that
nephrotoxicity was induced by CMS treatment (25 and 50 mg/kg) in
the rat kidneys.
Global gene expression profiles in the
kidney following CMS treatment
Microarray analysis of the three groups (0, 25, and
50 mg/kg CMS) revealed 358 genes and 4,126 gene probe sets as DEGs
by fold-change (≥1.3, P<0.05) from each group (25 and 50 mg/kg)
compared with the vehicle control. To remove false-positive genes,
27 and 886 significantly regulated genes were selected in the 25
and 50 mg/kg CMS-treated groups, respectively, following correction
for multiple comparisons (FDR, P<0.05) and Tukey's HSD post hoc
test. A total of 14 genes were selected as common genes in the two
CMS treatment groups (Table
III). Among the common genes, the expression levels of
cold-inducible RNA binding protein (Cirbp), kinesin family
member 18B (Kif18b), inhibin β-B (Inhbb) and bloom
syndrome, RecQ helicase-like (Blm) were increased, whereas
those of eukaryotic translation initiation factor 5 (Eif5),
ethanolamine kinase 1 (Etnk1), calcyclin binding
protein(Cacybp), arginine vasopressin receptor 1A
(Avpr1a), Hsp90aa1, bone morphogenetic protein
receptor, type II (Bmpr2) and Hsph1 were decreased in the
two CMS-treated groups. A total of 8 probe IDs for B-cell lymphoma
(Bcl-2)-associated transcription factor 1 (Bclaf1),
Dnajb (Hsp40) and zinc finger protein 423
(Zfp423) were differentially expressed in the 25 mg/kg
CMS-treated group only. Dnajb1 (Hsp40),
Hsp90aa1 and Hsph1 are members of the Hsp family that
protect the cell from proteotoxic and oxidative stress (30,31), and these were downregulated by
CMS. Dnajb1 (Hsp40) interacts with Hsp70 and is
induced by proteotoxic stress (32), Hsp90aa1 is expressed
following proteotoxic stress and other conditions of cellular
stress (32), and Hsph1
encodes heat shock 105/110 protein 1 and is induced by oxidative
and proteotoxic stress (33).
| Table IIICommonly expressed gene list and
expression values of CMS-treated (25 and 50 mg/kg) kidneys. |
Table III
Commonly expressed gene list and
expression values of CMS-treated (25 and 50 mg/kg) kidneys.
| Gene symbol | Gene name | Fold-change
| Unadjusted
P-value | Adjusted FDR |
|---|
| 25 mg/kg CMS | 50 mg/kg CMS |
|---|
| Fitm1 | Fat
storage-inducing transmembrane protein 1 | 1.95 | −1.88 | 1.62 E-03 | <0.05 |
| Cirbp | Cold-inducible RNA
binding protein | 1.66 | 2.19 | 1.50 E-04 | <0.05 |
| Kif18b | Kinesin family
member 18B | 1.38 | 2.03 | 5.78 E-05 | <0.05 |
| Inhbb | Inhibin β-B | 1.37 | 2.36 | 7.28 E-05 | <0.05 |
| Blm | Bloom syndrome,
RecQ helicase-like | 1.33 | 1.48 | 7.93 E-04 | <0.05 |
| Eif5 | Eukaryotic
translation initiation factor 5 | −1.31 | −1.62 | 5.93 E-06 | <0.05 |
| Trim59 | Tripartite
motif-containing 59 | −1.32 | 1.44 | 9.21 E-04 | <0.05 |
| Jun | Jun
proto-oncogene | −1.32 | 1.57 | 2.00 E-04 | <0.05 |
| Etnk1 | Ethanolamine kinase
1 | −1.35 | −1.63 | 2.48 E-04 | <0.05 |
| Cacybp | Calcyclin binding
protein | −1.38 | −2.22 | 6.82 E-04 | <0.05 |
| Avpr1a | Arginine
vasopressin receptor 1A | −1.64 | −2.62 | 1.54 E-03 | <0.05 |
|
Hsp90aa1 | Heat shock protein
90, α (cytosolic), | −1.66 | −1.56 | 1.11 E-03 | <0.05 |
| class A member
1 | | | | |
| Bmpr2 | Bone morphogenetic
protein receptor, | −1.69 | −2.08 | 9.11 E-04 | <0.05 |
| type II
(serine/threonine kinase) | | | | |
| Hsph1 | Heat shock 105/110
protein 1 | −1.81 | −2.52 | 1.63 E-03 | <0.05 |
The significant DEGs with the most marked changes in
the 50 mg/kg CMS-treated group were selected (Table IV). Hepatitis A virus cellular
receptor 1 (Havcr1), lipocalin 2 (Lcn2) and secreted
phosphoprotein 1 (Spp1) are known to be representative
nephrotoxicity biomarkers, and these genes showed high expression
following CMS treatment. Kallikrein 1-related peptidase C4
(Klk1c4), Klk1c9 and Klk1c7 were significantly
downregulated; these genes are associated with the kinin-kallikrein
system, which is important for renal function (34). Gpx2 and Gsta3 were
significantly upregulated and downregulated, respectively; these
antioxidant genes are regulated by oxidative stress (35). These results indicated that gene
sets associated with nephrotoxicity were also regulated by CMS
under these experimental conditions.
| Table IVRepresentative gene lists and
expression values of 50 mg/kg CMS-treated rats. |
Table IV
Representative gene lists and
expression values of 50 mg/kg CMS-treated rats.
| Gene symbol | Gene name | Fold-change | Unadjusted
P-value | Adjusted FDR |
|---|
| Upregulated | | | | |
|
Havcr1 | Hepatitis A virus
cellular receptor 1 | 63.91 | 2.47 E-05 | <0.05 |
|
Lcn2 | Lipocalin 2 | 22.88 | 2.90 E-04 | <0.05 |
| Gpnmb | Glycoprotein
(transmembrane) nmb | 11.92 | 1.84 E-05 | <0.05 |
|
Spp1 | Secreted
phosphoprotein 1 | 11.21 | 1.80 E-03 | <0.05 |
| C4a | Complement
component 4A | 11.04 | 2.02 E-05 | <0.05 |
| Akr1b8 | Aldo-keto reductase
family 1, member B8 | 10.91 | 5.29 E-05 | <0.05 |
|
Serpina10 | Serpin peptidase
inhibitor, clade A (α-1 antiproteinase, antitrypsin), member
10 | 10.47 | 3.76 E-04 | <0.05 |
| Clu | Clusterin | 9.91 | 6.51 E-04 | <0.05 |
| Gpx2 | Glutathione
peroxidase 2 | 9.69 | 2.20 E-05 | <0.05 |
| Adamts1 | ADAM
metallopeptidase with thrombospondin type 1 motif, 1 | 8.60 | 7.63 E-05 | <0.05 |
| Downregulated | | | | |
|
Klk1c4 | Kallikrein
1-related peptidase C4 | −43.64 | 5.11 E-05 | <0.05 |
| Gtpbp4 | GTP binding protein
4 | −15.76 | 1.58 E-05 | <0.05 |
|
Klk1c9 | Kallikrein
1-related peptidase C9 | −7.73 | 1.45 E-04 | <0.05 |
|
Klk1c7 | Kallikrein
1-related peptidase C7 | −7.40 | 1.50 E-03 | <0.05 |
| Tm4sf20 | Transmembrane 4 L
six family member 20 | −5.10 | 1.23 E-03 | <0.05 |
| Sbspon | Somatomedin B and
thrombospondin, | −4.13 | 1.12 E-03 | <0.05 |
| type 1
domain-containing | | | |
| Mpped1 |
Metallophosphoesterase domain-containing
1 | −3.43 | 1.57 E-03 | <0.05 |
| Hacl1 | 2-Hydroxyacyl-CoA
lyase 1 | −3.39 | 1.34 E-03 | <0.05 |
| Gsta3 | Glutathione
S-transferase A3 | −3.36 | 1.07 E-03 | <0.05 |
| Mrap | Melanocortin 2
receptor accessory protein | −3.33 | 2.85 E-02 | <0.05 |
Pathway analysis
In the 25 mg/kg CMS group, IPA revealed the
significant canonical pathways were transforming growth factor
(TGF)-β, bone morphogenetic protein (BMP) and androgen signaling.
The canonical pathways of the 50 mg/kg CMS group were shown to be
significant in eIF2, regulation of eIF4/p70S6K, mammalian target of
rapamycin (mTOR), and aryl hydrocarbon receptor signaling, in
addition to cell cycle control of chromosomal replication (Table V). The fold-changes of the
top-ranked genes belonging to TGF-β and eIF2 are also represented
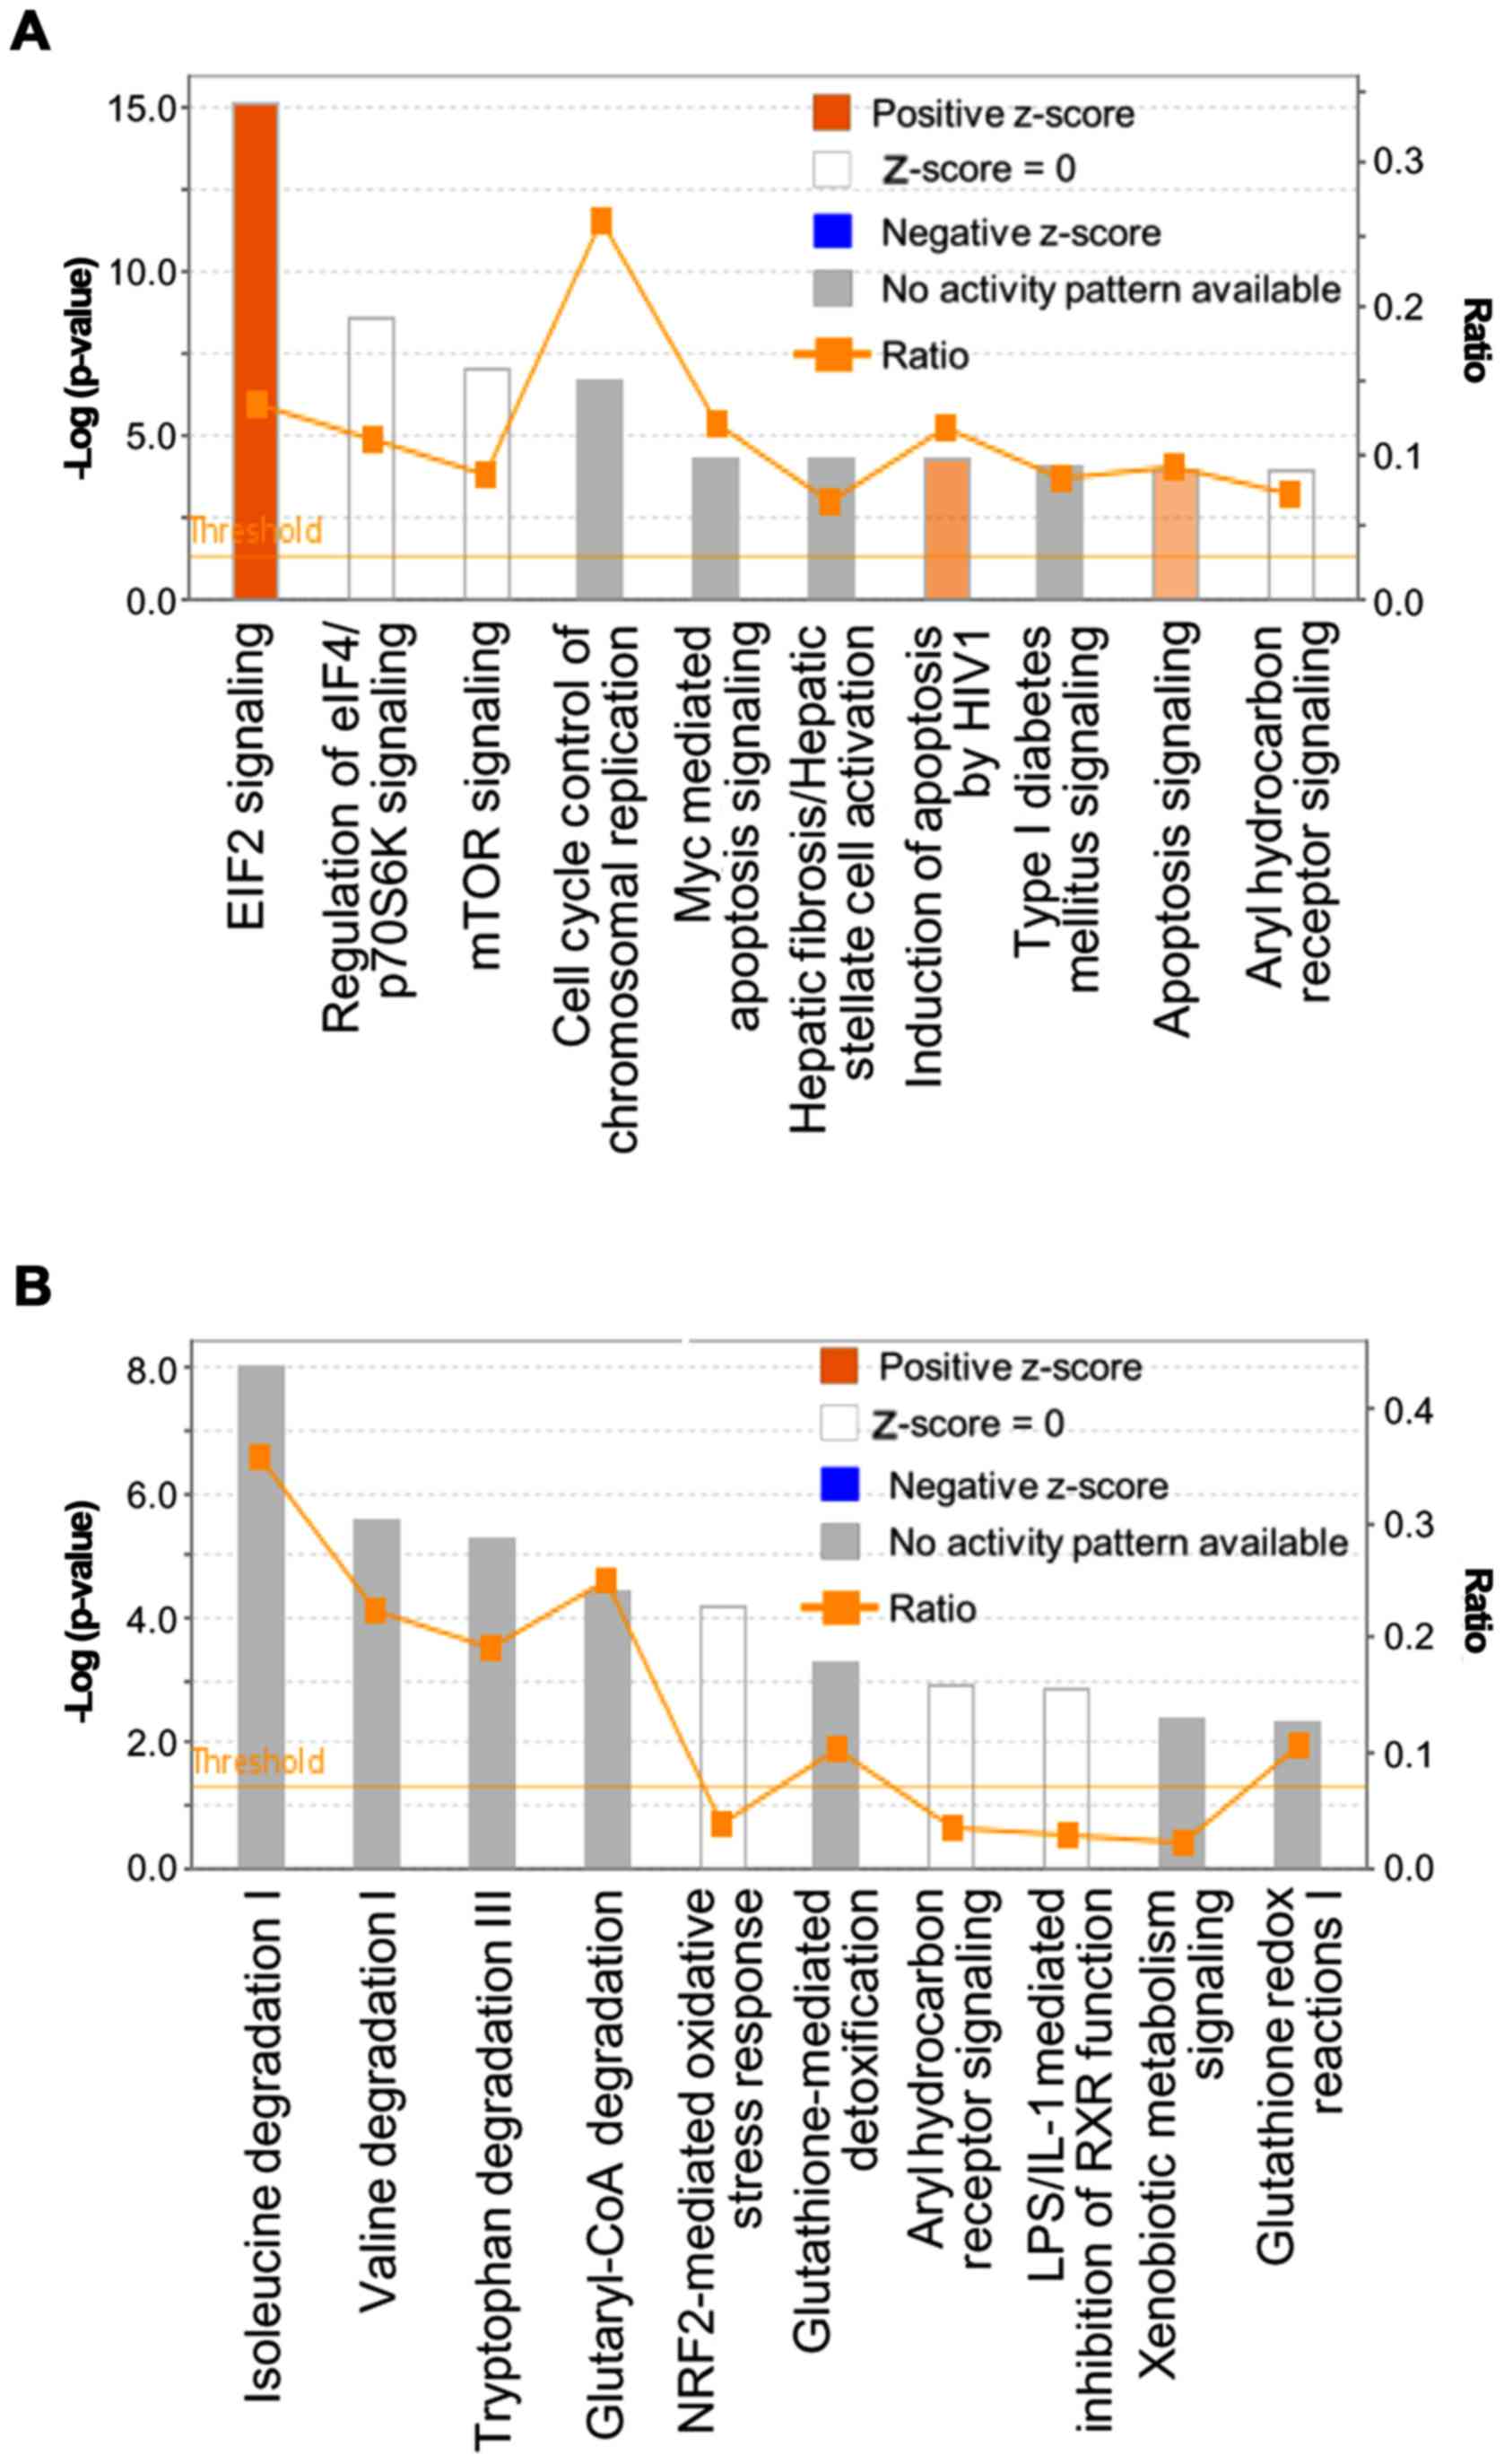
in Table VI. The canonical
pathways associated with the upregulated and downregulated genes
following 50 mg/kg CMS treatment were analyzed separately (Fig. 2A and B). Specifically, canonical
pathways associated with protein translation, cell cycle control
and apoptosis were predicted to be activated in the upregulated
genes. In the canonical analysis of the downregulated genes, there
was significance in pathways associated with amino acid metabolism
and oxidative stress. The expression levels of genes involved in
apoptosis and the cell cycle were upregulated, whereas the
expression levels of genes involved in the protective response to
oxidative stress were downregulated in the 50 mg/kg CMS-treated
group.
| Table VTop regulated canonical pathway of
DEGs from the CMS-treated kidney. |
Table V
Top regulated canonical pathway of
DEGs from the CMS-treated kidney.
| Top canonical
pathway | P-value | Overlapping ratio %
(n) |
|---|
| CMS (25 mg/kg) | | |
| TGF-β
signaling | 8.84E-07 | 4.6 (4/87) |
| BMP signaling
pathway | 3.84E-05 | 3.9 (3/76) |
| Androgen
signaling | 1.19E-04 | 2.7 (3/111) |
| Aldosterone
signaling in epithelial cells | 3.00E-04 | 2.0 (3/152) |
| PPARα/RXR
activation | 4.85E-04 | 1.7 (3/179) |
| CMS (50 mg/kg) | | |
| eIF2 signaling | 1.65E-28 | 25.4 (47/185) |
| Regulation of eIF4
and p70S6K signaling | 1.31E-11 | 17.1 (25/146) |
| mTOR signaling | 2.51E-11 | 14.9 (28/188) |
| Aryl hydrocarbon
receptor signaling | 1.60E-05 | 11.4 (16/140) |
| Cell cycle control
of chromosomal replication | 2.07E-05 | 25.9 (7/27) |
| Table VIExpressional changes of genes
involved in TGF-β, eIF2 and p53 signaling in CMS-treated
kidneys. |
Table VI
Expressional changes of genes
involved in TGF-β, eIF2 and p53 signaling in CMS-treated
kidneys.
| Gene symbol | Gene name | Fold-change
(log2) |
|---|
| TGF-β
signaling | | 25 mg/kg CMS |
| Inhbb | Inhibin subunit
βB | 1.37 |
| Znf423 | Zinc finger protein
423 | 1.31 |
| Jun | Jun proto-oncogene,
AP-1 transcription factor subunit | −1.33 |
| Bmpr2 | Bone morphogenetic
protein receptor type 2 | −1.70 |
| eIF2 signaling | | 50 mg/kg CMS |
| Nras | NRAS
proto-oncogene, gtpase | 1.84 |
| Rps19 | Ribosomal protein
S19 | 1.82 |
| Rpl36a | Ribosomal protein
L36A | 1.78 |
| Rps28 | Ribosomal protein
S28 | 1.72 |
| Rpsa | Ribosomal protein
SA | 1.72 |
| Rpl18a | Ribosomal protein
l18a | 1.70 |
| Pik3c2b |
Phosphatidylinositol-4-phosphate 3-kinase
catalytic subunit type 2β | 1.69 |
| Rpl3 | Ribosomal protein
L3 | 1.69 |
| Rpl13 | Ribosomal protein
L13 | 1.63 |
| Eif5 | Eukaryotic
translation initiation factor 5 | -2.08 |
| p53 signaling | | 50 mg/kg CMS |
| Apaf1 | Apoptotic peptidase
activating factor 1 | 1.18 |
| Cdkn1a | Cyclin dependent
kinase inhibitor 1A | 0.92 |
| Fas | Fas cell surface
death receptor | 0.92 |
| Cdk4 | Cyclin dependent
kinase 4 | 0.80 |
| Pik3c2b |
Phosphatidylinositol-4-phosphate 3-kinase
catalytic subunit type 2β | 0.76 |
| Bbc3 | BCL2 binding
component 3 | 0.74 |
| Jun | Jun proto-oncogene,
AP-1 transcription factor subunit | 0.66 |
| Csnk1d | Casein kinase
1δ | 0.52 |
| Hipk2 | Homeodomain
interacting protein kinase 2 | −0.48 |
| Kat2b | Lysine
acetyltransferase 2B | −0.78 |
Several investigations have reported that TGF-β and
BMP signaling are significantly affected by nephrotoxic compounds,
including tacrolimus and cyclosporine (36,37). TGF-β acts as a key mediator in
renal disease given its functions in renal inflammation, apoptosis
and differentiation (38). BMPs
belong to the TGF-β family, and TGF-β/BMP signaling is important in
kidney development and renal cell proliferation (39). This result demonstrated that
TGF-β/BMP signalling may be activated to cause proliferation of
kidney cells following the initial damage caused by CMS. eIF2,
regulation of eIF4 and p70S6K, and the mTOR signalling pathway were
significantly altered following CMS treatment. These pathways are
activated for survival and recovery from cellular stresses,
including oxidative or proteotoxic stress (40,41).
PPI and upstream regulator analysis
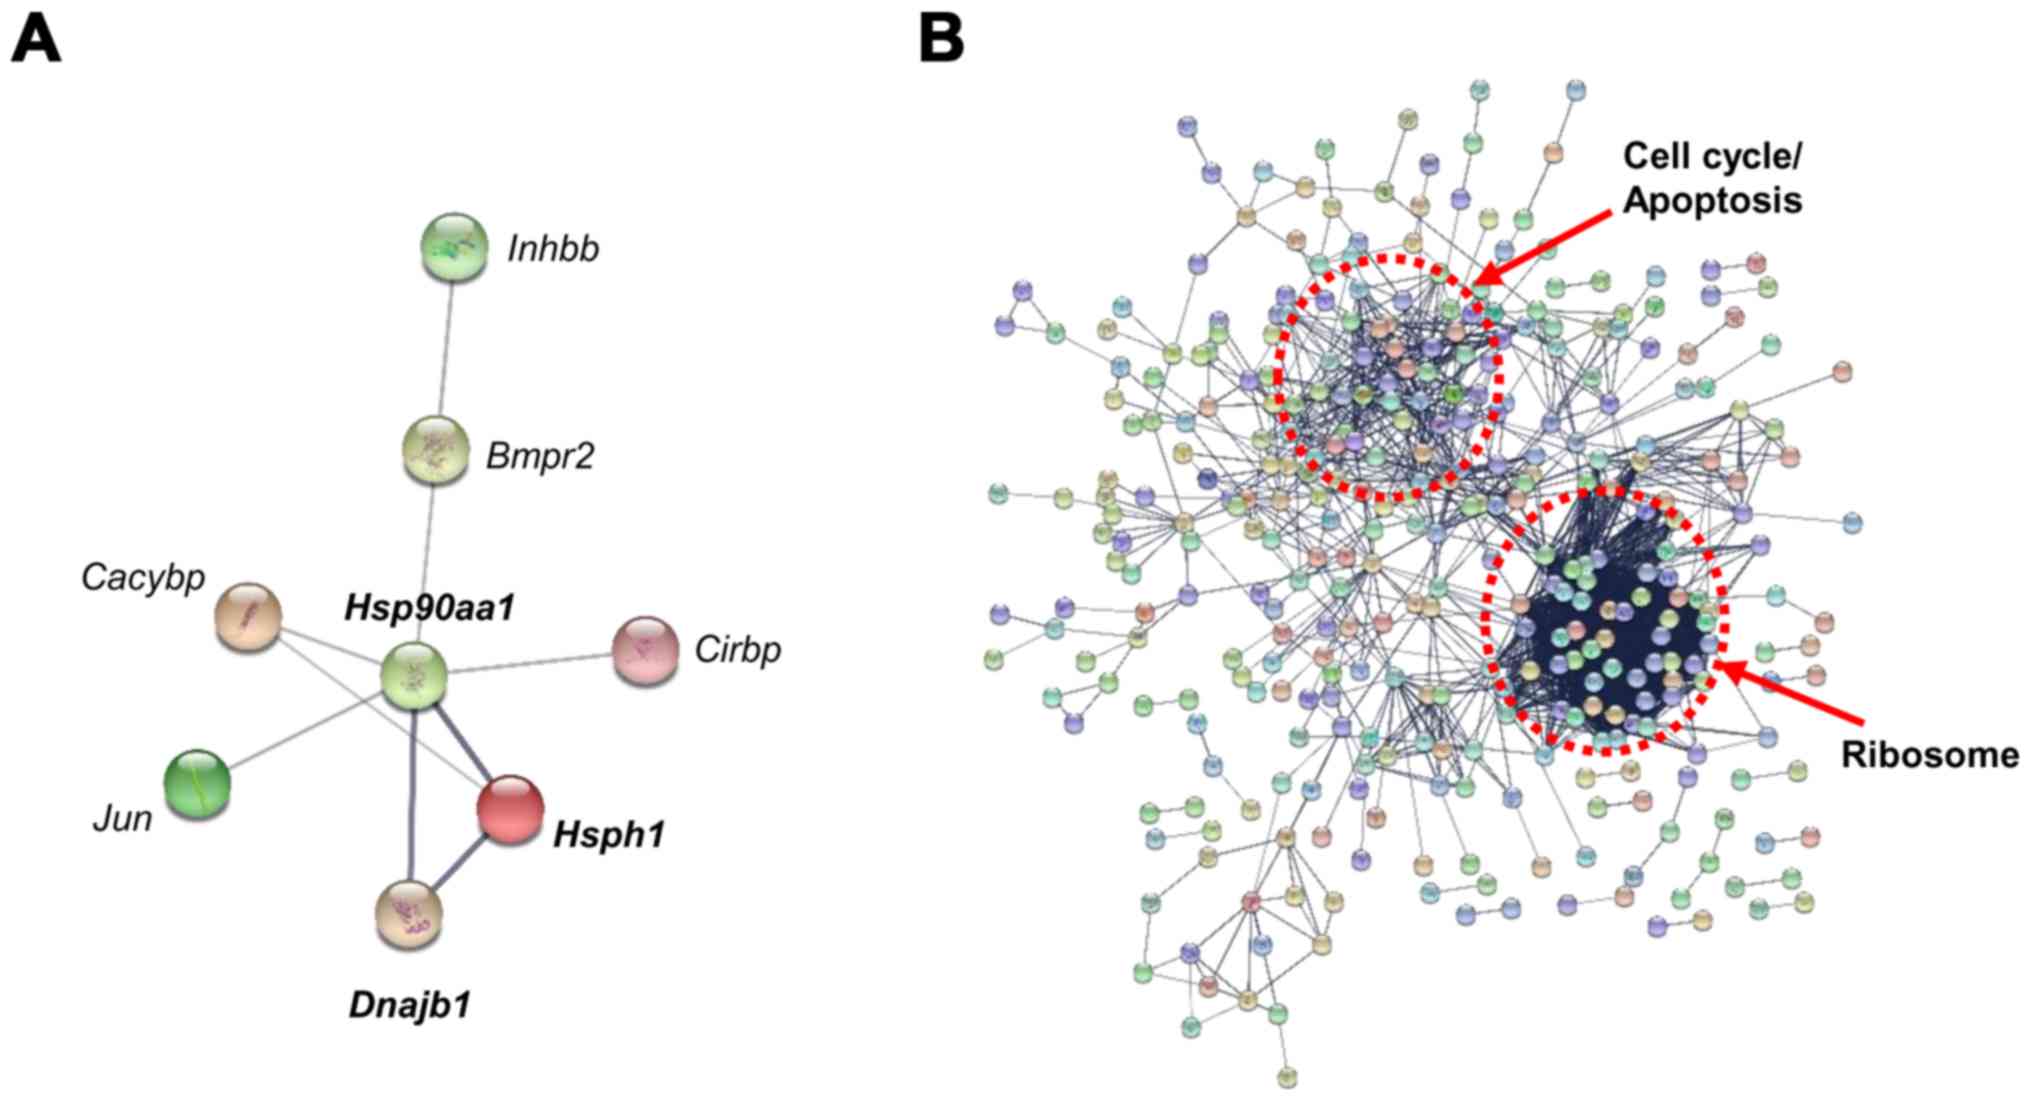
PPI analysis was performed with the DEGs from each
group using STRING (v.10) software (Fig. 3). With the DEGs identified in the
25 mg/kg CMS treatment group, the protein interaction analysis
showed connections among Hsph1, Hsp90aa1,
Dnajb1, Jun proto-oncogene (Jun), Cacybp,
Bmpr2 and Inhbb with a confidence score of 0.400
(Fig. 3A). In particular, strong
associations were observed among Hsph1, Hsp90 and
Dnajb1 (Hsp40), and the heat shock factor 1
(Hsf1) transcription factor is known to regulate the
expression of these genes. The protein interaction analysis of the
DEGs of the 50 mg/kg CMS treatment group, conducted with a
confidence score of 0.700, is shown in Fig. 3B. The PPI pathways were primarily
grouped into ribosome, cell cycle, and apoptosis categories using
KEGG pathway enrichment. The PPI analysis indicated that
Hsph1, Hsp90 and Dnajb1 function as key nodes
in the gene regulatory network during initial nephrotoxicity
induced by 25 mg/kg CMS treatment.
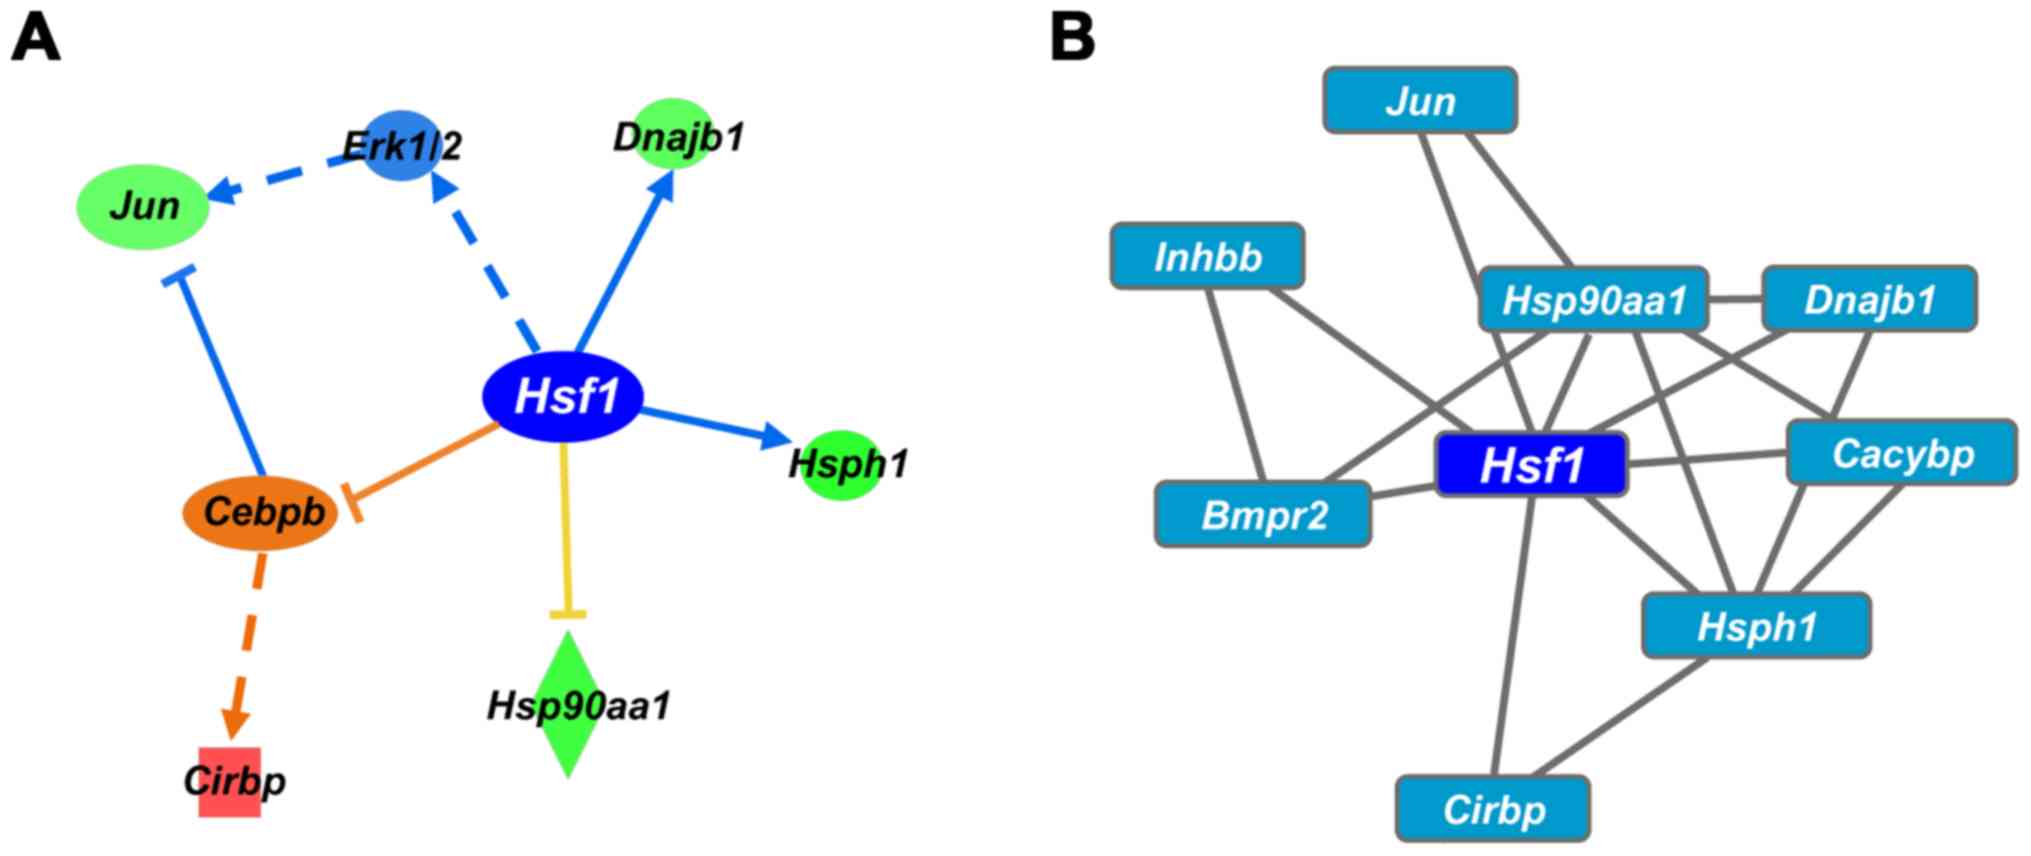
To define the key regulators that trigger
colistin-induced nephrotoxicity, transcriptional regulators of the
DEGs following CMS treatment (25 mg/kg) were analyzed using IPA and
Cytoscape software iRegulon. Hsf1 was selected as the
primary gene based on the upstream and causal analysis of IPA. The
IPA analysis revealed that Hsf1 regulates the expression of
Hsp1, Hsp90aa1, Dnajb1 (Hsp40),
Jun and Cirbp (Fig.
4A). Hsf1 is predicted to inhibit the expression of its
target gene. Hsf1 was also selected as the top transcription
factor in the iRegulon analysis (Fig.
4B). Collectively, Hsf1 was identified as a master
transcription factor regulating gene expression in colistin-induced
nephrotoxicity.
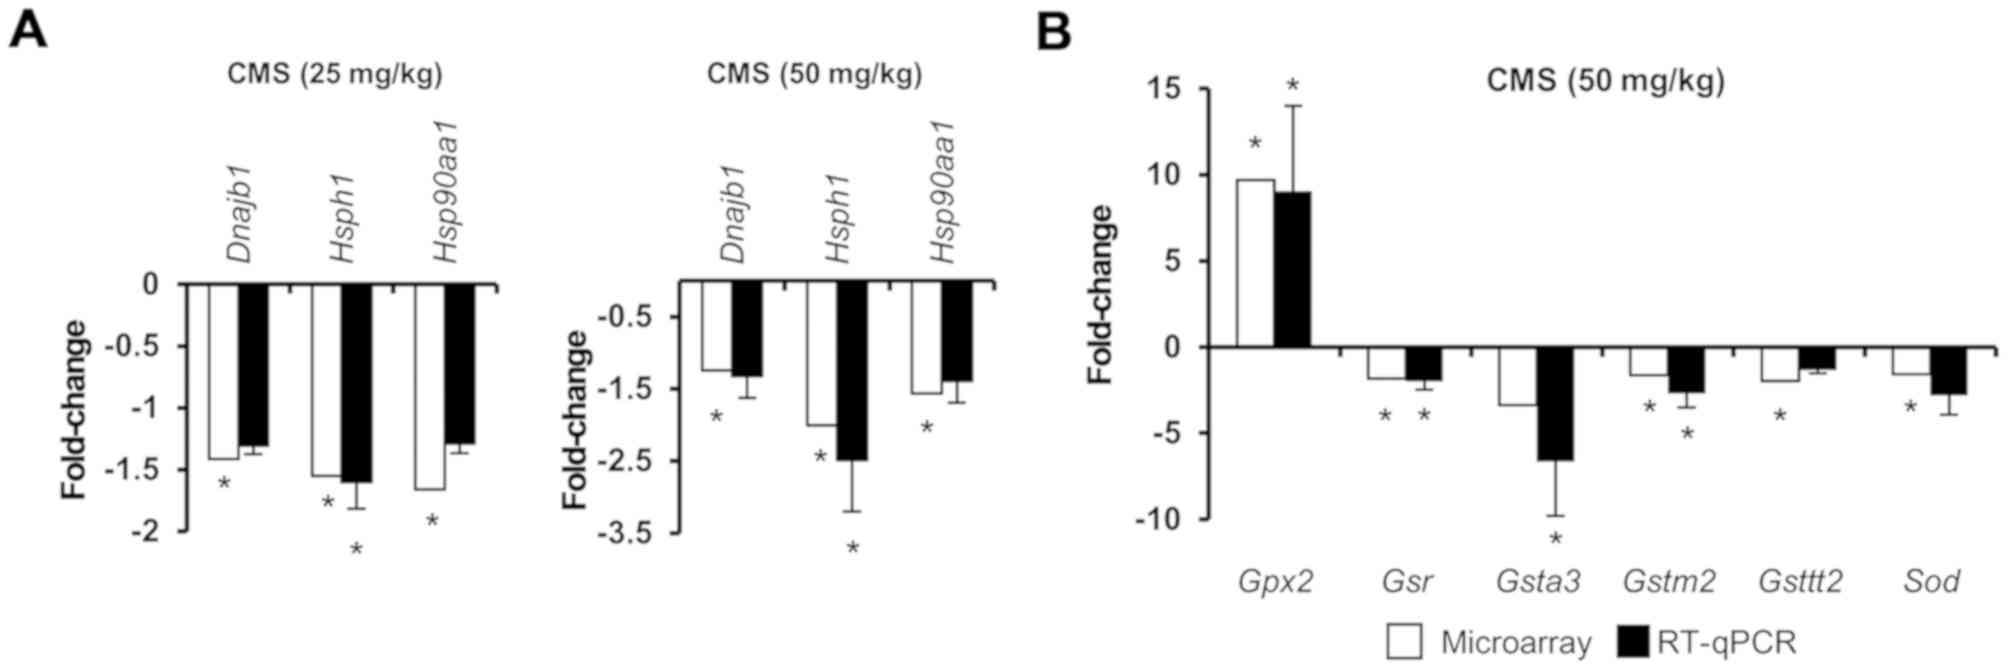
To validate the microarray data, RT-qPCR analysis
was conducted (Fig. 5). Analysis
of the expression of Hsf1 target genes and Nrf2-mediated
oxidative stress genes by microarray and RT-qPCR analyses indicated
that these methods produced similar results. The expression levels
of Dnajb1, Hsph1 and Hsp90aa1 were inhibited
by both doses of CMS (Fig. 5A).
With 25 mg/kg CMS treatment, no significant changes were observed
in the expression levels of Nrf2-mediated oxidative stress genes
when analyzed by microarray and RT-qPCR analyses (data not shown).
However, the expression of Nrf2-mediated oxidative stress genes
were significantly altered in the 50 mg/kg CMS-treated group; these
results were consistent in both analyses (Fig. 5B). The expression of Hsf1
target genes and Nrf2-mediated oxidative stress genes were
confirmed by RT-qPCR analysis.
Hsf1 is a major transcriptional regulator that binds
heat shock elements in the promoter of heat shock proteins
(42) and triggers the activation
of Hsp genes in response to environmental stresses (43). Hsf1 is critical in regulating
physiological events during development and pathological conditions
(43). It has been reported that
nephrotoxic compounds induce the synthesis of Hsp proteins in the
kidney prior to the increase in classical biochemical markers for
nephrotoxicity becoming apparent (44). Cyclosporine, a nephrotoxic drug,
induces a heat shock response (45) and Di (2-ethylhexyl) phthalate also
induces nephrotoxicity by inhibiting the HSF-dependent heat shock
response (46). In the present
study, the activity of Hsf1 was predicted, and its target genes
increased with CMS treatment. This finding demonstrated that Hsf1
may be a key regulator in defense against pathological lesions in
the kidney through activation of the heat shock response.
Mapping the canonical pathway of DEGs to
an AOP
A number of AOP frameworks associated with
nephrotoxicity have been investigated as part of the OECD work plan
(https://www.aopkb.oecd.org).
Cyclooxygenase 1 and agonism of the estrogen receptor have been
suggested as potential MIEs, although there is limited
understanding of MIE and KE molecules. The present study suggested
a putative framework for a nephrotoxicity AOP that integrates
-omics data, blood biochemistry, histopathology and data from
publications on colistin-induced nephrotoxicity, although further
validation is necessary to build an AOP model with a sufficient
weight of evidence. In the present study, serum and histological
observations suggested that nephrotoxicity resulted from CMS, and
key pathways and master regulatory were comprehensively analyzed
based on phenotype-anchored gene expression profiles. The
phenotype-anchored gene expression and observed high expression of
well-known nephrotoxic biomarkers, including the Kim1
(hepatitis A virus cellular receptor 1), Lcn2, Spp1
and Klklc families, were analyzed in the group treated with
50 mg/kg CMS. The key pathways and master regulators associated
with the nephrotoxicity induced by CMS were then analyzed. The gene
expression of heat shock-related proteins was significantly
inhibited in the low-dose group, and the inhibition of the heat
shock response may be a potential MIE. In the master regulator gene
analysis, it was found that Hsf1 significantly regulated the
expression of those genes in the CMS-treated kidney (25 mg/kg).
Proteotoxic stress is triggered by an imbalance of proteostasis,
which is a biological pathway that maintains cellular homeostasis
from cellular stress and is predominantly controlled by Hsf1
(47–49). To maintain proteostasis, the
proteostasis network is regulated by ribosomes, chaper-ones and the
proteasome (50). Chaperones,
including HSPs, function to prevent protein misfolding and maintain
protein homeostasis, and the transcription of these genes is
regulated by HSFs (51,52).
Previous studies have shown that colistin binds to
the N-domain of HSP90 and suppresses chaperone activity (53,54). Therefore, it is hypothesized that
colistin binds to Hsp90 and inhibits the transcriptional activity
of Hsf1. As a result, proteotoxicity is induced due to decreased
protective function against stress. From these results, a potential
MIE was predicted through a process in which hsp90 is bound to a
drug and induces proteotoxicity.
The KEs and KERs were predicted by the canonical
pathways of the DEGs and data from other publications. Based on the
results of the pathway analysis, it was possible to identify KEs at
the molecular level and develop the structure of the framework by
linking the KERs with literature data. In the pathway analysis of
the upregulated DEGs following 50 mg/kg CMS treatment, it was found
that the important pathways were eIF2, regulation of eIF4/p70S6K,
mTOR, apoptosis signaling, and cell cycle control. In the pathway
analysis of the downregulated DEGs, the important pathways were
amino acid degradation, Nrf2-mediated oxidative stress response and
glutathione-mediated detoxification signaling. In addition,
ribosomes, cell cycle arrest, and apoptosis pathways were selected
as representative pathways in the PPI analysis.
Proteotoxic stress can be induced by the impairment
of cellular function caused by protein misfolding (50). The signaling pathways associated
with translation factors, including eIF2 and eIF4, are modulated
for recovery from proteotoxic stress (41,55). mTOR signaling is related to
responses to proteotoxic stress and is also related to HSF
activation and synthesis of HSPs (40). The expression of antioxidant genes
(Sod and Gpx) are downregulated by CMS, as observed
in previous investigations (14).
Nrf2-mediated oxidative stress signaling and glutathione signaling
are known to be involved in oxidative stress, and the expression
levels of these genes are downregulated by CMS treatment (56). This indicates that the antioxidant
response is inhibited by colistin. Cell cycle arrest and apoptosis
signaling via the mitochondrial, death receptor, and endoplasmic
reticulum pathways have already been shown to be involved in
colistin-induced nephrotoxicity (14,15). In the present study, genes related
to p53 signaling were also significantly differentially regulated
in the CMS-treated kidneys (Table
VI). This suggested that these pathways are KEs of this AOP and
that these KEs are related to each other.
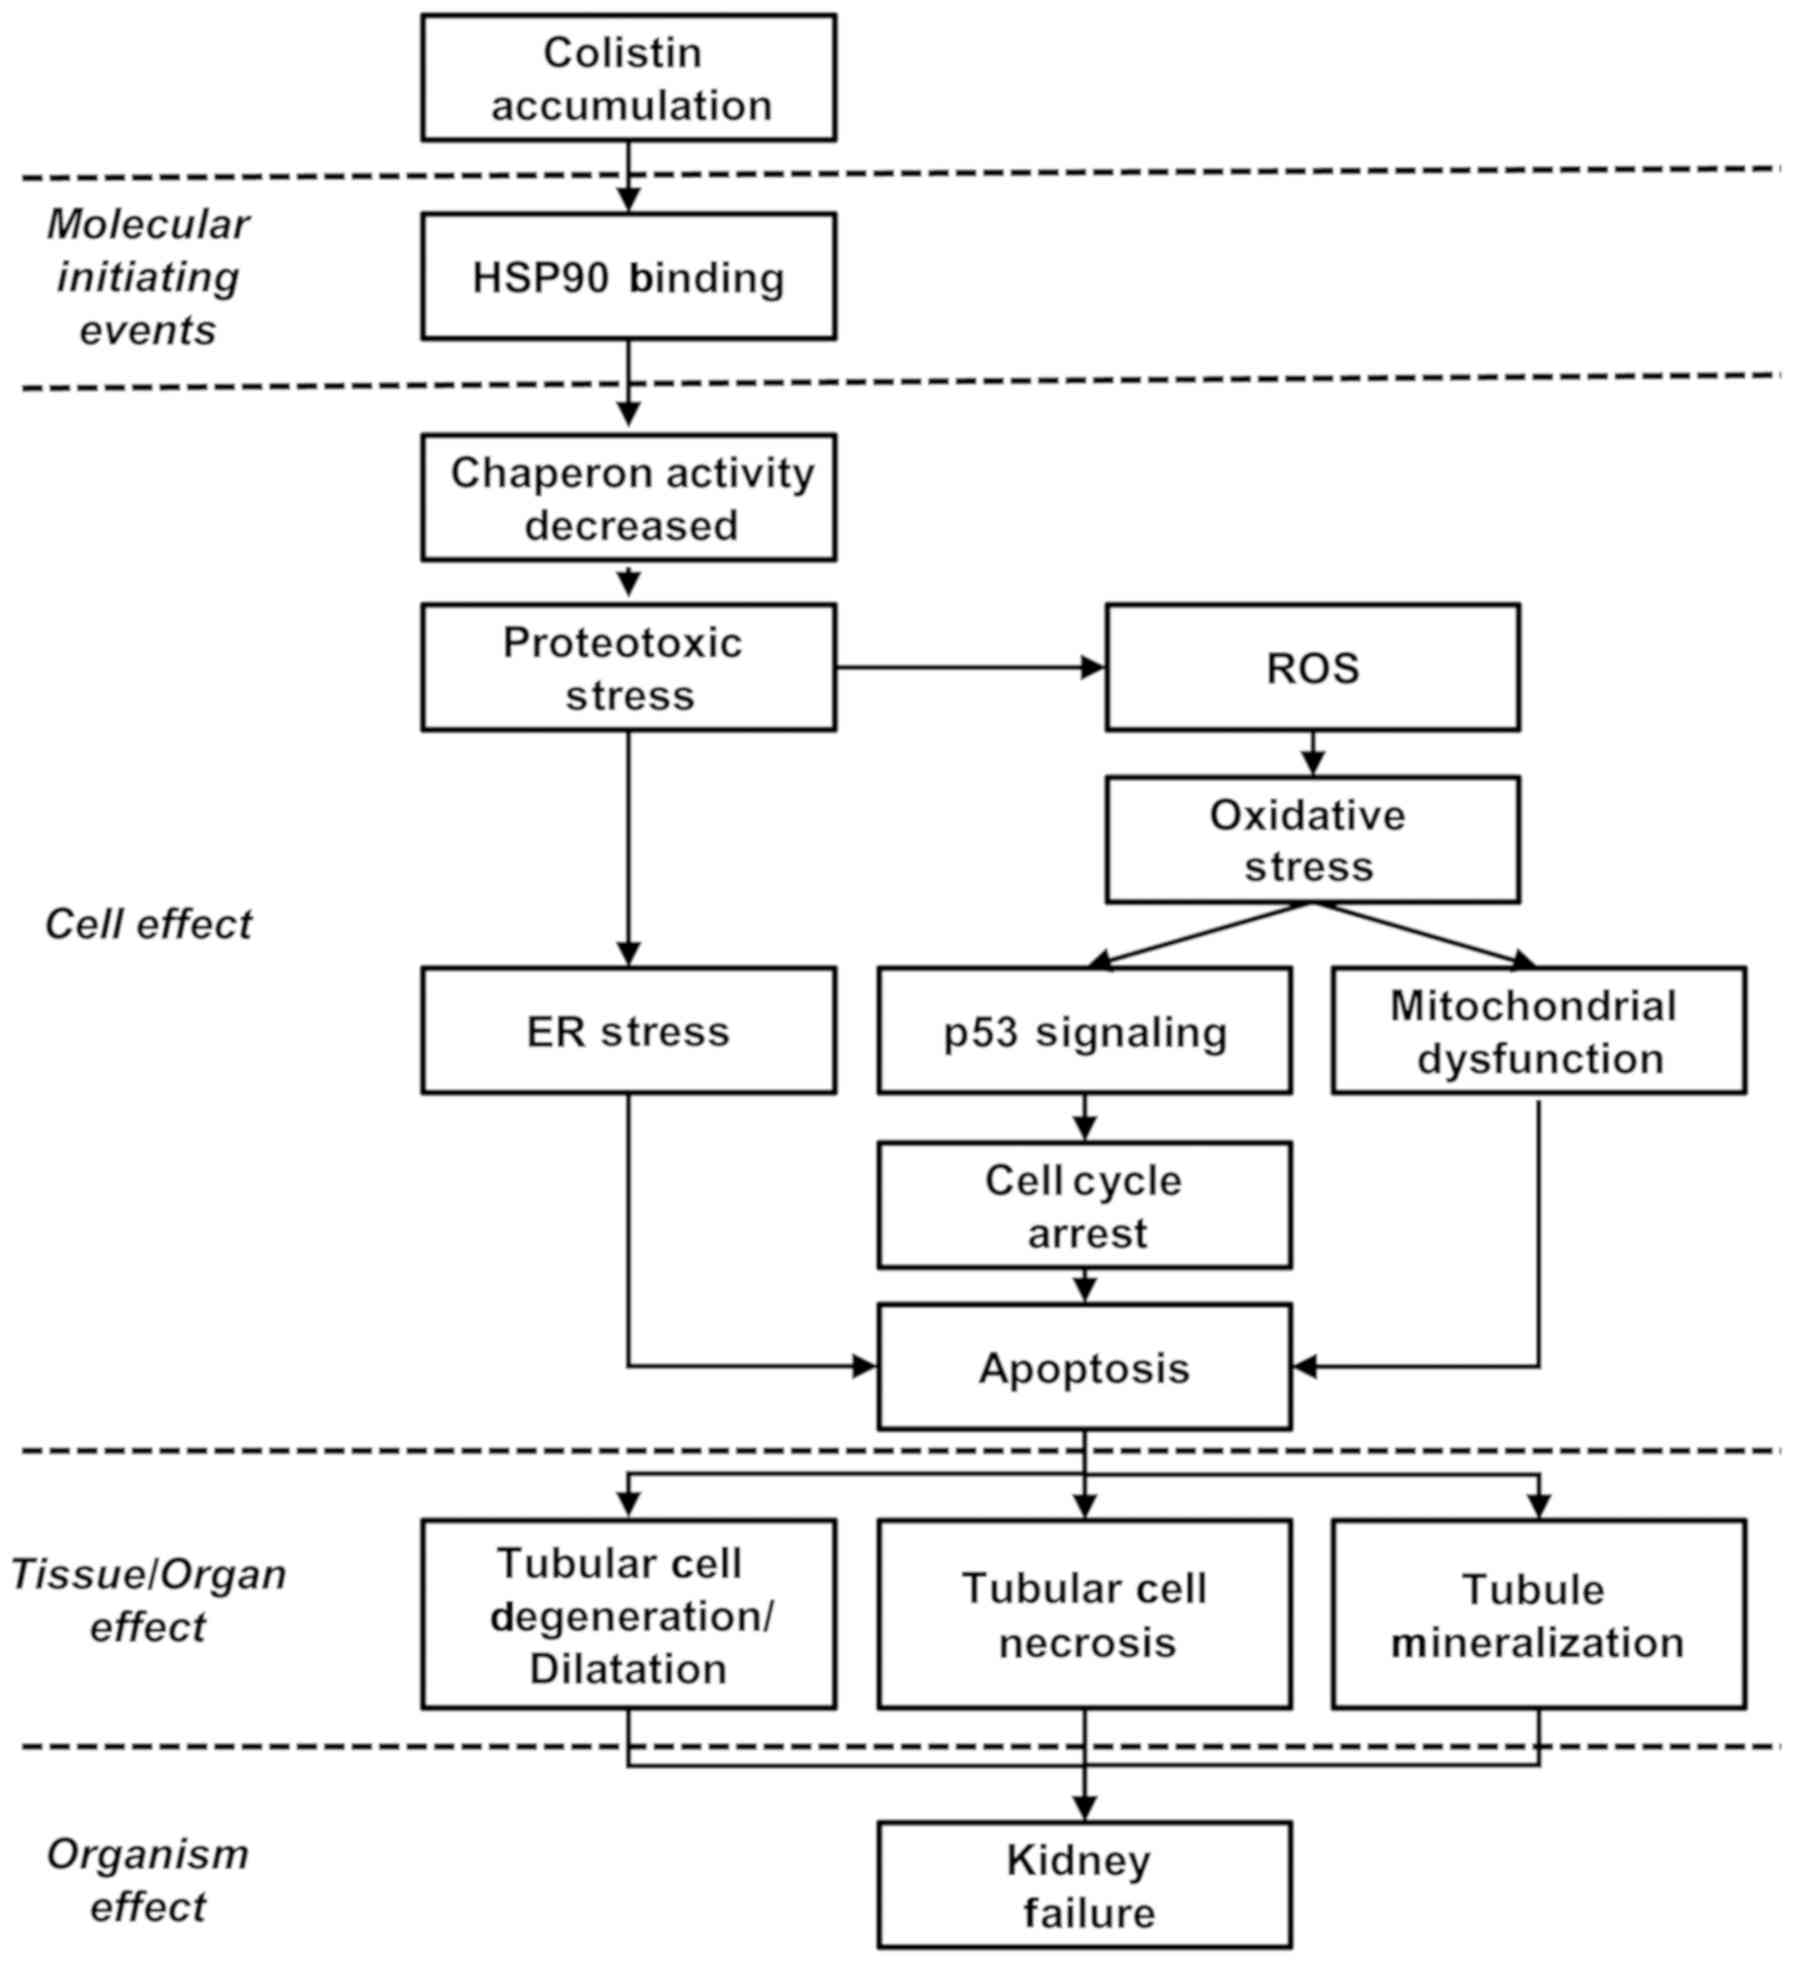
The present study hypothesized that proteotoxic
stress may occur through the suppression of HSPs and the
antioxidant response. It was hypothesized that oxidative stress and
ER stress are involved as KEs through the activation of eIF2
signaling and mTOR signaling. In addition, cell cycle arrest and
apoptosis represents major events in cell death, and these major
pathways may be elements of KEs. The binding of colistin to HSP90
inhibits chaperone activity and induces proteotoxic stress, which
results in oxidative stress. ROS produced by oxidative stress
induces ER stress, mitochondrial injury, cell cycle arrest and
apoptosis, leading to cell death. These KEs have been confirmed in
the results of previous publications (14). The AOP of renal toxicity can be
explained by the biochemical and histopathological results in
addition to analysis of previous literature (Fig. 6).
In the present study, a putative AOP for
nephrotoxicity induced by colistin was suggested using global gene
expression profiling. Omics approaches are considered suitable
tools to provide information on putative AOPs. Gene expression
changes can offer molecular insights regarding the initial events,
but have limitations as they reflect a snapshot of a rapidly
changing gene set in certain circumstances. Despite the limitations
of microarray approaches, further information on MIE and KEs is
required to develop the AOP networking model. However, AOPs
ultimately aim to suggest qualitative or quantitative approaches to
assess toxicity, and further validation is necessary to strengthen
the weight of evidence for the putative AOP model.
In conclusion, gene expression analysis was
performed in the present study to evaluate the mechanism of
nephrotoxicity induced by colistin. It was found that the
expression levels of HSF1 target genes, including Hsp90aa1,
Hsph1 and Dnajb1 (Hsp40), were downregulated
by colistin, and the expression levels of Nrf2-mediated oxidative
stress genes were also down-regulated following treatment with a
high dose of colistin. HSF1 and Nrf2 are known to be associated
with protection against various forms of stress and to compensate
for each other (57). Based on
these results, a framework for an AOP of colistin-induced
nephrotoxicity was constructed, which can facilitate an improved
understanding of the mechanism of renal toxicity.
Funding
The present study was supported by the Ministry of
Food and Drug Safety (grant no. 13182MFDS988), the Ministry of
Science and ICT (grant no. NRF-2016M3A9C4953144), the Ministry of
Education (grant no. 2017R1A6A3A01011544) and the Korea Institute
of Toxicology (grant no. KK-1801).
Availability of data and materials
All data generated or analysed during the present
study are included in this published article.
Authors' contributions
EHL contributed to the analysis and interpretation
of data and was involved in drafting the manuscript. SK and MSC
contributed to analysis of microarray data. HY contributed to
RT-qPCR analysis. SMP and HAO contributed to the micro-array
experiment. KSM contributed to the animal experiments. JSH and YBK
contributed to histopathologic observation. SY and JHO contributed
to conception and design of the study and revised the manuscript
critically.
Ethics approval and consent to
participate
All experiments were approved by the IACUC of Korea
Institute of Toxicology (approval no. 1404-0120) and conducted in
accordance with the Association of Assessment and Accreditation of
Laboratory Animal Care International guidelines.
Patient consent for publication
Not applicable.
Competing interests
The authors declare that they have no competing
interests.
Acknowledgments
Not applicable.
References
|
1
|
Bergen PJ, Li J, Rayner CR and Nation RL:
Colistin methane-sulfonate is an inactive prodrug of colistin
against Pseudomonas aeruginosa. Antimicrob Agents Chemother.
50:1953–1958. 2006. View Article : Google Scholar : PubMed/NCBI
|
|
2
|
Nation RL and Li J: Colistin in the 21st
century. Curr Opin Infect Dis. 22:535–543. 2009. View Article : Google Scholar : PubMed/NCBI
|
|
3
|
Falagas ME and Kasiakou SK: Colistin: The
revival of polymyxins for the management of multidrug-resistant
gram-negative bacterial infections. Clin Infect Dis. 40:1333–1341.
2005. View
Article : Google Scholar : PubMed/NCBI
|
|
4
|
Evans ME, Feola DJ and Rapp RP: Polymyxin
B sulfate and colistin: Old antibiotics for emerging multiresistant
gram-negative bacteria. Ann Pharmacother. 33:960–967. 1999.
View Article : Google Scholar : PubMed/NCBI
|
|
5
|
Li J, Nation RL, Turnidge JD, Milne RW,
Coulthard K, Rayner R and Paterson DL: Colistin: The re-emerging
antibiotic for multidrug-resistant Gram-negative bacterial
infections. Lancet Infect Dis. 6:589–601. 2006. View Article : Google Scholar : PubMed/NCBI
|
|
6
|
Wallace SJ, Li J, Nation RL, Rayner CR,
Taylor D, Middleton D, Milne RW, Coulthard K and Turnidge JD:
Subacute toxicity of colistin methanesulfonate in rats: Comparison
of various intravenous dosage regimens. Antimicrob Agents
Chemother. 52:1159–1161. 2008. View Article : Google Scholar : PubMed/NCBI
|
|
7
|
Ma Z, Wang J, Nation RL, Li J, Turnidge
JD, Coulthard K and Milne RW: Renal disposition of colistin in the
isolated perfused rat kidney. Antimicrob Agents Chemother.
53:2857–2864. 2009. View Article : Google Scholar : PubMed/NCBI
|
|
8
|
Spapen H, Jacobs R, Van Gorp V, Troubleyn
J and Honoré PM: Renal and neurological side effects of colistin in
critically ill patients. Ann Intensive Care. 1:142011. View Article : Google Scholar : PubMed/NCBI
|
|
9
|
Dropulic LK and Cohen JI: Severe viral
infections and primary immunodeficiencies. Clin. Infect Dis.
53:897–909. 2011. View Article : Google Scholar
|
|
10
|
Price DJ and Graham DI: Effects of large
doses of colistin sulphomethate sodium on renal function. BMJ.
4:525–527. 1970. View Article : Google Scholar : PubMed/NCBI
|
|
11
|
Hartzell JD, Neff R, Ake J, Howard R,
Olson S, Paolino K, Vishnepolsky M, Weintrob A and Wortmann G:
Nephrotoxicity associated with intravenous colistin (colistimethate
sodium) treatment at a tertiary care medical center. Clin Infect
Dis. 48:1724–1728. 2009. View
Article : Google Scholar : PubMed/NCBI
|
|
12
|
Yousef JM, Chen G, Hill PA, Nation RL and
Li J: Ascorbic acid protects against the nephrotoxicity and
apoptosis caused by colistin and affects its pharmacokinetics. J
Antimicrob Chemother. 67:452–459. 2012. View Article : Google Scholar :
|
|
13
|
Ozkan G, Ulusoy S, Orem A, Alkanat M,
Mungan S, Yulug E and Yucesan FB: How does colistin-induced
nephropathy develop and can it be treated? Antimicrob Agents
Chemother. 57:3463–3469. 2013. View Article : Google Scholar : PubMed/NCBI
|
|
14
|
Dai C, Li J, Tang S, Li J and Xiao X:
Colistin-induced nephrotoxicity in mice involves the mitochondrial,
death receptor, and endoplasmic reticulum pathways. Antimicrob
Agents Chemother. 58:4075–4085. 2014. View Article : Google Scholar : PubMed/NCBI
|
|
15
|
Eadon MT, Hack BK, Alexander JJ, Xu C,
Dolan ME and Cunningham PN: Cell cycle arrest in a model of
colistin nephrotoxicity. Physiol Genomics. 45:877–888. 2013.
View Article : Google Scholar : PubMed/NCBI
|
|
16
|
Yousef JM, Chen G, Hill PA, Nation RL and
Li J: Melatonin attenuates colistin-induced nephrotoxicity in rats.
Antimicrob Agents Chemother. 55:4044–4049. 2011. View Article : Google Scholar : PubMed/NCBI
|
|
17
|
Ghlissi Z, Hakim A, Sila A, Mnif H, Zeghal
K, Rebai T, Bougatef A and Sahnoun Z: Evaluation of efficacy of
natural astaxanthin and vitamin E in prevention of colistin-induced
nephrotoxicity in the rat model. Environ Toxicol Pharmacol.
37:960–966. 2014. View Article : Google Scholar : PubMed/NCBI
|
|
18
|
Dai C, Tang S, Deng S, Zhang S, Zhou Y,
Velkov T, Li J and Xiao X: Lycopene attenuates colistin-induced
nephrotoxicity in mice via activation of the Nrf2/HO-1 pathway.
Antimicrob Agents Chemother. 59:579–585. 2015. View Article : Google Scholar :
|
|
19
|
Bourdon-Lacombe JA, Moffat ID, Deveau M,
Husain M, Auerbach S, Krewski D, Thomas RS, Bushel PR, Williams A
and Yauk CL: Technical guide for applications of gene expression
profiling in human health risk assessment of environmental
chemicals. Regul Toxicol Pharmacol. 72:292–309. 2015. View Article : Google Scholar : PubMed/NCBI
|
|
20
|
LaLone CA, Ankley GT, Belanger SE, Embry
MR, Hodges G, Knapen D, Munn S, Perkins EJ, Rudd MA, Villeneuve DL,
et al: Advancing the adverse outcome pathway framework-An
international horizon scanning approach. Environ Toxicol Chem.
36:1411–1421. 2017. View Article : Google Scholar : PubMed/NCBI
|
|
21
|
Wittwehr C, Aladjov H, Ankley G, Byrne HJ,
de Knecht J, Heinzle E, Klambauer G, Landesmann B, Luijten M,
MacKay C, et al: How adverse outcome pathways can aid the
development and use of computational prediction models for
regulatory toxicology. Toxicol Sci. 155:326–336. 2017. View Article : Google Scholar :
|
|
22
|
Brockmeier EK, Hodges G, Hutchinson TH,
Butler E, Hecker M, Tollefsen KE, Garcia-Reyero N, Kille P, Becker
D, Chipman K, et al: The role of omics in the application of
adverse outcome pathways for chemical risk assessment. Toxicol Sci.
158:252–262. 2017. View Article : Google Scholar : PubMed/NCBI
|
|
23
|
Lowthert L, Leffert J, Lin A, Umlauf S,
Maloney K, Muralidharan A, Lorberg B, Mane S, Zhao H, Sinha R, et
al: Increased ratio of anti-apoptotic to pro-apoptotic Bcl2
gene-family members in lithium-responders one month after treatment
initiation. Biol Mood Anxiety Disord. 2:152012. View Article : Google Scholar : PubMed/NCBI
|
|
24
|
Jiménez-Marín Á, Collado-Romero M,
Ramirez-Boo M, Arce C and Garrido JJ: Biological pathway analysis
by ArrayUnlock and ingenuity pathway analysis. BMC Proc. 3(Suppl
4): S62009. View Article : Google Scholar : PubMed/NCBI
|
|
25
|
Cline MS, Smoot M, Cerami E, Kuchinsky A,
Landys N, Workman C, Christmas R, Avila-Campilo I, Creech M, Gross
B, et al: Integration of biological networks and gene expression
data using Cytoscape. Nat Protoc. 2:2366–2382. 2007. View Article : Google Scholar : PubMed/NCBI
|
|
26
|
Son MY, Kim YD, Seol B, Lee MO, Na HJ, Yoo
B, Chang JS and Cho YS: Biomarker Discovery by Modeling Behçet's
Disease with Patient-Specific Human Induced Pluripotent Stem Cells.
Stem Cells Dev. 26:133–145. 2017. View Article : Google Scholar
|
|
27
|
Szklarczyk D, Franceschini A, Kuhn M,
Simonovic M, Roth A, Minguez P, Doerks T, Stark M, Muller J, Bork
P, et al: The STRING database in 2011: Functional interaction
networks of proteins, globally integrated and scored. Nucleic Acids
Res. 39(Database): D561–D568. 2011. View Article : Google Scholar :
|
|
28
|
Kanehisa M, Goto S, Furumichi M, Tanabe M
and Hirakawa M: KEGG for representation and analysis of molecular
networks involving diseases and drugs. Nucleic Acids Res.
38:D355–D360. 2010. View Article : Google Scholar :
|
|
29
|
Livak KJ and Schmittgen TD: Analysis of
relative gene expression data using real-time quantitative PCR and
the 2−ΔΔCT method. Methods. 25:402–408. 2001. View Article : Google Scholar
|
|
30
|
Santoro MG: Heat shock factors and the
control of the stress response. Biochem Pharmacol. 59:55–63. 2000.
View Article : Google Scholar
|
|
31
|
Morimoto RI: Proteotoxic stress and
inducible chaperone networks in neurodegenerative disease and
aging. Genes Dev. 22:1427–1438. 2008. View Article : Google Scholar : PubMed/NCBI
|
|
32
|
Hensen SM, Heldens L, van Enckevort CM,
van Genesen ST, Pruijn GJ and Lubsen NH: Heat shock factor 1 is
inactivated by amino acid deprivation. Cell Stress Chaperones.
17:743–755. 2012. View Article : Google Scholar : PubMed/NCBI
|
|
33
|
Qiao S, Lamore SD, Cabello CM, Lesson JL,
Muñoz-Rodriguez JL and Wondrak GT: Thiostrepton is an inducer of
oxidative and proteotoxic stress that impairs viability of human
melanoma cells but not primary melanocytes. Biochem Pharmacol.
83:1229–1240. 2012. View Article : Google Scholar : PubMed/NCBI
|
|
34
|
Moreau ME, Garbacki N, Molinaro G, Brown
NJ, Marceau F and Adam A: The kallikrein-kinin system: Current and
future pharmacological targets. J Pharmacol Sci. 99:6–38. 2005.
View Article : Google Scholar : PubMed/NCBI
|
|
35
|
Li S, Tan HY, Wang N, Zhang ZJ, Lao L,
Wong CW and Feng Y: The role of oxidative stress and antioxidants
in liver diseases. Int J Mol Sci. 16:26087–26124. 2015. View Article : Google Scholar : PubMed/NCBI
|
|
36
|
Khanna A, Plummer M, Bromberek C,
Bresnahan B and Hariharan S: Expression of TGF-β and fibrogenic
genes in transplant recipients with tacrolimus and cyclosporine
nephrotoxicity. Kidney Int. 62:2257–2263. 2002. View Article : Google Scholar : PubMed/NCBI
|
|
37
|
Shehata M, Cope GH, Johnson TS, Raftery AT
and el Nahas AM: Cyclosporine enhances the expression of TGF-β in
the juxtaglomerular cells of the rat kidney. Kidney Int.
48:1487–1496. 1995. View Article : Google Scholar : PubMed/NCBI
|
|
38
|
Böttinger EP and Bitzer M: TGF-beta
signaling in renal disease. J Am Soc Nephrol. 13:2600–2610. 2002.
View Article : Google Scholar : PubMed/NCBI
|
|
39
|
Meng X-M, Chung AC and Lan HY: Role of the
TGF-β/BMP-7/Smad pathways in renal diseases. Clin Sci (Lond).
124:243–254. 2013. View Article : Google Scholar
|
|
40
|
Chou SD, Prince T, Gong J and Calderwood
SK: mTOR is essential for the proteotoxic stress response, HSF1
activation and heat shock protein synthesis. PLoS One.
7:e396792012. View Article : Google Scholar : PubMed/NCBI
|
|
41
|
Liu B and Qian SB: Translational
reprogramming in cellular stress response. Wiley Interdiscip Rev
RNA. 5:301–315. 2014. View Article : Google Scholar : PubMed/NCBI
|
|
42
|
Xiao X, Zuo X, Davis AA, McMillan DR,
Curry BB, Richardson JA and Benjamin IJ: HSF1 is required for
extra-embryonic development, postnatal growth and protection during
inflammatory responses in mice. EMBO J. 18:5943–5952. 1999.
View Article : Google Scholar : PubMed/NCBI
|
|
43
|
Anckar J and Sistonen L: Regulation of
HSF1 function in the heat stress response: Implications in aging
and disease. Annu Rev Biochem. 80:1089–1115. 2011. View Article : Google Scholar : PubMed/NCBI
|
|
44
|
Dunđerski JS: Cellular stress response -
Defence against metal toxicity. Jugoslovenska Medicinska Biohemija.
23:1–9. 2004. View Article : Google Scholar
|
|
45
|
Paslaru L, Rallu M, Manuel M, Davidson S
and Morange M: Cyclosporin A induces an atypical heat shock
response. Biochem Biophys Res Commun. 269:464–469. 2000. View Article : Google Scholar : PubMed/NCBI
|
|
46
|
Li P-C, Li X-N, Du Z-H, Wang H, Yu Z-R and
Li JL: Di (2-ethyl hexyl) phthalate (DEHP)-induced kidney injury in
quail (Coturnix japonica) via inhibiting HSF1/HSF3-dependent heat
shock response. Chemosphere. 209:981–988. 2018. View Article : Google Scholar : PubMed/NCBI
|
|
47
|
Pirkkala L, Nykänen P and Sistonen L:
Roles of the heat shock transcription factors in regulation of the
heat shock response and beyond. FASEB J. 15:1118–1131. 2001.
View Article : Google Scholar : PubMed/NCBI
|
|
48
|
Dai S, Tang Z, Cao J, Zhou W, Li H,
Sampson S and Dai C: Suppression of the HSF1-mediated proteotoxic
stress response by the metabolic stress sensor AMPK. EMBO J.
34:275–293. 2015. View Article : Google Scholar :
|
|
49
|
Niforou K, Cheimonidou C and Trougakos IP:
Molecular chaperones and proteostasis regulation during redox
imbalance. Redox Biol. 2:323–332. 2014. View Article : Google Scholar : PubMed/NCBI
|
|
50
|
Arnsburg K and Kirstein-Miles J:
Interrelation between protein synthesis, proteostasis and life
span. Curr Genomics. 15:66–75. 2014. View Article : Google Scholar : PubMed/NCBI
|
|
51
|
Akerfelt M, Morimoto RI and Sistonen L:
Heat shock factors: Integrators of cell stress, development and
lifespan. Nat Rev Mol Cell Biol. 11:545–555. 2010. View Article : Google Scholar : PubMed/NCBI
|
|
52
|
Verghese J, Abrams J, Wang Y and Morano
KA: Biology of the heat shock response and protein chaperones:
Budding yeast (Saccharomyces cerevisiae) as a model system.
Microbiol Mol Biol Rev. 76:115–158. 2012. View Article : Google Scholar : PubMed/NCBI
|
|
53
|
Togashi S, Takahashi K, Tamura A, Toyota
I, Hatakeyama S, Komatsuda A, Kudo I, Sasaki Kudoh E, Okamoto T,
Haga A, et al: High dose of antibiotic colistin induces
oligomerization of molecular chaperone HSP90. J Biochem. 162:27–36.
2017. View Article : Google Scholar : PubMed/NCBI
|
|
54
|
Minagawa S, Kondoh Y, Sueoka K, Osada H
and Nakamoto H: Cyclic lipopeptide antibiotics bind to the
N-terminal domain of the prokaryotic Hsp90 to inhibit the chaperone
activity. Biochem J. 435:237–246. 2011. View Article : Google Scholar : PubMed/NCBI
|
|
55
|
Liu B, Han Y and Qian SB: Cotranslational
response to proteotoxic stress by elongation pausing of ribosomes.
Mol Cell. 49:453–463. 2013. View Article : Google Scholar : PubMed/NCBI
|
|
56
|
Schieber M and Chandel NS: ROS function in
redox signaling and oxidative stress. Curr Biol. 24:R453–R462.
2014. View Article : Google Scholar : PubMed/NCBI
|
|
57
|
Dayalan Naidu S, Kostov RV and
Dinkova-Kostova AT: Transcription factors Hsf1 and Nrf2 engage in
crosstalk for cytoprotection. Trends Pharmacol Sci. 36:6–14. 2015.
View Article : Google Scholar
|