Introduction
The increasing prevalence of nephrolithiasis
worldwide is a principal societal issue due to the high financial
cost associated with kidney stone therapy (1-3).
Calcium-containing stones comprise >80% of kidney stone
components, with calcium oxalate (CaOx) stones detected most
frequently (4,5). Evidence from previous studies
suggested that the induction of hyperoxaluria is the primary risk
factor and is an essential requirement for the development of CaOx
nephrolithiasis (6,7). In addition, oxalate is not only a
principal constituent of CaOx stones; however, it additionally
influences CaOx crystal formation, primarily acting on the renal
tubular epithelium (8,9). The pathogenesis of CaOx
nephrolithiasis is complex and involves multiple mechanisms that
lead towards the formation of kidney stones (10-12). Notably, previous studies have
demonstrated that inflammatory mediators osteopontin (OPN) and
monocyte chemoattractant protein 1 (MCP-1) are important during the
development of CaOx stones (13-15).
MCP-1, a member of the CC chemokine subfamily, has
been demonstrated to serve as a key regulator of the inflammatory
response, which is considered to be a potent and specific
chemotactic factor for the recruiting and migration of inflammatory
cells, particularly monocytes/macrophages, into the inflamed area
following tissue injury (13). In
addition, evidence suggests that MCP-1 is a key element in various
pathological abnormalities associated with renal epithelial cells,
including nephrolithiasis (16).
OPN, a 44-kDa phosphorylated glycoprotein originally identified in
bone, is involved throughout the development of various
inflammatory disorders; and the absence or neutralization of OPN
results in the amelioration of numerous inflammatory diseases,
suggesting that OPN may be a useful target molecule for the
treatment of inflammation (17).
Perhaps more importantly, OPN may modulate various steps of CaOx
crystallization (15), and
contributes importantly to renal CaOx crystal deposition in
experimental animals (15).
Metformin, an antiglycemic biguanide drug used since
1958 and the most commonly prescribed drug for type II diabetes
mellitus in the world, has extensive potential benefits, including
reduced risk of cancer, increased antioxidant protection and
prolonged lifespan (18). In our
previous study, it was identified that metformin effectively
reduced renal stone formation through renal tubular cell protection
and an antioxidant mechanism (19). According to previously published
data, metformin may additionally significantly prevent the
expression of inflammatory markers in obstructed kidneys (20). However, there are no reports, to
the best of the authors’ knowledge, on the effects of metformin on
the expression of inflammatory mediators OPN and MCP-1 in renal
tubular cells. Therefore, the purpose of the present study was to
test the hypothesis that metformin prevents the development of CaOx
renal stone formation and investigate its potential mechanism
regarding OPN and MCP-1.
Materials and methods
Cell culture
MDCK cells, obtained from the Chinese Academy of
Medical Sciences (Shanghai, China), are derived from the canine
renal distal tubular epithelium cell line. HK-2 cells, additionally
obtained from the Chinese Academy of Medical Sciences, are derived
from the human renal proximal tubular epithelium cell line.
Routinely, the cells were maintained in Dulbecco’s modified Eagle’s
medium (DMEM; Gibco; Thermo Fisher Scientific, Inc., Waltham, MA,
USA), supplemented with 10% fetal bovine serum (Gibco; Thermo
Fisher Scientific, Inc.), 4.5 mM glucose, 100 IU/ml penicillin and
100 µg/ml streptomycin in a humidified incubator with 5%
CO2 at 37°C.
Cytotoxicity assay
The cytotoxicity towards MDCK and HK-2 cells was
investigated using a Cell Counting Kit-8 (CCK-8; Dojindo Molecular
Technologies, Inc., Kumamoto, Japan) assay following various
treatments, according to the manufacturer’s protocol. The cells
were seeded in 96-well plates at a density of 5×10³
cells per well and cultured overnight. Subsequently, fresh medium
containing metformin (Sigma-Aldrich; Merck KGaA, Darmstadt,
Germany) at different concentrations (0, 0.3125, 0.625, 1.25, 2.5,
5, 10, 20 and 40 mM) was added to replace the culture medium for 48
h at 37°C. Following incubation, the culture medium containing the
metformin was removed, and 100 µl fresh medium and 10
µl CCK-8 solution were added to each well. Following
incubation for an additional 4 h at 37°C, the absorbance was
measured spectrophotometrically at a wavelength of 450 nm using a
microplate reader (SpectraMax Plus384; Molecular Devices, LLC,
Sunnyvale, CA, USA). Cell viability was measured as a percentage of
that of the control (untreated) cells. For each concentration of
metformin, the mean values of the absorbance rates from eight wells
were calculated. The maximum safe concentration determined by the
CCK-8 assay was used in the following experiments.
HK-2 cell and MDCK cell in vitro
administration
The HK-2 cells and MDCK cells were routinely
subcultured until 70-80% confluence, and were subsequently washed
with serum-free DMEM and incubated for 24 h. Thereafter, the cells
from the two cell lines were simultaneously exposed to sodium
oxalate (1 mM) in the presence or absence of metformin (HK-2, 1. 25
mM; MDCK, 5 mM). Subsequently, the cells were harvested for mRNA
isolation following 6-h incubation and for protein isolation
following 24-h incubation. The control cultures underwent the same
procedures as the treated cells but without exposure to sodium
oxalate or metformin. The durations of cell exposure and
concentration of sodium oxalate were based on the findings reported
previously (21-23). The metformin concentrations used
were selected according to the results of the cytotoxicity assay.
All experiments were repeated at least three times with three
replications in each.
Experimental animals and protocol
All animal procedures were conducted in strict
compliance with the Guide for the Care and Use of Laboratory
Animals published by the US National Institutes of Health
(publication no. 85-23; revised 1996; Bethesda, MD, USA). Ethical
protocols were approved by the Animal Care and Use Committee of
Tianjin Medical University (Tianjin, China) and the Ethics
Committees of Tianjin Medical University. Healthy male
Sprague-Dawley rats (n=18; age, 8 weeks-old; body weight, 180-220
g) were provided by the Experimental Animal Center of Tianjin
Medical University (Tianjin, China) and housed under specific
pathogen-free conditions of constant temperature (24±2°C) and
humidity (55±5%), in a 12-h alternating light-dark cycle and with
free access to standard rat chow. The animals were randomly divided
into three groups, with six animals per treatment group: Group 1
(control group) was treated with free access to standard rat chow
and distilled water for the entire 8-week study period; group 2
[ethylene glycol (EG) group] was fed standard rat chow and
administered with free access to 0.75% (vol/vol) EG in distilled
water for 8 weeks to induce CaOx deposition in the kidneys
(24-26); group 3 (EG + metformin group)
followed the same protocol as group 2 but also received metformin
dissolved in distilled water by oral gavage at 200 mg/kg/day
throughout the 8-week experimental period (27,28). Animals in groups 1 and 2 received
oral gavage of distilled water (control) at an equal volume as in
group 3 during the treatment. Water and fluid consumption were
recorded daily. The rats were weighed prior to and during treatment
to assess growth. At 24 h prior to sacrifice, the 8-week-old rats
were transferred to metabolic cages, and 24-h urine was collected.
At the end of the 8-week administration period, non-enhanced CT was
performed on all the rats using a 64-slice GE Lightspeed CT scanner
with 0.625-mm sections (GE Healthcare, Chicago, IL, USA). Under
anesthesia with an intraperitoneal injection of pentobarbital
sodium (40 mg/kg body weight; Sigma-Aldrich; Merck KGaA), the
animals were sacrificed by rapid cervical dislocation, which is a
widely accepted humane sacrifice method for experimental animals.
Blood samples and kidney tissues were collected from six rats per
group following sacrifice. All efforts were made to minimize animal
suffering. The blood samples were maintained on wet ice until
centrifugation at 112 × g at 4°C for 10 min, following which serum
was collected and stored at −20°C. For kidney extraction, the right
unilateral kidney specimens were frozen in liquid nitrogen, and
stored at −80°C for the western blot and reverse
transcription-quantitative polymerase chain reaction (RT-qPCR)
analyses, and the contralateral specimens were fixed with 10%
formaldehyde for 24 h at room temperature and embedded in paraffin
for immunohistochemical analysis and the detection of kidney
crystal formation.
RT-qPCR analysis
Cells from the two cell lines were cultured and
treated as indicated. Total RNA was isolated from the cultured
cells and rat kidney tissues with TRIzol® reagent
(Takara Biotechnology Co., Ltd., Dalian, China) according to the
manufacturer’s protocol. The RNA samples typically had an A260/280
ratio between 1.9 and 2.1. The quantity and purity of the obtained
total RNA samples were determined by NanoDrop (NanoDrop
Technologies; Thermo Fisher Scientific, Inc., Wilmington, DE, USA).
Total RNA (3 µg) was reverse transcribed into cDNA using the
High-Capacity cDNA RT kit (Invitrogen; Thermo Fisher Scientific,
Inc.) according to the manufacturer’s protocol. The RT-qPCR
analysis was performed with an Illumina® Eco Real Time
PCR system (Model EC-100-1001; Illumina, Inc., San Diego, CA, USA).
The primer sequences are listed in Table 1. Each 10-µl reaction
contained the following: 5 µl Maxima SYBR Green/Fluorescein
qPCR Master mix (2X; Thermo Fisher Scientific, Inc.), a necessary
volume to 0.2-0.6 µM each primer, a volume with 10 ng cDNA
and the volume difference was made up with
diethylpyrocarbonate-treated water. The thermocycling conditions
consisted of incubation at 94°C for 3 min, followed by 38-45 cycles
at 94°C for 30 sec, at 58°C for 30 sec and at 72°C for 1 min. The
relative quantification of mRNA expression levels was determined
using the comparative quantification cycle (Cq) method
(2−ΔΔCq method) (29).
Negative controls (samples without cDNA) were included in all
experiments. The specificity of each PCR reaction was verified by
melt-curve analysis and by checking the PCR products on a 1.5%
agarose gel.
 | Table IPrimers used for reverse
transcription-quantitative polymerase chain reaction assays. |
Table I
Primers used for reverse
transcription-quantitative polymerase chain reaction assays.
| Species | Gene (Protein) | Forward primer
sequence, 5′-3′ | Reverse primer
sequence, 5′-3′ |
|---|
| Homo
sapiens | SPP1 (OPN) |
GAAGTTTCGCAGACCTGACAT |
GTATGCACCATTCAACTCCTCG |
| CCL2 (MCP-1) |
CTCAGCCAGATGCAATCAAT |
GCTTCTTTGGGACACTTGCT |
| GAPDH (GAPDH) |
ACCCAGAAGACTGTGGATGG |
TCTAGACGGCAGGTCAGGTC |
| Canis lupus
familiaris | SPP1 (OPN) |
CCGAGGTGATAGTGTGGCTTA |
GGAAAGTAGGACGGCATTGA |
| CCL2 (MCP-1) |
CCTCTGCCTGCTGCTCATA |
GCTTCTTTGGGACACTTGCT |
| GAPDH (GAPDH) |
GACGACATCAAGAAGGTAGTG |
AGGTGGAAGAGTGGGTGT |
| Rattus
norvegicus | SPP1 (OPN) |
AAGCGTGGAAACACACAGC |
TTTGGAACTCGCCTGACTG |
| CCL2 (MCP-1) |
GATCTCAGTGCAGAGGCTCG |
TGCTTGTCCAGGTGGTCCAT |
| GAPDH (GAPDH) |
GGCATTGCTCTCAATGACAA |
ATGTAGGCCATGAGGTCCAC |
Western blot analysis
Cells from the two cell lines were cultured and
treated as indicated. Proteins were extracted from the cultured
cells and rat kidney tissues with a protein extraction kit (Nanjing
KeyGen Biotech Co., Ltd., Nanjing, China), and the cells were lysed
with radioimmunoprecipitation assay buffer (Beijing Solarbio
Science & Technology Co., Ltd., Beijing, China). The protein
concentrations of samples were determined using the bicinchoninic
acid method (Pierce; Thermo Fisher Scientific, Inc.). The proteins
(25 µg) were separated by 10% SDS-PAGE and transferred onto
a nitrocellulose membrane (EMD Millipore, Billerica, MA, USA). The
membranes were blocked with 5% non-fat milk in TBS with Tween-20
for 30 min at room temperature. Subsequently, the membranes were
incubated with primary antibodies against OPN (cat. no. ab95090;
1:1,000; Abcam, Cambridge, MA, USA), MCP-1 (cat. no. ab21396;
1:1,000; Abcam) and β-actin (cat. no. 3700; 1:1,000; Cell Signaling
Technology, Inc., Danvers, MA, USA) overnight at 4°C. Antibody
binding was detected following incubation with appropriate
secondary antibodies conjugated to horseradish peroxidase (cat. no.
12262; 1:1,000; Cell Signaling Technology, Inc.) for 1 h at room
temperature. The detection of specific bands was achieved using
enhanced chemiluminescence reagent (Pierce; Thermo Fisher
Scientific, Inc.). Images were captured using a the Syngene G: Box
Chemi XR5 bioimaging system (Syngene, Frederick, MD, USA) and
analyzed with Image Pro Plus 6.0 software (Media Cybernetics, Inc.,
Rockville, MD, USA).
ELISA
Cells from the two cell lines were cultured and
treated as indicated. The cell culture supernatants were collected
following incubation for 24 h, and the production of OPN (cat. nos.
CSB-E08392h and CSB-E07013c; Cusabio, Wuhan, China) and MCP-1 (cat.
nos. CSB-E04655h and CSB-E15747c; Cusabio) were measured using
commercially available ELISA kits, according to the manufacturer’s
protocol.
Immunohistochemical staining
The kidneys were fixed with formaldehyde (10%) at
room temperature for 24 h, and subsequently embedded in paraffin
and cut into 4-µm sections. For immunohistochemical
staining, following heating at 65°C for 2 h, the sections were
de-waxed twice for 10 min with dimethylbenzene. Subsequent to
de-waxing, the sections were dehydrated with successive
concentrations of ethanol (100, 95, 90 and 80%) for 5 min at each
concentration. The sections were later incubated in citrate buffer
in a box and heated to 90-98°C in a pressure cooker. After 2 min,
the sections were removed and naturally cooled. Subsequent to the
removal of the citrate buffer and washing with PBS, the sections
were incubated with 3% H2O2 for 15 min to
block endogenous peroxidase activity and washed with PBS (pH 7.4)
for 5 min each at room temperature. Non-specific protein binding
was blocked with 5% bovine serum albumin (Dako; Agilent
Technologies, Inc., Santa Clara, CA, USA) for 30 min at 37°C. The
sections were subsequently incubated with primary antibody
overnight at 4°C (OPN; 1:200; cat. no. ab8448; MCP-1; 1:150; cat.
no. ab25124; Abcam). Following this, the sections were incubated
with biotinylated secondary antibody (cat. no. ab6721; 1:1,000;
Abcam) at 37°C for 30 min and subsequently developed using
diaminobenzidine. Finally, the tissue sections were counterstained
with hematoxylin at room temperature for 3 min, washed for 10 min
and dehydrated with ethanol, and subsequently treated with
dimethylbenzene and sealed for microscopic analysis. The slides
were examined using a light microscope (Nikon ECLIPSE 90i
microscope; Nikon Corporation, Tokyo, Japan; magnification, ×100
and ×400).
Serum and urinary biochemistry
The concentrations of urinary oxalate
(OX) were determined with commercially available kits
(Trinity Biotech USA, Inc., Jamestown, NY, USA). Calcium in urine
and serum levels of phosphate (P), calcium (Ca), magnesium (Mg) and
creatinine were measured on a routine autoanalyzer system (Mindray
BS-2000M; Mindray Medical International Ltd., Shenzhen, China).
Urinary pH and volume were detected manually.
Detection of kidney crystal
formation
Kidney tissue samples were collected from either the
control or treated rats, embedded in paraffin and sectioned at
4.0-µm. The tissue slices were subsequently stained with
hematoxylin for 8 min and eosin for 3 min (H&E; Beijing
Solarbio Science & Technology Co., Ltd.) at room temperature,
and sealed rapidly for polarized light optical microscopic
analysis. In addition, cross sections were stained using a
previously described Pizzolato staining method to detect crystals
that contain CaOx (30,31). The renal crystal number per
high-powered field was counted in 10 randomly selected fields
(magnification, ×400) and quantified by standard validation as
described in detail previously (8,21).
The distribution of renal crystallization in each section was
quantified by calculating the percentage (ratio) of the area
containing crystals to low-powered field in 10 randomly selected
fields (magnification, ×100) using Image Pro Plus 6.0 software
(Media Cybernetics, Inc.), as described previously (30,32). In total, two independent examiners
assessed the representative H&E-stained paraffin sections for
each kidney and calculated the average number of crystals
deposited, respectively.
Statistical analysis
All data are expressed as the mean ± standard
deviation of a minimum of three replicates in independent
experiments. Statistical analyses were performed using the Wilcoxon
rank-sum test, two-tailed unpaired t-test and one-way analysis of
variance with Bonferroni’s post hoc test where appropriate using
SPSS software, version 20 (IBM Corp., Armonk, NY, USA). P<0.05
was considered to indicate a statistically significant
difference.
Results
Cytotoxicity
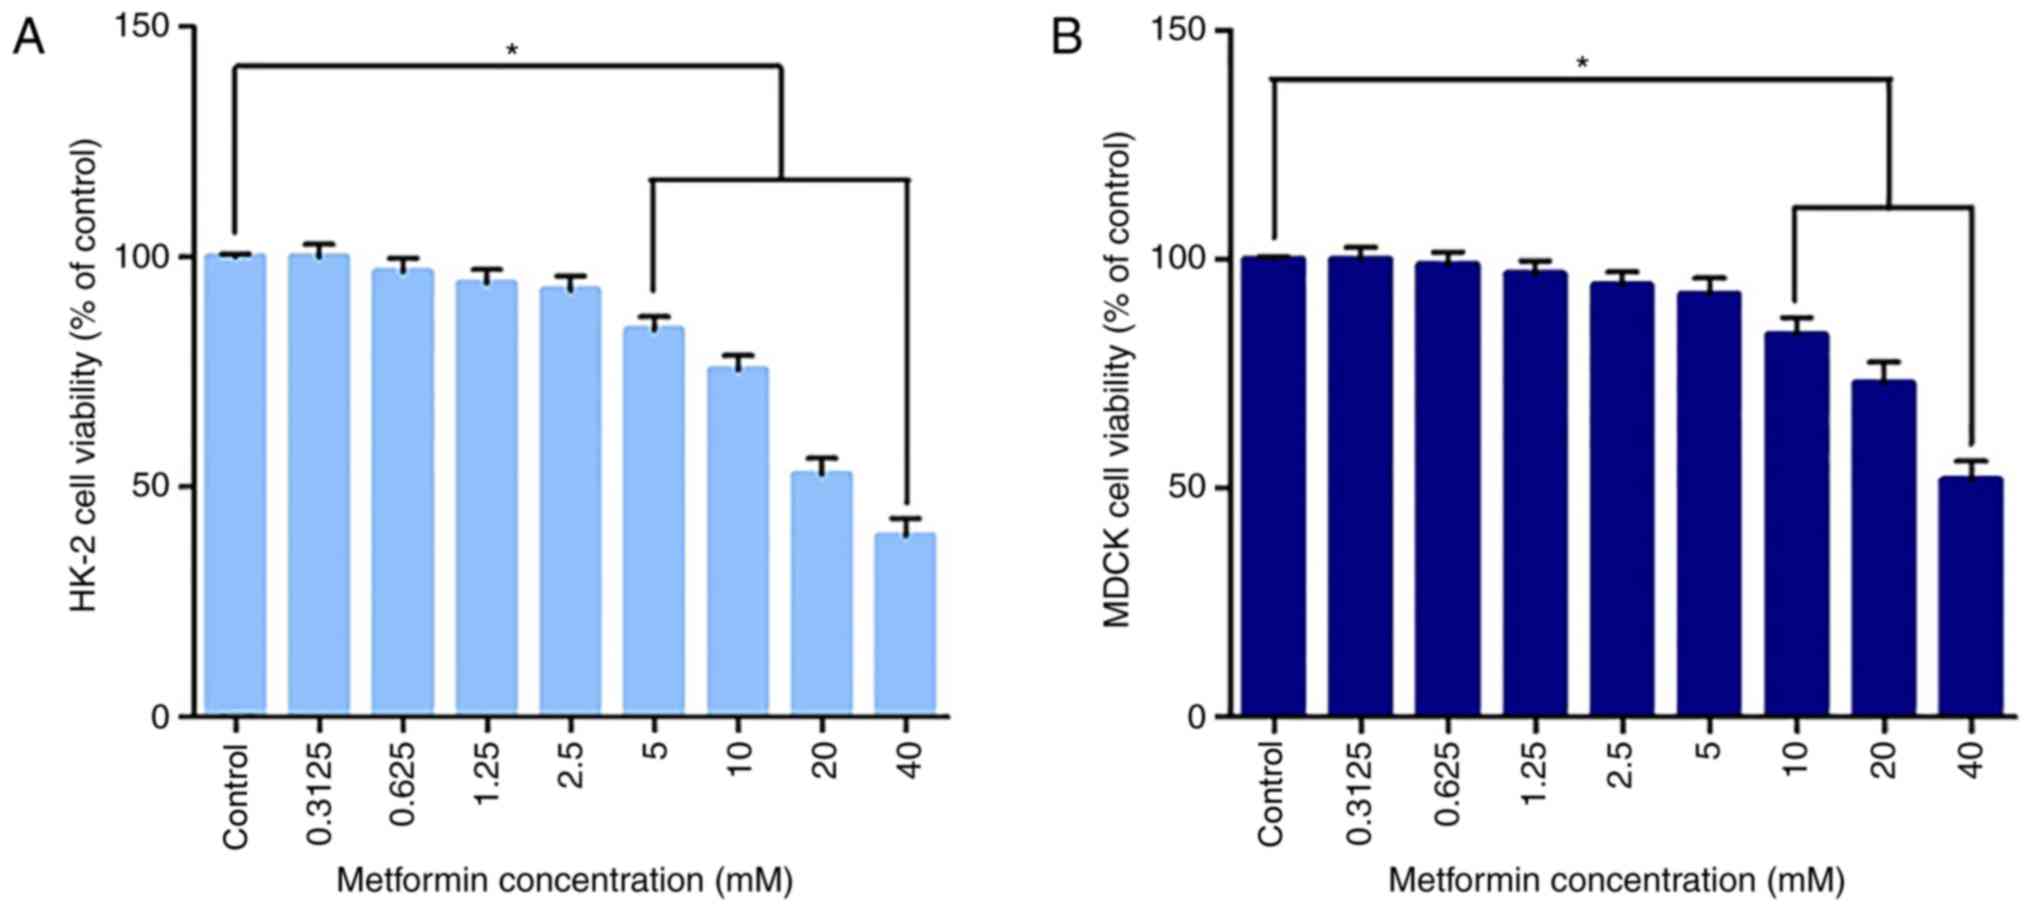
As presented in Fig.
1, the CCK-8 assay results demonstrated a dose-dependent toxic
effect with increasing concentrations of metformin on HK-2 cells
and MDCK cells under starved conditions. No significant
cytotoxicity was observed at concentrations ≤2.5 mM in HK-2 cells
or 5 mM in MDCK cells. These results suggest that low doses of
metformin did not decrease cell viability in either cell line, but
that exposure to metformin caused significant cytotoxicity at
relatively higher doses (metformin >2.5 mM in HK-2 cells,
metformin >5 mM in MDCK cells). The concentration gradient was
improved based on our previous experiments using MMT (19). In the present study, 1.25 mM for
HK-2 cells and 5 mM for MDCK cells were selected as the respective
exposure doses for metformin in the subsequent experiments, at
which no significant cytotoxicity was observed.
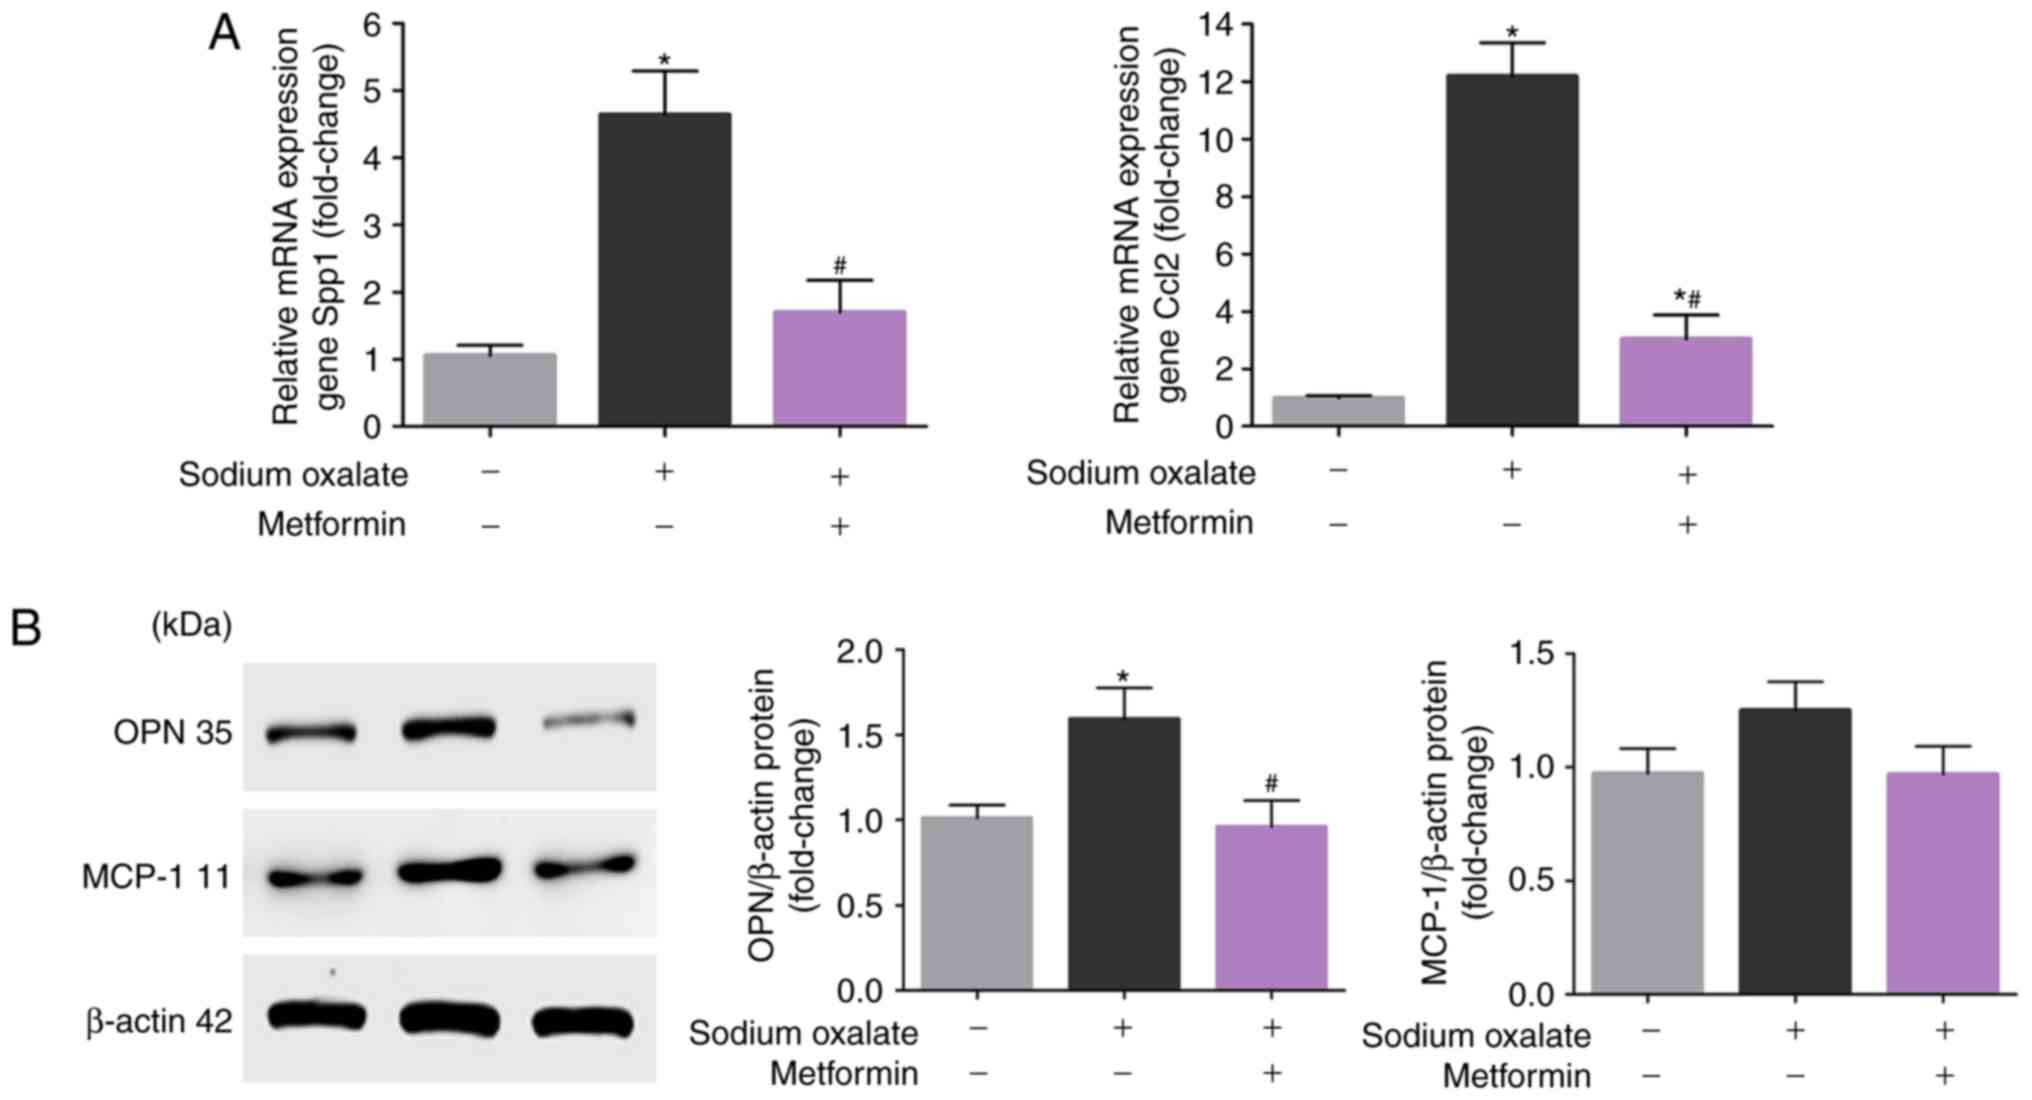
Metformin attenuates the upregulation of
OPN and MCP-1 induced by oxalate in vitro
In order to evaluate whether metformin attenuates
the upregulation of OPN and MCP-1 induced by Ox, changes in the
expression of OPN and MCP-1 in response to metformin in
vitro were measured. As presented in Fig. 2A, the mRNA expression levels of
OPN and MCP-1 were significantly increased in HK-2 cells following
sodium oxalate exposure compared with the untreated controls
(P<0.05). In addition, metformin treatment attenuated the
Ox-induced increase of OPN and MCP-1 (P<0.05). As expected,
exposure of the HK-2 cells to Ox elicited increases in the protein
expression of OPN and MCP-1 compared with that in the untreated
controls, although the upregulation of MCP-1 was not statistically
significant (P>0.05; Fig. 2B).
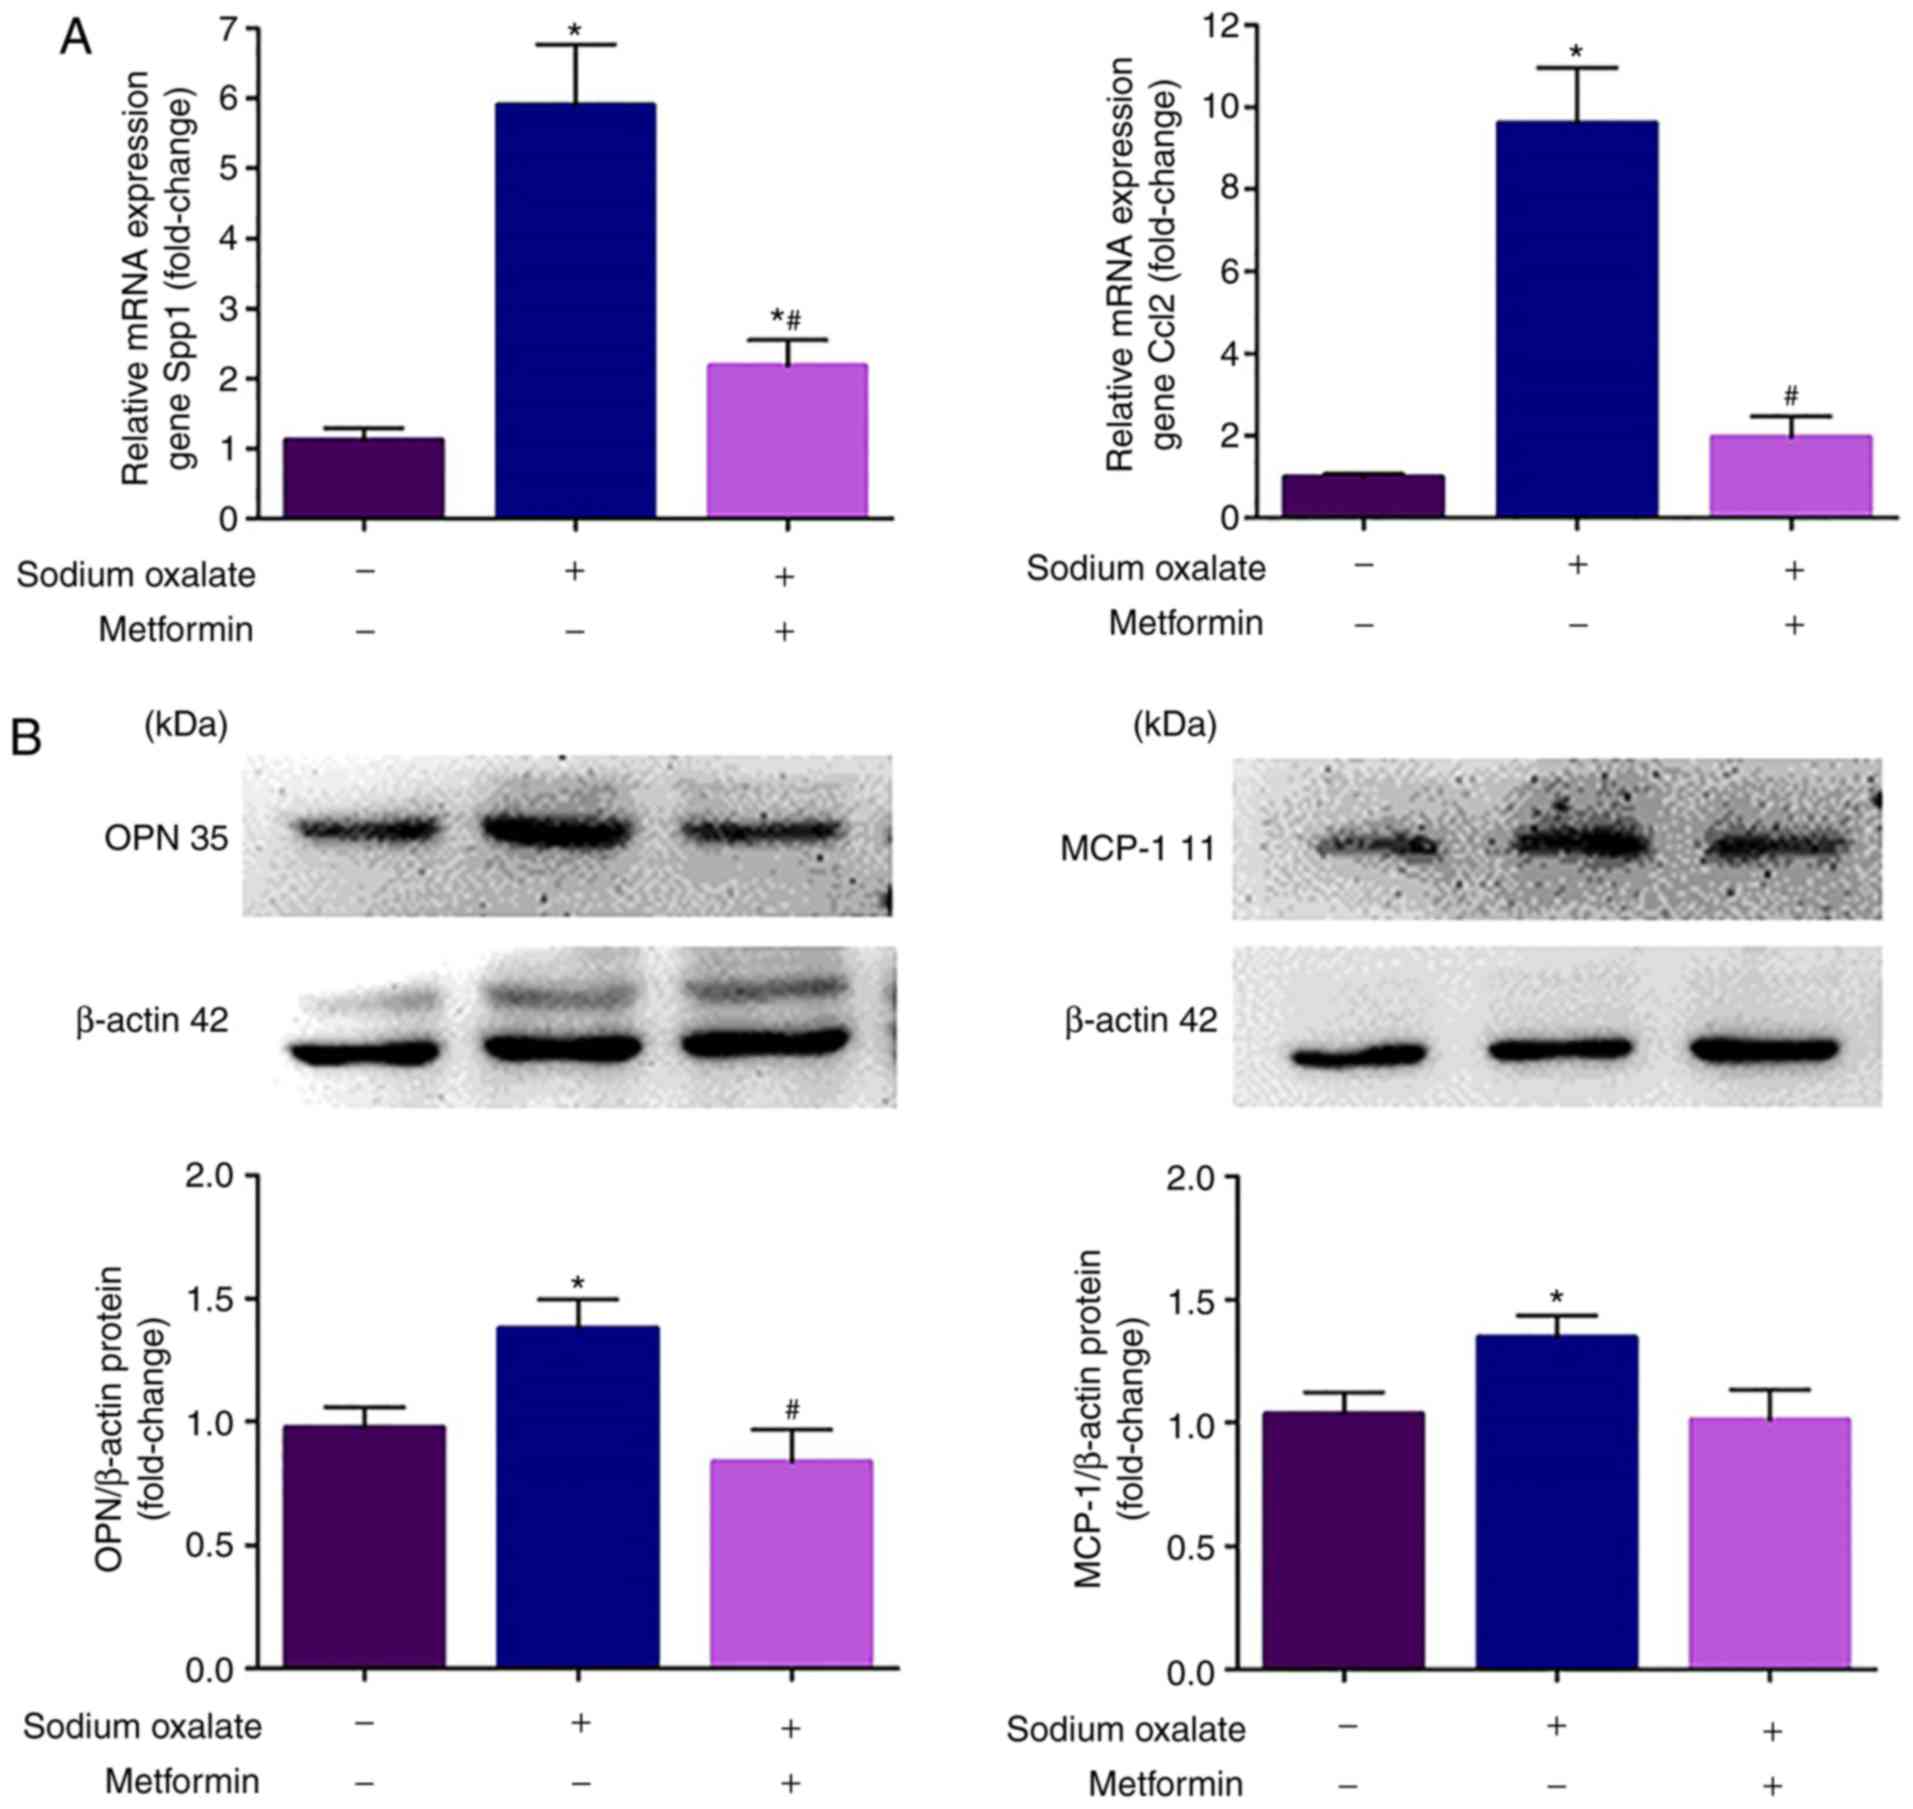
Consistent with the mRNA levels, metformin co-treatment reduced the
increased protein expression of OPN and MCP-1, although the
attenuation in the protein expression of MCP-1 was not
statistically significant (P>0.05; Fig. 2B). The same results were obtained
in MDCK cells (Fig. 3).
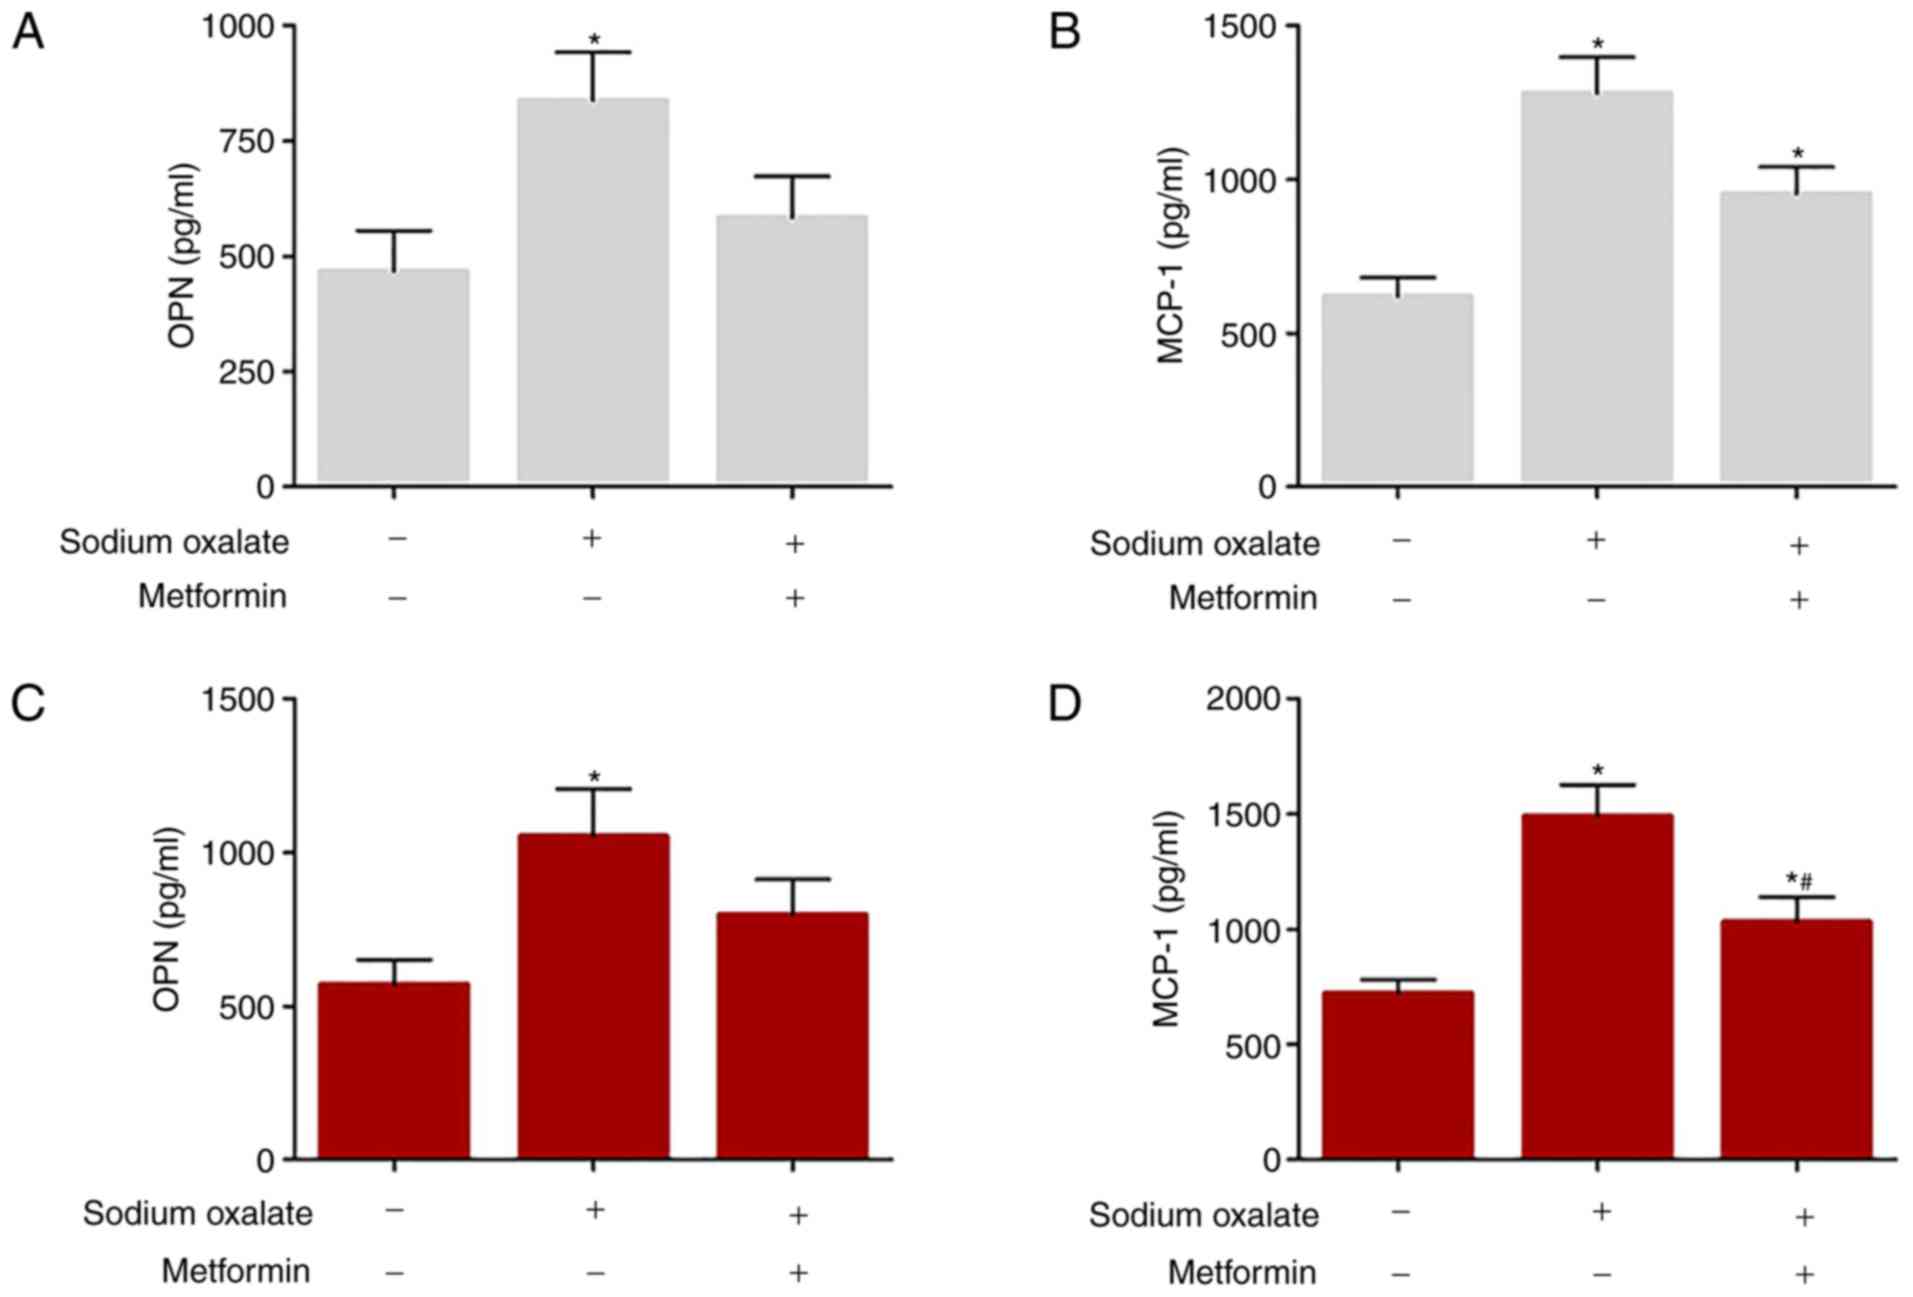
In addition, the concentrations of MCP-1 and OPN in
the cell culture supernatants were determined in HK-2 cells and
MDCK cells by ELISA, as presented in Fig. 4. Sodium oxalate exposure markedly
increased the production of OPN and MCP-1 compared with that in the
untreated controls in the two cell lines (P<0.05); however,
metformin treatment abrogated the Ox-induced increases in the
expression of OPN and MCP-1 in the cell culture supernatants.
Body weight and fluid consumption
results
The body weights increased gradually in all the
three groups throughout the time period. However, the body weights
in the EG + metformin group increased at a slower rate than in the
control group and EG group; at the end of the 8-week treatment
period, the differences were statistically significant. The fluid
consumption adjusted by the body weight was not the different at
any time point in the three groups. The animals in the EG group and
EG + metformin group consumed similar quantities of EG, and no
significant difference in fluid consumption was observed between
either of these groups and the control (Table II).
| Table IIBody weight and water intake prior to
and following treatment. |
Table II
Body weight and water intake prior to
and following treatment.
| Measurement | Control | EG | EG + metformin |
|---|
| Body weight, g | | | |
| 0 week | 194±11 | 198±12 | 193±11 |
| 2 weeks | 253±18 | 249±17 | 241±19 |
| 4 weeks | 324±19 | 335±18 | 313±17 |
| 6 weeks | 392±20 | 388±22 | 363±21 |
| 8 weeks | 461±25 | 457±27 | 405±24a,b |
| Fluid consumption,
ml × day−1 × kg body weight−1 | | | |
| 2 weeks | 105±11 | 110±12 | 108±11 |
| 4 weeks | 112±9 | 108±11 | 113±12 |
| 6 weeks | 115±12 | 112±10 | 109±12 |
| 8 weeks | 109±13 | 115±11 | 110±9 |
Serum and urinary biochemistry
results
The serum biochemical analysis showed that Ca, Mg
and creatinine remained essentially stable with no significant
differences in any of the groups. Compared with the controls, serum
P in the EG group was significantly higher (P<0.05), whereas
this effect was ameliorated, to a certain extent, in the EG +
metformin group. There was no significant alteration in urinary
volume or pH in any of the groups following 8 weeks of
administration. As expected, urinary Ox excretion was significantly
increased with EG treatment compared with the control group
(P<0.05). Of note, metformin, when administered together with
EG, not only significantly ameliorated urinary Ox excretion
(P<0.05); however, additionally led to a non-significant fall in
urinary Ca excretion compared with the control group and EG group
(Table III).
| Table IIISerum and urinary biochemistry. |
Table III
Serum and urinary biochemistry.
| Factor | Control | EG | EG + metformin |
|---|
| Serum | | | |
| Creatinine,
mg/dl | 0.34±0.02 | 0.36±0.03 | 0.35±0.04 |
| Calcium,
mg/dl | 10.12±0.35 | 10.21±0.36 | 10.06±0.40 |
| Phosphate,
mg/dl | 6.14±0.36 | 7.88±0.56a | 7.11±0.44 |
| Magnesium,
mg/dl | 2.52±0.32 | 2.65±0.45 | 2.33±0.37 |
| Urine | | | |
| Volume, ml | 21.98±3.11 | 24.62±4.78 | 23.67±5.11 |
| pH | 7.68±0.36 | 7.55±0.46 | 7.46±0.37 |
| Calcium,
mg/day | 3.16±0.28 | 3.22±0.37 | 2.98±0.43 |
| Oxalate,
mg/day | 1.56±0.47 | 19.42±3.12a | 13.16±2.53a,b |
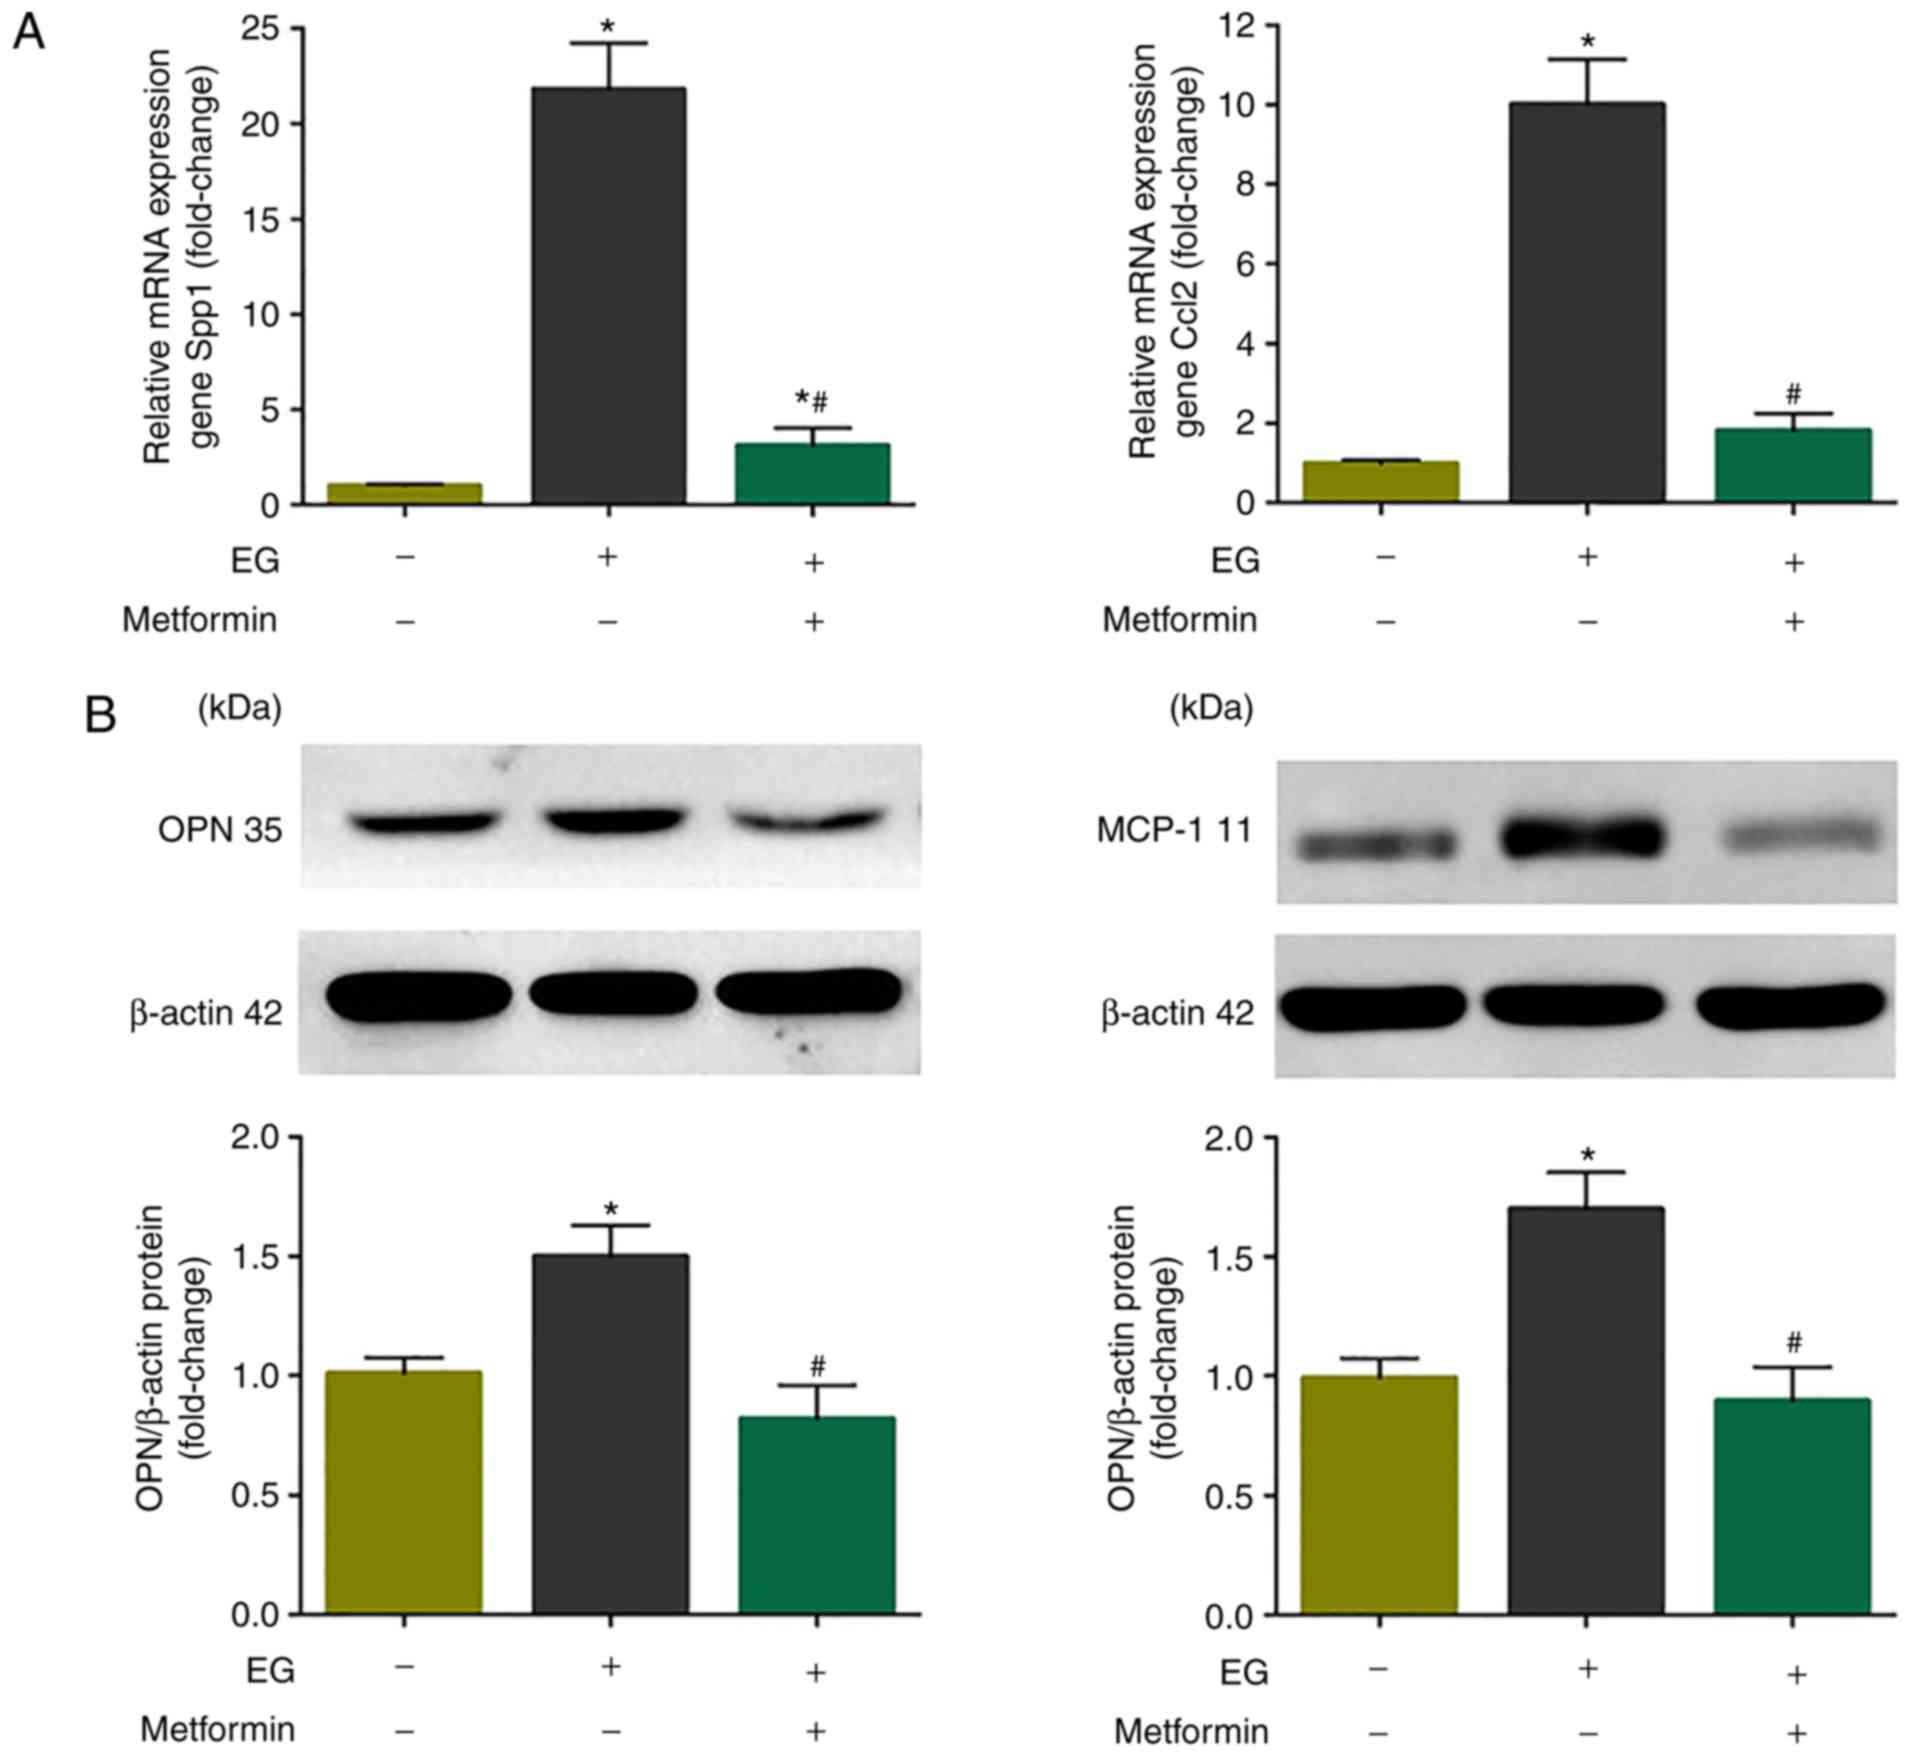
Metformin restricts EG-induced renal OPN
and MCP-1 activation in vivo
The present study then determined whether the in
vivo results were recapitulated in the HK-2 cells and MDCK
cells. Consistent with the in vitro data, the mRNA
transcription and protein expression levels of OPN and MCP-1 were
markedly increased following treatment with EG for 8 weeks compared
with those in the model control rats (P<0.05), and the
upregulation of OPN and MCP-1 was significantly decreased in the EG
+ metformin group, compared with that in the EG group (P<0.05;
Fig. 5).
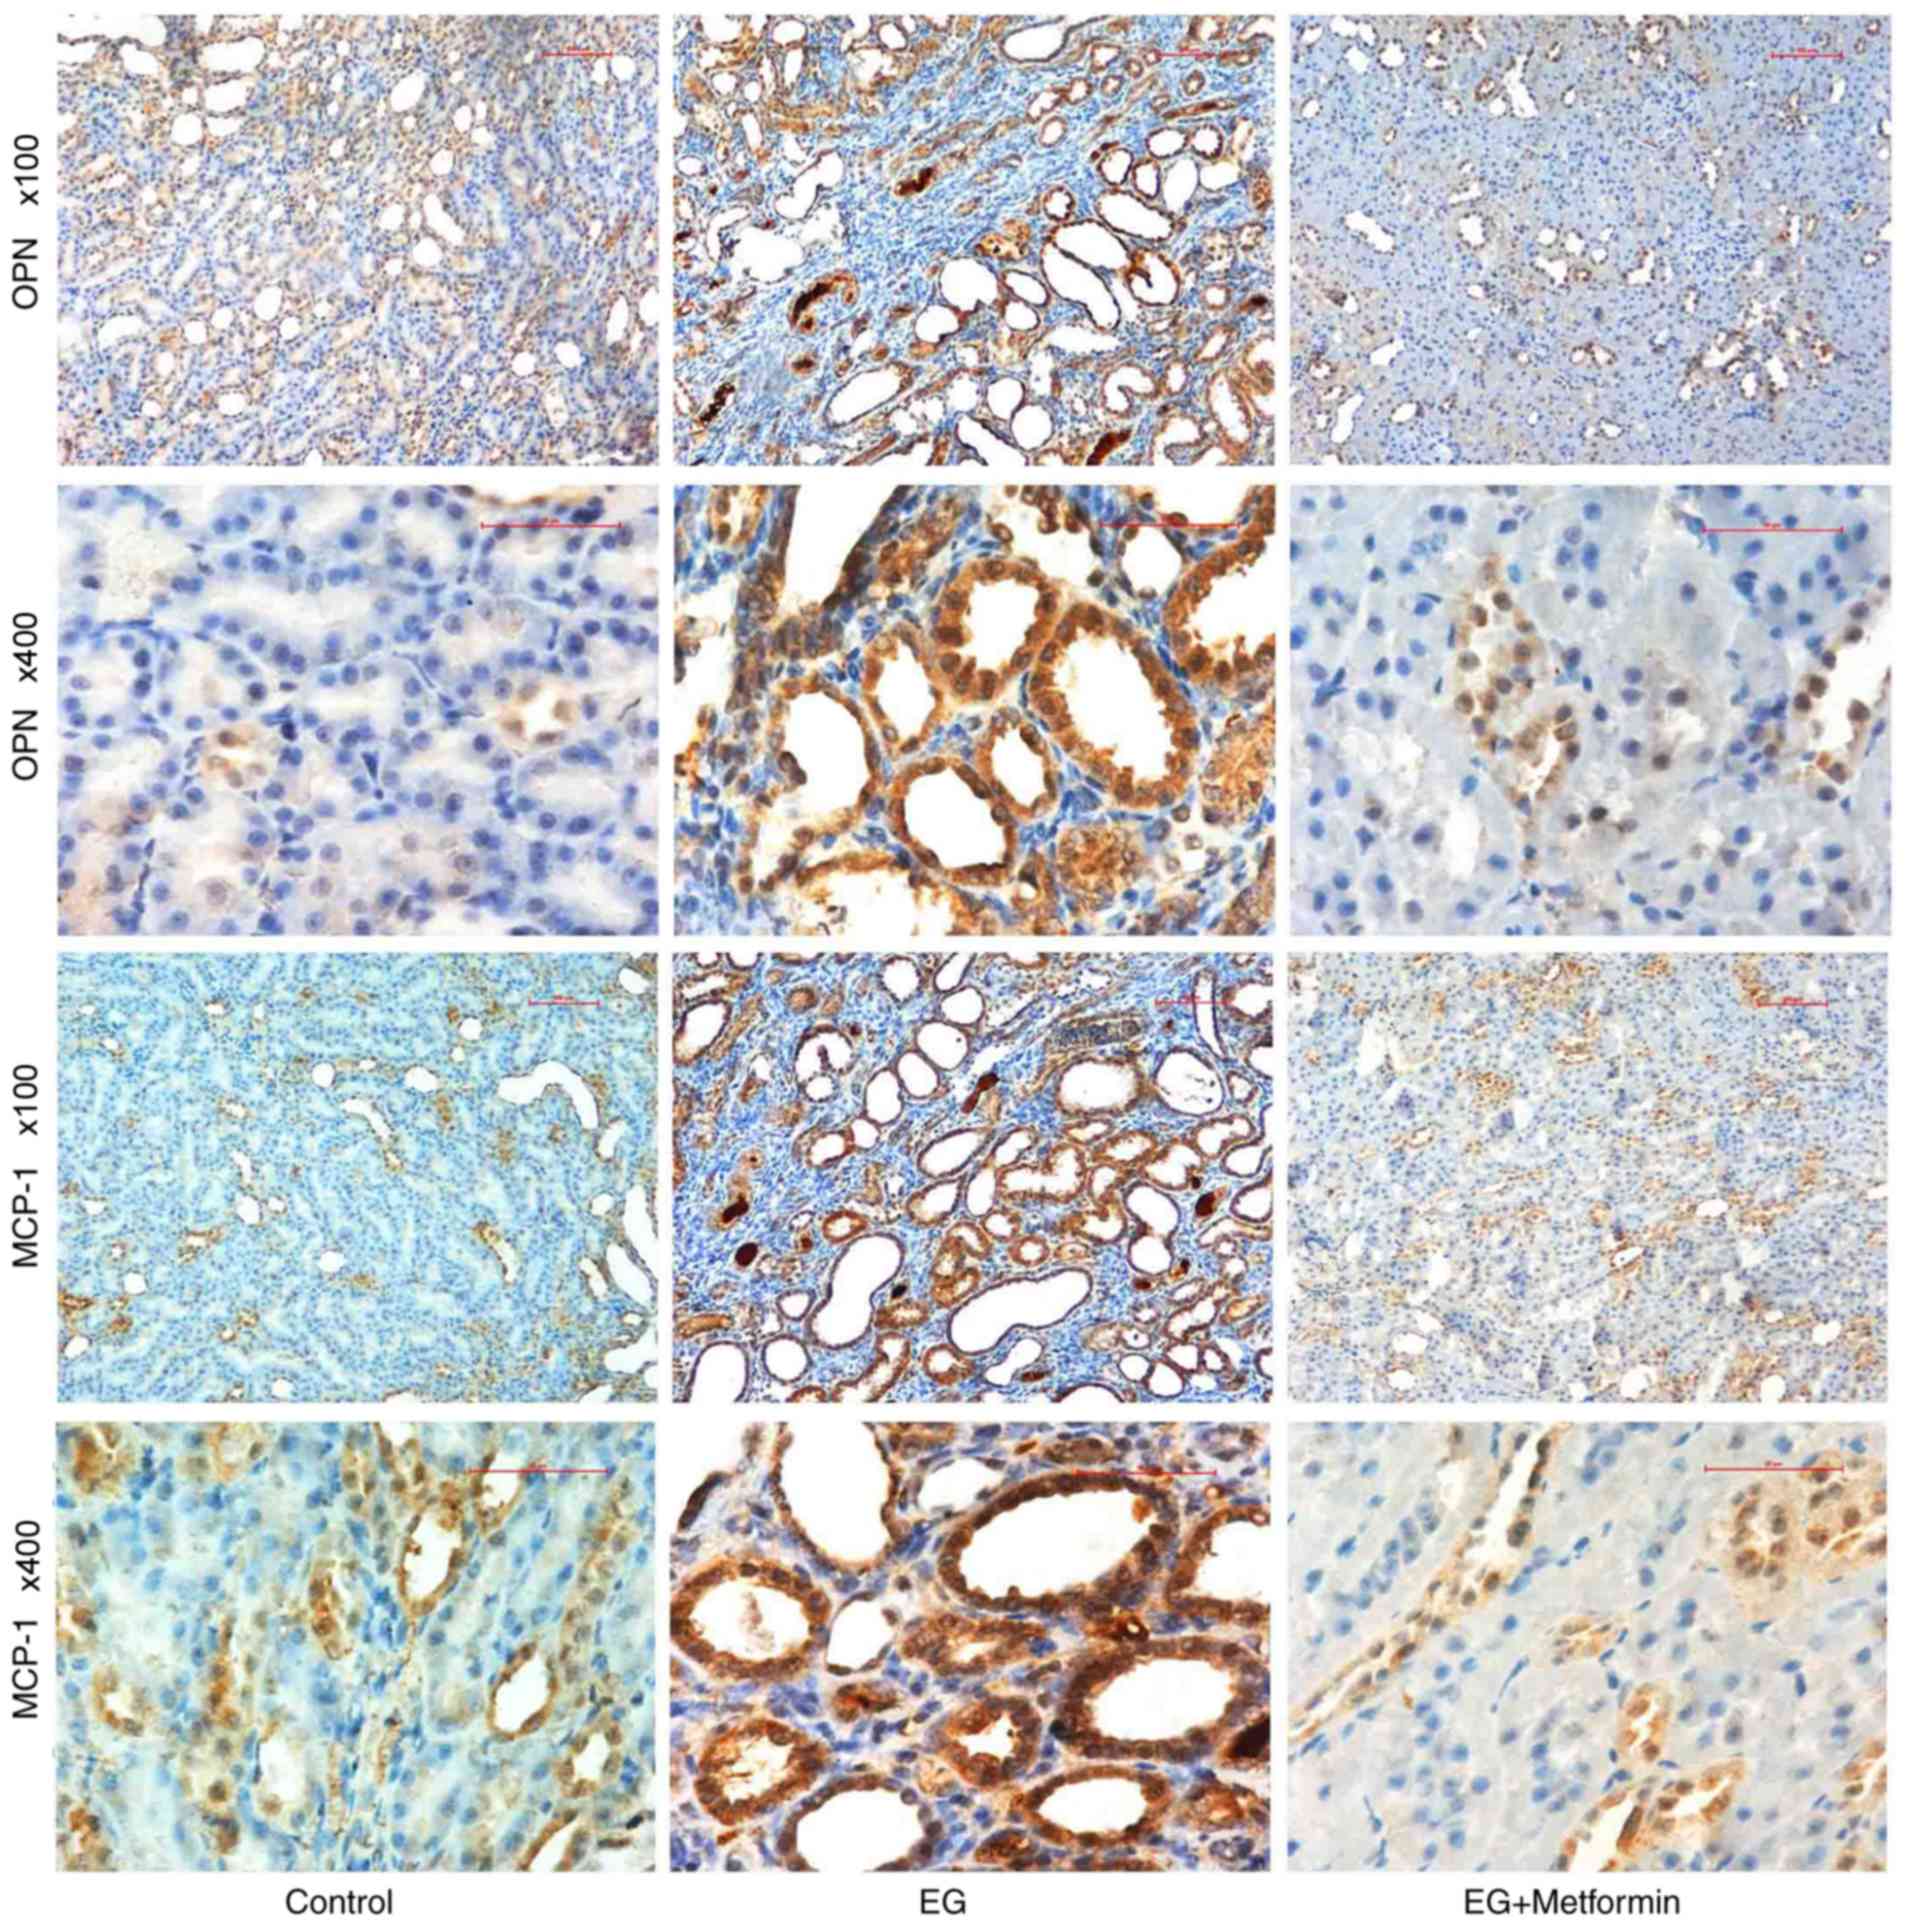
To further elucidate the differences in the
expression of OPN and MCP-1, immunohistochemistry was performed on
the kidneys of the rat models following the 8-week treatment
period. As presented in Fig. 6,
strong immunohistochemical staining for OPN and MCP-1 was observed
in the luminal side of renal tubular epithelial cells in the
EG-treated group, particularly in the pericrystal region; OPN and
MCP-1 are presented as light brown in the control group and EG +
metformin group. This observation is consistent with the above
finding that the expression levels of OPN and MCP-1 were markedly
increased (P<0.05; Table IV)
following treatment in the EG group compared with those in the
control group and EG + metformin group.
| Table IVStatistical analysis of functional
expression of OPN and MCP-1 in rat kidneys following 8 weeks of
treatment. |
Table IV
Statistical analysis of functional
expression of OPN and MCP-1 in rat kidneys following 8 weeks of
treatment.
| Group | OPN
| MCP-1
|
|---|
| − | ± | + | ++ | +++ | − | ± | + | ++ | +++ |
|---|
| Control | 0 | 4 | 2 | 0 | 0 | 0 | 5 | 1 | 0 | 0 |
| EG | 0 | 0 | 1 | 5a,b | 0 | 0 | 0 | 2 | 4a,b | 0 |
| EG + metformin | 0 | 4 | 1 | 1 | 0 | 0 | 2 | 3 | 1 | 0 |
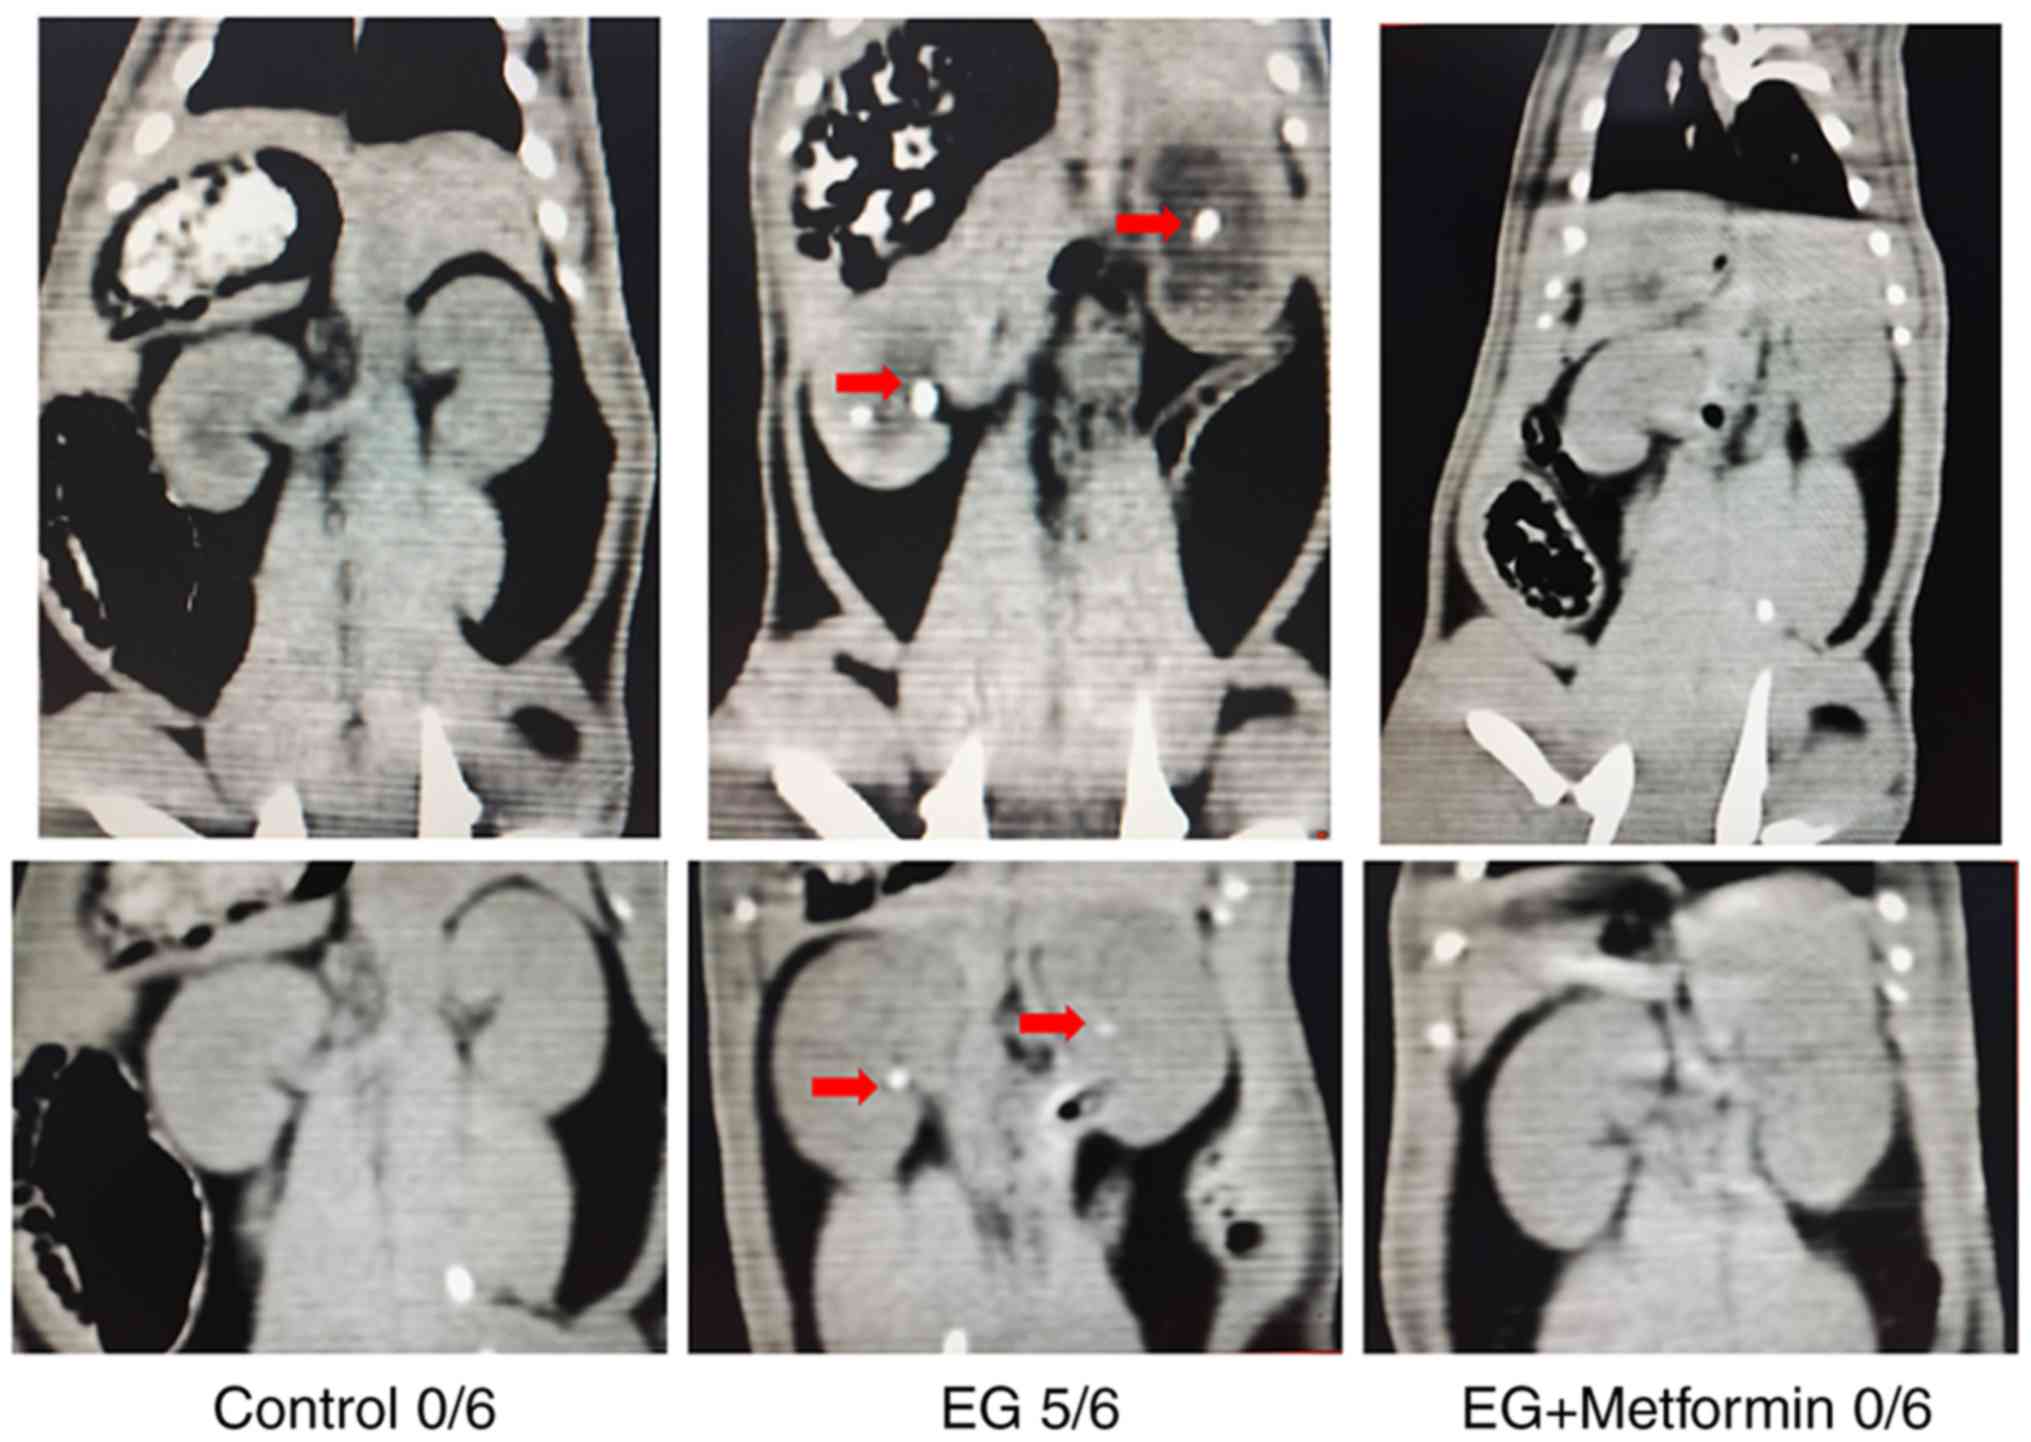
Metformin ameliorates EG-induced renal
crystal formation in the rat model
Crystallization was observed as white dots in the
kidney tissues in the thin-slice reconstructions of non-enhanced CT
images (Fig. 7). The results
demonstrated no significant kidney crystals in any field of the
renal parenchyma in the control group (0/6) nor in the EG +
metformin group (0/6). By contrast, in the rats treated with EG,
the majority of the rat kidneys (5/6) were shown to manifest renal
crystal depositions. Polarized light optical microscopic
examination of the kidneys from the control group showed no kidney
crystals in any field (data not shown). As presented in Fig. 8A and B, renal crystal deposits
were present predominantly in the renal tubular lumen at the
papilla and in the border between the renal cortex and medulla. A
grading system and quantitative methods, as described above, were
used to evaluate crystal deposition in the kidneys. Compared with
the EG + metformin group, crystal formation in the EG group was
markedly increased according to the quantitative analysis of the
ratio (percentage) of the area containing crystals in the
low-powered (magnification, ×100) field (P<0.05; Fig. 8C). In addition, the number and
grade of the renal crystal deposits per 10 fields were markedly
decreased in the EG + metformin co-treated group compared with the
EG group (P<0.05; Fig.
8D).
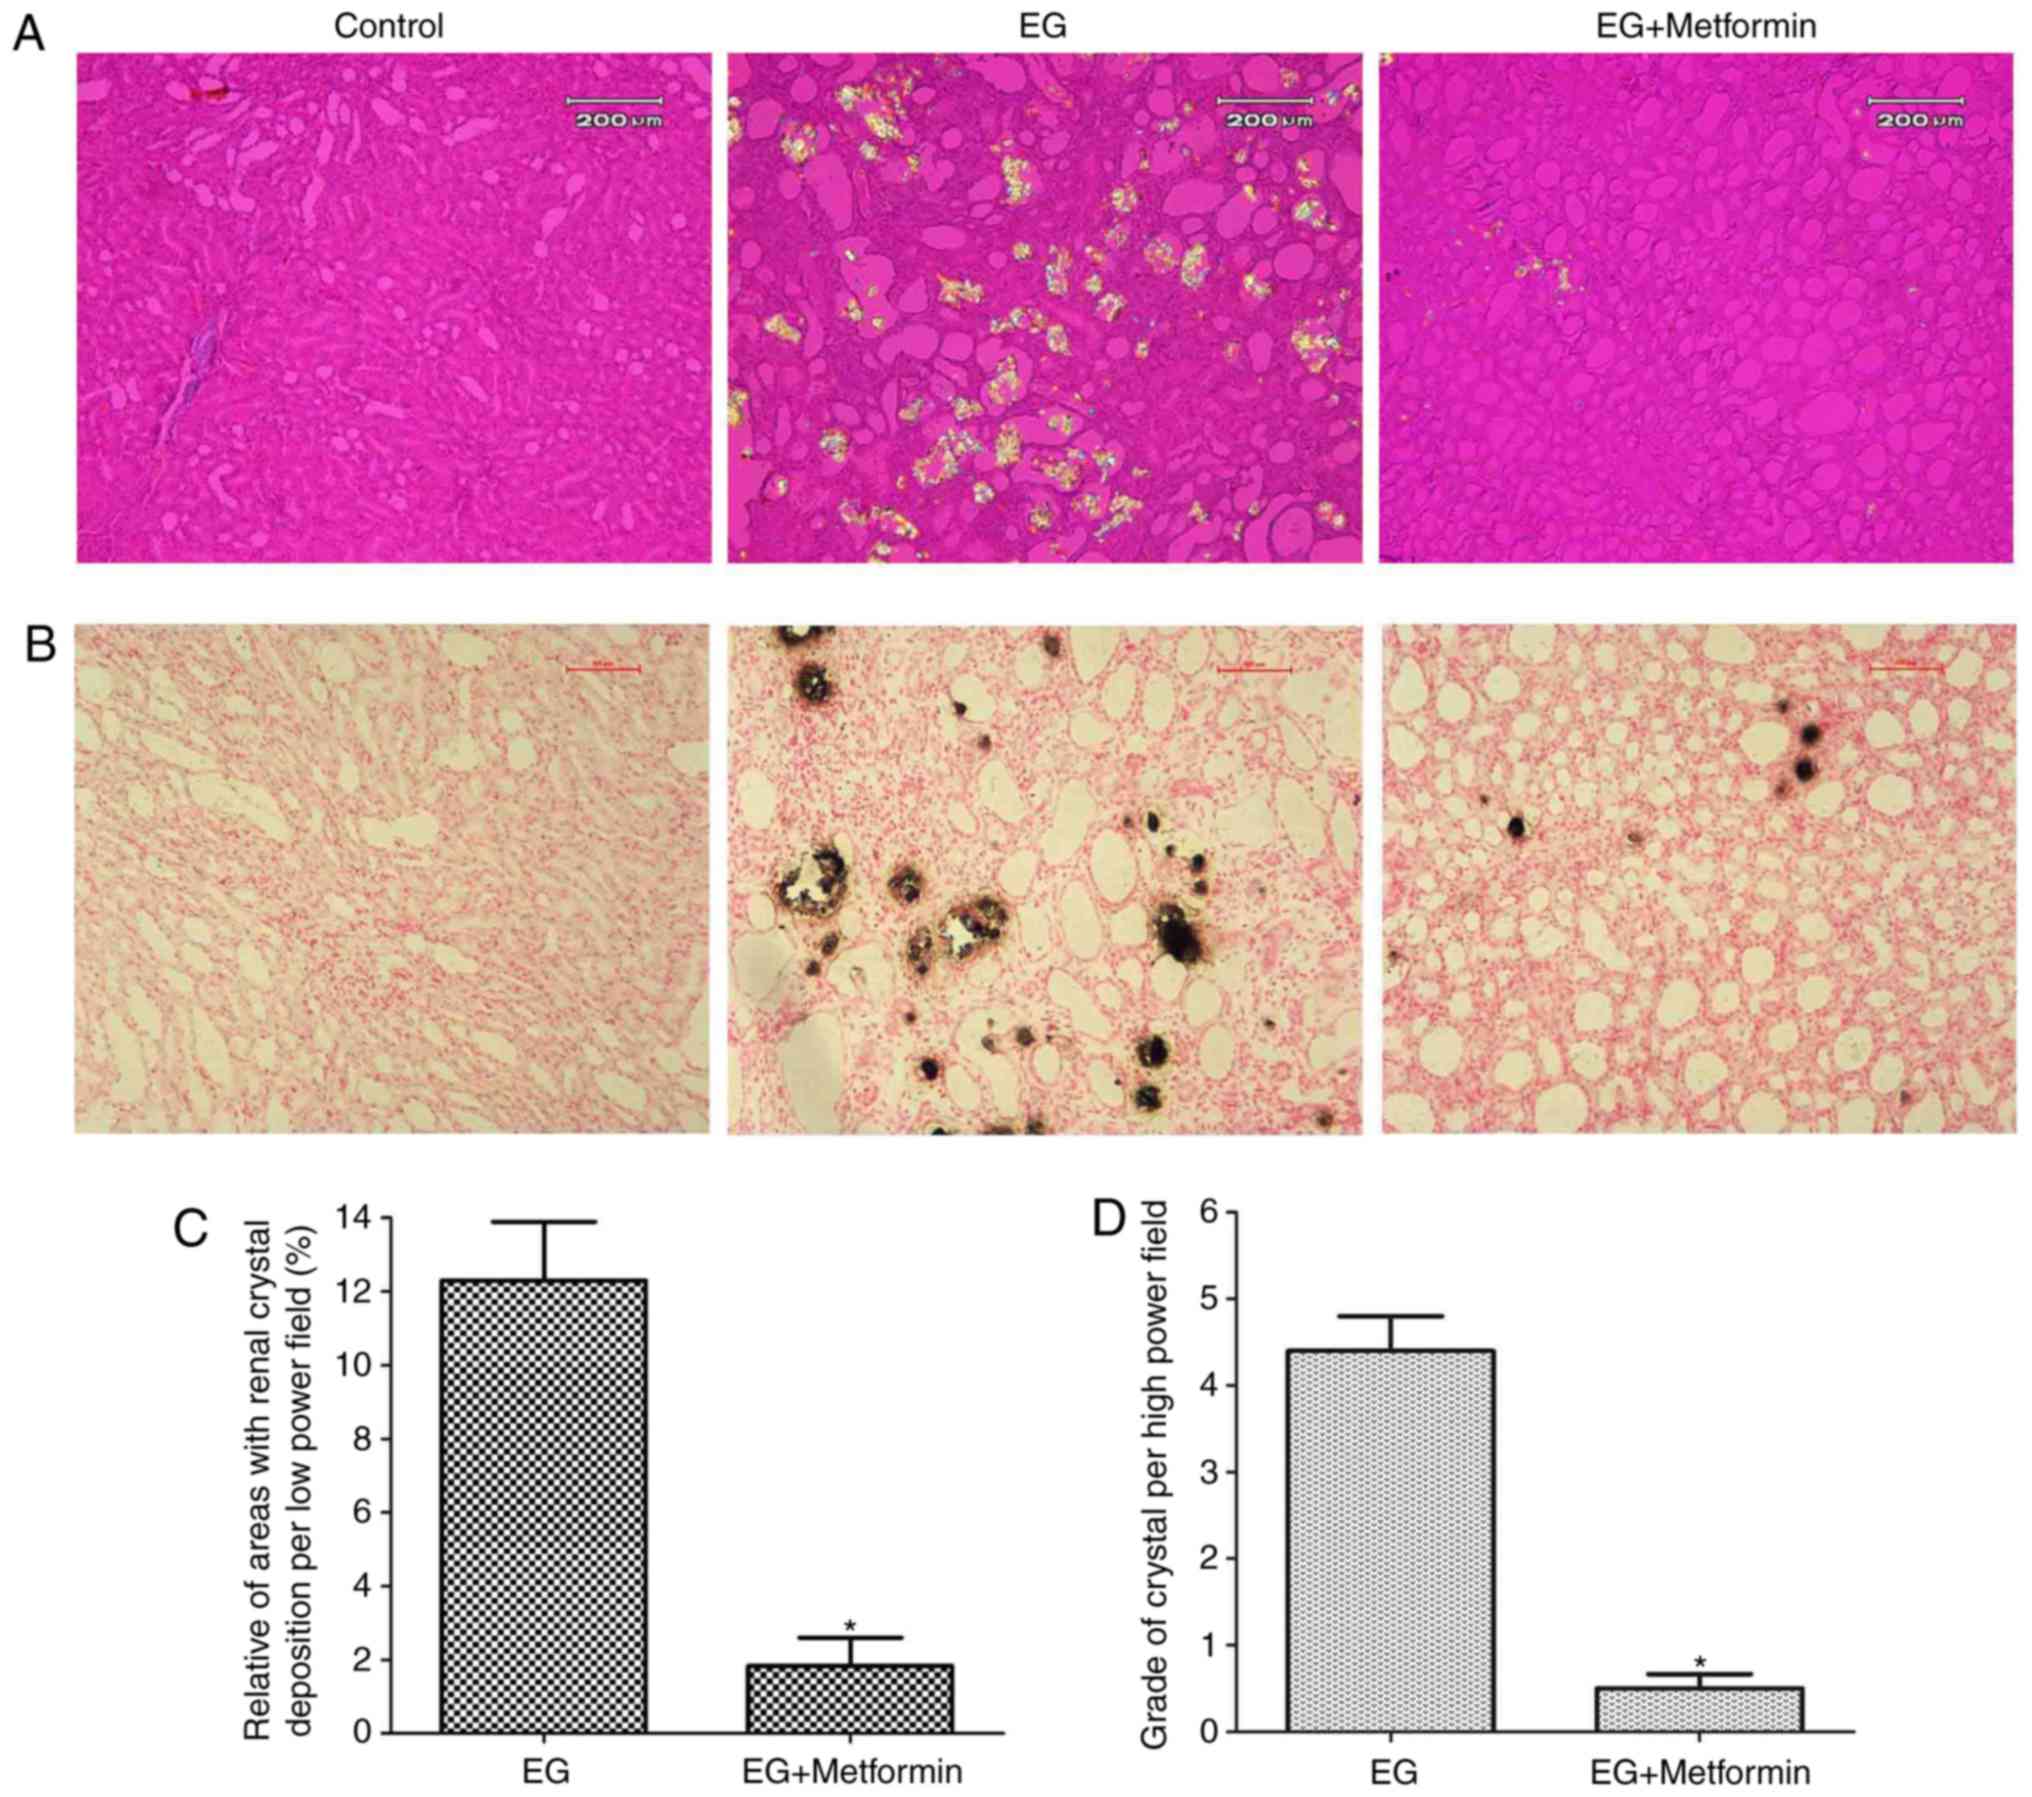 | Figure 8Morphologic distribution and
quantitative estimation of renal CaOx crystals. (A) Representative
micrographs of renal sections and crystal deposits in the control
group, EG group, and EG + metformin group, respectively, using
hematoxylin-eosin staining and polarized light optical
microphotography. Magnification, ×100. (B) Representative
micrographs of the control group, EG group, and EG + metformin
group, respectively, using Pizzolato staining. Magnification, ×100.
(C) Ratios of areas with renal crystal deposition per low-powered
field were estimated. (D) Grades of calcium oxalate deposits per
high-powered field were assessed. *P<0.05 vs. EG
group. Statistical analyses were performed using a two-tailed
unpaired t-test. EG, ethylene glycol. |
Discussion
Epidemiological and clinical data suggest that there
is an increased frequency of kidney stone disease worldwide
(1,3). However, with the exception of
endoscopic surgery and shock-wave lithotripsy, medical treatment
directed at the pathogenesis of nephrolithiasis remains scarce,
particularly for CaOx renal stones (33). The present study demonstrated that
metformin ameliorated CaOx kidney crystal sedimentation in an
EG-induced rat model. In addition, metformin treatment markedly
decreased the expression of inflammatory genes, including MCP-1 and
OPN, which have been demonstrated to be key in the pathogenesis of
CaOx nephrolithiasis (14-16,26).
Furthermore, in vitro studies with MDCK and HK-2 cells
demonstrated that Ox increased the expression levels of MCP-1 and
OPN, and that metformin reversed these effects. These findings
suggest that metformin markedly prevents the development of CaOx
nephrolithiasis, possibly by inhibiting the expression of MCP-1 and
OPN.
Metformin, the first-line treatment for patients
with type II diabetes mellitus and the most widely prescribed
antidiabetic drug in the world, has several properties, including
antioxidant effects, life-extending capabilities and antitumor
activity (18). Our previous
investigation showed that metformin effectively reduces renal
tubular injury resulting from the lipid peroxidation induced by Ox
and inhibit renal crystal deposition in rats (19). Notably, previous investigations
have shown that metformin suppresses inflammatory responses and
monocyte-to-macrophage differentiation through activation of the
AMP-activated protein kinase signaling pathway (34). Restricting the expression of OPN
and MCP-1 may be an attractive approach to the treatment of renal
crystal deposition (13-15). However, to the best of the
authors’ knowledge, at present, no studies have demonstrated the
effect of metformin on kidney crystal sedimentation by regulating
inflammatory mediators OPN and MCP-1.
MCP-1 is a chemokine with potent and specific
chemo-tactic activity towards recruiting monocytes, macrophages and
lymphocytes, and its overexpression has been associated with
various renal diseases and inflammatory cell infiltration (35,36). Several reports have concluded that
MCP-1 may be important in the pathogenesis of CaOx renal crystal
deposition (16,22,37). OPN is a glycosylated
phosphoprotein involved in various types of inflammatory disease by
regulating Th1-type immune responses and the migration of various
immune cells (17). Substantial
evidence implicates that OPN is pivotal in the development and
progression of CaOx nephrolithiasis (14,26,38). The data obtained in the present
study show that metformin prevented the overexpression of MCP-1 and
OPN in two Ox-induced renal tubular cell lines. These findings
corroborate those of earlier studies demonstrating that metformin
significantly attenuates renal cell damage and inflammatory
activation induced by Ox (16,22). Ox exposure has been shown to
promote the adherence of crystals to renal epithelial cells and
regulate the genes required for molecular functions, biologic
pathways and cellular components involved in the pathogenesis of
CaOx nephrolithiasis (39,40),
and MCP-1 and OPN have been recognized as major targets in
Ox-induced renal diseases (13,17,35,36). In addition, consistent with the
in vitro results, the expression levels of MCP-1 and OPN in
the kidneys were increased in EG-induced rat models and suppressed
by the administration of metformin. Based on these in vivo
and in vitro data, the present study clearly indicates that
metformin treatment markedly decreases the expression of OPN and
MCP-1 in renal tubular cells, although further investigations are
required.
The serum biochemistry results showed no significant
differences between the experimental groups, with the exception of
a small but significant increase of serum P in the EG group
compared with the control group. These findings corroborate those
of earlier serum biochemical analyses in an EG-induced rat model
(31). In the present study,
urinary Ox excretion was significantly higher in the EG and EG +
metformin groups than in the control group, with no differences in
urine volume, urinary pH or Ca excretion. These results are in
accordance with those of previous studies (31,41). Notably, metformin significantly
decreased the concentration of urinary Ox compared with that in the
EG group. These findings in the urinary biochemistry may be
associated with the decreased crystal formation in the kidney of
rats co-treated with EG and metformin. Of note, the finding that
the crystal formation induced by EG in experimental animals was
ameliorated by metformin administration provides potential evidence
that inflammation is causally involved in CaOx stone formation.
This is consistent with evidence obtained from other previous
studies that anti-inflammatory agents can ameliorate urolithiasis
(10,30,31).
The present study inevitably had certain potential
limitations. Firstly, the data shown in Fig. 7 were not quantitatively compared.
As the thin-slice reconstruction of non-enhanced CT images was a
macroscopic inspection, it did not clearly show the deposition of
very small crystals in kidney tissues. The results indicated that
no significant kidney crystals were detected in any field of kidney
tissues from the control (0/6) group or EG + metformin (0/6) group
(crystal depositions can be detected by polarized light optical
microscopic examination) in the non-enhanced CT images. Only the
rats treated with EG showed renal crystal depositions (5/6) by
non-enhanced CT images. Secondly, the concentrations of metformin
used in vitro were mainly determined by drug
pharmacokinetics and toxicological data. However, a dose of 200
mg/kg/day metformin was administered in vivo experiment as
recommended by in previous study (27,28). The association between metformin
levels in vitro and in vivo is not known. As the
in vivo environment is a complex ecological environment
composed of various types of cells, the drug is likely to be
affected by osmotic pressure, various hormones and other factors.
However, in vitro cell experiments are experimental models
under specific ideal conditions. To date, few studies have
specifically linked drug concentrations in in vitro and
in vivo experiments (42,43). Thirdly, the experiments did not
investigate the effect of metformin on nephrolithiasis in the
absence of OPN or MCP-1 by treating animals with anti-OPN and
anti-MCP-1 antibodies or by performing the experiments in animals
deficient in OPN or MCP-1 for in-depth validation experiments in
vivo. Therefore, further investigations are required to
identify the exact roles of OPN and MCP-1 in the inhibition of
renal stone formation by metformin.
In conclusion, the present study demonstrated that
treatment with metformin protected the kidney from EG-induced CaOx
crystal deposition in experimental animals, and that this
protection was based on correction of the Ox-induced increased
expression of OPN and MCP-1 in renal tubular epithelium cells.
Additionally, to the best of our knowledge, the present study is
the first to demonstrated in vitro and in vitro that
metformin may simultaneously regulate these two molecular targets
during the formation of stones. The present study has once again
expanded the clinical application potential of metformin and
elucidated its possible mechanism of action. These findings
establish metformin as a novel prospective therapeutic agent for
the treatment of CaOx stone formation and may benefit individuals
with primary hyperoxaluria or recurrent CaOx stone formation, for
whom there are few options for preventative measures, other than
increased water intake. These results are particularly noteworthy
as metformin, a widely used drug, may be developed for another
novel medical application in the future.
Funding
This study was supported by grants from the National
Natural Science Foundation of China (grant nos. 81700616 and
81472416), the Tianjin Science and Technology Popularization
Project (grant no. 15KPXM01SF034), the Science and Technology Fund
of Tianjin Municipal Bureau of health (grant no. 2014KZ110), the
Science and Technology Program of Tianjin (grant no.
18PTLCSY00020), and the Science and Technology Fund of Tianjin
Health and Family Planning Commission (grant no. 2015KZ102).
Availability of data and materials
The datasets used and/or analyzed during the current
study are available from the corresponding author on reasonable
request.
Authors’ contributions
CL designed the experiments, analyzed data and wrote
the manuscript. XY performed the experiments, analyzed data and
wrote the manuscript. TY performed the experiments and wrote the
manuscript. JieL performed the experiments and wrote the
manuscript. RY analyzed data and wrote the manuscript. SQ, YZ, LL,
JinL, XZ and KY performed the experiments and analyzed data. YX
analyzed the data and wrote the manuscript. All authors critically
reviewed content and approved the final version for
publication.
Ethics approval and consent to
participate
All applicable international, national, and
institutional guidelines for the care and use of animals were
followed. All animal procedures were conducted in strict compliance
with the Guide for the Care and Use of Laboratory Animals published
by the US National Institutes of Health (publication no. 85-23;
revised 1996; Bethesda, MD, USA). Ethical protocols were approved
by the Animal Care and Use Committee of Tianjin Medical University
and the Ethics Committees of Tianjin Medical University.
Patient consent for publication
Not applicable.
Competing interests
The authors declare that they have no competing
interests.
Acknowledgments
Not applicable.
References
|
1
|
Hesse A, Brändle E, Wilbert D, Köhrmann KU
and Alken P: Study on the prevalence and incidence of urolithiasis
in Germany comparing the years 1979 vs. 2000. Eur Urol. 44:709–713.
2003. View Article : Google Scholar : PubMed/NCBI
|
|
2
|
Saigal CS, Joyce G and Timilsina AR;
Urologic Diseases in America Project: Direct and indirect costs of
nephrolithiasis in an employed population: Opportunity for disease
management? Kidney Int. 68:1808–1814. 2005. View Article : Google Scholar : PubMed/NCBI
|
|
3
|
Turney BW, Reynard JM, Noble JG and
Keoghane SR: Trends in urological stone disease. BJU Int.
109:1082–1087. 2012. View Article : Google Scholar
|
|
4
|
Knoll T, Schubert AB, Fahlenkamp D,
Leusmann DB, Wendt-Nordahl G and Schubert G: Urolithiasis through
the ages: Data on more than 200,000 urinary stone analyses. J Urol.
185:1304–1311. 2011. View Article : Google Scholar
|
|
5
|
Yang X, Zhang C, Qi S, Zhang Z, Shi Q, Liu
C, Yang K, Du E, Li N, Shi J and Xu Y: Multivariate analyses of
urinary calculi composition: A 13-year single-center study. J Clin
Lab Anal. 30:873–879. 2016. View Article : Google Scholar : PubMed/NCBI
|
|
6
|
Milliner DS, Wilson DM and Smith LH:
Phenotypic expression of primary hyperoxaluria: Comparative
features of types I and II. Kidney Int. 59:31–36. 2001. View Article : Google Scholar : PubMed/NCBI
|
|
7
|
Pearle MS, Calhoun EA and Curhan GC;
Urologic Diseases of America Project: Urologic diseases in America
project: Urolithiasis. J Urol. 173:848–857. 2005. View Article : Google Scholar : PubMed/NCBI
|
|
8
|
Kumar S, Sigmon D, Miller T, Carpenter B,
Khan S, Malhotra R, Scheid C and Menon M: A new model of
nephrolithiasis involving tubular dysfunction/injury. J Urol.
146:1384–1389. 1991. View Article : Google Scholar : PubMed/NCBI
|
|
9
|
Kim HH, Kwak C, Jeong BC and Kim SW:
Effect of oxalate on the growth of renal tubular epithelial cells.
J Endourol. 16:261–264. 2002. View Article : Google Scholar : PubMed/NCBI
|
|
10
|
Fujii Y, Okada A, Yasui T, Niimi K,
Hamamoto S, Hirose M, Kubota Y, Tozawa K, Hayashi Y and Kohri K:
Effect of adiponectin on kidney crystal formation in metabolic
syndrome model mice via inhibition of inflammation and apoptosis.
PLoS One. 8:e613432013. View Article : Google Scholar : PubMed/NCBI
|
|
11
|
Khan SR: Reactive oxygen species as the
molecular modulators of calcium oxalate kidney stone formation:
Evidence from clinical and experimental investigations. J Urol.
189:803–811. 2013. View Article : Google Scholar
|
|
12
|
Taguchi K, Okada A, Hamamoto S, Iwatsuki
S, Naiki T, Ando R, Mizuno K, Tozawa K, Kohri K and Yasui T:
Proinflammatory and metabolic changes facilitate renal crystal
deposition in an obese mouse model of metabolic syndrome. J Urol.
194:1787–1796. 2015. View Article : Google Scholar : PubMed/NCBI
|
|
13
|
Rovin BH and Phan LT: Chemotactic factors
and renal inflammation. Am J Kidney Dis. 31:1065–1084. 1998.
View Article : Google Scholar : PubMed/NCBI
|
|
14
|
Wesson JA, Johnson RJ, Mazzali M,
Beshensky AM, Stietz S, Giachelli C, Liaw L, Alpers CE, Couser WG,
Kleinman JG and Hughes J: Osteopontin is a critical inhibitor of
calcium oxalate crystal formation and retention in renal tubules. J
Am Soc Nephrol. 14:139–147. 2003. View Article : Google Scholar
|
|
15
|
Khan SR and Kok DJ: Modulators of urinary
stone formation. Front Biosci. 9:1450–1482. 2004. View Article : Google Scholar : PubMed/NCBI
|
|
16
|
Umekawa T, Chegini N and Khan SR: Oxalate
ions and calcium oxalate crystals stimulate MCP-1 expression by
renal epithelial cells. Kidney Int. 61:105–112. 2002. View Article : Google Scholar : PubMed/NCBI
|
|
17
|
Morimoto J, Kon S, Matsui Y and Uede T:
Osteopontin; as a target molecule for the treatment of inflammatory
diseases. Curr Drug Targets. 11:494–505. 2010. View Article : Google Scholar : PubMed/NCBI
|
|
18
|
Novelle MG, Ali A, Diéguez C, Bernier M
and de Cabo R: Metformin: A hopeful promise in aging research. Cold
Spring Harb Perspect Med. 6:a0259322016. View Article : Google Scholar : PubMed/NCBI
|
|
19
|
Yang X, Ding H, Qin Z, Zhang C, Qi S,
Zhang H, Yang T, He Z, Yang K, Du E, et al: Metformin prevents
renal stone formation through an antioxidant mechanism in vitro and
in vivo. Oxid Med Cell Longev. 2016.4156075:2016.
|
|
20
|
Cavaglieri RC, Day RT, Feliers D and
Abboud HE: Metformin prevents renal interstitial fibrosis in mice
with unilateral ureteral obstruction. Mol Cell Endocrinol.
412:116–122. 2015. View Article : Google Scholar : PubMed/NCBI
|
|
21
|
Park HK, Jeong BC, Sung MK, Park MY, Choi
EY, Kim BS, Kim HH and Kim JI: Reduction of oxidative stress in
cultured renal tubular cells and preventive effects on renal stone
formation by the bioflavonoid quercetin. J Urol. 179:1620–1626.
2008. View Article : Google Scholar : PubMed/NCBI
|
|
22
|
Umekawa T, Iguchi M, Uemura H and Khan SR:
Oxalate ions and calcium oxalate crystal-induced up-regulation of
osteopontin and monocyte chemoattractant protein-1 in renal
fibroblasts. BJU Int. 98:656–660. 2006. View Article : Google Scholar : PubMed/NCBI
|
|
23
|
Huang MY, Chaturvedi LS, Koul S and Koul
HK: Oxalate stimulates IL-6 production in HK-2 cells, a line of
human renal proximal tubular epithelial cells. Kidney Int.
68:497–503. 2005. View Article : Google Scholar : PubMed/NCBI
|
|
24
|
Li Y and McMartin KE: Strain differences
in urinary factors that promote calcium oxalate crystal formation
in the kidneys of ethylene glycol-treated rats. Am J Physiol Renal
Physiol. 296:F1080–F1087. 2009. View Article : Google Scholar : PubMed/NCBI
|
|
25
|
Green ML, Hatch M and Freel RW: Ethylene
glycol induces hyperoxaluria without metabolic acidosis in rats. Am
J Physiol Renal Physiol. 289:F536–F543. 2005. View Article : Google Scholar : PubMed/NCBI
|
|
26
|
Khan SR, Johnson JM, Peck AB, Cornelius JG
and Glenton PA: Expression of osteopontin in rat kidneys: Induction
during ethylene glycol induced calcium oxalate nephrolithiasis. J
Urol. 168:1173–1181. 2002. View Article : Google Scholar : PubMed/NCBI
|
|
27
|
Quaile MP, Melich DH, Jordan HL, Nold JB,
Chism JP, Polli JW, Smith GA and Rhodes MC: Toxicity and
toxicokinetics of metformin in rats. Toxicol Appl Pharmacol.
243:340–347. 2010. View Article : Google Scholar
|
|
28
|
Matveyenko AV, Dry S, Cox HI, Moshtaghian
A, Gurlo T, Galasso R, Butler AE and Butler PC: Beneficial
endocrine but adverse exocrine effects of sitagliptin in the human
islet amyloid polypeptide transgenic rat model of type 2 diabetes:
Interactions with metformin. Diabetes. 58:1604–1615. 2009.
View Article : Google Scholar : PubMed/NCBI
|
|
29
|
Livak KJ and Schmittgen TD: Analysis of
relative gene expression data using real-time quantitative PCR and
the 2(-Delta Delta C(T)) method. Methods. 25:402–408. 2001.
View Article : Google Scholar
|
|
30
|
Taguchi K, Okada A, Kitamura H, Yasui T,
Naiki T, Hamamoto S, Ando R, Mizuno K, Kawai N, Tozawa K, et al:
Colony-stimulating factor-1 signaling suppresses renal crystal
formation. J Am Soc Nephrol. 25:1680–1697. 2014. View Article : Google Scholar : PubMed/NCBI
|
|
31
|
Taguchi K, Okada A, Yasui T, Kobayashi T,
Ando R, Tozawa K and Kohri K: Pioglitazone, a peroxisome
proliferator activated receptor γ agonist, decreases renal crystal
deposition, oxidative stress and inflammation in hyperoxaluric
rats. J Urol. 188:1002–1011. 2012. View Article : Google Scholar
|
|
32
|
Tsujihata M, Momohara C, Yoshioka I,
Tsujimura A, Nonomura N and Okuyama A: Atorvastatin inhibits renal
crystal retention in a rat stone forming model. J Urol.
180:2212–2217. 2008. View Article : Google Scholar : PubMed/NCBI
|
|
33
|
Moe OW: Kidney stones: Pathophysiology and
medical management. Lancet. 367:333–344. 2006. View Article : Google Scholar : PubMed/NCBI
|
|
34
|
Vasamsetti SB, Karnewar S, Kanugula AK,
Thatipalli AR, Kumar JM and Kotamraju S: Metformin inhibits
monocyte-to-macrophage differentiation via AMPK-mediated inhibition
of STAT3 activation: Potential role in atherosclerosis. Diabetes.
64:2028–2041. 2015. View Article : Google Scholar : PubMed/NCBI
|
|
35
|
Matsushita Y, Ogawa D, Wada J, Yamamoto N,
Shikata K, Sato C, Tachibana H, Toyota N and Makino H: Activation
of peroxisome proliferator-activated receptor delta inhibits
streptozotocin-induced diabetic nephropathy through
anti-inflammatory mechanisms in mice. Diabetes. 60:960–968. 2011.
View Article : Google Scholar : PubMed/NCBI
|
|
36
|
Grandaliano G, Gesualdo L, Ranieri E,
Monno R, Montinaro V, Marra F and Schena FP: Monocyte chemotactic
peptide-1 expression in acute and chronic human nephritides: A
pathogenetic role in interstitial monocytes recruitment. J Am Soc
Nephrol. 7:906–913. 1996.PubMed/NCBI
|
|
37
|
Umekawa T, Tsuji H, Uemura H and Khan SR:
Superoxide from NADPH oxidase as second messenger for the
expression of osteopontin and monocyte chemoattractant protein-1 in
renal epithelial cells exposed to calcium oxalate crystals. BJU
Int. 104:115–120. 2009. View Article : Google Scholar : PubMed/NCBI
|
|
38
|
Okada A, Nomura S, Saeki Y, Higashibata Y,
Hamamoto S, Hirose M, Itoh Y, Yasui T, Tozawa K and Kohri K:
Morphological conversion of calcium oxalate crystals into stones is
regulated by osteopontin in mouse kidney. J Bone Miner Res.
23:1629–1637. 2008. View Article : Google Scholar : PubMed/NCBI
|
|
39
|
Koul S, Khandrika L, Meacham RB and Koul
HK: Genome wide analysis of differentially expressed genes in HK-2
cells, a line of human kidney epithelial cells in response to
oxalate. PLoS One. 7:e438862012. View Article : Google Scholar : PubMed/NCBI
|
|
40
|
Koul HK, Koul S, Fu S, Santosham V,
Seikhon A and Menon M: Oxalate: From crystal formation to crystal
retention. J Am Soc Nephrol. 10(Suppl 14): S417–S421.
1999.PubMed/NCBI
|
|
41
|
Itoh Y, Yasui T, Okada A, Tozawa K,
Hayashi Y and Kohri K: Preventive effects of green tea on renal
stone formation and the role of oxidative stress in
nephrolithiasis. J Urol. 173:271–275. 2005. View Article : Google Scholar
|
|
42
|
Pearlstein RA, McKay DJJ, Hornak V,
Dickson C, Golosov A, Harrison T, Velez-Vega C and Duca J: Building
new bridges between in vitro and in vivo in early drug discovery:
Where molecular modeling meets systems biology. Curr Top Med Chem.
17:2642–2662. 2017. View Article : Google Scholar : PubMed/NCBI
|
|
43
|
Jaroch K, Jaroch A and Bojko B: Cell
cultures in drug discovery and development: The need of reliable in
vitro-in vivo extrapolation for pharmacodynamics and
pharmacokinetics assessment. J Pharm Biomed Anal. 147:297–312.
2018. View Article : Google Scholar
|