Introduction
Uric acid is an independent risk factor for renal
progression and the deposition of uric acid in the kidney causes
gouty nephropathy. It is hypothesized that inflammatory factors
serve an important role in gouty nephropathy (1). Human peripheral blood mononuclear
cells (PBMCs) are the key factors in the activation of the immune
response. These cells undergo activation, proliferation and
differentiation into various cellular subtypes and initiate
metabolic reprogramming during these processes. Uric acid crystals
have been demonstrated to initiate interleukin-1β (IL-1β)-mediated
inflammation via the activation of the NOD-like receptor protein 3
(NLRP3) inflammasome (2), a
multi-molecular complex comprised of NLRP3, apoptosis-associated
speck like protein (ASC), and caspase-1. NLRP3 is activated
primarily in innate immune cells, including macrophages, and by a
variety of stimuli including pathogens and danger signals (3). The activation of NLRP3 has been
demonstrated to be central to a number of pathological inflammatory
conditions (4,5).
Renewed interest in gouty nephropathy has been
generated by previous observations indicating that gouty
nephropathy is closely associated with hypertension, insulin
resistance, obesity, fatty liver disease, cardiovascular disease
and other metabolic diseases (6,7).
There is a known association between hyperlipidaemia and gout
formation (8). A prospective
cohort study of 1,606 Chinese patients with gout revealed a
significant association with hyperlipidaemia (9). A previous study suggested that a
high uric acid concentration resulted in abnormal lipid metabolism
and, in turn, these changes in lipid metabolism caused by the
presence of abnormal free fatty acids (FAs) were also an important
pathological basis of hyperuricaemia (10). However, how the activation of the
NLRP3 inflammasome and the changes in lipid metabolomics lead to
the progression of gouty nephropathy remains unclear.
Therefore, the present study detected the mRNA and
protein expression levels of NLRP3, ASC and caspase-1 in peripheral
blood mononuclear cells, and the level of the downstream
inflammatory factors IL-1β and IL-18 in plasma, in order to
evaluate whether the NLRP3 inflammasome was activated in gouty
nephropathy. Concomitantly, it was proposed that plasma
metabolomics analysis based on ultra-performance liquid
chromatography coupled with quadrupole time-of-flight mass
spectrometry (UPLC-QTOF/MS) may be used to identify differentially
expressed metabolites in gouty nephropathy. Subsequently, the aim
of the present study was to combine the analysis of plasma
metabolomics with the NLRP3 inflammasome to reveal the mechanism of
renal damage induced by hyperuricaemia and to identify novel
potential biomarkers for the diagnosis of gouty nephropathy.
Materials and methods
Patients
The study samples were provided by the Affiliated
Bao'an Hospital of Shenzhen, Southern Medical University (Shenzhen,
China). The study was approved by the Ethics Committee of the
Affiliated Bao'an Hospital of Shenzhen and written informed consent
was obtained from all participants. Male patients between the ages
of 18-70 years (mean age, 49.56±11.78 years) examined in the
Affiliated Bao'an Hospital of Shenzhen between July 2016 and June
2017 were selected as the subjects. According to the inclusion and
exclusion criteria, these patients were divided into three groups
of 30 patients each: Control; hyperuricaemia; and gouty nephropathy
groups. The control group included in the study underwent a
standard health examination. Hyperuricaemia was considered when
serum uric acid values were >7 mg/dl for males (11). The diagnosis of gouty nephropathy
is based on the diagnosis of primary gout (12), with a diagnosis of at least one of
the following: Urinary protein ≥150 mg/dl; urine white blood cells
>5/high power field (HPF); urine red blood cells >3/HPF;
serum creatinine >115 µmol/l; and blood uric
acid/creatinine >2.5. Additionally, an ultrasound or
ureterography revealing renal calculus or a shrunken kidney was
also considered. All of the aforementioned cases excluded urinary
tract infections and other diseases, including cancer. In addition,
the exclusion criteria, were as follows: Female sex; age <18
years or >70 years; patients with secondary hyperuricaemia or
stage 4-5 chronic kidney disease; acute hyperuricaemia; and the
existence of acute renal function deterioration factors.
Additionally, patients with hyperglycaemia, severe cardiovascular
diseases, liver and kidney disease, lung disease, fractures,
tumours, infectious and autoimmune diseases, and mental illness
were excluded. Exceptions to these were diseases that may affect
the NLRP3 inflammasome signalling pathways. Other exclusion
criteria included the use of uric acid drugs outside the hospital
or treatment with lipid-lowering drugs or anti-inflammatory and
anti-oxidative drugs during the 4 weeks prior to admission.
Materials and reagents
Cell culture reagents including media, PBS and
TRIzol® were obtained from Invitrogen; Thermo Fisher
Scientific, Inc. Methanol and acetonitrile were purchased from
Merck KGaA and NH4HCO3 from Sigma-Aldrich;
Merck KGaA. The Dynabeads® Untouched™ Human Monocytes
kit was purchased from Invitrogen; Thermo Fisher Scientific, Inc.
The RevertAid First Strand cDNA Synthesis kit, and Applied
Biosystems 7500 and qPCR equipment were purchased from Thermo
Fisher Scientific, Inc. Antibodies against NLRP3, ASC and Caspase-1
(NLRP3, cat. no. sc-134306; Caspase-1, cat. no. sc-622; ASC, cat.
no. sc-514414) were purchased from Santa Cruz Biotechnology, Inc.
The BCA kit was purchased from Pierce; Thermo Fisher Scientific,
Inc. The human IL-18 (cat. no. 70-EK1182) and IL-1β (cat. no.
70-EK101B2) ELISA kits were purchased from Hangzhou MultiSciences
(Lianke) Biotech. UPLC was purchased from Waters Corporation and
the Triple TOF™ 5600+ Mass Spectrometry system was obtained from AB
SCIEX LLC.
Detection of organ function
indicators
Sera and urine samples were obtained after 8 h of
fasting. A 50 µl sample of serum was collected from each
patient, centrifuged at 500 × g for 10 min at 4°C, and the
supernatant was collected and immediately stored at −80°C until
LC-MS analysis. A 15 ml serum sample was collected and sent to
Laboratory Services (Affiliated Bao'an Hospital of Shenzhen) for
biochemical analysis. Urinary biochemical parameters were measured
in the first urine-voiding sample of the day. Standard biochemical
parameters performed included blood lipids, urine analysis, liver,
renal and coagulation functions.
Isolation of peripheral blood mononuclear
cells
Anti-coagulated blood was centrifuged at 1,600 × g
for 10 min at 4°C, and the buffy coat was collected and stored at
−80°C for future use. Peripheral blood mononuclear cells were
isolated from the lymphocyte lysate. Mononuclear cells were
isolated by negative selection using magnetic beads from the
Dynabeads® Untouched™ Human Monocytes kit according to
the protocol of the manufacturer. The isolated mononuclear cell
lysates were separated and 5 µl was used for counting, and
the number of monocytes used for RNA extraction and the cells used
for the western blot analysis experiments were divided into 1:2
ratios. Then, 200 µl TRIzol® was added to
mononuclear cells for RNA extraction and ~50 µl PBS was used
for western blot analysis experiments.
Reverse transcription-quantitative
polymerase chain reaction (RT-qPCR), western blot analysis and
ELISA assays
TRIzol® (Invitrogen; Thermo Fisher
Scientific, Inc.) was used to extract RNA from leukocytes
(200,000-400,000 cells). Following the protocol of the manufacturer
of the Revert Aid First Strand cDNA Synthesis kit (cat. no: K1622;
Thermo Fisher Scientific, Inc.) and the TransStart® Tip
Green qPCR SuperMix (2X) kit (cat. no. AQ141; TransGen Biotech Co.,
Ltd.), which contained the SYBR Green I fluorophore, the RNA
content of NLRP3, ASC and caspase-1 in the samples was detected.
β-actin gene was used as the internal reference. The primer
sequences are presented in Table
I. PCR was conducted using the Applied Biosystems 7500 system
(Applied Biosystems; Thermo Fisher Scientific, Inc.) with the
following thermocycling conditions: Pre-denaturation at 95°C for 30
sec, followed by 40 cycles at 95°C for 5 sec and 60°C for 30 sec;
finally, the melting curve was generated (dissociation, 60°C at 30
sec and 95°C at 15 sec) to test specificity of the primers and PCR
reactions. Gene expression was calculated using the
2−ΔΔCq method (13).
 | Table IPrimer sequences. |
Table I
Primer sequences.
| Group | Upstream | Downstream |
|---|
| β-actin |
5′-AACCGCGAGAAGATGACCCAGAT-3′ |
5′-GGATAGCACAGCCTGGATAGCA-3′ |
| NLRP3 |
5′-ATGGGTTTACTGGAGTACCTTTC-3′ |
5′-CTGTCTTCAATGCACTGGAATCTG-3′ |
| ASC |
5′-GATGCTCTGTACGGGAAGGTC-3′ |
5′-TCCAGTTCCAGGCTGGTGT-3′ |
| Caspase-1 |
5′-GGAAGACTCATTGAACATATGCAAG-3′ |
5′-CTTGTCAAAGTCACTCTTTCAGTG-3′ |
For western blotting, cells were washed 3 times with
PBS solution (Invitrogen; Thermo Fisher Scientific, Inc.) and lysed
in ice-cold lysis buffer (cat. no. R0020; Beijing Solarbio Science
& Technology Co., Ltd.). Quantitative analysis of protein
concentrations was performed according to the protocol of the
bicinchoninic acid kit (cat. no. 23225; Thermo Fisher Scientific,
Inc.). Protein samples (10 µg) were added to SDS-PAGE gels
(8, 10 or 12%) and electrophoresed at 100 V. Gels were transferred
to PVDF membranes (EMD Millipore), blocked with 5% milk/TBS-1%
Tween [Sangon Biotech (Shanghai) Co., Ltd.] at room temperature for
1 h. Primary antibodies [NLRP3, 1:300; Caspase-1, 1:300; ASC (all
Santa Cruz Biotechnology, Inc.); GAPDH, 1:1,000 (cat. no. A01020-1;
Abbkine, Inc.)] were diluted with 1% BSA/PBS-0.1% Tween (PBST)
[Sangon Biotech (Shanghai) Co., Ltd.], and membranes were incubated
with them at 4°C overnight. Subsequently, the PVDF membranes were
incubated with horseradish peroxidase-labeled secondary antibodies
[goat anti-mouse (1:1,000; cat. no. A0216; Beyotime Institute of
Biotechnology); goat anti-rabbit (1:10,000; cat. no. A21020-1;
Abbkine, Inc.) diluted in 5% milk/PBST at room temperature for 1 h
with agitation. The PVDF membranes were then exposed to a
luminescent reagent (cat. no. 32109; Thermo Fisher Scientific,
Inc.) for 1.5-2.0 min and were observed with a gel imaging system
(Gel Doc™ XR+Gel Documentation system; Bio-Rad Laboratories, Inc.).
Concentrations of IL-1β and IL-18 in the plasma were measured using
ELISA kits according to manufacturer's protocol.
Sample preparation prior to UPLC-MS
Serum samples were thawed at room temperature prior
to analysis. Briefly, 50 µl serum was prepared, and 200
µl methanol containing the internal standard molecules was
added, following which 180 µl supernatant was freeze-dried.
The lyophilized powder was re-dissolved in 80 µl
acetonitrile/water in a volume ratio of 1/4 and vortexed for 30
sec. The supernatant was centrifuged at 500 × g for 10 min at 4°C
and injected into the UPLC system for analysis. Concomitantly, in
order to monitor the condition and stability of the UPLC instrument
system, a blank control sample was injected prior to analysis of
each sample.
Chromatography protocol
For LC-MS analysis, 5 µl sample was injected.
Chromatography was performed using a Waters BEH C8 column (100×2.1
mm; 1.7 µm; Waters Corporation) in positive ion mode. The
column was maintained at 50°C. The mobile phase consisted of 0.1%
formic acid in water (A) and 0.1% formic acid in acetonitrile (B).
With a flow rate of 0.35 ml/min, the gradient condition of the
mobile phase was as follows: The initial gradient was 10% B over 1
min, then reaching 40% in 4 min, and finally reaching 100% in 12
min and sustained for 5 min. Subsequently, it was returned to the
initial 10% in 22.1 min and maintained for 2.9 min for optimal
column balance.
Chromatography was performed on an ACQUITY UPLC HSS
T3 column (100 × 2.1 mm, 1.8 µm; Waters Corporation) in
negative ion mode. The column was maintained at 50°C. The mobile
phase consisted of 0.1% 6.5 mM NH4HCO3 in
water (A) and 95% methanol and 6.5 mM NH4HCO3
in water (B). With a flow rate of 0.35 ml/min, the gradient
condition of the mobile phase was as follows: The initial gradient
was 0% B over 1 min, reaching 40% in 2 min, and finally reaching
100% in 13 min and sustained for 5 min. Subsequently, it was
returned to the initial 0% in 22.1 min and maintained for 2.9 min
for optimal column balance. A mixture of internal standards was
injected, and their times were used to correct retention time
drifts due to different instruments and different experimental
batches. The internal standards used for the positive and negative
ion modes are summarized in Table
II.
| Table IIInternal standards used for retention
time calibration. |
Table II
Internal standards used for retention
time calibration.
| Internal
standard | Molecular
formula | Concentration
(µg/ml) |
|---|
| Carnitine
C2:0-d3 |
C9D3H14NO4 | 0.16 |
| Carnitine
C10:0-d3 |
C17D3H30NO4 | 0.10 |
| Carnitine
C16:0-d3 |
C23D3H42NO4 | 0.15 |
| LPC 19:0 |
C27H56NO7P | 0.75 |
| FFA C16:0-d3 |
C16H32O2 | 2.50 |
| FFA C18:0-d3 |
C18H36O2 | 2.50 |
| CA-d4 |
C24D4H36O5 | 1.85 |
| CDCA-d4 |
C24D4H36O4 | 1.49 |
| leu-d3 |
C6H13NO2 | 5.00 |
| Phe-d5 |
C9D5H6NO2 | 3.61 |
| Trp-d5 |
C11D5H7N2O2 | 4.25 |
Mass spectrometry conditions
The pooled serum extract was analysed by a UPLC
system coupled with an AB SCIEX Triple TOF 5600+ System operating
in negative and positive ion electrospray ionization modes. The
scanning m/z range was from 50 to 1,200. Curtain gas, ion source
gas 1 and ion source gas 2 were set at 0.241, 0.276, and 0.276 MPa,
respectively. The following conditions were used: Curtain gas, 35
PSI; ion source gas 1, 50 PSI; ion source gas 2, 50 PSI; interface
heater temperature, 500°C. The cluster voltage and collision energy
were, respectively, set at 100 and 10 V for the positive mode, and
−100 and −10 V for the negative mode. The sample was also analysed
by IDA auto-MS2 mode with the collision energy voltage
set at 20 and 40 eV for positive mode, and −20 and −40 V for
negative mode.
Statistical analysis
Data were identified using Marker View software for
peak identification and peak matching, and pattern recognition
analysis was performed using SIMCA-P software (v 11.0; Sartorius
Stedum Data Analytics). Principal component analysis (PCA) was
applied. Heat map analysis was performed using the Multiple
Experiment Viewer 4.5 software (mev.tm4.org).
Potential biomarkers in the plasma were identified based on the
in-house database and the Human Metabolome Database (http://www.hmdb.ca/). The in-house LC-MS database
(14) was established under
standard operation procedure conditions using available metabolite
standards and previously identified metabolites. Data are presented
as the mean ± standard deviation. A one-way analysis of variance
was used to compare the means of multiple groups followed by the
Bonferroni test. Student's t-test was used to compare the mean
values between the hyperuricaemia and gouty nephropathy groups.
Metabolites that were significantly different between the two
groups, as determined by Student's t-test, were considered to be
the biomarkers responsible for the differentiation of
hyperuricaemia from nephropathy group. P<0.05 were considered to
be statistically significant. Statistical analyses were performed
using SPSS 17.0 software (SPSS, Inc.).
Results
General observations
As demonstrated in Tables III and IV, no significant differences in terms
of age, body mass index and mean arterial pressure were observed
between the control, hyperuricaemia and nephropathy groups. Serum
uric acid and creatinine are important metabolites in
hyperuricaemia. The levels of serum creatinine and blood urea
nitrogen are the most commonly used indicators of renal function.
Urine leukocyte, urine erythrocyte and urine protein levels were
used to indicate the progression of gouty nephropathy. A marked
increase in uric acid and creatinine levels was observed in the
hyperuricaemia and gouty nephropathy groups compared with the
control group (P<0.01). Additionally, the levels of uric acid,
creatinine, blood urea nitrogen, urine leukocyte, urine erythrocyte
and urine protein were increased in the gouty nephropathy group
when compared with the hyperuricaemia group (P<0.05). These
results demonstrated that the kidney had been damaged in the
progression from hyperuricaemia to gouty nephropathy.
| Table IIIClinical and demographic summary. |
Table III
Clinical and demographic summary.
|
Characteristics | Groups
|
|---|
| Healthy control
(n=30) | Hyperuricemia
(n=30) | Gouty nephropathy
(n=30) |
|---|
| Age, years | 47.00±10.19 | 43.27±12.91 | 44.32±11.51 |
| BMI,
kg/m2 | 23.95±1.51 | 24.67±3.24 | 23.70±2.58 |
| MAP, mmHg | 88.57±7.08 | 88.00±7.21 | 89.94±6.33 |
| FBG, mmol/l | 4.73±0.45 | 5.17±0.70a | 4.77±0.39b |
| Table IVOrgan function indicators of enrolled
patients. |
Table IV
Organ function indicators of enrolled
patients.
|
Characteristics | Groups
|
|---|
| Healthy control
(n=30) | Hyperuricemia
(n=30) | Gouty nephropathy
(n=30) |
|---|
| UA, mmol/l | 204.30±61.43 |
513.13±120.88a |
550.06±82.95a,b |
| Cr,
µmol/l | 35.72±9.36 | 65.63±26.32a | 72.65±22.60a,b |
| BUN, mmol/l | 4.34±1.17 | 4.65±1.55 | 5.72±1.74a,b |
| TC, mmol/l | 4.35±1.25 | 5.21±1.10 | 4.94±1.29 |
| TG, mmol/l | 0.95±0.48 | 1.23±0.54c | 2.07±1.71a,d |
| HDL, mmol/l | 1.52±0.46 | 1.41±0.49 | 1.33±0.47 |
| LDL, mmol/l | 2.32±0.79 | 2.76±1.08 | 3.30±0.85 |
| Urine leukocyte,
/HP | 1.17±1.15 | 1.41±1.74 | 4.33±8.88b,c |
| Urine erythrocyte,
/HP | 0.66±0.90 | 1.97±1.80 | 28.07±52.06a,d |
| Urine protein | ND | ND | + |
Fasting blood glucose and blood lipids levels
indicate the level of blood glucose and lipid metabolism in the
body, respectively. In the present study, the fasting blood glucose
levels in the hyperuricemia and gouty nephropathy groups were
slightly increased compared with that in the control group, which
was considered to be the result of the small sample size. None of
the patients selected in the present study had diabetes. The
indicators of blood lipids include total cholesterol, total
triglycerides, high density lipoprotein and low-density lipoprotein
levels. Compared with the control group, the hyperuricaemia and
gouty nephropathy groups exhibited a significant increase in
fasting blood glucose levels (P<0.01): However, there was no
significance between the hyperuricaemia and gouty nephropathy
groups. Compared with the control and hyperuricaemia groups, the
levels of total triglycerides were significantly increased in the
gouty nephropathy group (P<0.01). These results suggested that
lipid disorders may serve a role in the progression from
hyperuricaemia to gouty nephropathy.
Peripheral blood mononuclear cells
The peripheral blood mononuclear cells were isolated
for analysis. The Trypan Blue staining test confirmed that >95%
of cells were living. The cell concentration was adjusted to
5×10⁵/ml. Cell counts are presented in Table V.
| Table VPeripheral blood mononuclear cells
count. |
Table V
Peripheral blood mononuclear cells
count.
| Group | N | Count
(105) |
|---|
| Control | 30 | 39.760±21.453 |
| Hyperuricemia | 30 | 43.803±16.393 |
| Gouty
nephropathy | 30 | 30.100±13.365 |
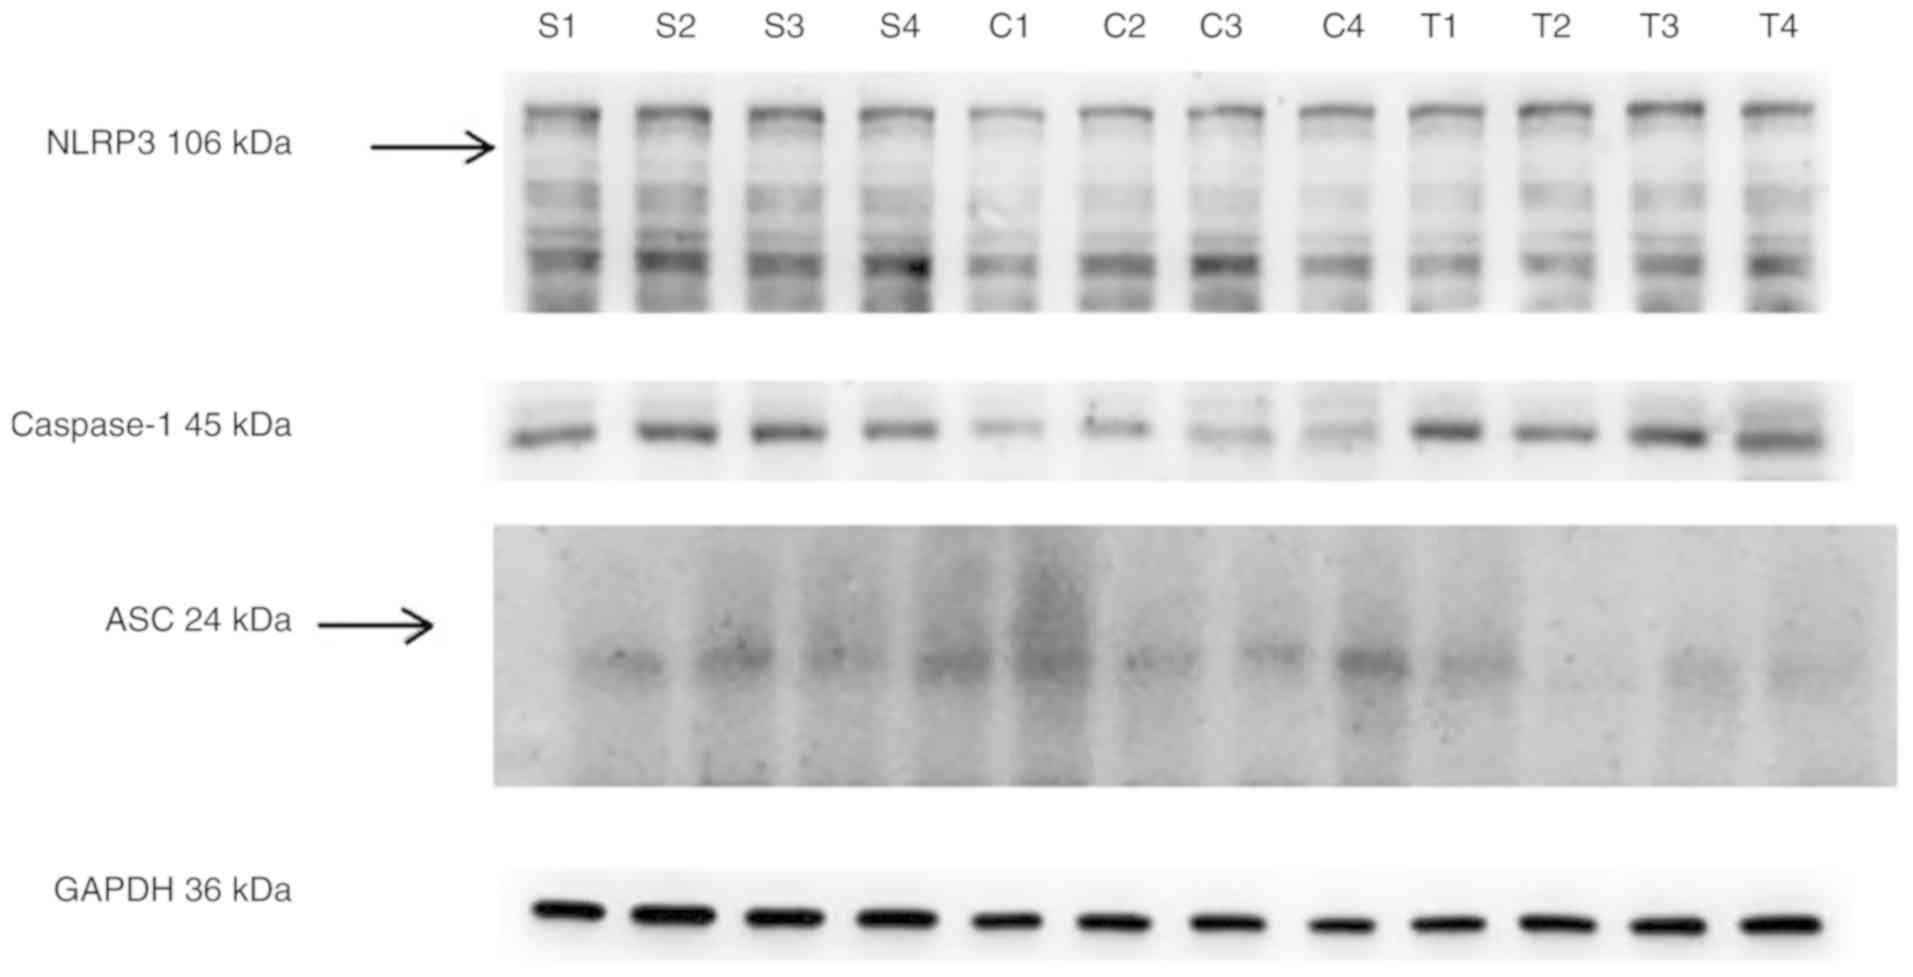
mRNA and protein expression of NLRP3, ASC
and caspase-1 in peripheral blood mononuclear cells and ELISA
analyses of plasma IL-1β and IL-18 levels
Compared with the control group, the expression
levels of NLRP3, ASC and caspase-1 mRNA, and ASC and caspase-1
protein in peripheral blood mononuclear cells were increased in the
hyperuricaemia and gouty nephropathy groups (P<0.05).
Additionally, the levels of IL-1β and IL-18 in plasma were
increased (P<0.01). Compared with the hyperuricaemia group, the
gouty nephropathy group exhibited increased NLRP3 and ASC mRNA
expression levels, and ASC and caspase-1 protein expression levels,
and IL-1β and IL-18 plasma levels (P<0.05; Table VI; Fig. 1). These data suggested that the
expression levels of NLRP3 protein were consistent with the pattern
of its corresponding mRNA expression level, exhibiting an increase
in expression in the gouty nephropathy group when compared with the
control and hyperuricaemia groups. This result suggests that NLRP3
may serve a regulatory role in the inflammatory process of gouty
nephropathy. In particular, the notable increase in the expression
levels of the inflammasome factors IL-1β and IL-18 indicated that
the NLRP3 inflammasome was closely associated with gouty
nephropathy.
| Table VImRNA and protein expression levels of
NLRP3, ASC and caspase-1 in peripheral blood mononuclear cells and
ELISA analyses for plasma IL-1β and IL-18 levels. |
Table VI
mRNA and protein expression levels of
NLRP3, ASC and caspase-1 in peripheral blood mononuclear cells and
ELISA analyses for plasma IL-1β and IL-18 levels.
| Indicators | Groups
|
|---|
| Control (n=30) | Hyperuricemia
(n=30) | Gouty nephropathy
(n=30) |
|---|
| NLRP3 mRNA | 23.91±1.28 | 26.11±1.81a | 27.22±1.84a,b |
| ASC mRNA | 24.81±1.56 | 27.90±3.09a | 33.12±3.14a,b |
| caspase-1 mRNA | 26.22±1.57 | 29.16±2.71a | 29.04±2.32a |
| NLRP3/GAPDH | 0.45±0.21 | 0.47±0.16c | 0.54±0.18c |
| ASC/GAPDH | 0.27±0.11 | 0.41±0.19c | 0.52±0.18a,d |
|
Caspase-1/GAPDH | 0.51±0.15 | 0.62±0.15a | 0.72±0.14c,d |
| IL-1β (pg/ml) | 31.59±16.57 | 49.92±16.05a | 81.49±25.93a,b |
| IL-18 (pg/ml) | 312.30±93.54 |
645.43±314.79a |
930.72±511.65a,b |
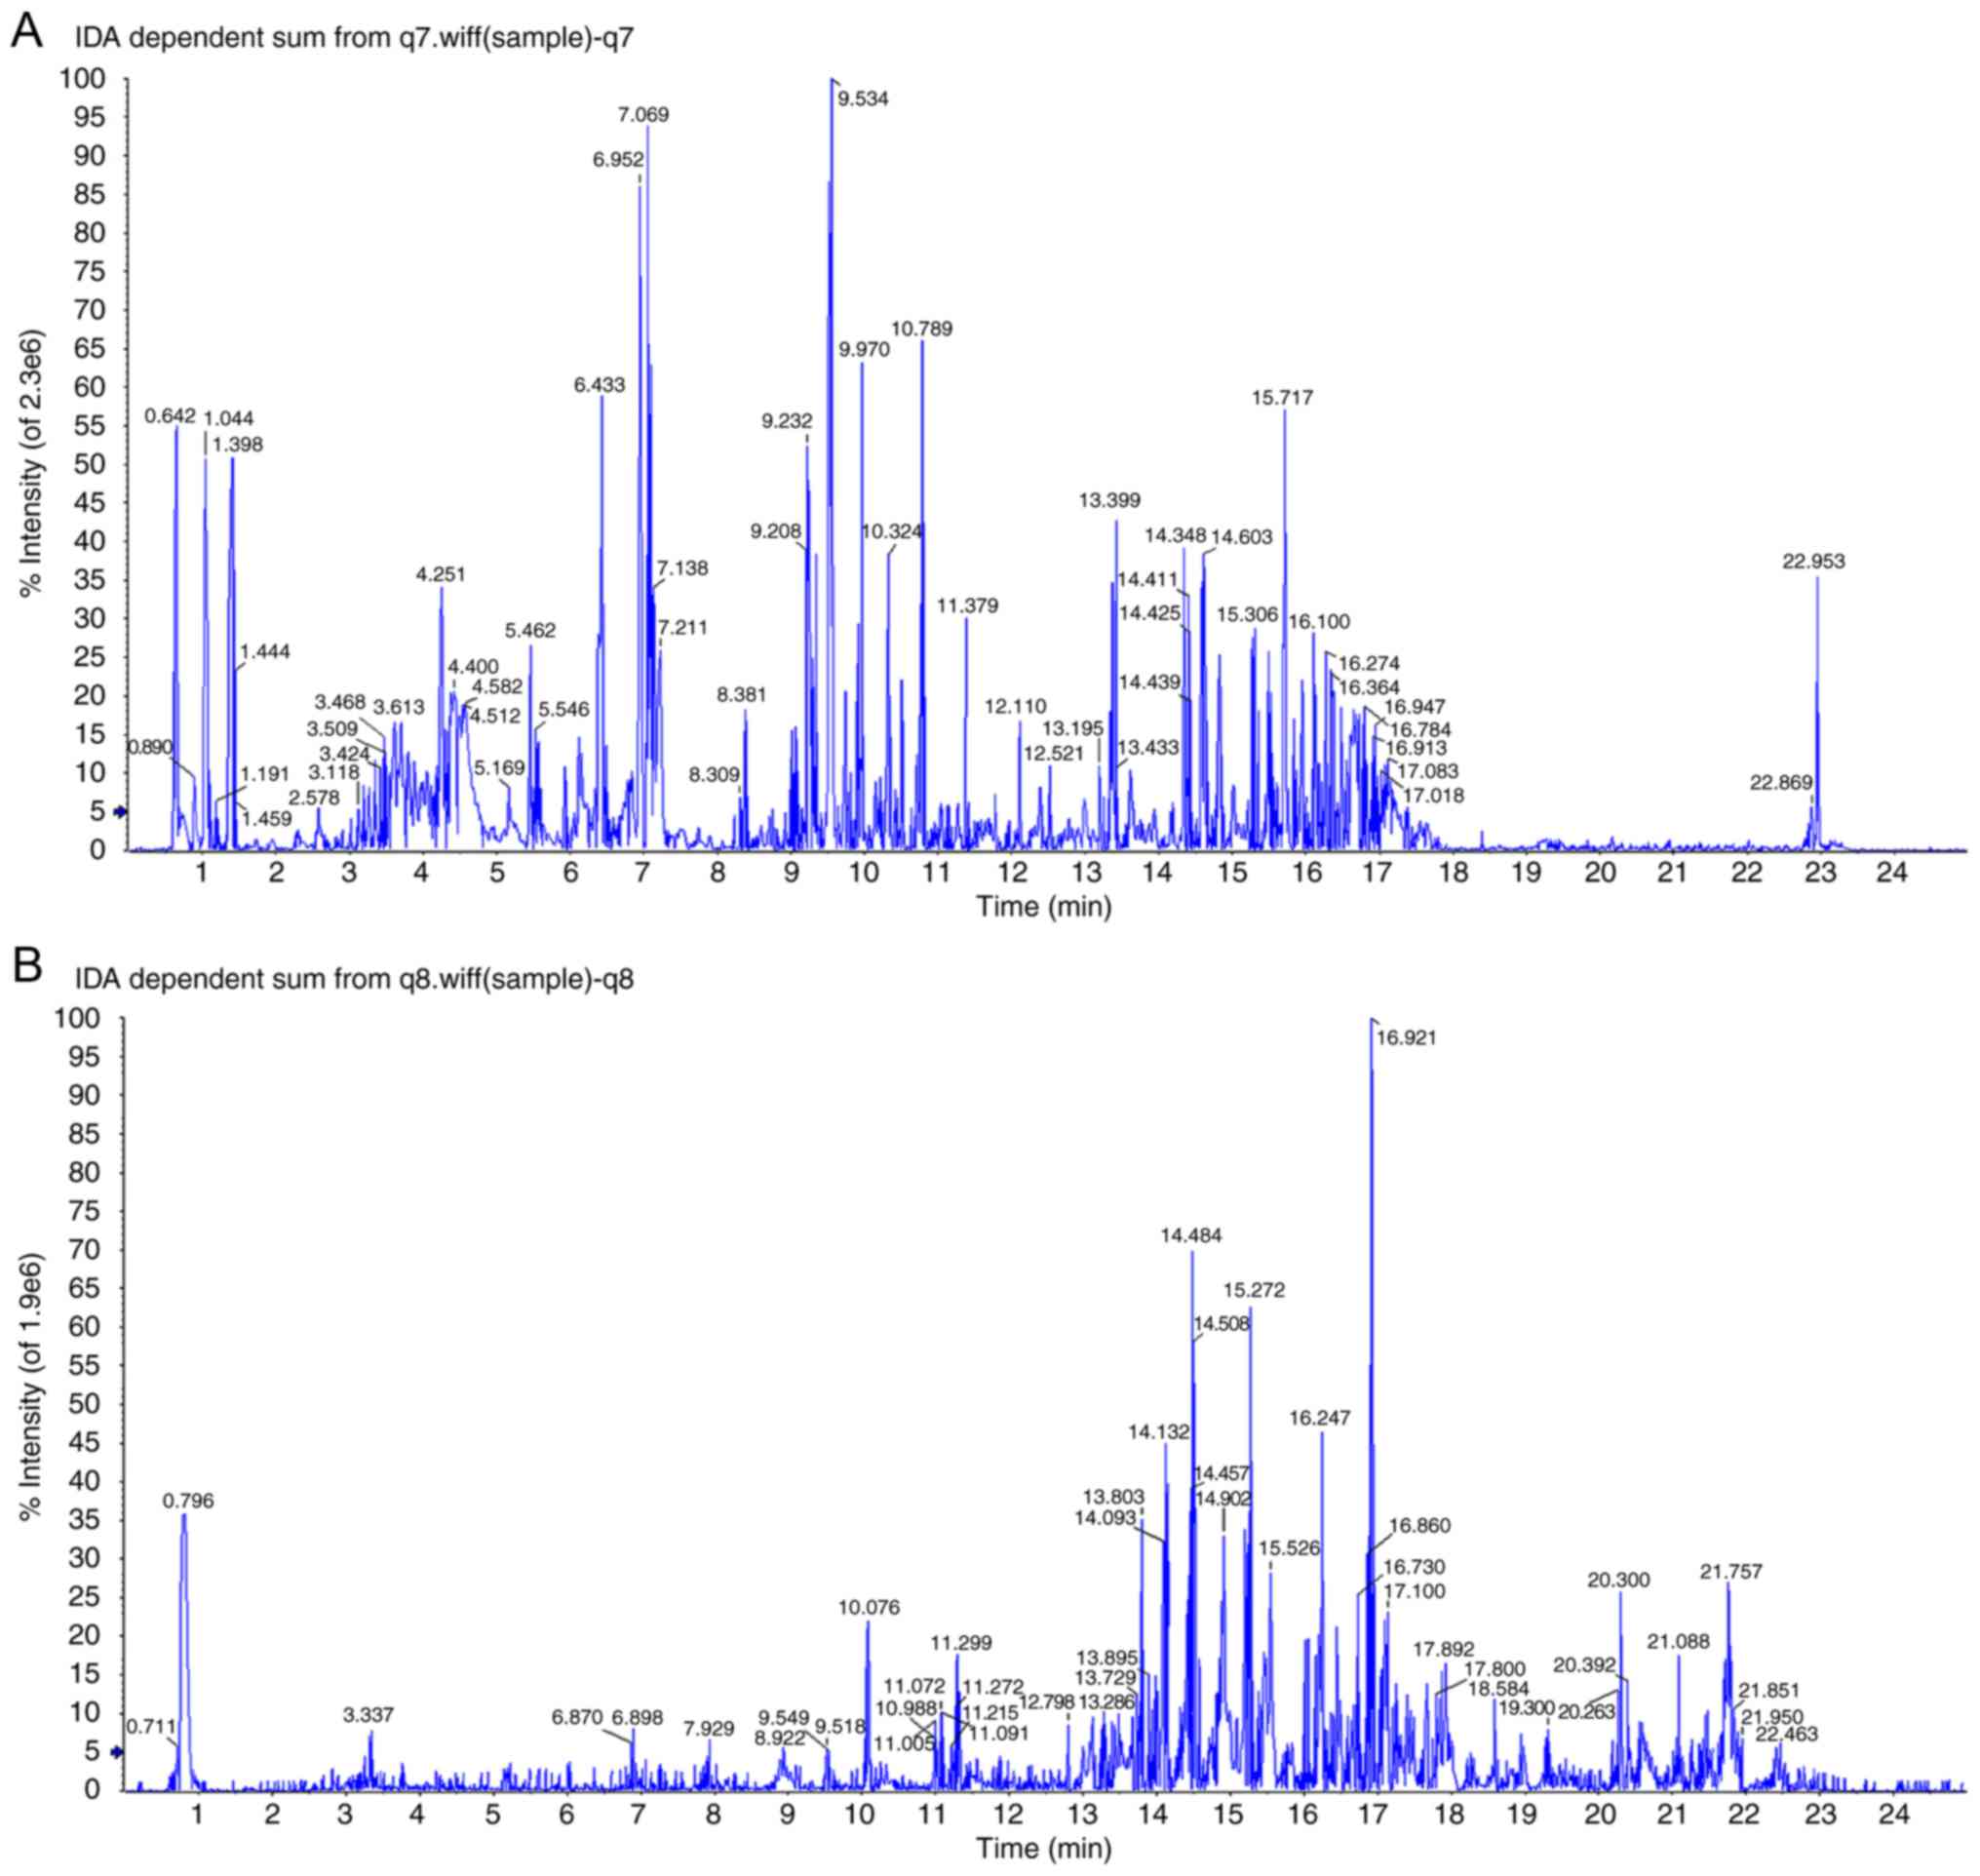
Plasma metabolomics analysis
Fig. 2
demonstrates the base peak intensity chromatograms of plasma
metabolic profiles analysed using UPLC-QTOF/MS in the positive and
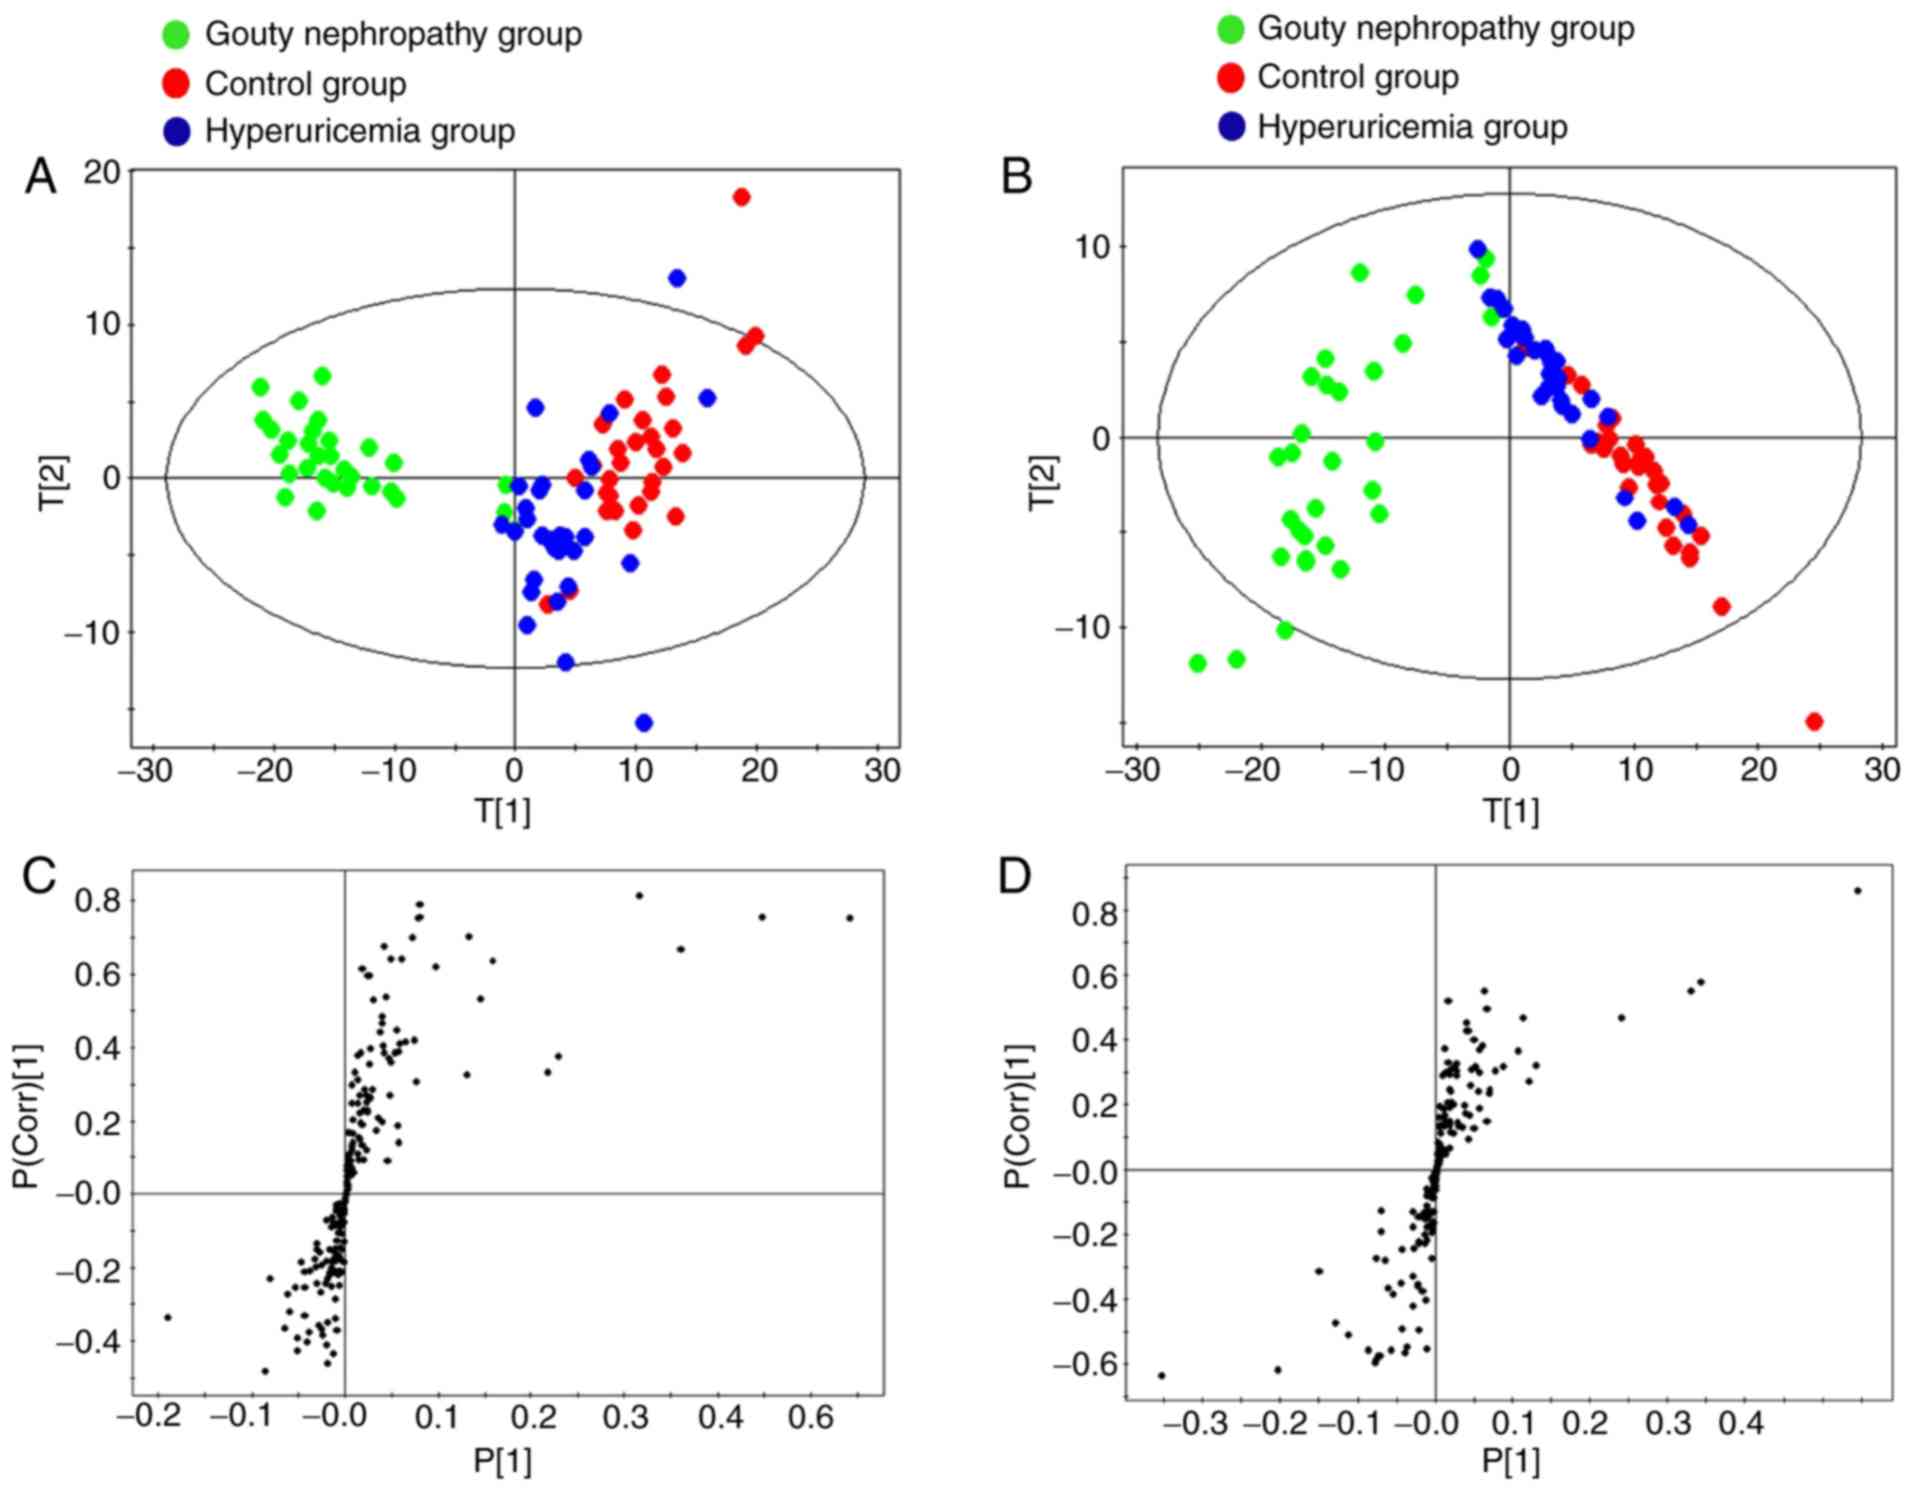
negative ion modes. According to the score plots in the positive
and negative ion modes (Fig. 3A and
B), the clustering patterns of the control and hyperuricaemia
groups were observed to be distinct, but with partial overlap.
Concomitantly, the clustering pattern of the gouty nephropathy
group deviated from those of the control and hyperuricaemia groups.
The profile demonstrated a clear intergroup separation in plasma
metabolites in the gouty nephropathy group from the control and
hyperuricaemia groups.
In the S-plot, each point represents a metabolite.
The two ends of the S-shaped curve represent the ions with highest
confidence intervals and levels of contribution. As indicated in
Fig. 3C and D, the variables far
from the centre of the plot were considered to be the biomarkers,
based on the results between the hyperuricaemia and gouty
nephropathy groups from the Student's t-test (P<0.05).
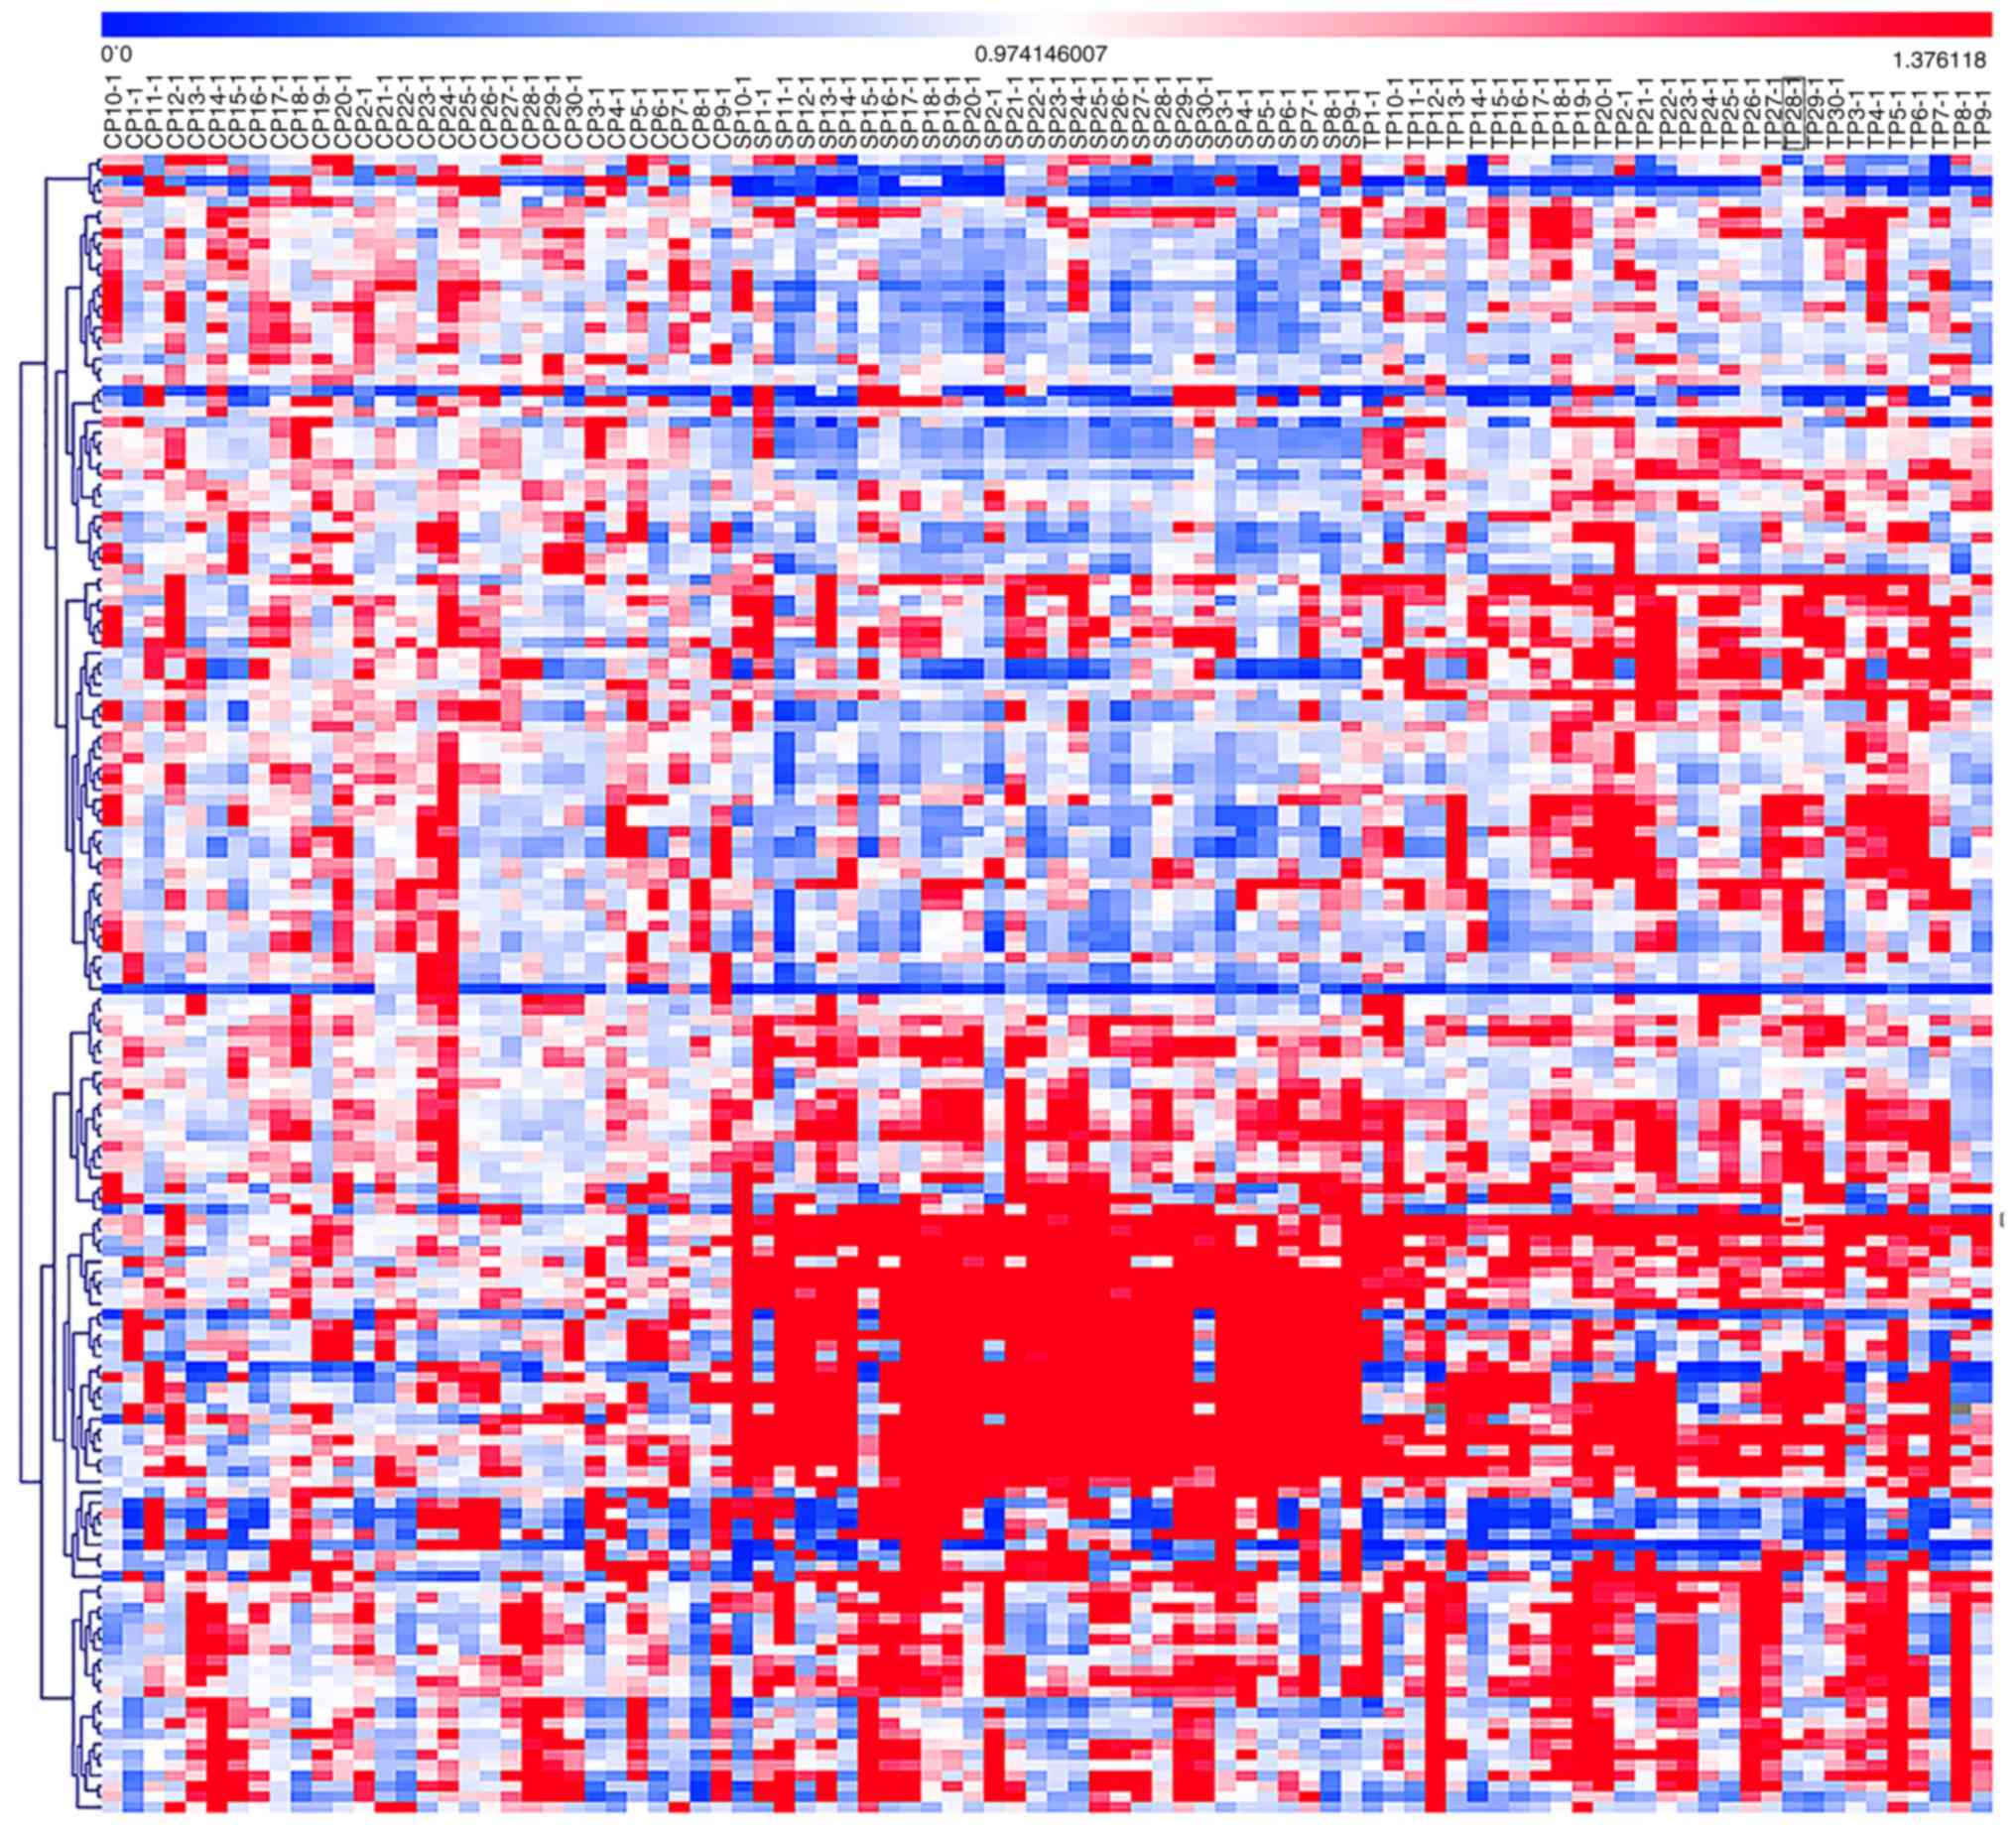
A heat map was generated based on the analysis of
the identified potential biomarkers between the hyperuricaemia and
the gouty nephropathy groups. As shown in Fig. 4, a red signal indicated an
increase in metabolite level while the blue signals indicated a
decrease in metabolite level; these signals were used to visualize
the trend changes in the metabolites between the groups.
Identification of potential
biomarkers
These metabolites were considered to be potential
biomarkers based on the Student's t-test results (P<0.05). Based
on the combined information on retention time and accurate mass MS1
and MS2 spectra, the metabolomics analysis data were used to batch
retrieve the in-house database. The results with a score value
>0.6 were retained. Potential biomarkers in the plasma were
identified based on the in-house database and the Human Metabolome
Database (http://www.hmdb.ca/).
In the present study, 46 potential biomarkers were
identified, as described in Table
VII. Compared with the hyperuricaemia group, the levels of
lysophosphatidylcholine (LPC)20:5, LPC15:0, LPC18:2, LPC20:4,
LPC22:6, LPC16:1, LPC22:5, LPC18:0, lysophosphatidylethanolamine
(LPE)16:0, LPE18:2, phosphatidyl ethanolamine (PE)38:6, PE38:7,
PE34:3, phosphatidylcholine (PC)32:3, PC32:1, PC34:3, PC38:5,
FA11:0, FA14:1, FA18:4, FA16:2, FA18:3, FA18:2, FA20:4, FA20:0,
FA22:0, FA24:0, sphingomyelin (SM)32:1, SM34:1, carnitine C10:1,
carnitine C16:1, carnitine C14:1, proline, lactic acid, uric acid,
indoxyl sulphate, tryptophan, ursodeoxycholic acid (UDCA),
tauroursodeoxycholic acid (TDCA), chenodeoxycholic acid (CDCA) and
p-cresol glucuronide were significantly increased in the gouty
nephropathy group. However, the levels of LPC14:0, LPC16:0, PC33:2,
PC32:0 and phenylalanine were significantly decreased in the gouty
nephropathy group. The majority of these metabolites are involved
in lipid metabolism (15).
| Table VIIBiomarkers identified in plasma. |
Table VII
Biomarkers identified in plasma.
| No | tR
(min) | m/z | Formula | Metabolite
identification | Ratio | Regulation | P-value |
|---|
| 1 | 8.28 | 468.309 |
C22H46NO7P | LPC 14:0 | 0.74 | Down | 0.01 |
| 2 | 8.49 | 542.3209 |
C28H48NO7P | LPC 20:5 | 14.8 | Up | 0.01 |
| 3 | 8.64 | 482.3239 |
C23H48NO7P | LPC 15:0 | 2.39 | Up | 0.01 |
| 4 | 9.201 | 520.3365 |
C26H50NO7P | LPC 18:2 | 1.87 | Up | 0.01 |
| 5 | 9.29 | 544.3395 |
C28H50NO7P | LPC 20:4 | 13.3 | Up | 0.01 |
| 6 | 9.31 | 568.3394 |
C30H50NO7P | LPC 22:6 | 4.93 | Up | 0.01 |
| 7 | 9.5 | 496.3391 |
C24H50NO7P | LPC 16:0 | 0.15 | Down | 0.01 |
| 8 | 9.88 | 480.342 |
C24H48NO7P | LPC 16:1 | 5.64 | Up | 0.05 |
| 9 | 9.93 | 570.3519 |
C30H52NO7P | LPC 22:5 | 1.37 | Up | 0.01 |
| 10 | 10.69 | 524.3707 |
C26H54NO7P | LPC 18:0 | 4.20 | Up | 0.01 |
| 11 | 9.21 | 454.2925 |
C21H44NO7P | LPE 16:0 | 11.38 | Up | 0.01 |
| 12 | 10.4 | 482.3241 |
C23H44NO7P | LPE 18:2 | 5.25 | Up | 0.01 |
| 13 | 14.43 | 728.5217 | Unknown | PC 32:3 | 2.94 | Up | 0.01 |
| 14 | 15.54 | 756.55 | Unknown | PC 34:3 | 11.13 | Up | 0.01 |
| 15 | 15.72 | 744.5532 |
C41H78NO8P | PC 33:2 | 0.42 | Down | 0.01 |
| 16 | 15.91 | 732.5531 |
C40H78NO8P | PC 32:1 | 2.78 | Up | 0.01 |
| 17 | 16.18 | 808.5834 | Unknown | PC 38:5 | 12.88 | Up | 0.01 |
| 18 | 16.38 | 734.5591 |
C42H80NO8P | PC 32:0 | 0.79 | Down | 0.01 |
| 19 | 15.91 | 764.5212 | Unknown | PE 38:6 | 93.36 | Up | 0.01 |
| 20 | 16.17 | 748.5265 | Unknown | PE 38:7 | 13.76 | Up | 0.01 |
| 21 | 16.74 | 768.5526 | Unknown | PE 38:4 | 13.44 | Up | 0.01 |
| 22 | 9.81 | 185.1547 |
C11H22O3 | FA11:0 | 1.84 | Up | - |
| 23 | 11.63 | 225.1854 | Unknown | FA 14:1 | 3.43 | Up | 0.01 |
| 24 | 12.43 | 275.2021 | Unknown | FA 18:4 | 5.15 | Up | 0.01 |
| 25 | 12.44 | 251.2023 | Unknown | FA16:2 | 3.88 | Up | 0.01 |
| 26 | 13.06 | 277.2168 |
C18H30O2 | FA 18:3 | 3.68 | Up | 0.01 |
| 27 | 13.72 | 279.2331 |
C18H32O2 | FA 18:2 | 209 | Up | - |
| 28 | 13.81 | 303.2327 |
C20H32O2 | FA 20:4 | 1.20 | Up | - |
| 29 | 16.03 | 311.2946 |
C22H40O2 | FA 20:0 | 1.11 | Up | - |
| 30 | 16.73 | 339.3272 |
C22H44O2 | FA 22:0 | 1.04 | Up | - |
| 31 | 17.37 | 367.3565 |
C24H48O2 | FA 24:0 | 1.04 | Up | - |
| 32 | 14.2 | 675.5406 | Unknown | SM 32:1 | 2.27 | Up | 0.01 |
| 33 | 15.07 | 703.5728 | Unknown | SM 34:1 | 1.36 | Up | 0.01 |
| 34 | 0.72 | 89.0246 |
C3H6O3 | Lactic acid | 7.73 | Up | 0.05 |
| 35 | 5.59 | 314.2326 | Unknown | Carnitine
C10:1 | 1.30 | Up | 0.01 |
| 36 | 8.62 | 398.3265 | Unknown | Carnitine
C16:1 | 2.51 | Up | 0.01 |
| 37 | 7.69 | 370.2952 | unknown | Carnitine
C14:1 | 5.89 | Up | 0.01 |
| 38 | 0.8 | 167.0205 |
C5H4N4O3 | Uric acid | 1.10 | Up | 0.05 |
| 39 | 0.81 | 114.0565 |
C5H9NO2 | Proline | 1.79 | Up | 0.05 |
| 40 | 3.15 | 212.0029 |
C8H7NO4S | Indoxyl
sulfate | 37.57 | Up | 0.05 |
| 41 | 3.36 | 203.0837 |
C11H12N2O2 | Tryptophan | 1.26 | Up | 0.01 |
| 42 | 9.07 | 391.2846 |
C24H40O4 | UDCA | 2.12 | Up | 0.01 |
| 43 | 11.23 | 498.2895 |
C26H45NO6S | TDCA | 36.54 | Up | 0.01 |
| 44 | 11.23 | 391.2846 |
C32H51NO11 | CDCA | 8.80 | Up | 0.01 |
| 45 | 3.33 | 283.0818 |
C13H16O7 | P-cresol
glucuronide | 14.12 | Up | 0.01 |
| 46 | 1.06 | 166.0863 |
C9H11NO2 | Phenylalanine | 0.24 D | own | 0.01 |
Discussion
Long-term increases in uric acid levels in the body
will lead to the deposition of urate crystals in the kidney,
resulting in gouty nephropathy. The damage caused by uric acid is
not only limited to the obstruction caused by monosodium urate
(MSU) but also, more significantly, to the inflammatory response
initiated by MSU crystals. Uric acid crystals have been
demonstrated to trigger IL-1β-mediated inflammation via activation
of the NLRP3 inflammasome, a multi-molecular complex whose
activation has been demonstrated to be central to a number of
pathological inflammatory conditions (16). The hyperactivity of this complex
of proteins underlies several human diseases, including diabetic
nephropathy (17),
atherosclerosis (18),
non-alcoholic steatohepatitis (19) and ischaemia-reperfusion injury
(20). The NLRP3 inflammasome
potently modulates innate immune function by regulating the
maturation and secretion of pro-inflammatory cytokines, including
IL-1β and IL-18. Renewed interest in uric acid has been generated
by observations indicating that MSU released by tissue or cell
injury may activate the NLRP3 inflammasome and promote inflammatory
responses (21). Uric acid, in
its soluble form, is responsible for increasing IL-1β production in
a NLRP3-dependent manner and is associated with the kidney damage
(21).
In the present study, compared with the control and
hyper-uricaemia groups, the increased levels of creatinine and uric
acid in the gouty nephropathy group indicated renal damage caused
by uric acid. Most importantly, compared with the control group,
the increased expression levels of NLRP3 inflammasome mRNA and
protein in the hyperuricaemia and gouty nephropathy groups
suggested that soluble uric acid upregulated expression of the
NLRP3 inflammasome. Additionally, the increased levels of caspase-1
protein, IL-1β and IL-18 in the hyperuricaemia and gouty
nephropathy groups indicated that soluble uric acid caused the
production of active caspase-1 that cleaves pro-IL1β to the
secreted form of IL-1β. Compared with the hyperuricaemia group, the
expression levels of NLRP3 inflammasome mRNA and protein,
downstream inflammatory factors and IL-1β and IL-18 levels were
increased in the gouty nephropathy group, which indirectly
indicated that the NLRP3 inflammasome served a pivotal role in the
progression of gouty nephropathy. The events leading to the
activation of the NLRP3 inflammasome involve reactive oxygen
species (ROS) (22), lysosomal
rupture (23) and mitochondrial
damage (24). As shown in
Fig. 5, urate crystals may
stimulate cells to produce ROS (25) or cause lysosomes to break down and
release cathepsin B (26), and
this stimulation of ROS production induces cells to release ATP,
triggering a calcium wave transport mechanism (27) or a potassium ion outflow mechanism
leading to mitochondrial damage, activating the NLRP3 inflammasome
(28). It has also been suggested
that uric acid may activate the NLRP3 inflammasome and contribute
to the development of gouty nephropathy. In the present study, the
measurement of disease severity considered objective indicators
including renal function as the evaluation criteria when selecting
the subjects. In future studies, the duration of the disease should
be included in the analysis.
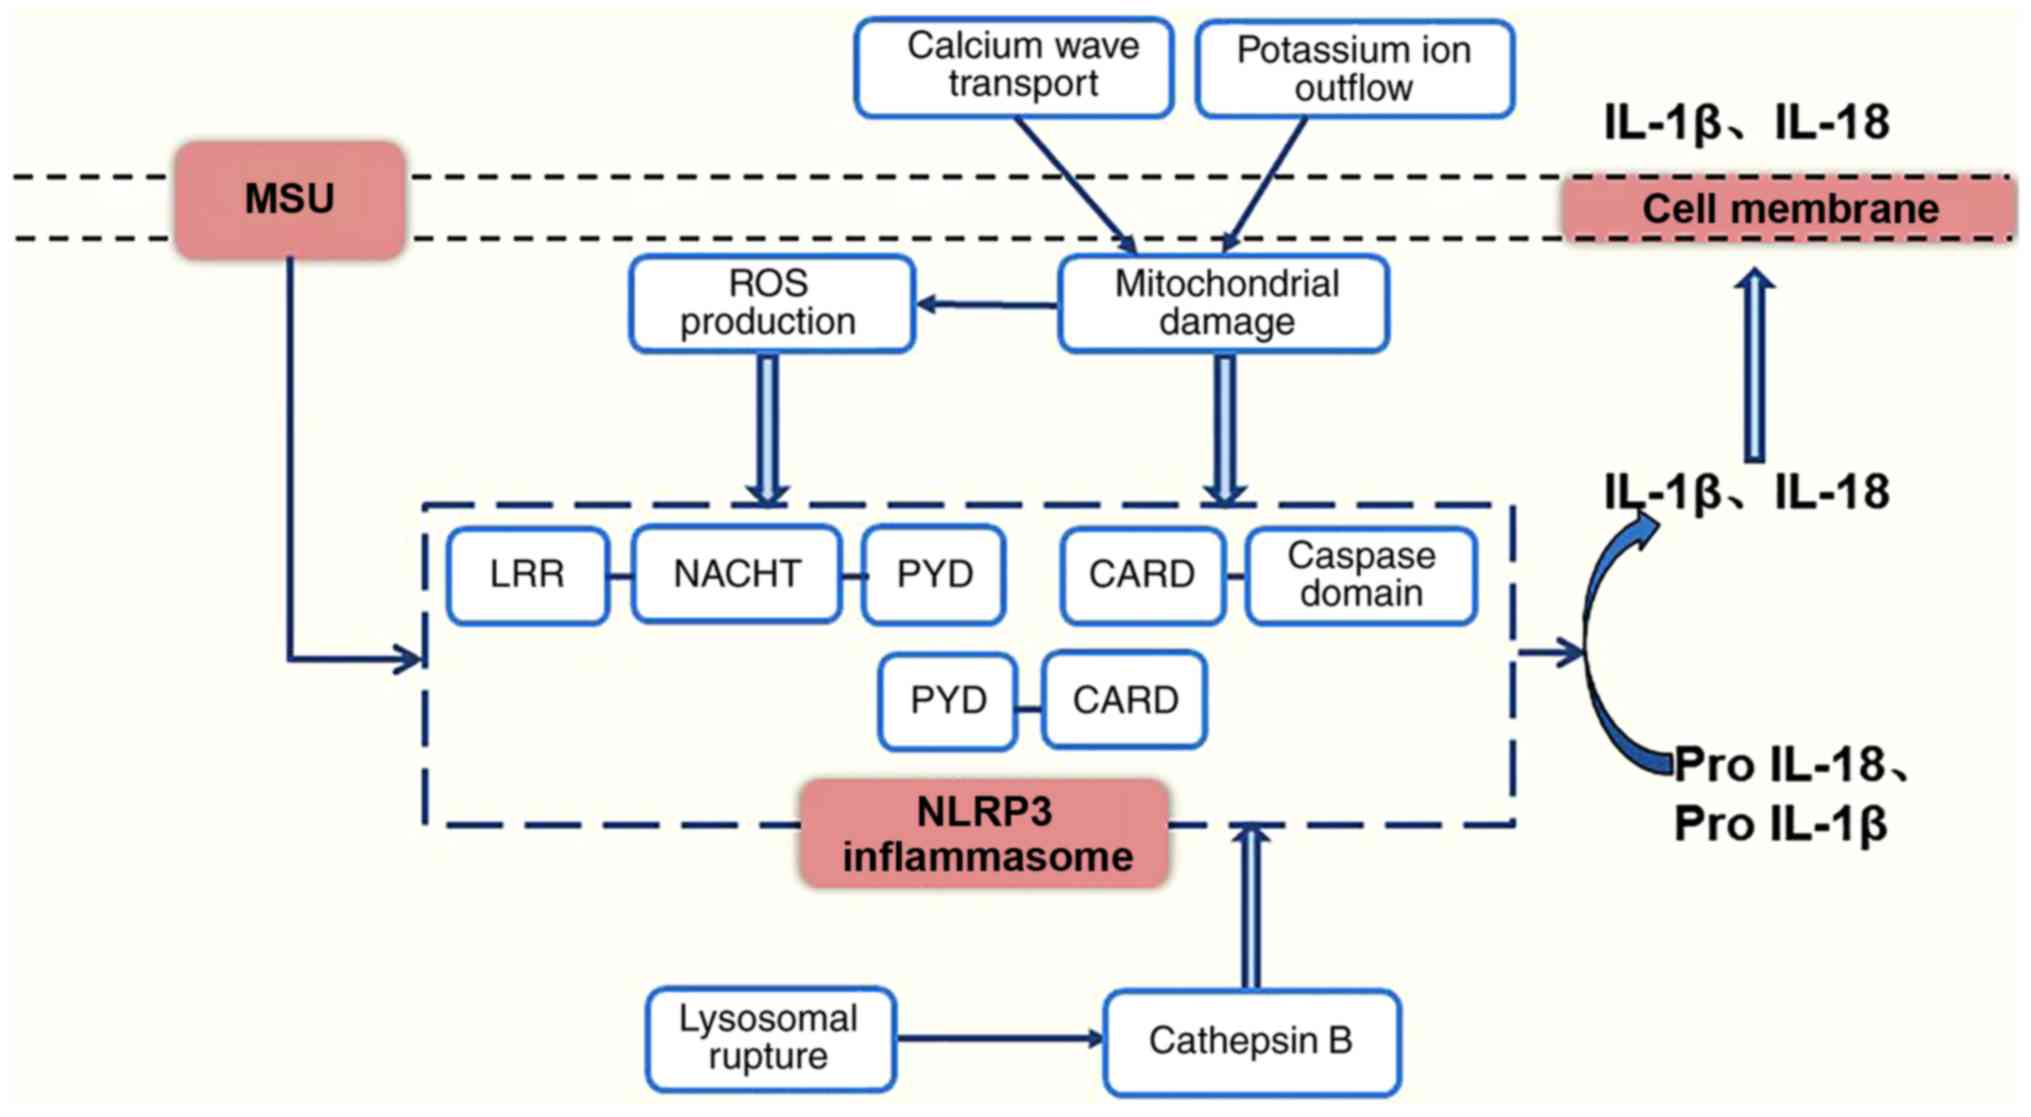 | Figure 5Model for the activation of the NLRP3
inflammasome. NLRP3, NOD-like receptor protein 3; MSU, monosodium
urate; ROS, reactive oxygen species; TRX, thioredoxin; TXNIP,
thioredoxin-interacting protein; mtDNA, mitochondrial DNA; IL-1β,
interleukin-1β; IL-18, interleukin-18; LRR, leucine-rich-repeat
domain; NACHT, nucleotide binding domain; PYD, pyrin domain; CARD,
caspase recruitment domain. |
In the present study, metabolomics analysis provided
metabolic information and information concerning the
patho-physiology of biological events for determining the
occurrence of changes in the target organ and the role of different
sites and biomarkers (29-31).
A total of 46 metabolites were considered as potential biomarkers
in plasma, due to their down- or upregulation: The levels of 2 PC,
2 LPC and phenylalanine were downregulated, and the levels of 8
LPC, 2 LPE, 4 PC, 3 PE, 10 FAs, 2 SM, 3 carnitines, lactic acid,
uric acid, proline, indoxyl sulphate, tryptophan, p-cresol
glucuronide, UDCA, TDCA and CDCA were upregulated in the gouty
nephropathy group compared with the hyperuricaemia group. Among
these 46 metabolites, significant changes in amino acid, glucose
and lipid metabolism, and in bile acid biosynthesis were observed;
however, the majority of the alterations involved lipid metabolism.
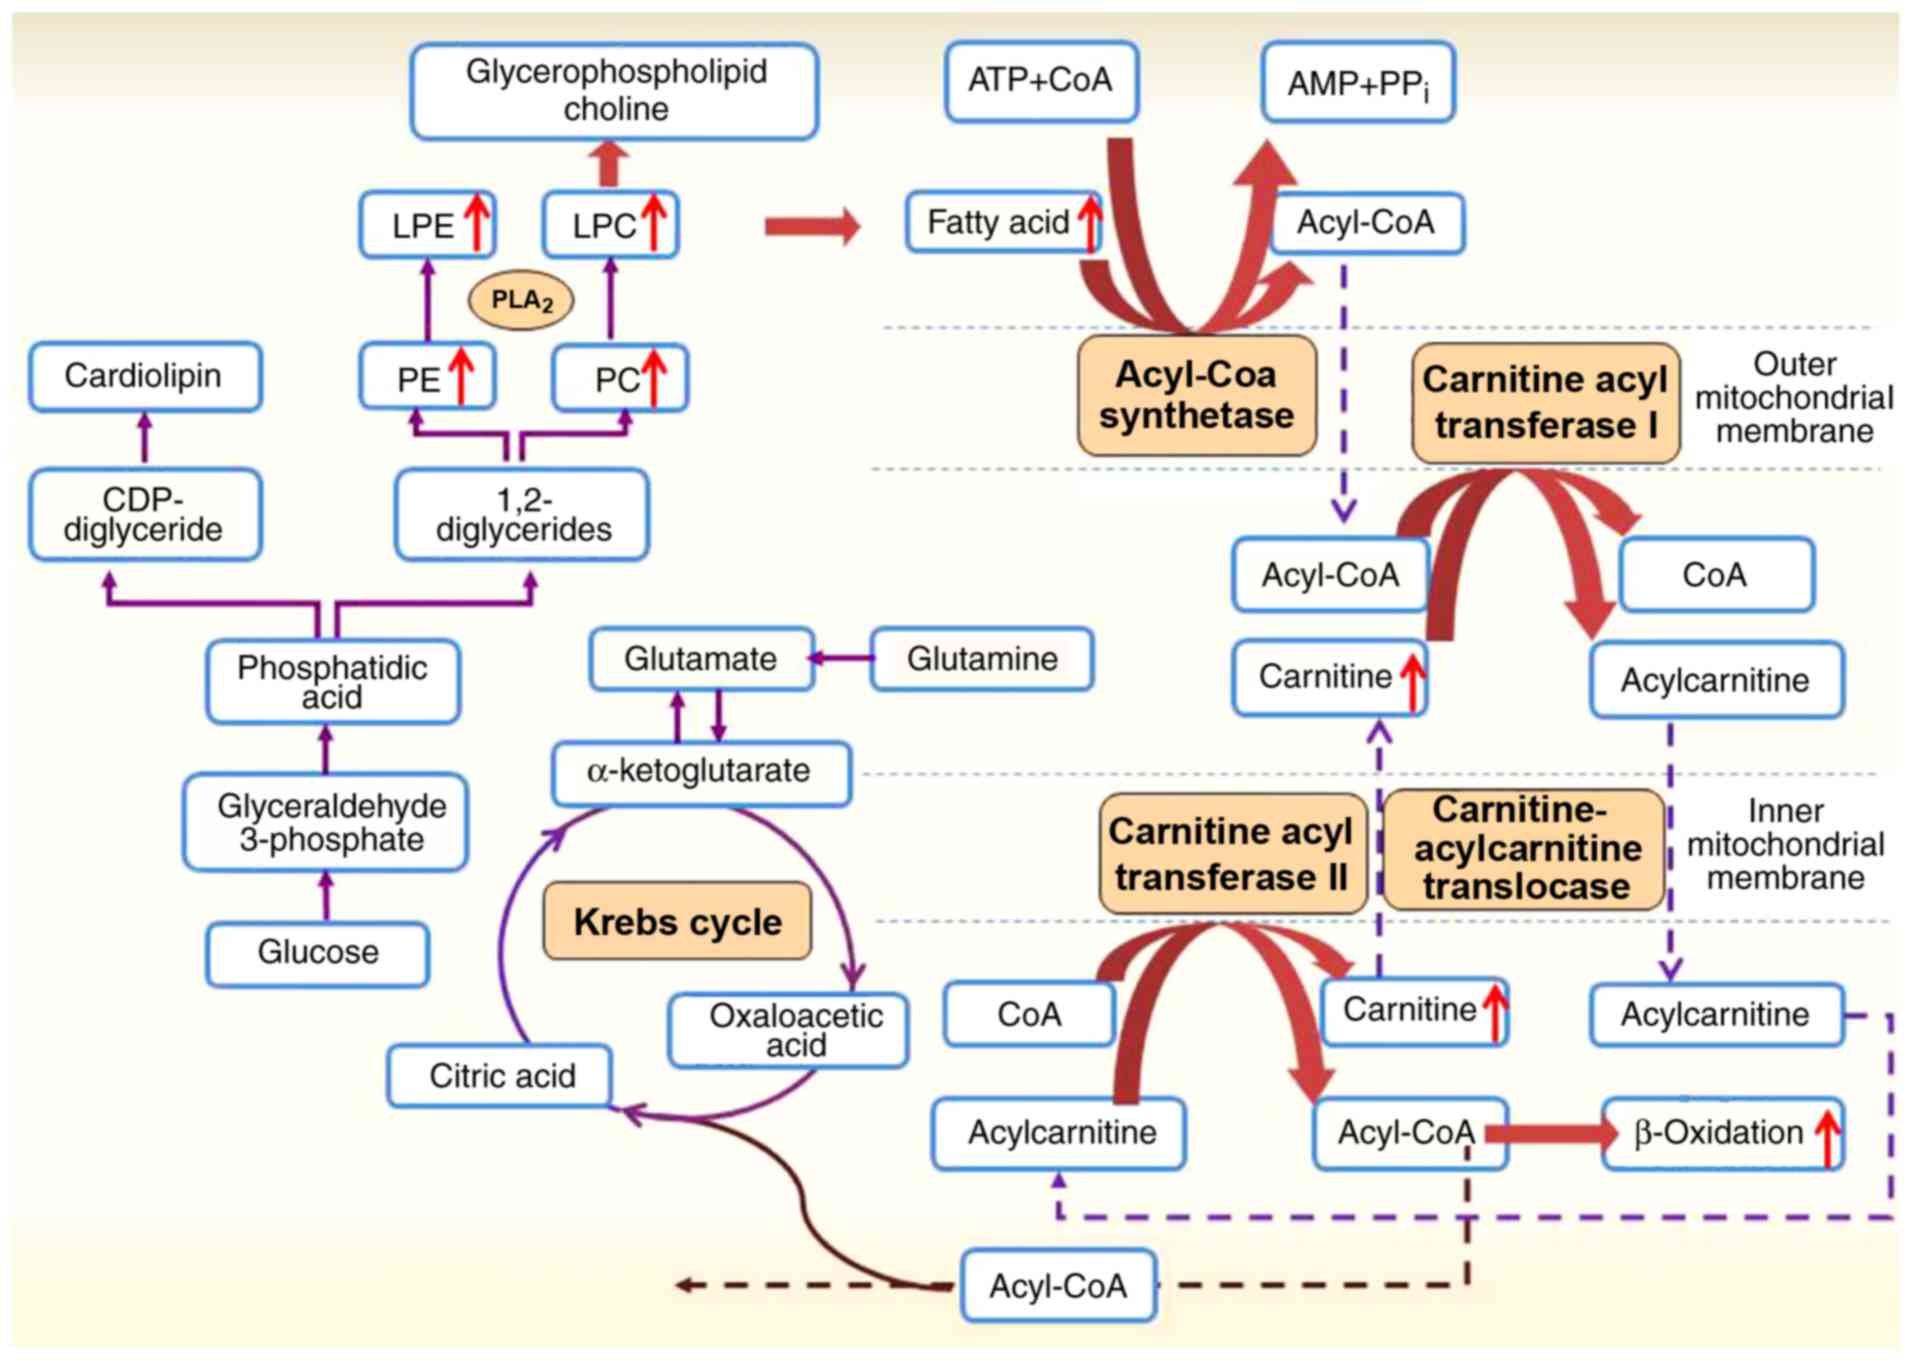
Through analysis of all the metabolic pathways involved, a lipid
metabolic network of the potential biomarkers and their alterations
in gouty nephropathy modulation was constructed and is shown in
Fig. 6. LPC and LPE are the
fundamental components of cellular membranes and mediate signal
transduction, and are formed by the hydrolysis of PC and PE by the
enzyme phospholipase A2 (PLA2) (15,32). PLA2 catalyses the decomposition of
phospholipids to increase the production and accumulation of free
FAs (33,34). Subsequently, FAs release large
amounts of ATP by β-oxidation (35). In the present study, the increased
PC, LPC and LPE levels suggested the enhancement of PLA2 activity.
Compared with the hyperuricaemia group, increased levels of
carnitines and FAs in the gouty nephropathy group were detected in
the plasma and indicated an increase in FA β-oxidation. These data
suggested that gouty nephropathy was closely associated with lipid
metabolism.
The mechanism of augmented uric acid production with
lipid metabolism remains unknown. One explanation may be associated
with the activity of PLA2. Lysophospholipids are generated by PLA2
and are important in cell signalling and membrane biology. With the
development of gouty nephropathy, PLA2 is activated, which
accelerated the decomposition of phospholipids. The FAs released by
PLA2, including arachidonic acid, have been demonstrated to
function as sources of energy, signalling molecules and potent
mediators of inflammation (36).
PLA2 enzymatic activity has been associated with inflammatory
conditions and, inhibitors of the PLA2 enzyme have been studied for
their potential in decreasing pathologic inflammation (37). A previous study suggested that
members of the Ginkgo phylum may decrease uric acid via adjustment
of the level of LPCs by decreasing the activity of PLA2 (38). The identification of these
endogenous metabolites provides an improved understanding of
changes in phospholipid metabolism in gouty nephropathy.
A second mechanism may be associated with
β-oxidation. During triglyceride synthesis, there is an increased
requirement for NADPH and the synthesis of FAs in the liver, which
is associated with the de novo synthesis of purines, thereby
increasing the rate of uric acid production. The free FA produced
by lipolysis is metabolized through β-oxidation with increased
production of NADPH, which is additionally metabolized to uric
acid, resulting in hyperuricaemia (39). In the β-oxidation process,
increased free FAs enhance the levels of acetyl-coenzyme A, which
competes with α-ketoglutarate for entry into the Krebs cycle.
Decreased metabolism of α-ketoglutarate leads to its accumulation,
in turn inhibiting of the catabolism of glutamine by the mass-law
effect and effectively decreasing ammonia synthesis, thereby
leading to lower urinary pH levels and uric acid deposition
(40).
In the present study, lipid metabolism was also
associated with the NLRP3 inflammasome in gouty nephropathy. Uric
acid has been demonstrated to increase triglyceride accumulation in
cultured liver cells, and the mechanism was suggested to be
mediated by intracellular and mitochondrial oxidative stress. More
importantly, mitochondrial damage will not only release
mitochondrial (mt)DNA, but also ROS and certain lipid substances,
into the cytoplasm. There is evidence to suggest that the release
of mtDNA and cardiolipin into the cytoplasm promoted the activation
of the NLRP3 inflammasome (41).
The NLRP3 inflammasome was first demonstrated to be activated by
cholesterol crystals, and previous studies have shown that the
NLRP3 inflammasome may also be activated by oxidized low-density
lipoprotein or high glucose levels (42-45). The increased levels of the NLRP3
inflammasome and lipids, in particular the LPC, LPE, PC and FAs,
demonstrated in the gouty nephropathy group in the present study
suggested that lipids may mediate the progression of gouty
nephropathy through the activity of PLA2, β-oxidation
and activation of the NLRP3 inflammasome; however, these results
require further validation.
Hyperuricaemia has been associated with
hypertension, diabetes mellitus and metabolic syndrome, and the
volume of evidence suggesting that fructose-induced hyperuricaemia
serves a contributory role is increasing (46). Animal experiments have indicated
that high fructose-induced hyperuricaemia is associated with
hypertension, hypertriglyceridemia, hyperinsulinemia, glomerular
hypertension, renal cortical arteriolar systole and renal anterior
artery disease (47). In
addition, elevated blood glucose levels may activate the NLRP3
inflammasome, induce inflammatory responses, increase IL-1β
secretion and cause tissue damage (48). The NLRP3 inflammasome is crucial
to the development of type 2 diabetes induced by glucose metabolism
disorders (49). In the present
study, compared with the control group, the hyperuricaemia and
gouty nephropathy groups exhibited significant increases in fasting
blood glucose levels (P<0.01), with a corresponding increase in
the expression levels of the NLRP3 inflammasome components, which
indirectly suggested the potential association between the NLRP3
inflammasome and blood glucose. The level of lactic acid was
upregulated, which suggested the increased activity of glycolysis
in glucose metabolism. In the process of glycolysis, the first
enzyme to metabolize fructose is fructokinase, also known as
ketohexokinase (KHK). The metabolism of fructose to
fructose-1-phosphate by KHK occurs primarily in the liver and
results in a decrease in intracellular phosphate and ATP levels.
The decrease in intracellular phosphate stimulates AMP deaminase,
which catalyses the degradation of AMP to inosine monophosphate and
eventually uric acid (50). A
previous study suggested that fructose mediated the generation of
uric acid in diabetes and obesity (50). In the present study, the increased
levels of blood glucose, NLRP3 inflammasome component expression
and lactic acid in gouty nephropathy group indicated an increase in
glucose metabolism, which may lead to upregulated uric acid levels
and promotion of the development of gouty nephropathy. However,
other metabolites of glucose metabolism were not detected, and
further investigation is required to reveal the association between
gouty nephropathy and glucose metabolism.
In the present study, the expression of the NLRP3
inflammasome components in peripheral blood mononuclear cells and
the levels of IL-1β and IL-18 in plasma were significantly
increased in patients with gouty nephropathy, which suggested that
the NLRP3 inflammasome served a pivotal role in the progression of
gouty nephropathy. In addition, there was an increased expression
of lipid metabolism in gouty nephropathy, and analysis of the
changes of the levels of 46 metabolites in plasma indicated that
lipids may mediate the progression of gouty nephropathy through the
activity of PLA2, β-oxidation and activation of the
NLRP3 inflammasome.
Funding
The present study was supported by the Fundamental
Research Project of Shenzhen Science and Technology Research and
Development Funds (grant no. JCYJ20160427191440905).
Availability of data and materials
The datasets used and/or analyzed during the current
study are available from the corresponding author on reasonable
request.
Authors' contributions
YZZ and XLS designed the experiments, analysed the
data and wrote the manuscript. YPX and YZZ performed the
experiments. FJG and ASZ analysed and interpreted the data. JHC
contributed to the design of the experimental methods, and wrote
the manuscript, approved the version to be published and agreed to
be accountable for all aspects of the work. All authors read and
approved the final manuscript.
Ethics approval and consent to
participate
The study was approved by the Ethics Committee of
the Affiliated Bao'an Hospital of Shenzhen and written informed
consent was obtained from all participants.
Patient consent for publication
Written informed consent was obtained from all
participants.
Competing interests
The authors declare that they have no competing
interests.
Abbreviations:
|
UPLC-Q-TOF-MS
|
ultra-performance liquid
chromatography coupled with quadrupole time-of-flight mass
spectrometry
|
|
LC
|
liquid chromatography
|
|
MS
|
mass spectrometry
|
|
NLRP3
|
Nod-like receptor protein 3
|
|
ASC
|
apoptosis-associated speck like
protein
|
|
IL-1β
|
interleukin-1β
|
|
IL-18
|
interleukin-18
|
|
LPC
|
lysophosphatidylcholine
|
|
LPE
|
lysophosphatidylethanolamine
|
|
PC
|
phosphatidylcholine
|
|
PE
|
phosphatidyl ethanolamine
|
|
UDCA
|
ursodeoxycholic acid
|
|
CDCA
|
chenodeoxycholic acid
|
|
TDCA
|
tauroursodeoxycholic acid
|
|
FA
|
fatty acid
|
|
SM
|
sphingomyelin
|
Acknowledgments
Not applicable.
References
|
1
|
Saito I, Saruta T, Kondo K, Nakamura R,
Oguro T, Yamagami K, Ozawa Y and Kato E: Serum Uricd acidand the
renin-angiotensin system in hypertention. J Am Geriatr Soc.
26:241–247. 1978. View Article : Google Scholar : PubMed/NCBI
|
|
2
|
Ghaemi-Oskouie F and Shi Y: The role of
Uric acid as an endogenous danger signal in immunity and
inflammation. Curr Rheumatol Rep. 13:160–166. 2011. View Article : Google Scholar : PubMed/NCBI
|
|
3
|
Yao Y, Chen S, Cao M, Fan X, Yang T, Huang
Y, Song X, Li Y, Ye L, Shen N, et al: Antigen-specific
CD8+ T cell feedback activates NLRP3 inflammasome in
antigen-presenting cells through perforin. Nat Commun. 8:154022017.
View Article : Google Scholar
|
|
4
|
Abderrazak A, Syrovets T, Couchie D, El
Hadri K, Friguet B, Simmet T and Rouis M: NLRP3 inflammasome: From
a danger signal sensor to a regulatory node of oxidative stress and
inflammatory diseases. Redox Biol. 4:296–307. 2015. View Article : Google Scholar : PubMed/NCBI
|
|
5
|
Wu R, Liu X, Yin J, Wu H, Cai X, Wang N,
Qian Y and Wang F: IL-6 receptor blockade ameliorates diabetic
nephropathy via inhibiting inflammasome in mice. Metab Clin Exp.
83:18–24. 2018. View Article : Google Scholar : PubMed/NCBI
|
|
6
|
Gonçalves JP, Oliveira A, Severo M, Santos
AC and Lopes C: Cross-sectional and longitudinal associations
between serum uric acid and metabolic syndrome. Endocrine.
41:450–457. 2012. View Article : Google Scholar : PubMed/NCBI
|
|
7
|
Borghi C, Rosei EA, Bardin T, Dawson J,
Dominiczak A, Kielstein JT, Manolis AJ, Perez-Ruiz F and Mancia G:
Serum uric acid and the risk of cardiovascular and renal disease. J
Hypertens. 33:1729–1741. 2015. View Article : Google Scholar : PubMed/NCBI
|
|
8
|
Stamp LK and Chapman PT: Gout and its
comorbidities: Implications for therapy. Rheumatology (Oxford).
52:34–44. 2013. View Article : Google Scholar
|
|
9
|
Chen JH, Yeh WT, Chuang SY, Wu YY and Pan
WH: Gender-specific risk factors for incident gout: A prospective
cohort study. Clin Rheumatol. 31:239–245. 2012. View Article : Google Scholar
|
|
10
|
Yu X, Chen K and Tong Y: Lipid metabolism
study of hyperuricemia and gout arthritis based on lipidomics
technology. World Latest Med Info. 7:30–31. 2016.
|
|
11
|
Vázquez-Mellado J, Hernández-Cuevas CB,
Alvarez-Hernández E, Ventura-Rios L, Peláez-Ballestas I,
Casasola-Vargas J, García-Méndez S and Burgos-Vargas R: The
diagnostic value of the proposal for clinical gout diagnosis (CGD).
Clin Rheumatol. 31:429–434. 2012. View Article : Google Scholar
|
|
12
|
Wallace SL, Robinson H, Masi AT, Decker
JL, McCarty DJ and Yü TF: Preliminary criteria for the
classification of the acute arthritis of primary gout. Arthritis
Rheum. 20:895–900. 1977. View Article : Google Scholar : PubMed/NCBI
|
|
13
|
Livak KJ and Schmittgen TD: Analysis of
relative gene expression data using real-time quantitative PCR and
the 2(-Delta Delta C(T)) method. Methods. 25:402–408. 2001.
View Article : Google Scholar
|
|
14
|
Zhao X, Zeng Z, Chen A, Lu X, Zhao C, Hu
C, Zhou L, Liu X, Wang X, Hou X, et al: Comprehensive strategy to
construct in-house database for accurate and batch identification
of small molecular metabolites. Anal Chem. 90:7635–7643. 2018.
View Article : Google Scholar : PubMed/NCBI
|
|
15
|
Liu T, Li S, Tian X, Li Z, Cui Y, Han F,
Zhao Y and Yu Z: A plasma metabonomic analysis on potential
biomarker in pyrexia induced by three methods using ultra high
performance liquid chromatography coupled with Fourier transform
ion cyclotron resonance mass spectrometry. J Chromatogr B Analyt
Technol Biomed Life Sci. 1063:214–225. 2017. View Article : Google Scholar : PubMed/NCBI
|
|
16
|
Heneka MT, Kummer MP, Stutz A, Delekate A,
Schwartz S, Vieira-Saecker A, Griep A, Axt D, Remus A, Tzeng TC, et
al: NLRP3 is activated in Alzheimer's disease and contributes to
pathology in APP/PS1 mice. Nature. 493:674–678. 2013. View Article : Google Scholar
|
|
17
|
Kim SM, Lee SH, Kim YG, Kim SY, Seo JW,
Choi YW, Kim DJ, Jeong KH, Lee TW, Ihm CG, et al:
Hyperuricemia-induced NLRP3 activation of macrophages contributes
to the progression of diabetic nephropathy. Am J Physiol Renal
Physiol. 308:F993–F1003. 2015. View Article : Google Scholar : PubMed/NCBI
|
|
18
|
Zheng F, Xing S, Gong Z and Xing Q: NLRP3
inflammasomes show high expression in aorta of patients with
atherosclerosis. Heart Lung Circ. 22:746–750. 2013. View Article : Google Scholar : PubMed/NCBI
|
|
19
|
Csak T, Ganz M, Pespisa J, Kodys K,
Dolganiuc A and Szabo G: Fatty acid and endotoxin activate
inflammasomes in mouse hepatocytes that release danger signals to
stimulate immune cells. Hepatology. 54:133–144. 2011. View Article : Google Scholar : PubMed/NCBI
|
|
20
|
Gao L, Shen F and LI YS: Effects of NLRP3
inflammasome on cerebral ischemia-reperfusion injury. J Shanghai
Jiaotong Univ Med Sci. 35:1896–1899. 2015.In Chinese.
|
|
21
|
Braga TT, Forni MF, Correa-Costa M, Ramos
RN, Barbuto JA, Branco P, Castoldi A, Hiyane MI, Davanso MR, Latz
E, et al: Soluble Uric acid activates the NLRP3 inflammasome. Sci
Rep. 7:398842017. View Article : Google Scholar : PubMed/NCBI
|
|
22
|
Zhou R, Tardivel A, Thorens B, Choi I and
Tschopp J: Thioredoxin-interacting protein links oxidative stress
to inflam-masome activation. Nat Immunol. 11:136–140. 2010.
View Article : Google Scholar
|
|
23
|
Bruchard M, Mignot G, Derangère V, Chalmin
F, Chevriaux A, Végran F, Boireau W, Simon B, Ryffel B, Connat JL,
et al: Chemotherapy-triggered cathepsin B release in
myeloid-derived suppressor cells activates the Nlrp3 inflammasome
and promotes tumor growth. Nat Med. 19:57–64. 2013. View Article : Google Scholar
|
|
24
|
Shimada K, Crother TR, Karlin J, Dagvadorj
J, Chiba N, Chen S, Ramanujan VK, Wolf AJ, Vergnes L, Ojcius DM, et
al: Oxidized mitochondrial DNA activates the NLRP3 inflammasome
during apoptosis. Immunity. 36:401–414. 2012. View Article : Google Scholar : PubMed/NCBI
|
|
25
|
Wang R, Wang Y, Mu N, Lou X, Li W, Chen Y,
Fan D and Tan H: Activation of NLRP3 inflammasomes contributes to
hyperhomocysteinemia-aggravated inflammation and atherosclerosis in
apoE-deficient mice. Lab Invest. 97:922–934. 2017. View Article : Google Scholar : PubMed/NCBI
|
|
26
|
Hornung V, Bauernfeind F, Halle A, Samstad
EO, Kono H, Rock KL, Fitzgerald KA and Latz E: Silica crystals and
aluminum salts activate the NALP3 inflammasome through phagosomal
destabilization. Nat Immunol. 9:847–856. 2008. View Article : Google Scholar : PubMed/NCBI
|
|
27
|
Lee GS, Subramanian N, Kim AI,
Aksentijevich I, Goldbach-Mansky R, Sacks DB, Germain RN, Kastner
DL and Chae JJ: The calcium-sensing receptor regulates the NLRP3
inflammasome through Ca2+ and cAMP. Nature. 492:123–127. 2012.
View Article : Google Scholar : PubMed/NCBI
|
|
28
|
Ives A, Nomura J, Martinon F, Roger T,
LeRoy D, Miner JN, Simon G, Busso N and So A: Xanthine
oxidoreductase regulates macrophage IL1β secretion upon NLRP3
inflammasome activation. Nat Commun. 6:65552015. View Article : Google Scholar
|
|
29
|
Rhee EP: Metabolomics and renal disease.
Curr Opin Nephrol Hypertens. 24:371–379. 2015.PubMed/NCBI
|
|
30
|
Zhao YY, Cheng XL, Lin RC and Wei F:
Lipidomics applications for disease biomarker discovery in mammal
models. Biomark Med. 9:153–168. 2015. View Article : Google Scholar : PubMed/NCBI
|
|
31
|
Sekula P, Goek ON, Quaye L, Barrios C,
Levey AS, Römisch-Margl W, Menni C, Yet I, Gieger C, Inker LA, et
al: A metabolome-wide association study of kidney function and
disease in the general population. J Am Soc Nephrol. 27:1175–1188.
2016. View Article : Google Scholar :
|
|
32
|
Makide K, Kitamura H, Sato Y, Okutani M
and Aoki J: Emerging lysophospholipid mediators,
lysophosphatidylserine, lysophosphatidylthreonine,
lysophosphatidylethanolamine and lysophosphatidylglycerol.
Prostaglandins Other Lipid Mediat. 89:135–139. 2009. View Article : Google Scholar : PubMed/NCBI
|
|
33
|
Zhang ZH, Vaziri ND, Wei F, Cheng XL, Bai
X and Zhao YY: An integrated lipidomics and metabolomics reveal
nephropro-tective effect and biochemical mechanism of Rheum
officinale in chronic renal failure. Sci Rep. 6:221512016.
View Article : Google Scholar
|
|
34
|
Zhao YY, Vaziri ND and Lin RC: Lipidomics:
New insight into kidney disease. Adv Clin Chem. 68:153–175. 2015.
View Article : Google Scholar : PubMed/NCBI
|
|
35
|
Chen DQ, Chen H, Chen L, Vaziri ND, Wang
M, Li XR and Zhao YY: The link between phenotype and fatty acid
metabolism in advanced chronic kidney disease. Nephrol Dial
Transplant. 32:1154–1166. 2017. View Article : Google Scholar : PubMed/NCBI
|
|
36
|
Tsoukalas D, Alegakis AK, Fragkiadaki P,
Papakonstantinou E, Tsilimidos G, Geraci F, Sarandi E, Nikitovic D,
Spandidos DA and Tsatsakis A: Application of metabolomics part II:
Focus on fatty acids and their metabolites in healthy adults. Int J
Mol Med. 43:233–242. 2019.
|
|
37
|
Pappa V, Seydel K, Gupta S, Feintuch CM,
Potchen MJ, Kampondeni S, Goldman-Yassen A, Veenstra M, Lopez L,
Kim RS, et al: Lipid metabolites of the phospholipase A2 pathway
and inflammatory cytokines are associated with brain volume in
paediatric cerebral malaria. Malar J. 14:5132015. View Article : Google Scholar : PubMed/NCBI
|
|
38
|
Zhang S, Zhuang J, Yue G, Wang Y, Liu M,
Zhang B, Du Z and Ma Q: Lipidomics to investigate the pharmacologic
mechanisms of ginkgo folium in the hyperuricemic rat model. J
Chromatogr B Analyt Technol Biomed Life Sci. 1060:407–415. 2017.
View Article : Google Scholar : PubMed/NCBI
|
|
39
|
Yadav D, Lee ES, Kim HM, Lee EY, Choi E
and Chung CH: Hyperuricemia as a potential determinant of metabolic
syndrome. J Lifestyle Med. 3:98–106. 2013.PubMed/NCBI
|
|
40
|
Pazos Pérez F: Uric acid renal lithiasis:
New concepts. Contrib Nephrol. 192:116–124. 2018. View Article : Google Scholar : PubMed/NCBI
|
|
41
|
Iyer SS, He Q, Janczy JR, Elliott EI,
Zhong Z, Olivier AK, Sadler JJ, Knepper-Adrian V, Han R, Qiao L, et
al: Mitochondrial cardiolipin is required for Nlrp3 inflammasome
activation. Immunity. 39:311–323. 2013. View Article : Google Scholar : PubMed/NCBI
|
|
42
|
Jiang Y, Wang M, Huang K, Zhang Z, Shao N,
Zhang Y, Wang W and Wang S: Oxidized low-density lipoprotein
induces secretion of interleukin-1β by macrophages via reactive
oxygen species-dependent NLRP3 inflammasome activation. Biochem
Biophys Res Commun. 425:121–126. 2012. View Article : Google Scholar : PubMed/NCBI
|
|
43
|
Duewell P, Kono H, Rayner KJ, Sirois CM,
Vladimer G, Bauernfeind FG, Abela GS, Franchi L, Nuñez G, Schnurr
M, et al: NLRP3 inflamasomes are required for atherogenesis and
activated by cholesterol crystals. Nature. 464:1357–1361. 2010.
View Article : Google Scholar : PubMed/NCBI
|
|
44
|
Lin SJ, Yen HT, Chen YH, Ku HH, Lin FY and
Chen YL: Expression of interleukin-1 beta and interleukin-1
receptor antagonist in oxLDL-treated human aortic smooth muscle
cells and in the neointima of cholesterol-fed endothelia-denuded
rabbits. J Cell Biochem. 88:836–847. 2010. View Article : Google Scholar
|
|
45
|
Oury C: CD36: Linking lipids to the NLRP3
inflammasome, atherogenesis and atherothrombosis. Cell Mol Immunol.
11:8–10. 2014. View Article : Google Scholar :
|
|
46
|
Johnson RJ, Nakagawa T, Sanchez-Lozada LG,
Shafiu M, Sundaram S, Le M, Ishimoto T, Sautin YY and Lanaspa MA:
Sugar, uric acid, and the etiology of diabetes and obesity.
Diabetes. 62:3307–3315. 2013. View Article : Google Scholar : PubMed/NCBI
|
|
47
|
Lanaspa MA, Sanchez-Lozada LG, Cicerchi C,
Li N, Roncal-Jimenez CA, Ishimoto T, Le M, Garcia GE, Thomas JB,
Rivard CJ, et al: Uric acid stimulates fructokinase and accelerates
fructose metabolism in the development of fatty liver. PLoS One.
7:e4794802012. View Article : Google Scholar
|
|
48
|
Yang CS, Shin DM and Jo EK: The role of
NLR-related protein 3 inflammasome in host defense and inflammatory
diseases. Int Neurourol J. 16:2–12. 2012. View Article : Google Scholar : PubMed/NCBI
|
|
49
|
Halle A, Hornung V, Petzold GC, Stewart
CR, Monks BG, Reinheckel T, Fitzgerald KA, Latz E, Moore KJ and
Golenbock DT: The nalp3 inflammasome is involved in the innate
immune response to amyloid-beta. Nat Immunol. 9:857–865. 2008.
View Article : Google Scholar : PubMed/NCBI
|
|
50
|
Emmerson BT: Effect of oral fructose on
urate production. Ann Rheum Dis. 33:276–280. 1974. View Article : Google Scholar : PubMed/NCBI
|