Introduction
Oral cancer is a type of head and neck cancer
arising in the oral cavity, such as the lips, the anterior
two-thirds of the tongue, sublingual region and the hard palate
(1,2). There are several histological types
of oral cancer, and >90% of oral cancers are squamous cell
carcinomas. Oral squamous cell carcinoma (OSCC) is the eighth most
common type of cancer worldwide, leading to 144,000 deaths annually
(3). Despite many advances being
made in the surgical treatment, chemotherapy and radiotherapy used
in OSCC, the survival rate of patients with OSCC has not markedly
improved (4). Currently, the
5-year survival rate of patients with OSCC is approximately 50% due
to the tendency for metastasis (5,6).
Therefore, exploring biomarkers with high accuracy, specificity and
sensitivity based on the current genome-based approaches underlying
OSCC may be helpful for improving its diagnosis, treatment and
prognosis.
DNA methylation, mainly referring to the covalent
addition of a CH3 on the 5′ position of cytosine, is one
of the most important epigenetic modifications involved in the
physiological control of genome expression (7). Studies have demonstrated that
abnormal methylation mechanisms can result in abnormal gene
expression and decreased genomic stability, thereby exerting potent
effects on cancer genes (8,9).
For OSCC, the silencing of death associated protein kinase 1
(DAPK1), p16INK4a, cadherin 1 (CDH1),
O-6-methylguanine-DNA methyltransferase (MGMT) and
ABO, alpha 1-3-N-acetylgalactosaminyltransferase and alpha
1-3-galactosyltransferase (ABO) has been reported to be
linked with increased DNA methylation levels of the respective
promoters (10-12). Usually, DNA methylation is an
earlier event in the process of cell canceration compared with DNA
mutation (13). Therefore, it is
helpful for diagnostic prediction and therapeutic treatments based
on characteristics of DNA methylation patterns across cancers
(14). Screening high-risk
populations through methylation detection may improve the accuracy
of early diagnosis so as to gain more treatment time for cancer
patients.
In this study, we aimed to screen some important DNA
methylation markers based on the OSCC methylation data in The
Cancer Genome Atlas (TCGA). Additionally, a prognostic prediction
model was constructed using the screened DNA methylation markers
and further validated in another dataset, GSE52793.
Data and methods
Data collection
The methylation data of patients with OSCC, based on
the Illumina Infinium Human Methylation 450 BeadChip platform, were
downloaded from the TCGA database (https://gdc-portal.nci.nih.gov/). The Cancer Genome
Atlas is a public funded project that aims to catalogue and
discover major cancer-causing genomic alterations to create a
comprehensive 'atlas' of cancer genomic profiles through
large-scale genome sequencing (15). According to the definition of oral
anatomy, 378 oral samples were retained, including 18 gums, 30
tongue roots, 22 buccal mucosae, 66 mouth floor, 8 dura, 87 oral
cavity, and 156 tongue samples. Among these 378 oral samples, 312
samples with survival prognosis information were used as the
training dataset. The average age was 61.67±12.89 years, the ratio
of males to females was 213:99, the average overall survival (OS)
time was 27.61±27.70 months, and the dead to survival ratio was
131:181.
Simultaneously, the GSE52793 (platform: Illumina
Infinium Human Methylation 450 BeadChip) was downloaded from the
National Center of Biotechnology Information (NCBI) Gene Expression
Omnibus (GEO, http://www.ncbi.nlm.nih.gov/geo/). This dataset
contains DNA methylation profiles across approximately 450,000 CpGs
in oral rinse samples from a cohort of 82 OSCC patients who had
survival prognosis information. This dataset was used as the
validation dataset. The average OS time was 41.82±17.45 months, and
the dead to survival ratio was 23:59.
Screening of differentially methylated
genes (DMGs)
The samples in the TCGA training dataset were
divided into the bad prognostic group (survival time of <12
months and died) and the good prognostic group (survival time of
>36 months and still survived) according to the OS time recorded
in the clinical information. Subsequently, the detected methylation
sites were annotated according to the platform annotation
information and the meth-ylation sites located in the CpGs regions
of the genes were selected for differential methylation analysis
using the limma package (16)
(version 3.34.7, https://bioconductor.org/packages/release/bioc/html/limma.html)
in R3.4.1. Limma package is a R-based open-source software
development project in statistical genomics that provides enhanced
possibilities for biological interpretation of both differential
expression and differential splicing analyses of RNA sequencing
data (16). False discovery rate
(FDR) <0.05 and |log fold change (FC)|>0.2 were used as the
thresholds.
Co-methylation gene analysis
In order to evaluate the internal correlations
between CpG islands, we performed co-methylation analysis of all
CpG island methylation data using weighted correlation network
analysis (WGCNA) package (17)
(version 1.63, https://cran.r-project.org/web/packages/WGCNA/index.html)
in R3.4.1. The WGCNA package is a comprehensive collection of R
functions for performing various aspects of weighted correlation
network analysis that includes functions for network construction,
module detection, gene selection, calculations of topological
properties, data simulation, visualization, and interfacing with
external software (17). In this
method, the module was defined as a group of genes that had similar
methylation levels. Based on this algorithm, we screened the
modules that were significantly related to methylation levels. The
CpGs in the same module highly correlated with the meth-ylation
level.
Subsequently, the screened CpGs were mapped to each
WGCNA module to calculate the fold enrichment ratio and the P-value
of target CpGs in each module significantly correlated with the
methylation level using the hypergeometric algorithm. The formula
is f (k, N, M, N) = C (k, M) x C (n-k, n-m)/C (N, N) (17), where 'N' indicates all methylation
sites involved in the WGCNA algorithm analysis; 'M' indicates the
number of genes in each module obtained from the WGCNA algorithm;
and 'n' indicates the number of significant DMGs. The thresholds
for module screening were P<0.05 and fold enrichment >1.
Finally, the genes in the screened modules were subjected to
biology process enrichment analysis using the Database for
Annotation, Visualization and Integrated Discovery (DAVID, version
6.8, https://david.ncifcrf.gov/) (18,19). DAVID is an online available
bioinformatics resources that consists of an integrated biological
knowledgebase and analytic tools aimed at systematically extracting
biological meaning from large gene/protein lists (18,19).
Correlation analysis between the
methylation level and expression level
From the TCGA training dataset, the OSCC mRNA-seq
samples matching methylation profiles were selected. The
methylation levels and gene expression levels of DMGs involved in
key modules were extracted as well. The overall Pearsons'
correlation coefficients (PCC) (20) between the methylation levels and
gene expression levels were calculated using cor.test (https://stat.ethz.ch/R-manual/R-devel/library/stats/html/cor.test.html)
in R3.4.1. The cor.test is a program of R functions that can be
used for exploring the correlations between variables by Pearsons'
correlation coefficient (20).
The correlation between the methylation level and gene expression
level of each gene was then calculated and the DMGs whose
methylation levels negatively correlated with the expression levels
were selected for further analysis (P<0.05).
Screening of prognosis-related methylated
genes
Based on the expression levels of the screened DMGs
in TCGA samples, as well as the clinical survival prognosis
information, the prognosis-related methylated genes were screened
using the univariate Cox regression analysis implemented in
survival package (21) (version
2.41-1, http://bioconductor.org/packages/survivalr/) of
R3.4.1. The log-rank tested P-value <0.05 was considered as the
significance threshold.
Establishment of prognostic prediction
model based on methylated genes
According to the methylation levels of the
prognosis-related methylated genes, the optimized prognostic genes
were screened by the Cox-Proportional Hazards (Cox-PH) model
(22) based on L1 penalized
regularized regression algorithm (23) (version 0.9-50, http://bioconductor.org/packages/penalized/) of
R3.4.1. The Cox-PH model is a predictive model of overall and
disease-free survival, based on demographic and clinical covariates
(24).
Subsequently, the risk prediction model was
constructed based on the prognosis coefficients of optimized
prognostic genes. The risk score of each sample was calculated as
follows: Risk score=∑coefgene ×
Methylationgene, where coefgene represents
the regression coefficient obtained in the previous step, and
Methylationgene represents the methylation level of the
corresponding gene.
Finally, the samples in TCGA training dataset were
divided into the high- and low-risk groups according to the median
of the risk score. The association between risk model and prognosis
was assessed by the Kaplan-Meier (KM) survival curve (25) in survival package (version
2.41-1). The KM survival curve is the probability of surviving in a
given length of time while considering time in many small intervals
(25). Moreover, the discriminant
efficacy of the prediction model on survival prognosis was
evaluated through the validation dataset GSE52793.
Results
Screening of significant DMGs
A total of 15,654 gene methylation sites containing
CpGs were obtained through the annotation information on the
Illumina 450 K methylation platform. Subsequently, in the TCGA
training dataset, 54 samples were divided into the bad prognostic
group and 46 were divided into the good prognostic group. Finally,
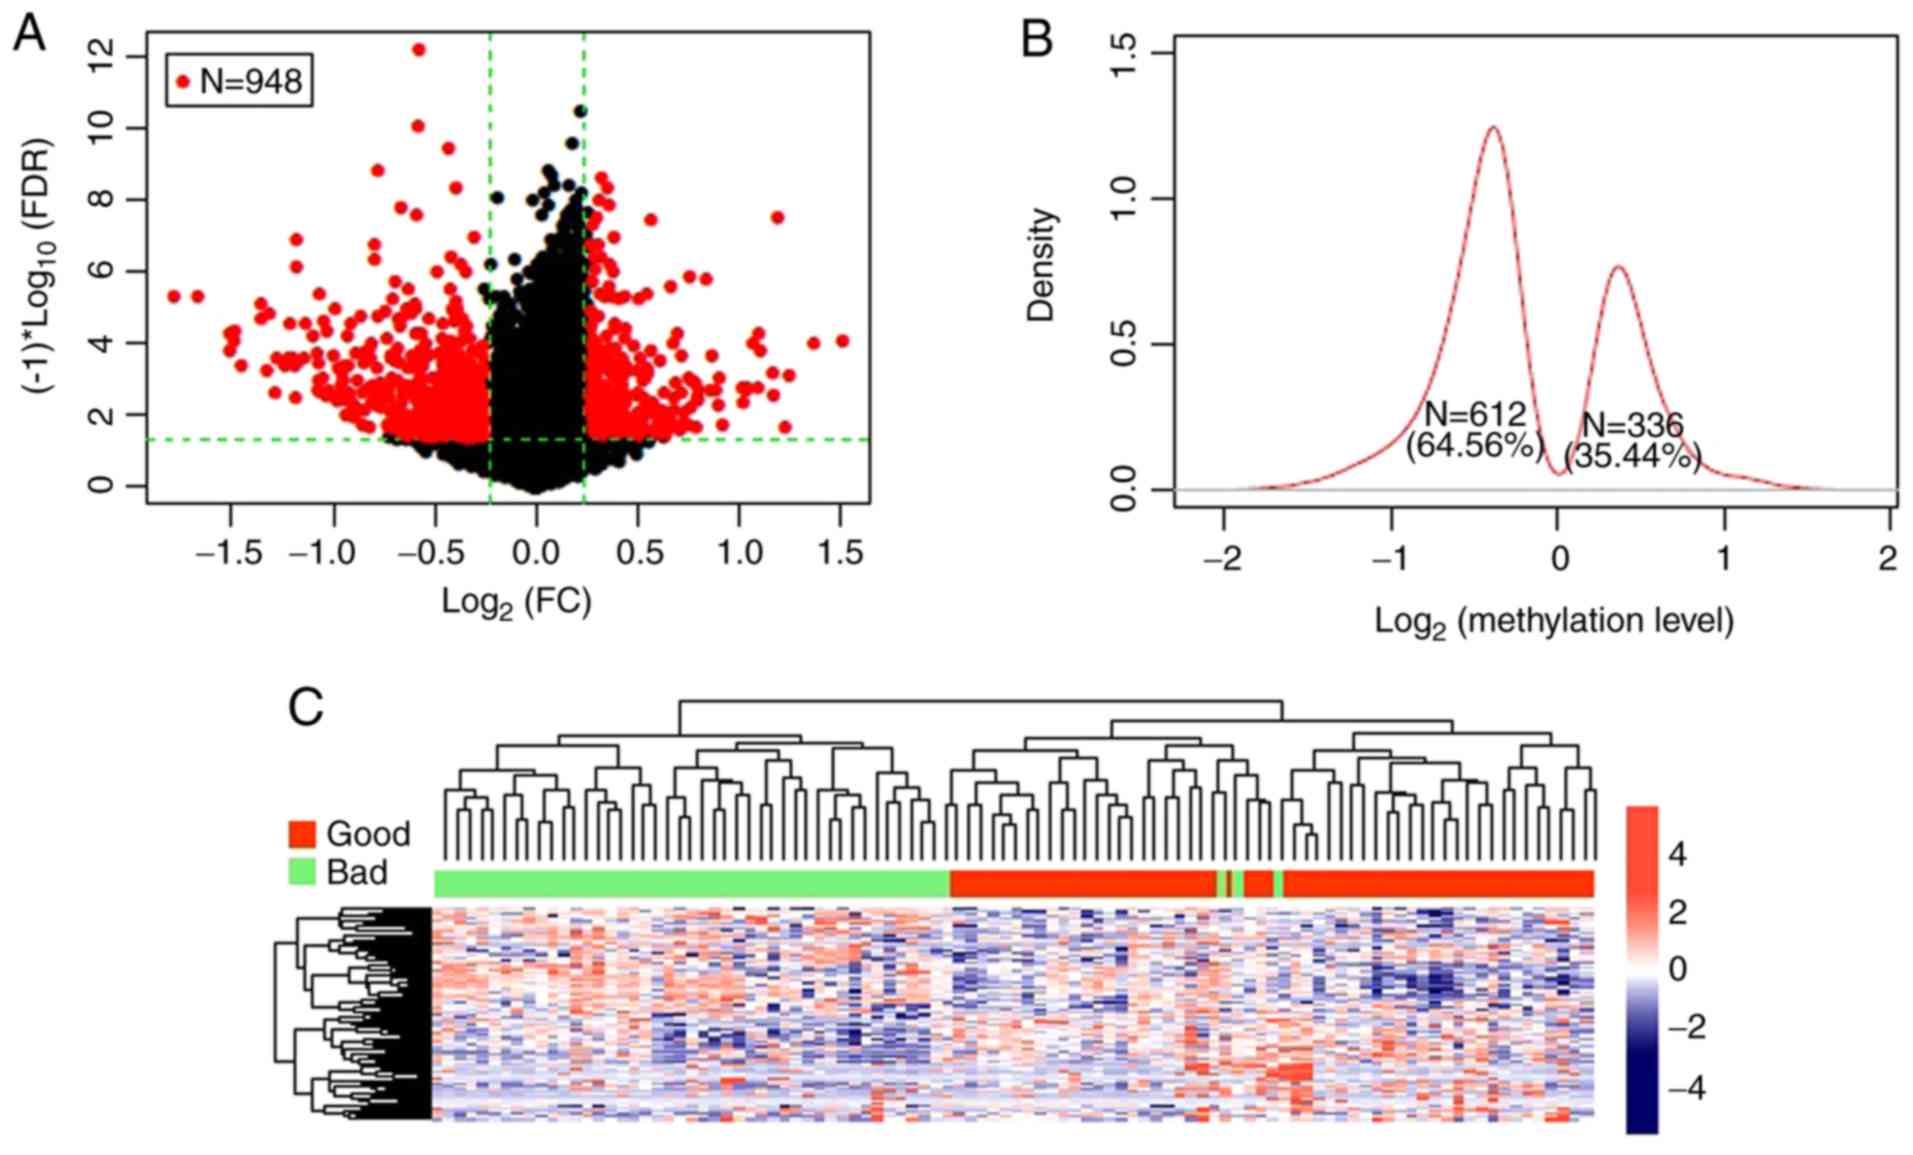
a total of 948 DMGs with CpGs were screened out and the volcano
plot is presented in Fig. 1A. The
log2 Kernel density curve revealed that 64.56% (612/948)
of the DMGs were significantly hypomethylated in the good
prognostic group, and 35.44% (336/948) were significantly
hypermethylated (Fig. 1B). The
bidirectional hierarchical cluster heatmap revealed that the
samples were clearly divided into 2 groups based on the screened
DMGs (Fig. 1C).
Among the CpGs of the 948 DMGs, 15 were in the
transcription start site (TSS) area, 432 in the gene body area, 104
in the 5′UTR region, 17 in the 3′UTR region, and 380 in the
promoter region. The top 20 DMGs with CpGs sorted according to FDR
are presented in Table I.
 | Table IThe top 20 significant differentially
methylated genes (DMGs) with CpGs between bad prognostic group and
good prognostic group sorted according to false discovery rate
(FDR). |
Table I
The top 20 significant differentially
methylated genes (DMGs) with CpGs between bad prognostic group and
good prognostic group sorted according to false discovery rate
(FDR).
| Methylation
loci | Chr. | Position | Genes | Location | β-bad | β-good | Effect | Pnominal | FDR |
|---|
| cg03904042 | chr20 | 31719152 | NECAB3 | Body | 0.3413 | 0.2296 | −0.5719 |
8.05×10⁻⁷ |
2.21×10⁻⁵ |
| cg04488521 | chr5 | 178420322 | ZNF354C | Promoter | 0.3382 | 0.2272 | −0.5737 |
3.42×10⁻⁶ |
9.37×10⁻⁵ |
| cg09595479 | chr12 | 47975479 | PRPH | 1stExon | 0.4229 | 0.3151 | −0.4244 |
5.31×10⁻⁶ |
1.45×10⁻⁴ |
| cg00054702 | chr5 | 135556442 | LOC389332 | Body | 0.1967 | 0.1149 | −0.7755 |
8.34×10⁻⁶ |
2.29×10⁻⁴ |
| cg07040405 | chr2 | 174537121 | SP3 | Promoter | 0.0306 | 0.0383 | 0.3253 |
9.43×10⁻⁶ |
2.59×10⁻⁴ |
| cg13146839 | chr3 | 192063116 | LOC647309 | 1stExon | 0.4032 | 0.5159 | 0.3556 |
1.12×10⁻⁵ |
3.08×10⁻⁴ |
| cg00741900 | chr14 | 101097550 | DIO3 | 5′UTR | 0.3288 | 0.2510 | −0.3892 |
1.15×10⁻⁵ |
3.14×10⁻⁴ |
| cg27229100 | chr20 | 47330667 | C20orf199 | Body | 0.4259 | 0.5299 | 0.3153 |
1.44×10⁻⁵ |
3.94×10⁻⁴ |
| cg13316171 | chr2 | 187059280 | ZC3H15 | 1stExon | 0.0212 | 0.0273 | 0.3649 |
1.56×10⁻⁵ |
4.28×10⁻⁴ |
| cg01494348 | chr8 | 144731538 | NAPRT1 | Promoter | 0.1567 | 0.0991 | −0.6612 |
1.64×10⁻⁵ |
4.50×10⁻⁴ |
| cg24960763 | chr12 | 132217389 | ZNF10 | Promoter | 0.0867 | 0.0578 | −0.5848 |
1.90×10⁻⁵ |
5.22×10⁻⁴ |
| cg18113994 | chr19 | 62817679 | ZNF134 | 1stExon | 0.0784 | 0.1796 | 1.1953 |
2.04×10⁻⁵ |
5.60×10⁻⁴ |
| cg06815419 | chr15 | 81526866 | BTBD1 | Promoter | 0.0215 | 0.0265 | 0.3018 |
2.05×10⁻⁵ |
5.63×10⁻⁴ |
| cg25019777 | chr4 | 53220160 | USP46 | Promoter | 0.0432 | 0.0641 | 0.5716 |
2.08×10⁻⁵ |
5.70×10⁻⁴ |
| cg00004421 | chr17 | 7415803 | SENP3 | TSS1500 | 0.4066 | 0.4947 | 0.2828 |
2.35×10⁻⁵ |
6.44×10⁻⁴ |
| cg01331992 | chr9 | 19369118 | RPS6 | Body | 0.2316 | 0.3035 | 0.3899 |
2.95×10⁻⁵ |
8.09×10⁻⁴ |
| cg00767496 | chr15 | 43458571 | GATM | Body | 0.5105 | 0.4140 | −0.3020 |
3.00×10⁻⁵ |
8.22×10⁻⁴ |
| cg21858255 | chr12 | 103133739 | TXNRD1 | Promoter | 0.1570 | 0.0696 | −1.1737 |
3.15×10⁻⁵ |
8.64×10⁻⁴ |
| cg02605461 | chr20 | 32047137 | RALY | 5′UTR | 0.3931 | 0.4871 | 0.3095 |
3.37×10⁻⁵ |
9.25×10⁻⁴ |
| cg26658728 | chr16 | 65195711 | CMTM3 | 5′UTR | 0.1783 | 0.1032 | −0.7891 |
3.38×10⁻⁵ |
9.26×10⁻⁴ |
Co-methylation gene analysis
In the WGCNA algorithm, we selected the power value
(power=6) when the square value of the correlation coefficient
reached up to 0.9 for the first time. The topological overlap
matrix was then calculated to evaluate the correlation between the
methylation levels of two genes, subsequently constructing the
system clustering tree. With parameters of minSize=100 and
cutHeight=0.99, 15 modules were obtained (Fig. 2A and Table II). The CpGs gene expression
levels in the modules were significantly associated with the
methylation levels, apart from the grey module (P<0.05). The
average of significant correlation coefficients was 0.547, ranging
from 0.138 to 0.777. The number of DMGs in each module and the fold
enrichment ratio of each module are shown in Fig. 2B and C, respectively. According to
the hyper-geometric enrichment algorithm, 2 (brown and turquoise)
modules were obtained. There were 208 and 172 DMGs in the brown and
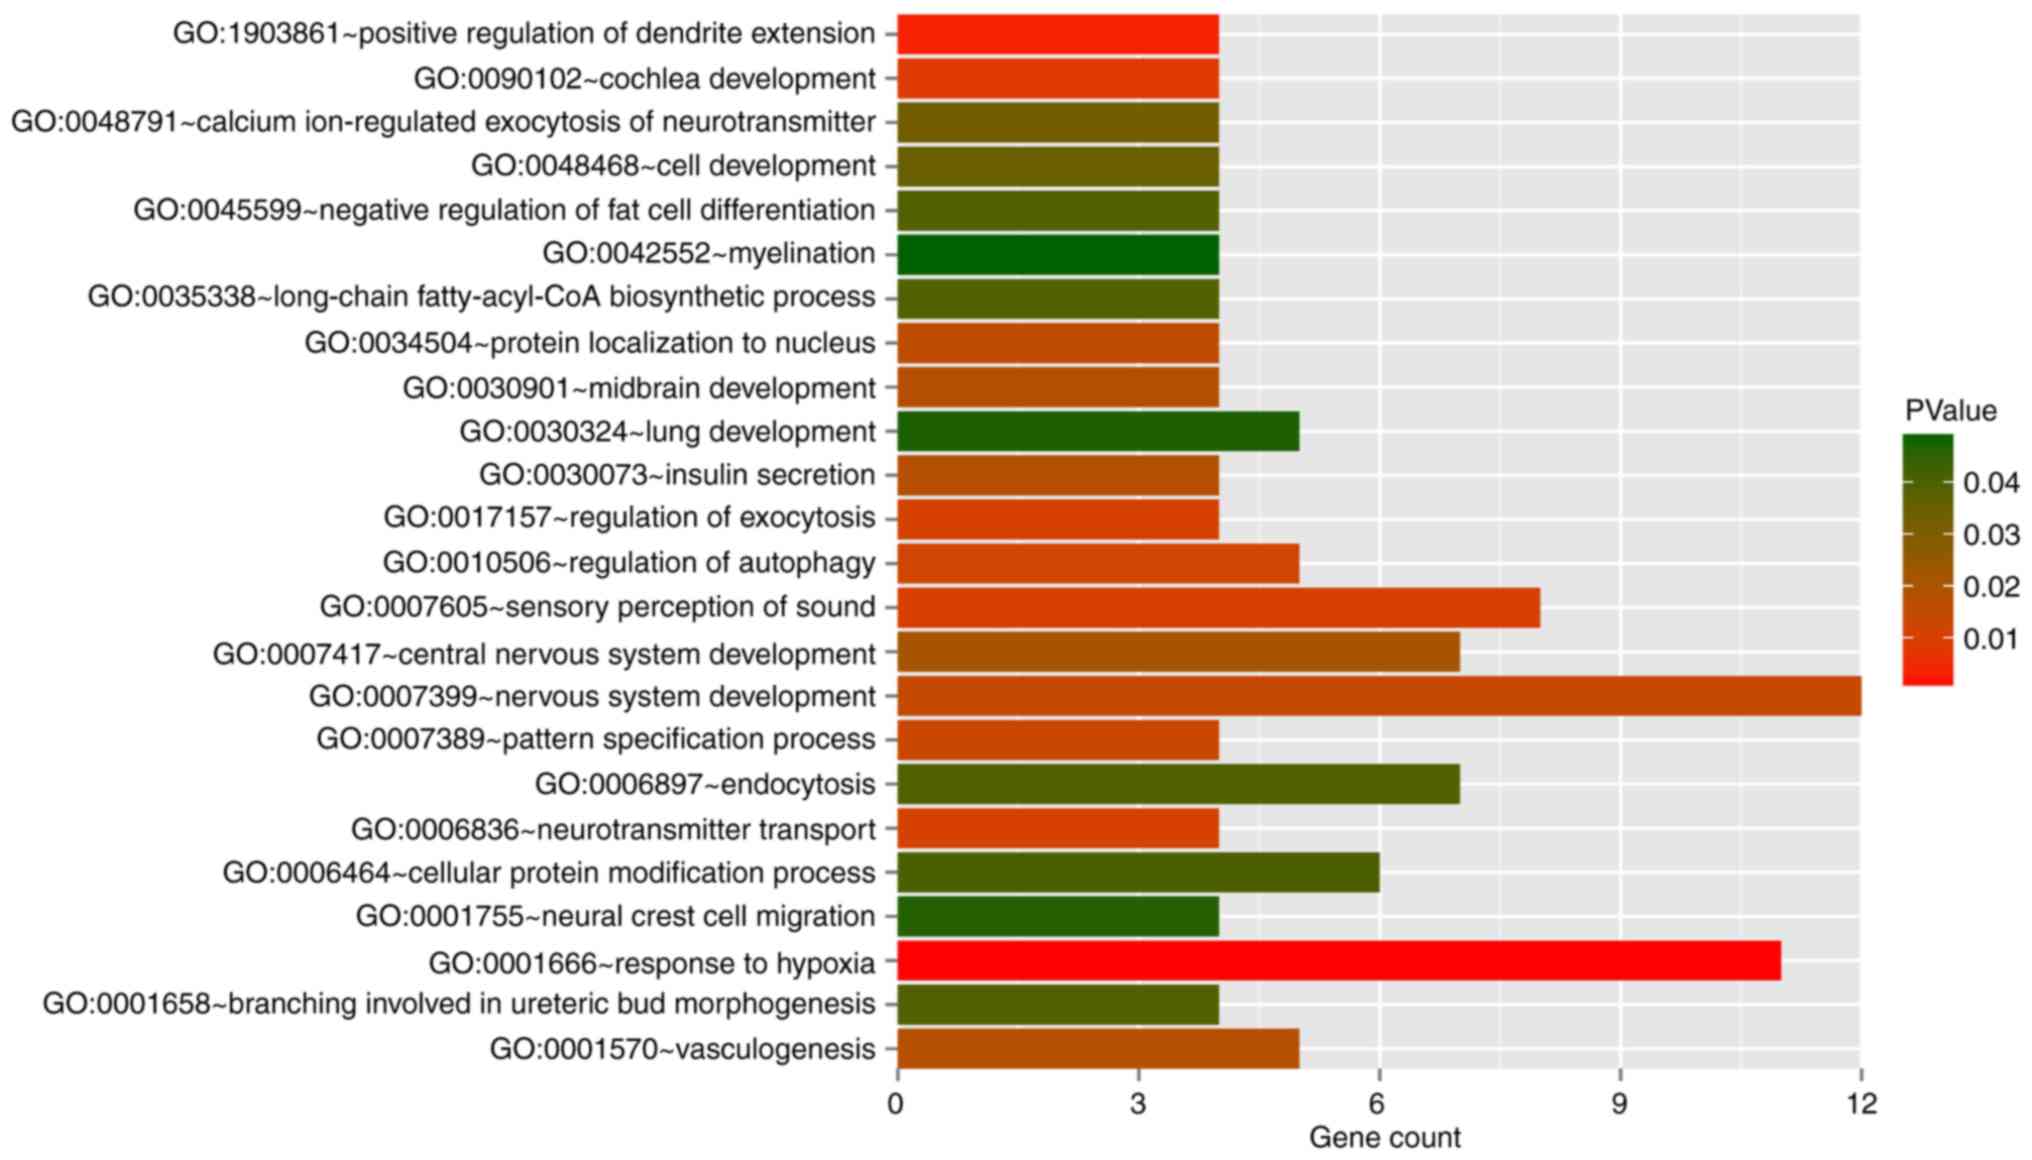
turquoise modules, respectively. Functional enrichment analysis
revealed these 380 DMGs were significantly related to 24 biological
processes, such as vasculogenesis and response to hypoxia (Fig. 3).
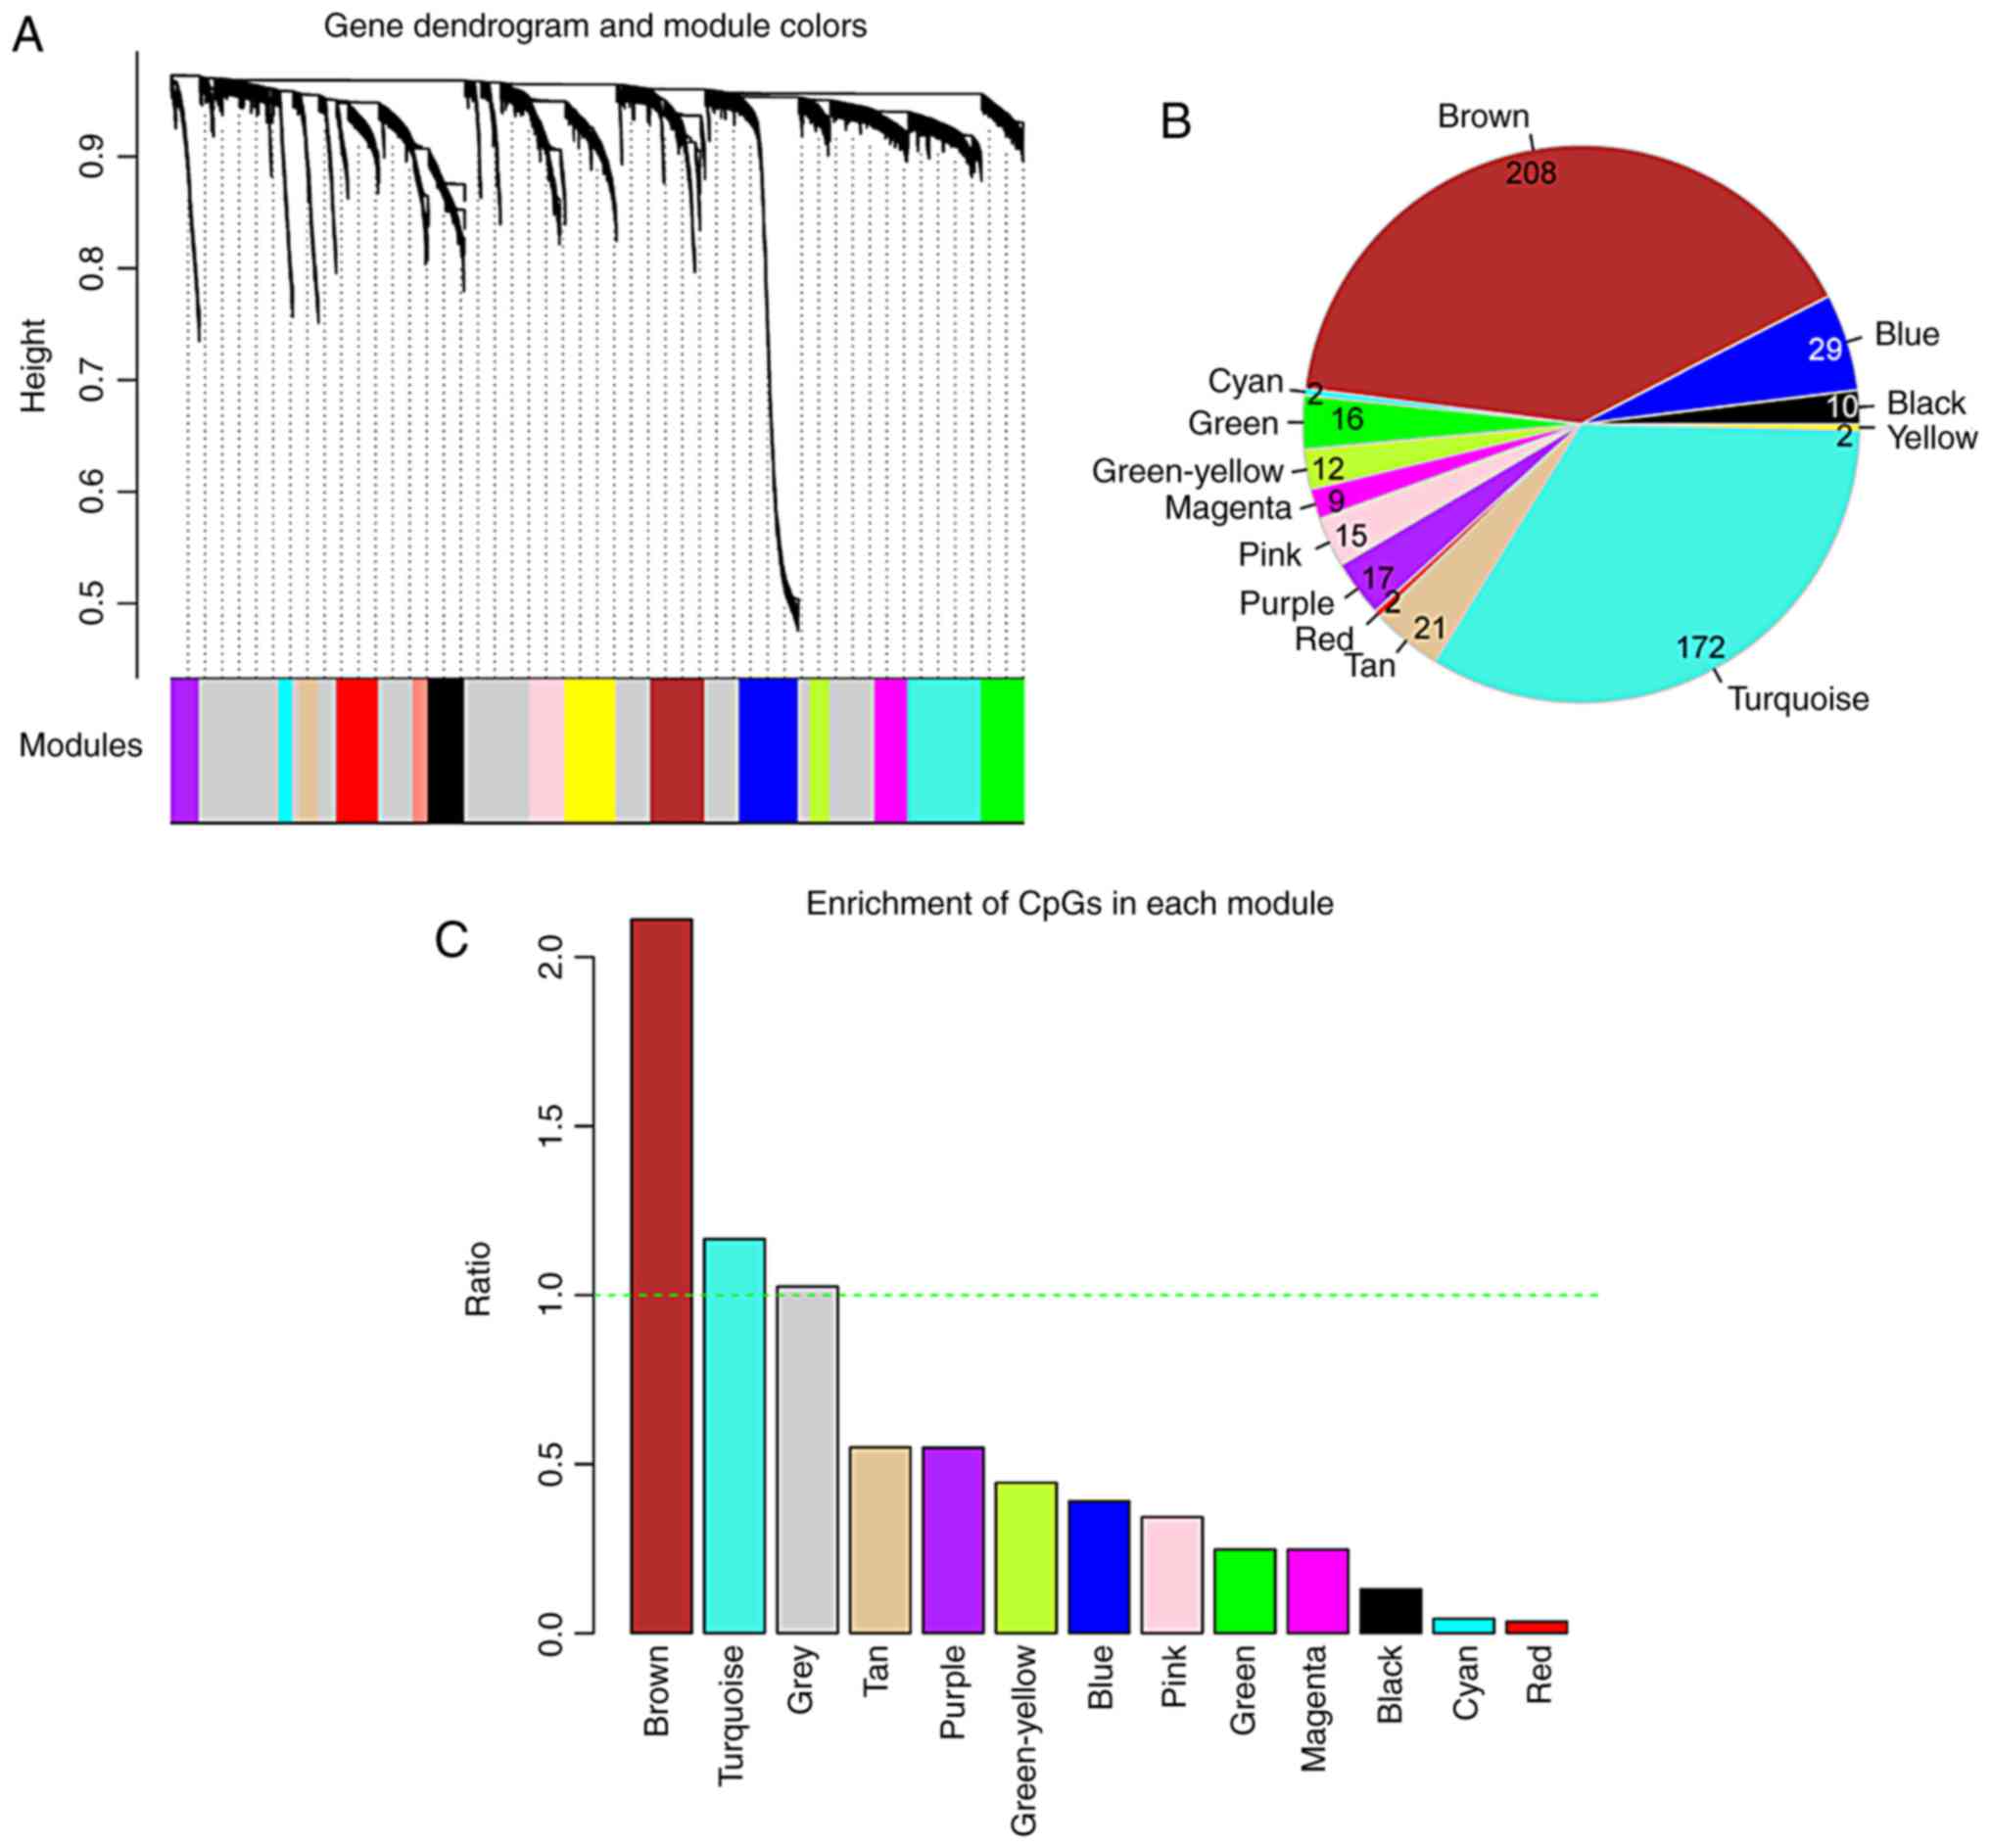 | Figure 2Screening of modules related to gene
CpG methylation by weighted correlation network analysis (WGCNA).
(A) The modules related to gene CpGs methylation. A total of 15
modules were identified, and they were presented by 15 different
colors (black, blue, brown, cyan, green, green-yellow, grey,
magenta, pink, purple, red, salmon, tan, turquoise and yellow). (B)
The number of differentially methylated genes in the brown, blue,
black, yellow, turquoise, tan, red, purple, pink, magenta,
green-yellow, green, cyan models. (C) Fold enrichment column graph
of the brown, blue, black, yellow, turquoise, tan, red, purple,
pink, magenta, green-yellow, green, cyan models. The green
horizontal dotted line represents a fold enrichment ratio of 1. |
| Table IIInformation of the 15 modules
identified by weighted correlation network analysis. |
Table II
Information of the 15 modules
identified by weighted correlation network analysis.
| Color | #CpGs | Correlation |
Pcorr | DE CpGs | Enrichment fold
(95% CI) |
Phyper |
|---|
| Black | 290 | 0.7553 |
5.3×10⁻²⁹ | 10 | 0.2477 |
1.439×10⁻⁷ |
| Blue | 468 | 0.6377 |
3.33×10⁻³ | 29 | 0.4452 |
5.483×10⁻⁶ |
| Brown | 430 | 0.7665 |
8.58×10⁻⁸ | 208 | 3.4742 |
2.200×10⁻¹⁶ |
| Cyan | 110 | 0.7766 |
3.93×10⁻⁹ | 2 | 0.1306 |
1.104×10⁻⁴ |
| Green | 334 | 0.5926 |
7.60×10⁻¹⁵ | 16 | 0.3442 |
2.647×10⁻⁶ |
| Green-yellow | 157 | 0.6143 |
4.24×10⁻²⁰ | 12 | 0.5491 |
4.249×10⁻² |
| Grey | 2,667 | 0.2203 |
7.42×10⁻² | 433 | 1.1662 |
1.408×10⁻² |
| Magenta | 261 | 0.6383 |
1.38×10⁻²⁵ | 9 | 0.2477 |
7.327×10⁻⁷ |
| Pink | 276 | 0.6787 |
1.27×10⁻¹³ | 15 | 0.3904 |
9.668×10⁻⁵ |
| Purple | 222 | 0.6008 |
4.42×10⁻³ | 17 | 0.5501 |
1.520×10⁻² |
| Red | 333 | 0.6209 |
6.26×10⁻¹⁵ | 2 | 0.0432 |
5.343×10⁻¹⁶ |
| Salmon | 120 | 0.2454 |
4.37×10⁻¹¹ | - | - | - |
| Tan | 147 | 0.1381 |
5.75×10⁻¹⁰ | 21 | 1.0262 |
9.052×10⁻¹ |
| Turquoise | 585 | 0.5115 |
1.02×10⁻¹⁵ | 172 | 2.112 |
3.342×10⁻¹⁴ |
| Yellow | 410 | 0.4044 |
4.85×10⁻¹⁰ | 2 | 0.03503 |
2.200×10⁻¹⁶ |
Correlation analysis between the
methylation level and expression level of key DMGs
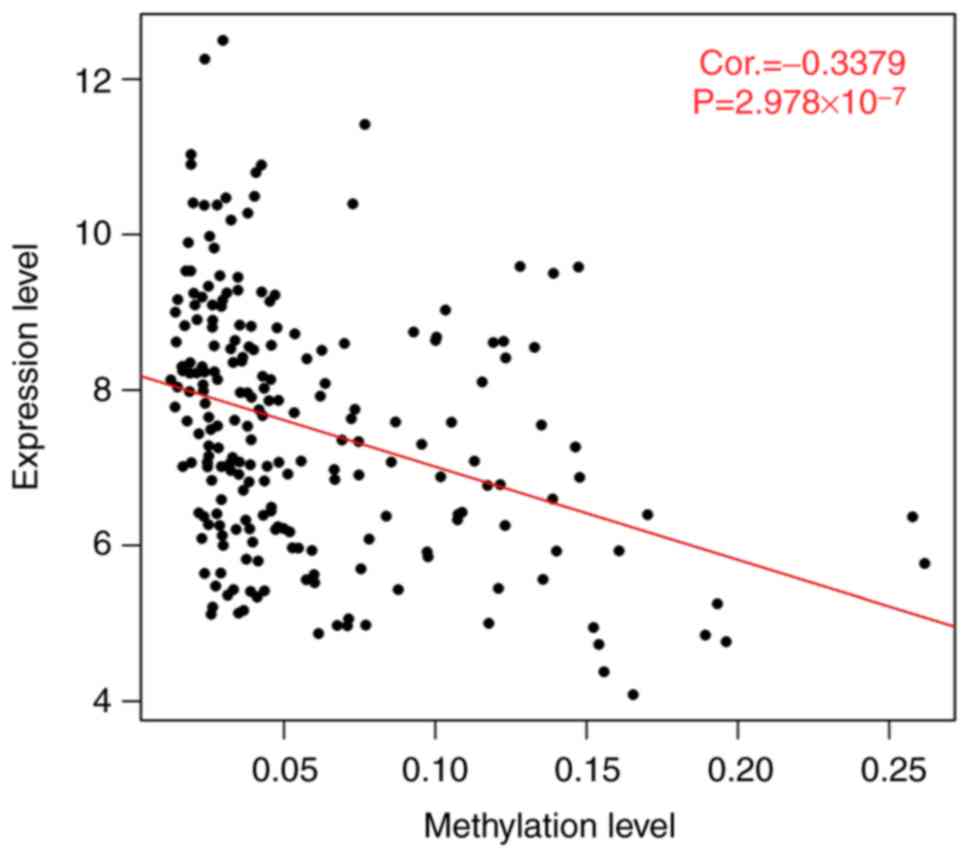
The overall correlation analysis between the
methylation levels and expression levels of the 380 DMGs mentioned
above revealed that there was a significant negative correlation
between the gene methylation and expression level (Cor.=−0.3379,
P=2.978e-07; Fig. 4). After
searching the published studies on line about the correlation
analysis between the methylation levels and expression levels, some
correlation coefficients of revealed significant correlations were
below 0.5. For example, in the study by Győrffy et al, the
significant correlations between the methylation of gene regions
and expression levels among prognostic genes in the internal cohort
of breast cancer patients revealed that most of the absolute
correlation coefficients were <0.5 (26). Therefore, the results may be not
lower than expected. The analysis of the correlation between the
methylation and expression levels for each gene revealed that the
methylation levels of 132 genes negatively correlated with the
expression levels (data not shown).
Screening of prognosis-related methylated
genes
Based on the methylation levels of CpGs in these 132
genes in the TCGA samples and the clinical survival prognosis of
samples, we identified 27 methylated genes that were significantly
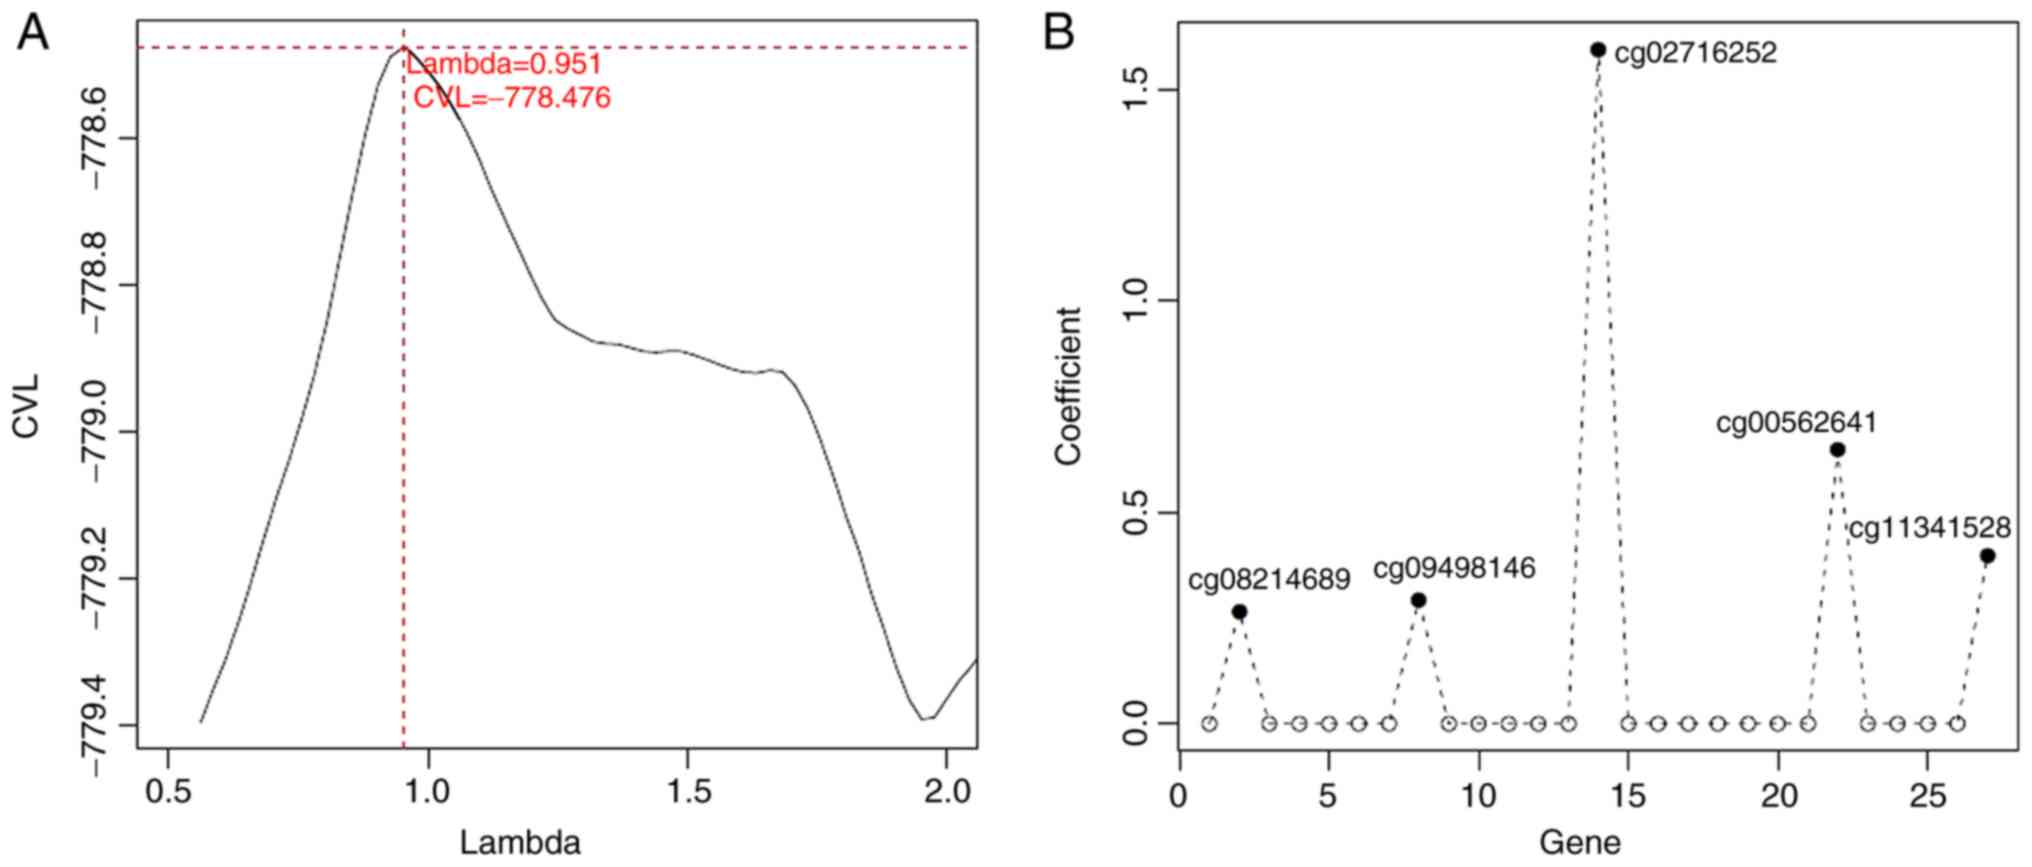
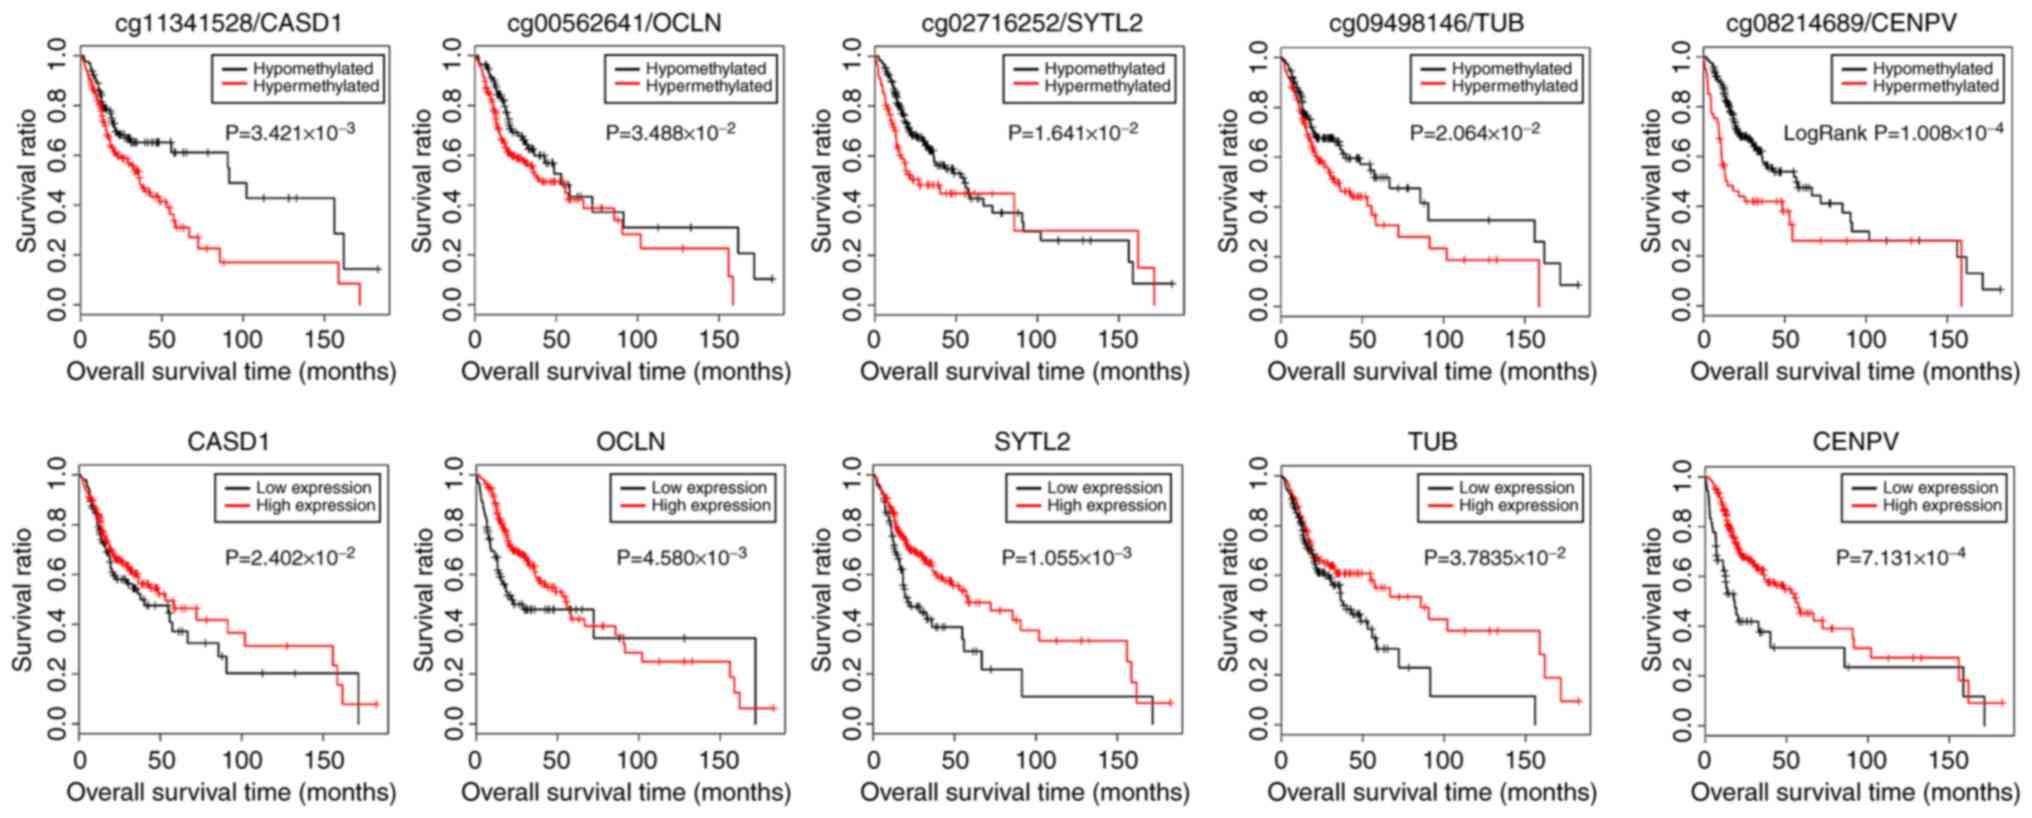
associated with prognosis. Subsequently, 5 optimized prognostic
genes [centromere protein V (CENPV), Tubby bipartite
transcription factor (TUB), synaptotagmin like 2
(SYTL2), occludin (OCLN) and CAS1 domain containing 1
(CASD1)] were selected through the Cox-PH model (Fig. 5A). The prognosis coefficients of
these 5 genes are shown in Fig.
5B. Subsequently, according to the median of the methylated
signal value, the samples were divided into the hypomethylation and
hypermethylation groups. The KM curves revealed that the samples
with hypomethylation levels had a better OS (P<0.05; Fig. 6). Additionally, according to the
median of the gene expression level, the samples were divided into
the high expression and low expression groups. The KM curves
revealed that the samples with high expression levels had a better
OS (P<0.05; Fig. 6).
Prognosis prediction model based on
optimized methylated genes
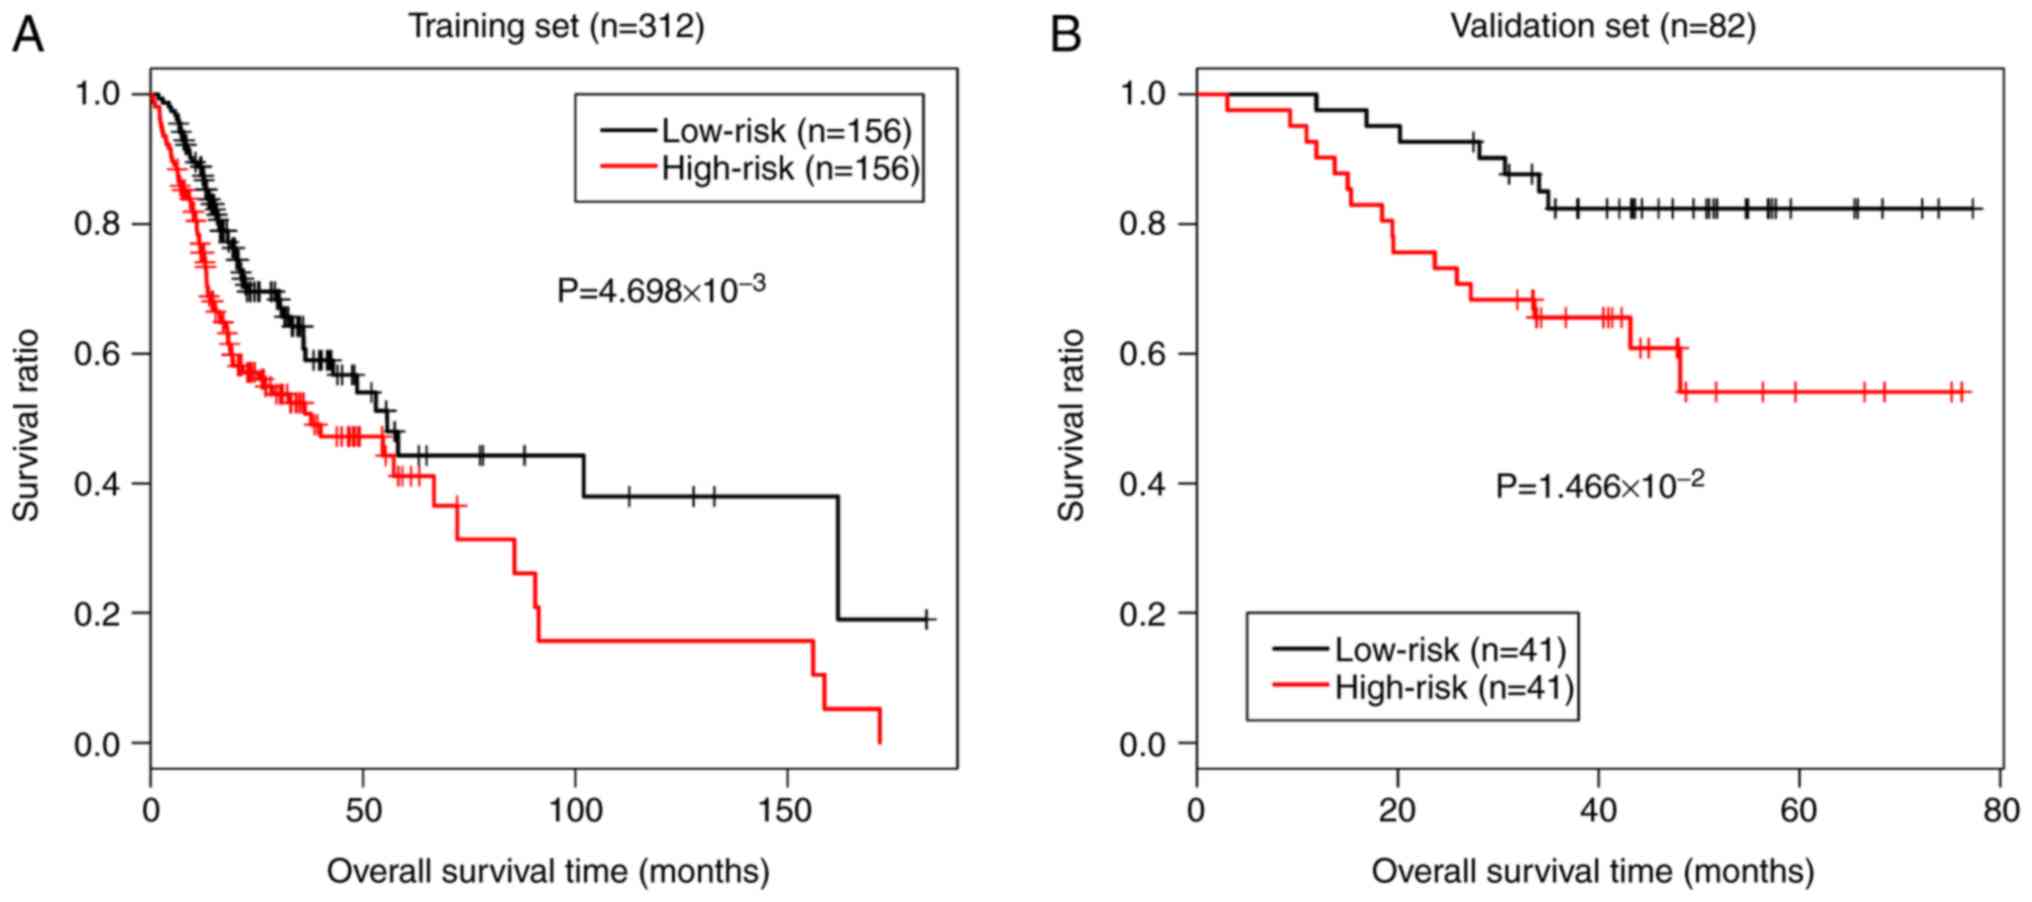
Based on the Cox-PH prognostic coefficients of the 5
genes, the gene-based risk prediction model was constructed as
follows: Risk score=(0.2666) × Methylationcg08214689 +
(0.2937) × Methylationcg09498146 + (1.5954) ×
Methylationcg02716252 + (0.6491) ×
Methylationcg00562641 + (0.3989) ×
Methylationcg11341528.
The risk score of each sample was calculated using
the above-mentioned formula. In order to evaluate the discriminant
efficacy of the prediction model on the survival prognosis, we
divided the samples in the TCGA training dataset into the high- and
low-risk groups based on the median of the risk score. The KM
curves of the TCGA dataset revealed that the low-risk samples had a
better survival prognosis (P=4.698e-03; Fig. 7A). Additionally, the discriminant
efficacy of the prediction model was also evaluated in the
validation dataset GSE52793, and the results were consistent with
those of the TCGA training dataset (P=1.466e-02; Fig. 7B).
Discussion
In the present study, we analyzed the methylation
data of patients with OSCC downloaded from the TCGA database, and
selected 5 optimized genes (CENPV, TUB, SYTL2,
OCLN and CASD1) associated with methylation through a
series of bioinformatics methods. Based on these 5 genes, a
prognostic prediction model was constructed and its discriminant
efficacy on survival prognosis was confirmed by the validation
dataset GSE52793.
Among the 5 genes, SYTL2, OCLN and
CASD1 have been reported to be associated with
tumorigenesis. SYTL2 possesses a C-terminal tandem C2 domain,
N-terminal Slp homology domain and Rab-binding region (27), which is primarily characterized as
an effector of Rab27, a Ras-related small GTPase (28). SYTL2 can regulate
tubulogenesis and cell signaling by promoting the trafficking of
the signaling molecule, podocalyxin, to the apical surface through
a Rab27-dependent manner (29).
Recently, SYTL2 has been reported to be implicated in cancer
pathogenesis. Ho et al (30) analyzed 223 Rab effector genes in
bladder cancer and found that the Rab27 gene cluster was
deregulated in the carcinoma in situ pathway and Ta pathway.
Specifically, SYTL2 was downregulated in the two
above-mentioned pathways and was associated with differentiation.
More recently, SYTL2 was demonstrated to serve as an epigenetically
regulated pro-metastatic factor and to be associated with a poorer
survival in patients with ovarian cancer (31). These findings suggest that
SYTL2 plays critical roles in human cancers, although its
role in OSCC has not been reported previously, at least to the best
of our knowledge.
OCLN encodes an integral membrane protein
which plays an important role in cytokine-induced regulation of the
tight junction (32). The
disruption of the structure of tight junction or occludin is
related to cancer invasion and metastasis (33). A previous study reported that
OCLN downregulation is a common feature of
epithelial-mesenchymal-transition in tumors derived from simple
epithelial cells (34). To date,
the downregulation of OCLN has been reported in breast
cancer, liver tumors, endometrial carcinoma and lung cancer
(33,35-37). Rachow et al (32) observed the loss of OCLN in
cutaneous squamous cell carcinoma and suggested that OCLN
loss was related to cell adhesion, apoptosis and proliferation
(32). Importantly, OCLN
has been demonstrated to be methylated in the promoter and
endogenous region of a breast cancer cell line (38). Therefore, we speculated that
OCLN might serve as an important prognostic maker in
OSCC.
A recent study demonstrated that CASD1 is a sialate
O-acetyltransferase (SOAT), a key enzyme in the
biosyn-thesis of 9-O-acetylated sialoglycans (39). Evidence has also indicated an
enhanced SOAT activity in the lymphoblasts of children with acute
lymphoblastic leukemia and SOAT is thus considered a possible
biomarker for monitoring acute lymphoblastic leukemia (40). Currently, its role in other solid
cancers, particularly OSCC has not been reported, at least to the
best of our knowledge. According to the results of this study, we
hypothesized that the methylation of CASD1 may be a key
predictor for the prognosis of patients with OSCC. Taken together,
in consideration of the reports associated with the functions of
SYTL2, OCLN and CASD1 in human cancers, it can
be concluded that the constructed risk prediction model may have
the potential to be used in predicting the survival of patients
with OSCC.
CENPV encodes a centrosome-associated
protein. Presently, there are very few specific studies available
on the role of CENPV in human cancers (41). Notably, there are a number of
studies available on the other centromere proteins in cancers. It
has been reported that the enhanced expression of centromere
protein A is implicated in the poor survival of patients with human
cancers (42,43). Centromere protein A has been
considered as a prognostic and predictive biomarker in human
cancers (44). Additionally, the
elevated expression of centromere protein F can predict clinical
progression and prognosis in patients with prostate cancer
(45). Importantly, human
centromere protein H has been suggested to be closely linked to the
increased or abnormal cell proliferation in human OSCC (46). These findings mentioned above
suggest the critical roles of centromere protein in predicting
human cancers. CENPV may thus serve as a potential
prognostic factor in human OSCC.
For the marker gene TUB, it encodes a member
of the Tubby family of bipartite transcription factors. The Tubby
proteins are a unique protein family sharing a highly conserved
C-terminal domain, playing a role in obesity and sensorineural
degradation (47). However, the
function of TUB in cancers has not yet been reported, at
least to the best of our best knowledge. In view of the reliability
of the risk prediction models in the present study, we considered
that methylated TUB may be a prognostic factor in OSCC.
In spite of these findings mentioned above, there
were some limitations to our study. Although RNA sequencing is able
to identify and quantify transcripts, isoforms, novel transcripts,
gene fusions, and non-coding RNAs among a wide range of samples
rapidly and accurately, the methylation level and expression level
of the 5 predicted genes should be further detected using
laboratory experiments, such as PCR. Additionally, the constructed
risk prediction model should also be applied to other cohorts of
patients with OSCC to further confirm the discriminant efficacy of
the prediction model on survival prognosis, even though this
prediction model has been verified in a validation dataset
GSE52793.
In conclusion, the present study identified 5 key
methylated genes (CENPV, SYTL2, OCLN,
CASD1 and TUB) for OSCC based on the methylation data in the
TCGA database. Moreover, the constructed risk prediction model was
validated in GSE52793 suggesting that this prediction model may be
helpful for predicting the survival prognosis of patients OSCC.
Funding
The study was supported by Scientific Research
Projects of Shanghai Municipal Commission of Health and Family
Planning (no. 201840040).
Availability of data and materials
The datasets used and/or analyzed during the current
study are available from the corresponding author on reasonable
request.
Authors' contributions
QZ and GT performed data analyses and wrote the
manuscript. JG conceived and designed the study. All authors have
read and approved the final manuscript.
Ethics approval and consent to
participate
All patient data were derived from online datasets;
thus, no ethics approval was required.
Patient consent for publication
Not applicable.
Competing interests
The authors declare that they have no competing
interests.
Acknowledgments
Not applicable.
References
|
1
|
Werning JW: Oral cancer: Diagnosis,
management, and rehabilitation. Thieme. 2007
|
|
2
|
World Health Organization (WHO):
International classification of diseases for oncology (ICD-O)-3rd
edition, 1st revision. Fritz A, Percy C, Jack A, Shanmugaratnam K,
Sobin L, Parkin DM and Whelan S: WHO; Geneva: 2013
|
|
3
|
Wu Y, Zhang L, Zhang L, Wang Y, Li H, Ren
X, Wei F, Yu W, Liu T, Wang X, et al: Long non-coding RNA HOTAIR
promotes tumor cell invasion and metastasis by recruiting EZH2 and
repressing E-cadherin in oral squamous cell carcinoma. Int J Oncol.
46:2586–2594. 2015. View Article : Google Scholar : PubMed/NCBI
|
|
4
|
Wikner J, Gröbe A, Pantel K and Riethdorf
S: Squamous cell carcinoma of the oral cavity and circulating
tumour cells. World J Clin Oncol. 5:114–124. 2014. View Article : Google Scholar : PubMed/NCBI
|
|
5
|
Siegel R, Ma J, Zou Z and Jemal A: Cancer
statistics, 2014. CA Cancer J Clin. 64:9–29. 2014. View Article : Google Scholar : PubMed/NCBI
|
|
6
|
Bhattacharya A, Roy R, Snijders AM,
Hamilton G, Paquette J, Tokuyasu T, Bengtsson H, Jordan RC, Olshen
AB, Pinkel D, et al: Two distinct routes to oral cancer differing
in genome instability and risk for cervical node metastasis. Clin
Cancer Res. 17:7024–7034. 2011. View Article : Google Scholar : PubMed/NCBI
|
|
7
|
Choo KB: Epigenetics in disease and
cancer. Malays J Pathol. 33:61–70. 2011.
|
|
8
|
Deng J, Liang H, Zhang R, Ying G, Xie X,
Yu J, Fan D and Hao X: Methylated CpG site count of dapper homolog
1 (DACT1) promoter prediction the poor survival of gastric cancer.
Am J Cancer Res. 4:518–527. 2014.PubMed/NCBI
|
|
9
|
Nakamura J, Tanaka T, Kitajima Y, Noshiro
H and Miyazaki K: Methylation-mediated gene silencing as biomarkers
of gastric cancer: A review. World J Gastroenterol. 20:11991–12006.
2014. View Article : Google Scholar : PubMed/NCBI
|
|
10
|
Nakayama S, Sasaki A, Mese H, Alcalde R,
Tsuji T and Matsumura T: The E-cadherin gene is silenced by CpG
methylation in human oral squamous cell carcinomas. Int J Cancer.
93:667–673. 2001. View
Article : Google Scholar : PubMed/NCBI
|
|
11
|
Rosas SL, Koch W, da Costa Carvalho MG, Wu
L, Califano J, Westra W, Jen J and Sidransky D: Promoter
hypermethylation patterns of p16,
O6-methylguanine-DNA-methyltransferase, and death-associated
protein kinase in tumors and saliva of head and neck cancer
patients. Cancer Res. 61:939–942. 2001.PubMed/NCBI
|
|
12
|
Gao S, Worm J, Guldberg P, Eiberg H,
Krogdahl A, Liu CJ, Reibel J and Dabelsteen E: Genetic and
epigenetic alterations of the blood group ABO gene in oral squamous
cell carcinoma. Int J Cancer. 109:230–237. 2004. View Article : Google Scholar : PubMed/NCBI
|
|
13
|
Delpu Y, Cordelier P, Cho W and Torrisani
J: DNA methylation and cancer diagnosis. Int J Mol Sci.
14:15029–15058. 2013. View Article : Google Scholar : PubMed/NCBI
|
|
14
|
Zhang C, Zhao H, Li J, Liu H, Wang F, Wei
Y, Su J, Zhang D, Liu T and Zhang Y: The identification of specific
methylation patterns across different cancers. PLoS One. 10:pp.
e01203612015, View Article : Google Scholar : PubMed/NCBI
|
|
15
|
Tomczak K, Czerwińska P and Wiznerowicz M:
The Cancer Genome Atlas (TCGA): An immeasurable source of
knowledge. Contemp Oncol (Pozn). 19:pp. A68–A77. 2015
|
|
16
|
Ritchie M, Phipson B, Wu D, Hu Y, Law CW,
Shi W and Smyth GK: Limma powers differential expression analyses
for RNA-sequencing and microarray studies. Nucleic Acids Res.
43:pp. e472015, View Article : Google Scholar : PubMed/NCBI
|
|
17
|
Langfelder P and Horvath S: WGCNA: An R
package for weighted correlation network analysis. BMC
Bioinformatics. 9:5592008. View Article : Google Scholar : PubMed/NCBI
|
|
18
|
Huang da W, Sherman B and Lempicki R:
Bioinformatics enrichment tools: Paths toward the comprehensive
functional analysis of large gene lists. Nucleic Acids Res.
37:1–13. 2009. View Article : Google Scholar
|
|
19
|
Huang da W, Sherman B and Lempicki R:
Systematic and integrative analysis of large gene lists using DAVID
bioinformatics resources. Nat Protoc. 4:44–57. 2009. View Article : Google Scholar : PubMed/NCBI
|
|
20
|
Zou K, Tuncali K and Silverman SG:
Correlation and simple linear regression. Radiology. 227:617–622.
2003. View Article : Google Scholar : PubMed/NCBI
|
|
21
|
Wang P, Wang Y, Hang B, Zou X and Mao J: A
novel gene expression-based prognostic scoring system to predict
survival in gastric cancer. Oncotarget. 7:55343–55351.
2016.PubMed/NCBI
|
|
22
|
Tibshirani R: The lasso method for
variable selection in the Cox model. Stat Med. 16:385–395. 1997.
View Article : Google Scholar : PubMed/NCBI
|
|
23
|
Goeman JJ: L1 penalized estimation in the
Cox proportional hazards model. Biom J. 52:70–84. 2010.
|
|
24
|
Shahraki HR, Salehi A and Zare N: Survival
prognostic factors of male breast cancer in southern Iran: A
LASSO-Cox regression approach. Asian Pac J Cancer Prev.
16:6773–6777. 2015. View Article : Google Scholar : PubMed/NCBI
|
|
25
|
Goel MK, Khanna P and Kishore J:
Understanding survival analysis: Kaplan-Meier estimate. Int J
Ayurveda Res. 1:274–278. 2010. View Article : Google Scholar
|
|
26
|
Győrffy B, Bottai G, Fleischer T, Munkácsy
G, Budczies J, Paladini L, Børresen-Dale AL, Kristensen VN and
Santarpia L: Aberrant DNA methylation impacts gene expression and
prognosis in breast cancer subtypes. Int J Cancer. 138:87–97. 2016.
View Article : Google Scholar
|
|
27
|
Fukuda M, Saegusa C and Mikoshiba K: Novel
splicing isoforms of synaptotagmin-like proteins 2 and 3:
Identification of the Slp homology domain. Biochem Biophys Res
Commun. 283:513–519. 2001. View Article : Google Scholar : PubMed/NCBI
|
|
28
|
Fukuda M: Rab27 and its effectors in
secretory granule exocytosis: A novel docking machinery composed of
a Rab27.effector complex. Biochem Soc Trans. 34:691–695. 2006.
View Article : Google Scholar : PubMed/NCBI
|
|
29
|
Yasuda T, Saegusa C, Kamakura S, Sumimoto
H and Fukuda M: Rab27 effector Slp2-a transports the apical
signaling molecule podocalyxin to the apical surface of MDCK II
cells and regulates claudin-2 expression. Mol Biol Cell.
23:3229–3239. 2012. View Article : Google Scholar : PubMed/NCBI
|
|
30
|
Ho JR, Chapeaublanc E, Kirkwood L, Nicolle
R, Benhamou S, Lebret T, Allory Y, Southgate J, Radvanyi F and Goud
B: Deregulation of Rab and Rab effector genes in bladder cancer.
PLoS One. 7:pp. e394692012, View Article : Google Scholar : PubMed/NCBI
|
|
31
|
Sung HY, Han J, Ju W and Ahn JH:
Synaptotagmin-like protein 2 gene promotes the metastatic potential
in ovarian cancer. Oncol Rep. 36:535–541. 2016. View Article : Google Scholar : PubMed/NCBI
|
|
32
|
Rachow S, Zorn-Kruppa M, Ohnemus U,
Kirschner N, Vidal-y-Sy S, von den Driesch P, Börnchen C, Eberle J,
Mildner M, Vettorazzi E, et al: Occludin is involved in adhesion,
apoptosis, differentiation and Ca2+-homeostasis of human
keratinocytes: Implications for tumorigenesis. PLoS One. 8:pp.
e551162013, View Article : Google Scholar : PubMed/NCBI
|
|
33
|
Tobioka H, Isomura H, Kokai Y, Tokunaga Y,
Yamaguchi J and Sawada N: Occludin expression decreases with the
progression of human endometrial carcinoma. Hum Pathol. 35:159–164.
2004. View Article : Google Scholar : PubMed/NCBI
|
|
34
|
Sehrawat A and Singh SV: Benzyl
isothiocyanate inhibits epithelial-mesenchymal transition in
cultured and xenografted human breast cancer cells. Cancer Prev Res
(Phila). 4:pp. 1107–1117. 2011, View Article : Google Scholar
|
|
35
|
Orbán E, Szabó E, Lotz G, Kupcsulik P,
Páska C, Schaff Z and Kiss A: Different expression of occludin and
ZO-1 in primary and metastatic liver tumors. Pathol Oncol Res.
14:299–306. 2008. View Article : Google Scholar : PubMed/NCBI
|
|
36
|
Martin TA, Mansel RE and Jiang WG: Loss of
occludin leads to the progression of human breast cancer. Int J Mol
Med. 26:723–734. 2010. View Article : Google Scholar : PubMed/NCBI
|
|
37
|
Tobioka H, Tokunaga Y, Isomura H, Kokai Y,
Yamaguchi J and Sawada N: Expression of occludin, a
tight-junction-associated protein, in human lung carcinomas.
Virchows Arch. 445:472–476. 2004. View Article : Google Scholar : PubMed/NCBI
|
|
38
|
Osanai M, Murata M, Nishikiori N, Chiba H,
Kojima T and Sawada N: Epigenetic silencing of occludin promotes
tumori-genic and metastatic properties of cancer cells via
modulations of unique sets of apoptosis-associated genes. Cancer
Res. 66:9125–9133. 2006. View Article : Google Scholar : PubMed/NCBI
|
|
39
|
Baumann AM, Bakkers MJ, Buettner FF,
Hartmann M, Grove M, Langereis MA, de Groot RJ and Mühlenhoff M:
9-O-Acetylation of sialic acids is catalysed by CASD1 via a
covalent acetyl-enzyme intermediate. Nat Commun. 6:76732015.
View Article : Google Scholar : PubMed/NCBI
|
|
40
|
Mandal C and Mandal C, Chandra S, Schauer
R and Mandal C: Regulation of O-acetylation of sialic acids by
sialate-O-acetyltransferase and sialate-O-acetylesterase activities
in childhood acute lymphoblastic leukemia. Glycobiology. 22:70–83.
2012. View Article : Google Scholar
|
|
41
|
Zheng Y, Zhou J and Tong Y: Gene
signatures of drug resistance predict patient survival in
colorectal cancer. Pharmacogenomics J. 15:135–143. 2015. View Article : Google Scholar :
|
|
42
|
Zhang C, Han Y, Huang H, Min L, Qu L and
Shou C: Integrated analysis of expression profiling data identifies
three genes in correlation with poor prognosis of triple-negative
breast cancer. Int J Oncol. 44:2025–2033. 2014. View Article : Google Scholar : PubMed/NCBI
|
|
43
|
Qiu JJ, Guo JJ, Lv TJ, Jin HY, Ding JX,
Feng WW, Zhang Y and Hua KQ: Prognostic value of centromere
protein-A expression in patients with epithelial ovarian cancer.
Tumor Biol. 34:2971–2975. 2013. View Article : Google Scholar
|
|
44
|
Sun X, Clermont PL, Jiao W, Helgason CD,
Gout PW, Wang Y and Qu S: Elevated expression of the centromere
protein-A (CENP-A)-encoding gene as a prognostic and predictive
biomarker in human cancers. Int J Cancer. 139:899–907. 2016.
View Article : Google Scholar : PubMed/NCBI
|
|
45
|
Zhuo YJ, Xi M, Wan YP, Hua W, Liu YL, Wan
S, Zhou YL, Luo HW, Wu SL, Zhong WD and Wu CL: Enhanced expression
of centromere protein F predicts clinical progression and prognosis
in patients with prostate cancer. Int J Mol Med. 35:966–972. 2015.
View Article : Google Scholar : PubMed/NCBI
|
|
46
|
Shigeishi H, Higashikawa K, Ono S, Mizuta
K, Ninomiya Y, Yoneda S, Taki M and Kamata N: Increased expression
of CENP-H gene in human oral squamous cell carcinomas harboring
high-proliferative activity. Oncol Rep. 16:1071–1075.
2006.PubMed/NCBI
|
|
47
|
Carroll K, Gomez C and Shapiro L: Tubby
proteins: The plot thickens. Nat Rev Mol Cell Biol. 5:55–63. 2004.
View Article : Google Scholar : PubMed/NCBI
|