Introduction
Tacrolimus (Tac), as an important calcineurin
inhibitor, is a commonly used immunosuppressive agent inhibiting
immunological rejection after organ transplantation (1). However, its clinical recommended
dose is associated with numerous metabolic complications, including
dyslipidemia and post-transplantation diabetes mellitus (PTDM)
(2). These complications are
considered risk factors for cardiovascular diseases and severe
diabetes-associated disorders, and are further associated with
graft dysfunction and decreased quality of life in patients after
organ transplantation (3). The
reported cumulative incidence of these conditions varies, with ≤50%
reported for PTDM, depending on population, diagnostic criteria,
follow-up time and administration type of immunosuppressive agents
(4).
Tac administration in organ transplant recipients is
an independent risk factor for PTDM according to clinical
statistical analysis (5-7). A previous study demonstrated that
Tac inhibits insulin secretion from islet cells and promotes
apoptosis through the calcineurin/nuclear factor of activated
T-cells (NFAT) signaling pathway (8). Other studies have demonstrated that
Tac causes reversible inhibition of insulin expression and islet
cell proliferation to induce hyperglycemia in a rat model (9,10).
However, associated mechanisms of Tac-induced PTDM remain unclear.
Most pancreas or islet cell transplant recipients are prescribed an
immunosuppression regiment with Tac (11). Due to the potential side effects
of Tac on islets, certain contradictions are also observed in
clinical results and basic studies (12). A decreased level of insulin was
not evident in certain early stage patients with PTDM (12). Thus, other underlying mechanisms
may be involved in this process.
The serum adiponectin concentration of pretransplant
patients has been considered as an independent predictive factor
for PTDM developed in clinical kidney transplantation (13). Although Tac and cyclosporine A
(CSA) are similar in terms of their mechanisms of action, the level
of post-transplant serum adiponectin in patients administrated with
Tac is lower than in patients treated with CSA (14). Adiponectin as a major
adipocyte-secreted protein has been studied in human and animal
models for its improved insulin-sensitizing effects (15). The peroxisome
proliferator-activated receptor (PPAR)-γ agonist rosiglitazone has
been deemed as an effective and safe treatment for patients with
PTDM (16). However, to the best
of our knowledge there is no evidence that the occurrence of PTDM
is associated with PPAR-γ downregulation or insulin resistance.
Therefore, the current study hypothesized that Tac may modify the
expression of adipocytokines and molecules in the PPAR-γ signaling
pathway, which causes insulin resistance and ultimately results in
PTDM.
To verify this, a Tac-induced hyperglycemia rat
model was assessed by fasting blood glucose (FBG) measurement and
intraperitoneal glucose tolerance tests (IPGTTs). Expression levels
of genes associated with insulin resistance, such as
adipocytokines, insulin receptor (IR) substrate (S)-1/IRS-2,
glucose transporter type-4 (GLUT4) and PPAR-γ were measured and an
intervention with the PPAR-γ agonist rosiglitazone (Rosi) was
initiated to investigate the role of PPAR-γ/Akt in the pathogenesis
of PTDM. Expression levels were assessed in adipose, muscular and
liver tissues. In this study, it was found Tac induced insulin
resistance was closely associated with the inhibition of PPAR-γ and
altered adipocytokine expression involved in the occurrence and
development of PTDM. The findings of the current study may provide
a promising therapeutic target for treating PTDM in the future.
Materials and methods
Materials
Tac was purchased from Astellas Pharma, Inc. (cat.
no. J20090142), chloral hydrate was purchased from Beijing
Biosynthesis Biotechnology Co., Ltd. and the blood glucose meter
and blood glucose test strips were from SanNuo Bio-sensing. The
reverse transcription kit (cat. no. SCQ-401) and the SYBR-Green
fluorescence quantization kit (SYBR-Green Realtime PCR Master mix;
cat. no. QPK-201) were purchased from Toyobo Life Science, the qPCR
primers were from Shanghai Haohai Biological Technology Co. Ltd.;
primary antibodies for GAPDH (cat. no. ab181602), GLUT4 (cat. no.
ab33780), PPAR-γ (cat. no. ab209350), Akt (cat. no. ab179463) and
anti-phosphorylated Akt (cat. no. ab81283) antibodies were from
Abcam.
Preliminary study
Preliminary experiments were performed to establish
the dose of Tac required to induce hyperglycemia in rats. All
animals were housed at 22°C with 12 h light/dark cycles, 40-70%
relative humidity and gradient pressure difference 19.8-31.6 Pa.
The airflow was ≤0.18 m/sec and ammonia was ≤15 mg/m3.
Animals were provided with food and water ad libitum. All
experimental protocols were approved by the Management Committee
for Medical Laboratory Animal Sciences at Wenzhou Medical
University (approval no. wydw2014-0066). A total of 18 male
Sprague-Dawley rats (8 weeks; 200-220 g) were obtained from Charles
River Laboratories, Inc. and treated with Tac intraperitoneally at
0.1, 1 or 10 mg/kg/day (n=6/group) for 7 days and FBG levels were
measured daily. To determine the optimal dose of Rosi for
preventing Tac-induced (1 mg/kg/day) hyperglycemia, in a
preliminary study rats were treated with varying doses of Rosi (2,
4, 8, 10 mg/kg/day; n=6/group; Sigma Aldrich; Merck KGaA) for 15
days. After the study, all animals were sacrificed by cervical
dislocation and death was verified by assessing corneal and pain
reflex, as well as respiration.
Animal model
A total of 18 male Sprague-Dawley rats (age, 8
weeks; weight, 150-200 g) were obtained from Charles River
Laboratories, Inc. and as indicated and provided with food and
water ad libitum. Rats were divides into three groups: i)
Control group, rats were injected with saline once a day; ii) Tac
group, rats were treated with Tac in saline at 1 mg/kg/day; and
iii) Tac+Rosi group, rats were treated with Tac at 1 mg/kg/day and
Rosi at 4 mg/kg/day. FBG levels were measured every other day using
tail blood (~10-20 µl) for 15 days. The bodyweight of rats
were measured daily during the experimental process. Animals were
anaesthetized with 10% chloral hydrate (350 mg/kg of body weight),
anesthesia was verified by corneal and pain reflex, as well as
respiration. Visceral adipose tissue, skeletal muscle and liver
tissue were collected. A final blood collection was performed via
vena cava puncture (5-10 ml). Following sampling, the anaesthetized
rats were sacrificed using CO2 for >15 min, with a
flow of 20% volume/min, followed by cervical dislocation.
IPGTT
After treatment for 14 days, an IPGTT was performed
after 8 h fasting: Glucose (2 g/kg body weight) was administered
via intraperitoneal injection using 40% (w/v) glucose. Blood
glucose levels were measured at various time points (0, 30, 60, 90
and 120 min after injection). The homeostasis model of assessment
(HOMA-IR) was used for evaluating insulin resistance index using
the following formula: FBG (mmol/l) x fasting insulin concentration
(mIU/l)/22.5 (17).
Radioimmunoassay
Insulin, adiponectin, leptin, resistin, visfatin,
RBP4, C reactive protein (CRP) and apelin concentrations in blood
samples were measured by using the radioimmunoassay as described
previously (18).
Immunohistochemistry
Immunohistochemical staining was performed using the
streptavidin biotin peroxidase method (19). Tissues were dehydrated using
gradient ethanol (75, 85, 95 and 100%) and xylene at room
temperature, and embedded in paraffin at 55°C. Then,
paraffin-embedded adipose tissues were cut into 4-µm
sections. After deparaffinization with xylene (30 min) and gradient
ethyl alcohol (100, 95, 85 and 75%; 5 min each) at room
temperature, slides were boiled in the citrate buffer (pH 6.0) for
10 min. The activity of endogenous peroxidases was blocked by
incubation with 3% H2O2 in methanol for 10
min at room temperature. Then, sections were washed in 0.1 M PBS
and blocked with 5% goat serum (Beyotime Institute of
Biotechnology) in PBS for 60 min at 37°C. Primary antibodies
(rabbit anti-PPAR-γ and GLUT4) were applied and incubated overnight
at 4°C. Control sections were incubated with normal rabbit IgG
serum (cat. no. C0265; Beyotime Institute of Biotechnology). After
the incubation, slides were washed with PBS after warming for 30
min at 37°C and incubated with HRP-conjugated goat anti-rabbit
secondary antibody (1:1,000; cat. no. A0208; Beyotime Institute of
Biotechnology) for 30 min at 37°C. Diaminobenzidine reagent (1:50;
OriGene Technologies, Inc.) was applied at room temperature for 1
min and hematoxylin solution was used to stain nucleus for 5 min at
room temperature. Finally, sections were dehydrated and covered
with resinous mounting agent (neutral resin; Beyotime Institute of
Biotechnology) at room temperature and immediately analyzed. For
each section, >6 fields were evaluated by light microscopy and
all measurements were performed on blinded slides (magnification,
x400). The intensity of positive staining was measured using the
IOD/area (Image-Pro Plus 6.0; Media Cybernetics, Inc.).
Western blot
Total protein was extracted from he tissues using
RIPA lysis buffer and the concentration was determined by BCA
protein assay (Beyotime Institute of Biotechnology). A total of 50
µg protein was separated using 10% SDS-PAGE gels and
transferred to polyvinylidene fluoride membranes. Membranes were
blocked with 5% nonfat milk in TBS for 2 h at room temperature and
incubated overnight at 4°C with primary antibodies (anti-PPAR-γ,
anti-p-Akt, anti-Akt, anti-GLUT4 and anti-GAPDH) at 1:1,000
dilution. Membranes were washed with TBST and incubated with
HRP-conjugated IgG goat anti-rabbit secondary antibody (cat. no.
ab7090; Abcam) at 1:5,000 dilution for 2 h at room temperature. The
immune complex was visualized using an ECL Western Blotting
Detection system (Amersham; GE Healthcare) and intensities were
quantified using Quantity One software (V4.6.6; Bio-Rad
Laboratories, Inc.).
RT-qPCR
Total RNA was extracted from adipose, muscle and
liver tissues using TRIzol® reagent. cDNA was prepared
using the PrimeScript TMRT Master mix (Takara Bio, Inc.). qPCR was
performed in three reduplicative samples using SYBR-Green reagent
(Takara Bio, Inc.). The primer sequences were as follows: PPAR-γ,
forward, 5′-GGA CCT CTC TGT GAT GGA TGA -3′ and reverse, 5′-GCT CTT
GTG AAC GGG A TG T-3′, fragment length, 114 bp; adiponectin,
forward, 5′-CCT CCA CCC AAG GAA ACT T-3′ and reverse, 5′-ACC AAG
AAC ACC TGC GTC TC-3′, fragment length, 13 bp; leptin, forward,
5′-CCT GTG GCT TTG GTC CTA TC-3′ and reverse, 5′-ATA CCG ACT GCG
TGT GTG AA-3′, fragment length, 128 bp; resistin, forward, 5′-GCC
AGT GCG GAA GCA TAG ACT-3′ and reverse, 5′-GTA TTT CCA GAC CCT CAT
CTC GTT T-3′, fragment length, 189 bp; visfatin, forward, 5′-AGC
GGC AGA GCA CAG TAA CCT AT-3′ and reverse, 5′-CCA CAG ACA CAG GCA
CTG ATG A-3′, fragment length, 186 bp; retinal binding protein 4
(RBP4), forward, 5′-TGG TAT GCC ATC GCC AAA-3′ and reverse, 5′-TCC
CAG TTG CTC AGA AGA CG-3′, fragment length, 134 bp; GLUT4, forward,
5′-CCT GCT TGG CTT CTT CAT CT-3′ and reverse, 5′-GGG TTT CAC CTC
CTG CTC TA-3′, fragment length, 121 bp; IR, forward, 5′-GCT CCT ATG
CTC TGG TGT CA-3′ and reverse, 5′-TCG TGA GGT TGTGCT TGT TC-3′,
fragment length, 147 bp; IRS-1 for adipocyte and muscle, forward,
5′-CAG GCA CCA TCT CAA CAA TC-3′ and reverse, 5′-GTT TCC CAC CCA
CCA TAC TG-3′, fragment length, 107 bp; IRS-2 for liver, forward,
5′-GTT TCC CAC CCA CCA TAC TG-3′ and reverse, 5′-TAC TTG CGG TGG
TGG A GA C-3′, fragment length, 150 bp; IL-6, forward, 5′-TCC TTA
GCC ACT CCT TCT GT-3′ and reverse, 5′-CTC ATT CTG TCT CGA GCC CAC
CA-3′; TNF-α, forward, 5′-CAT GGA TCT CAA AGA CAA CCA A-3′ and
reverse, 5′-CTC CTG GTA TGA AAT GGC AAA T-3′. The reaction
conditions were as follows: 95°C for 3 min, followed by 40 cycles
of 95°C for 5 sec and 62°C for 35 sec. The data was analyzed using
the 2−ΔΔCq method (20).
Statistical analysis
Data are presented as the mean ± standard deviation.
Unpaired Student's t-test was used to compare the differences
between two groups. Multiple comparisons were performed using a
one-way ANOVA with Bonferroni correction. P<0.05 was considered
to indicate a statistically significant difference. All analyses
were performed using SPSS (20.0; IBM Corp.).
Results
Preliminary study
Preliminary experiments were performed to establish
the dose of Tac required to induce hyperglycemia in rats. After
intraperitoneal administration with Tac at 0.1, 1 and 10 mg/kg/day
for 7 days, it was found that Tac at 1 mg/kg/day achieved the best
results. To determine the optimal dose of Rosi for preventing
Tac-induced hyperglycemia, varying doses of Rosi (2, 4, 8 and 10
mg/kg/day) were trialed in this study. It was determined that 4
mg/kg Rosi combined with ad libitum fed did not result in
hypoglycemia. This dose (4 mg/kg) was further effective in
improving insulin resistance in the rats treated with Tac.
Measurements of body weight, FBG and
insulin tolerance
Rats were treated with Tac by intraperitoneal
injection for 14 days (1 mg/kg/day) in the presence or absence of
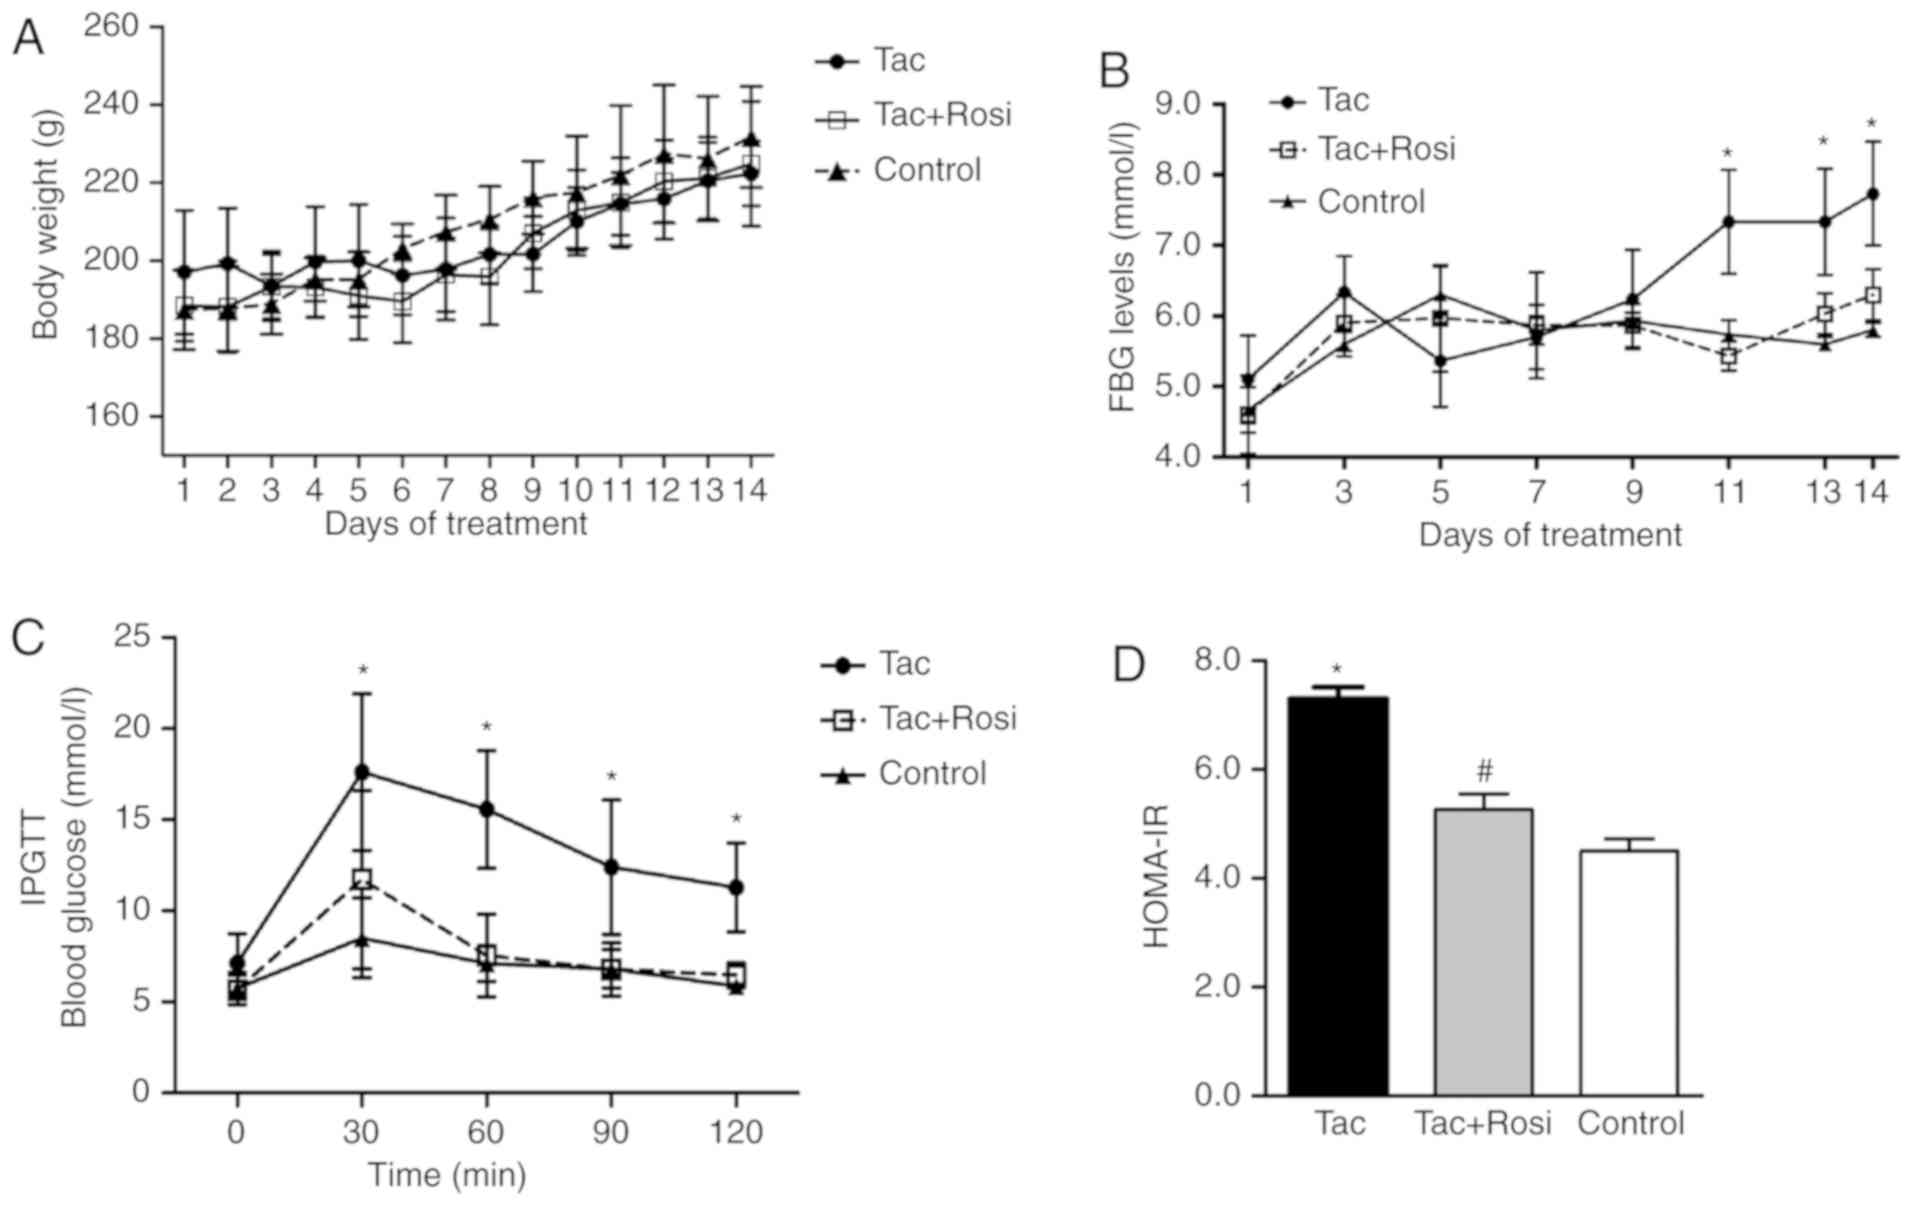
Rosi (4 mg/kg/day). As shown in Fig.
1A, the body weight of the rats increased in all groups over
the duration of the study and no significant differences were
observed. Additionally, over the first 10 days, no significant
differences in FBG levels were determined for rats of the different
groups (Fig. 1B). After 10 days,
rats treated with Tac presented hyperglycemia (FBG, >6.9 mmol/l)
for the last 5 days of this study, while rats in the Tac+Rosi and
the control group stayed within the normal range. After treatment
for 14 days, the blood glucose concentration was significantly
increased in the Tac group (7.73±0.73 mmol/l) when compared with
the control (5.8±0.10 mmol/l; P<0.01) and the Tac+Rosi group
(6.30±0.36 mmol/l; P<0.05). The blood glucose levels in the
control and the Tac+Rosi group were not significantly
different.
Rats were subjected to an IPGTT after fasting for 8
h at day 14 and the blood glucose concentration was measured using
tail vein blood in 30 min intervals over 120 min. As shown in
Fig. 1C, blood glucose levels in
the Tac group were significantly higher than in the Tac+Rosi and
control group for the duration of the experiment. No significant
differences were observed between the Tac+Rosi and the control
group (P>0.05). The HOMA-IR was measured using the
aforementioned formula. The result showed that a significant
insulin resistance was established in rats of the Tac group
compared with the control (P<0.01) and the Tac+Rosi group
(P<0.05; Fig. 1D).
Insulin and adipocytokines levels in
plasma
Blood samples were obtained to measure plasma
insulin and adipocytokine levels using radioimmunoassays (Table I). The concentration of insulin,
adiponectin, leptin, resistin, visfatin, RBP4, CRP and apelin were
measured. Compared with the Tac group, there were no significant
differences in the plasma concentration of insulin and
adipocytokine in the Tac+Rosi group, except for apelin which was
significantly increased in the Tac+Rosi group (P<0.05). No
significant differences in insulin, adiponectin, leptin, resistin,
visfatin, RBP4, CRP and apelin levels were observed between the Tac
and the control group. However, apelin was significantly increased
in the Tac+Rosi group when compared with the control group
(P<0.05).
 | Table IPlasma concentrations of insulin and
adipocytokines in rats treated with saline, Tac or Tac+Rosi for 2
weeks. |
Table I
Plasma concentrations of insulin and
adipocytokines in rats treated with saline, Tac or Tac+Rosi for 2
weeks.
| Insulin and
adipocytokines | Tac | Tac+Rosi | Control |
|---|
| Insulin
(µIU/ml) | 20.72±5.85 | 25.02±6.55 | 24.19±4.27 |
| Adiponectin
(ng/ml) | 13.13±2.32 | 14.82±1.70 | 14.07±1.58 |
| Leptin (ng/ml) | 7.82±1.57 | 8.35±1.10 | 8.25±1.29 |
| Resistin
(ng/ml) | 19.92±1.30 | 19.73±4.12 | 19.46±2.78 |
| Visfatin
(ng/ml) | 56.10±6.64 | 54.72±13.72 | 56.91±16.52 |
| RBP4 (ng/ml) | 40.35±6.24 | 41.06±6.20 | 39.24±4.80 |
| CRP (ng/ml) | 0.95±0.02 | 0.97±0.02 | 0.96±0.02 |
| Apelin (ng/ml) | 50.48±5.26 |
55.70±5.84a | 45.53±5.79 |
Expression of adipocytokine associated
genes
Expression levels of adipocytokine-associated genes
were measured by RT-qPCR in adipocytes. As shown in Fig. 2, compared with the control, mRNA
levels of adiponectin and leptin were significantly decreased after
treatment with Tac, and resistin, visfatin, IL-6, TNF-α and RBP4
were significantly increased in the Tac group. In the Tac+Rosi
group, mRNA levels of adiponectin and leptin were increased, and
resistin and visfatin were decreased compared with the Tac group.
Furthermore, in the Tac+Rosi group expression of visfatin
(P<0.05), IL-6 (P<0.01), TNF-α (P<0.01) and RBP4
(P<0.05) were significantly increased compared with the control
group. Immunohistochemical staining with PPAR-γ and GLUT4 of the
adipose tissue suggested decreased expression of PPAR-γ and GLUT4
in the Tac compared with the other two groups.
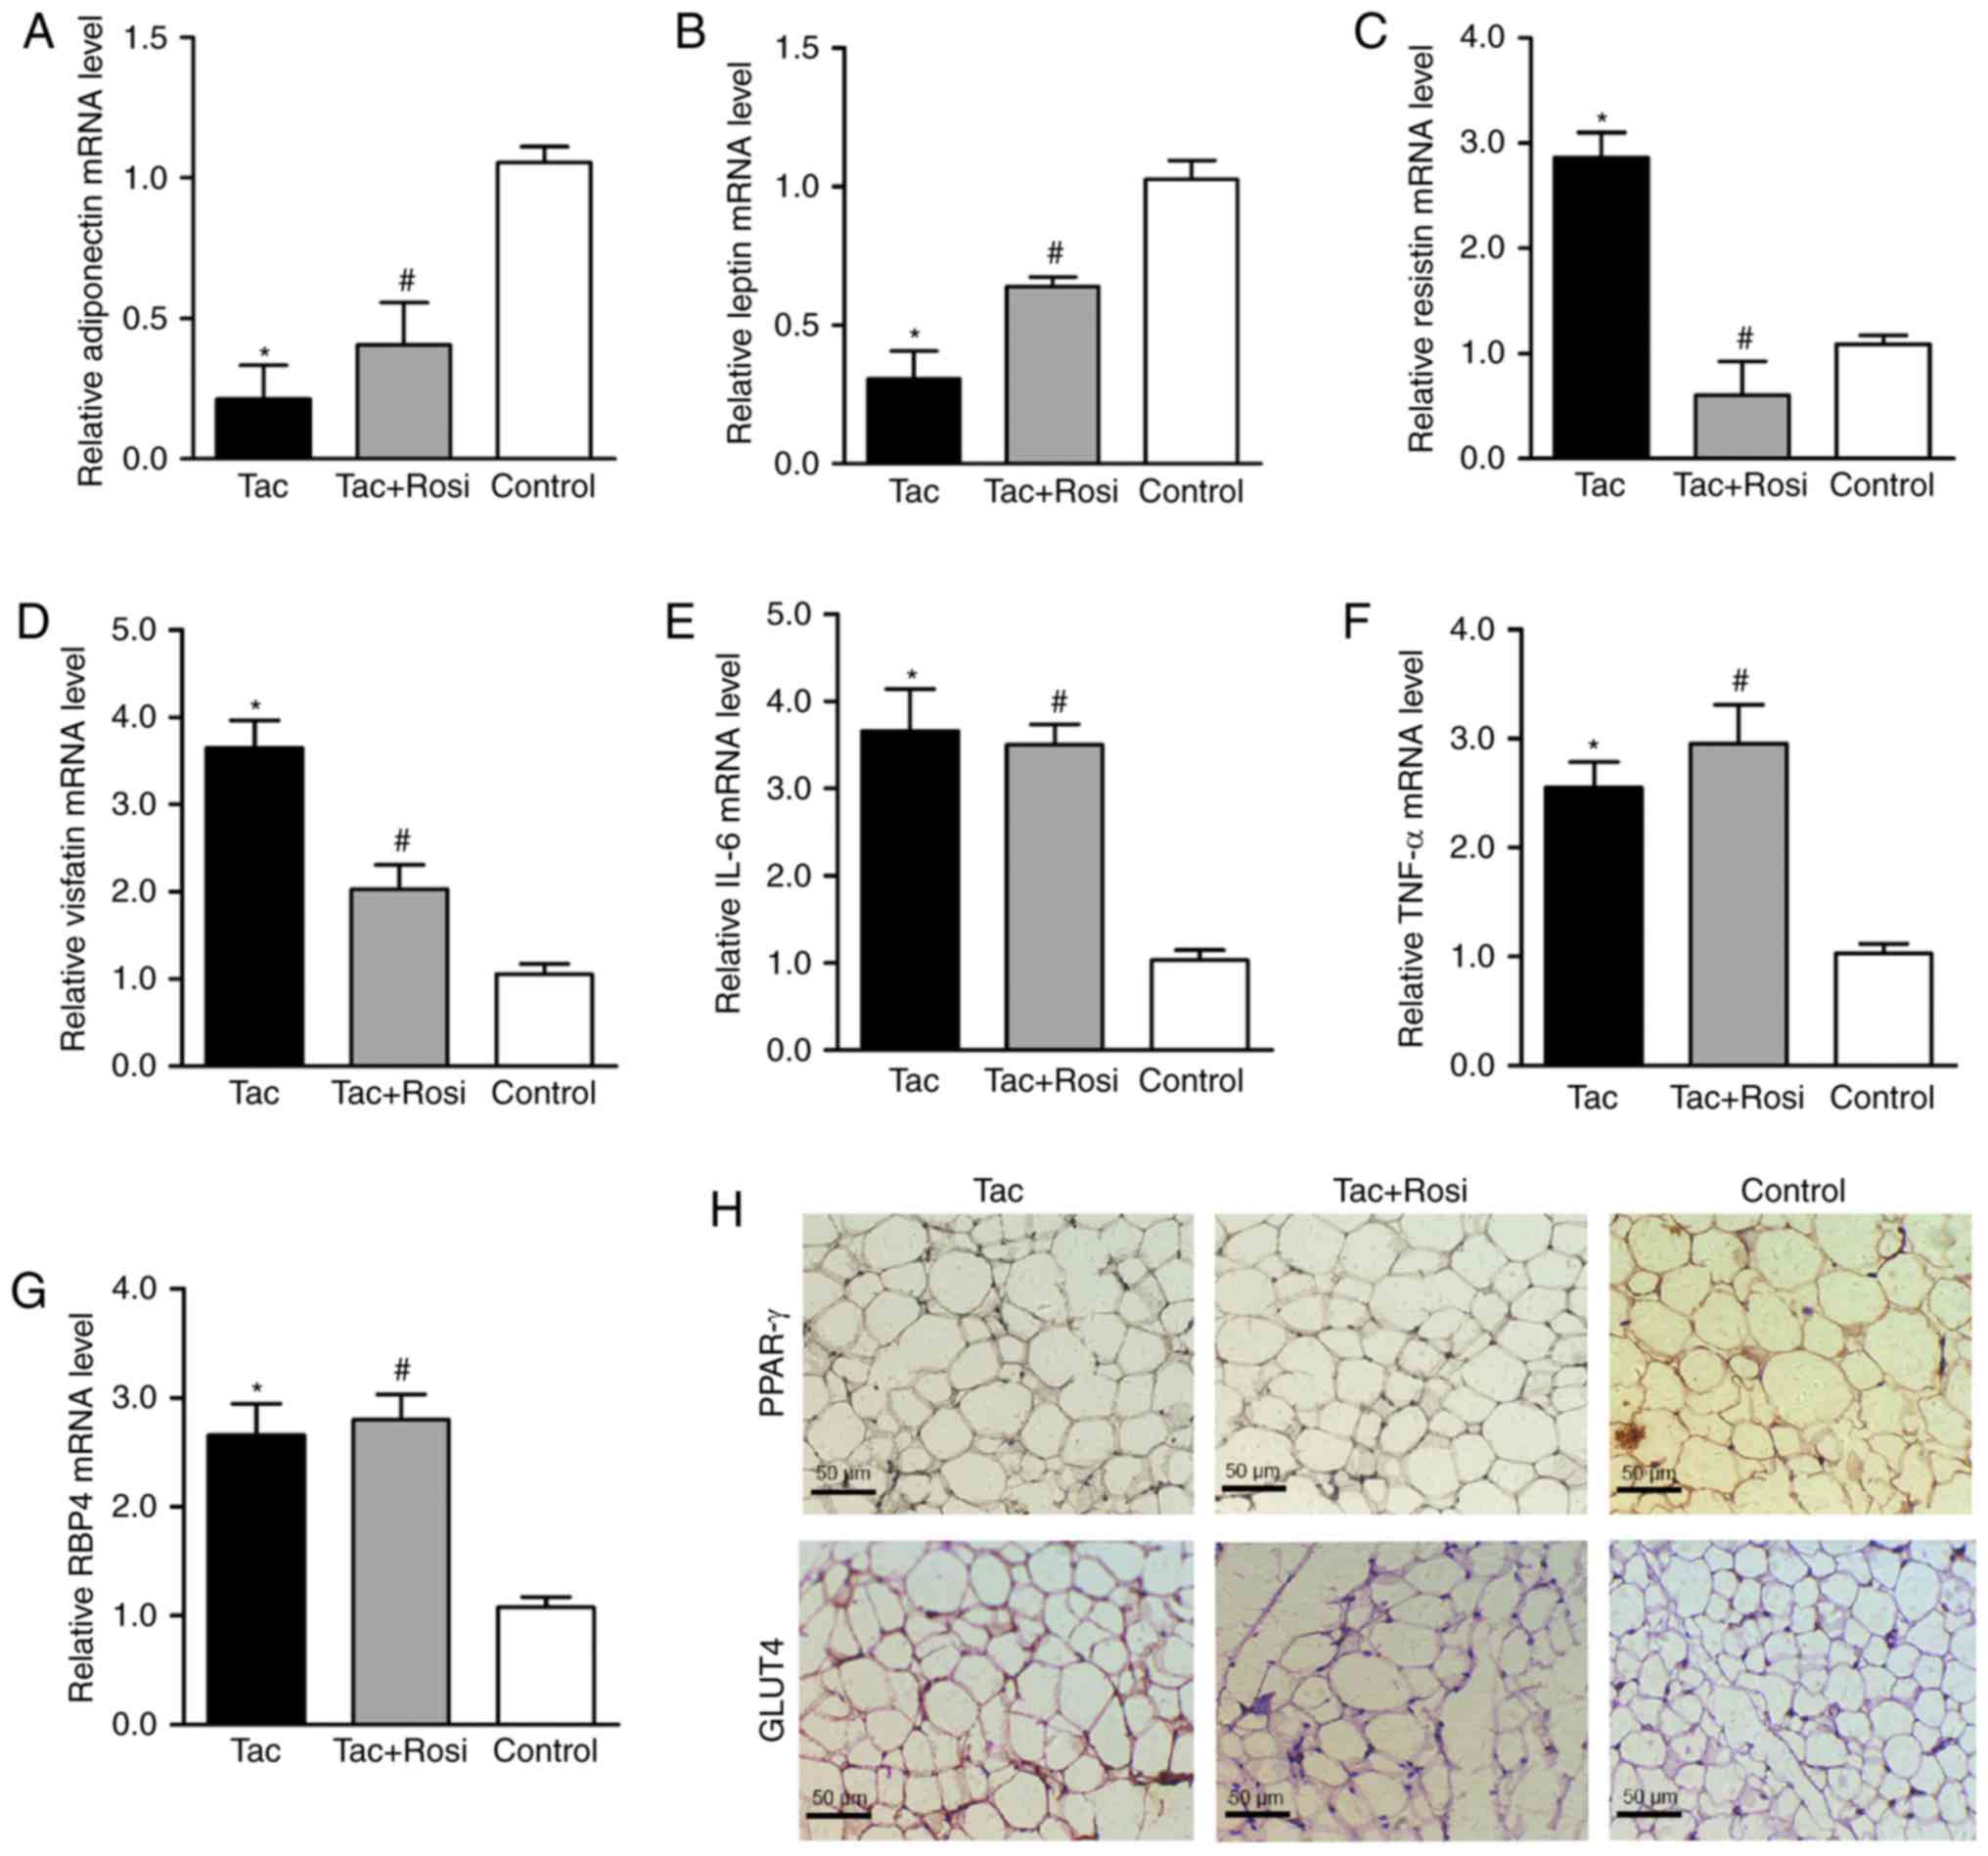 | Figure 2Effects of Tac and Tac+Rosi on the
expression of adipocytokines in rat adipocytes. Rats were treated
with Tac or Tac+Rosi for 2 weeks; saline-treated rats were used as
controls. Relative mRNA expression of (A) adiponectin, (B) leptin,
(C) resistin, (D) visfatin, (E) IL-6, (F) TNF-α and (G) RBP4
determined by RT-qPCR. (H) Immunohistochemical staining for PPAR-γ
and GLUT4 in adipocyte tissue (magnification, x400; scale bar, 50
µm). Data are presented as the mean ± standard deviation.
*P<0.05 vs. control; #P<0.05 vs. Tac.
PPAR-γ, peroxisome proliferator-activated receptor; Tac,
tacrolimus; Rosi, rosiglitazone; GLUT4, glucose transporter type-4;
RBP4, retinol binding protein 4. |
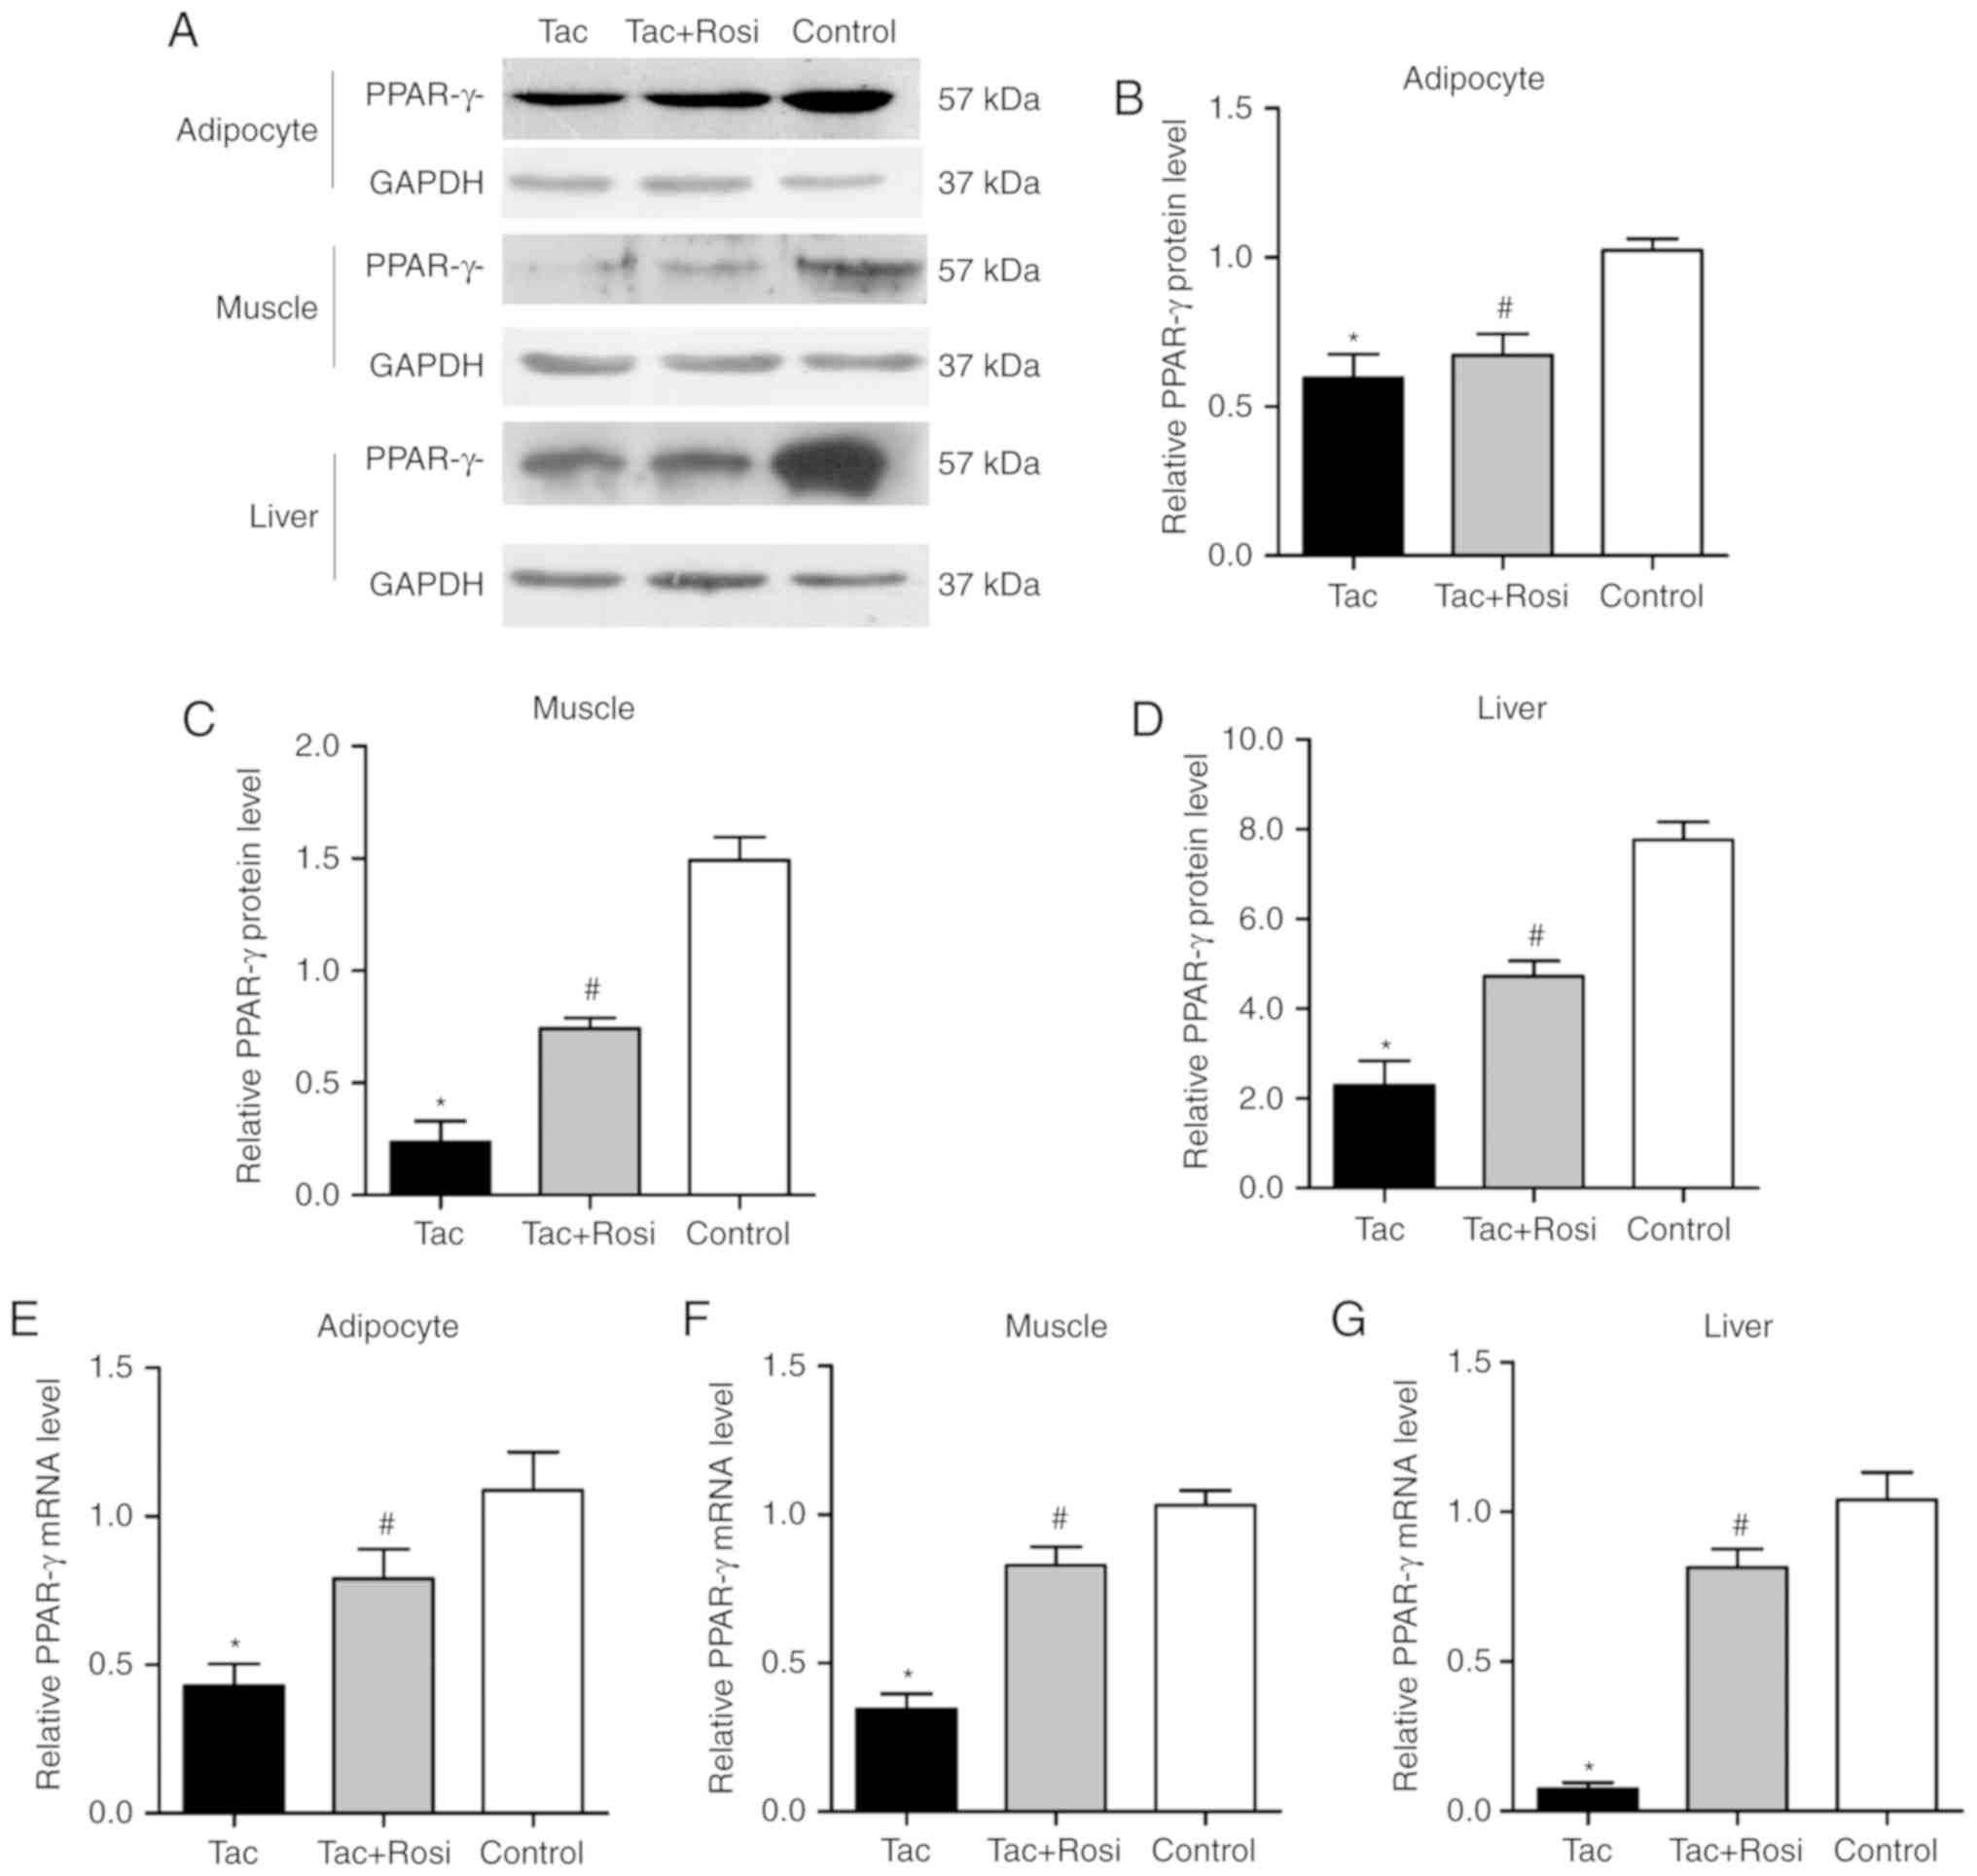
Expression of PPAR-γ in adipocyte, muscle
and liver tissues
PPAR-γ is an important factor in the process of
insulin resistance (21). In
addition to adipose tissue, it has been found in skeletal muscle
and liver tissues of humans and rodents (21,22). In the current study, expression of
PPAR-γ was measured by RT-qPCR and western blotting. As shown in
Fig. 3, protein and gene
expression of PPAR-γ were significantly decreased in the three
different tissues from the Tac group compared with the control
group. Compared with the control group, PPAR-γ mRNA was decreased
by 60, 66 and 95% in the adipose, muscle and liver tissues of the
Tac group, respectively. In the same groups, protein levels were
decreased by 42, 87 and 70% in the adipose, muscle and liver
tissues, respectively. After administration of Rosi, the PPAR-γ
mRNA level was significantly increased compared with the Tac
group.
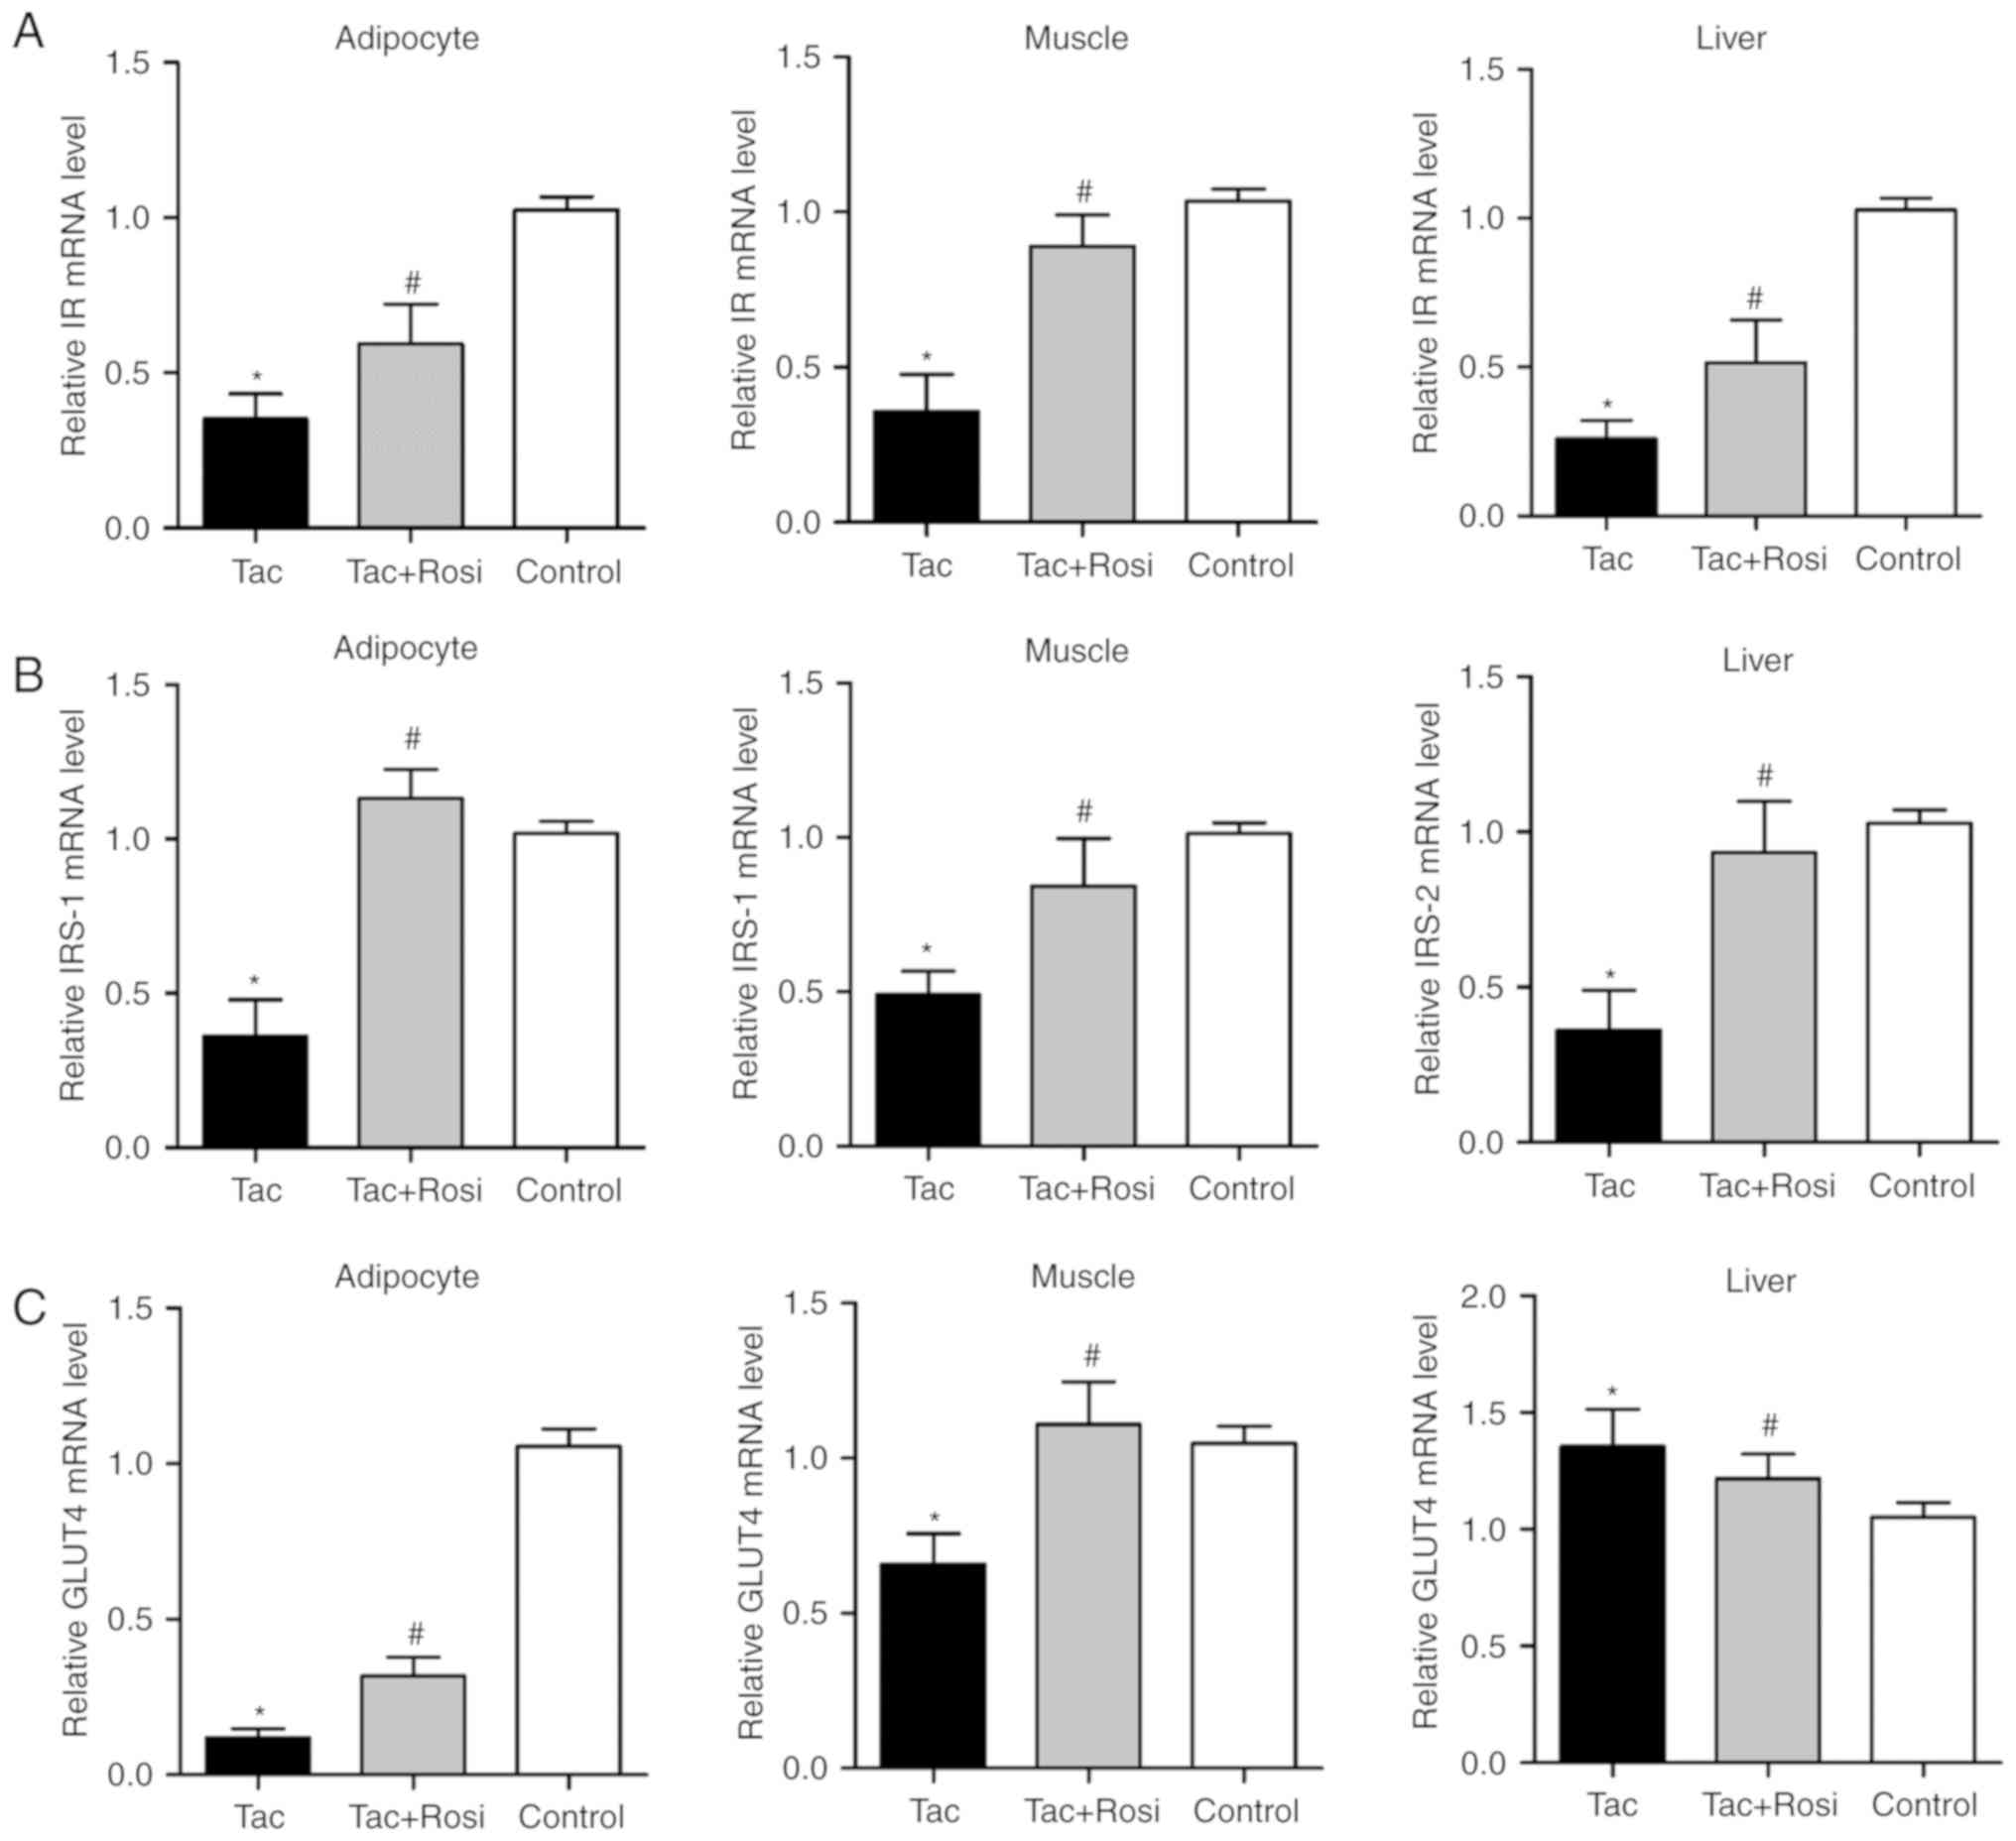
Role of PPAR-γ in the insulin signaling
pathway
To investigate the effect of PPAR-γ on the insulin
pathway, expression of IR, IRS-1/2, activation of Akt and
expression of its downstream substrate GLUT4 were detected. Akt is
an important factor in the insulin signaling pathway and its
phosphorylation had been considered to be associated with the
biological function of insulin (23). As shown in Fig. 4, mRNA levels of IR and IRS-1/2
were significantly decreased in all tissues after Tac treatment
compared with the control. However, GLUT4 levels were significantly
decreased compared with the control in the adipocyte and muscle
tissues and significantly increased in the liver samples.
Furthermore, GLUT4 expression in adipocytes (P<0.05) and muscle
(P<0.05) was significantly increased in the Tac+Rosi group
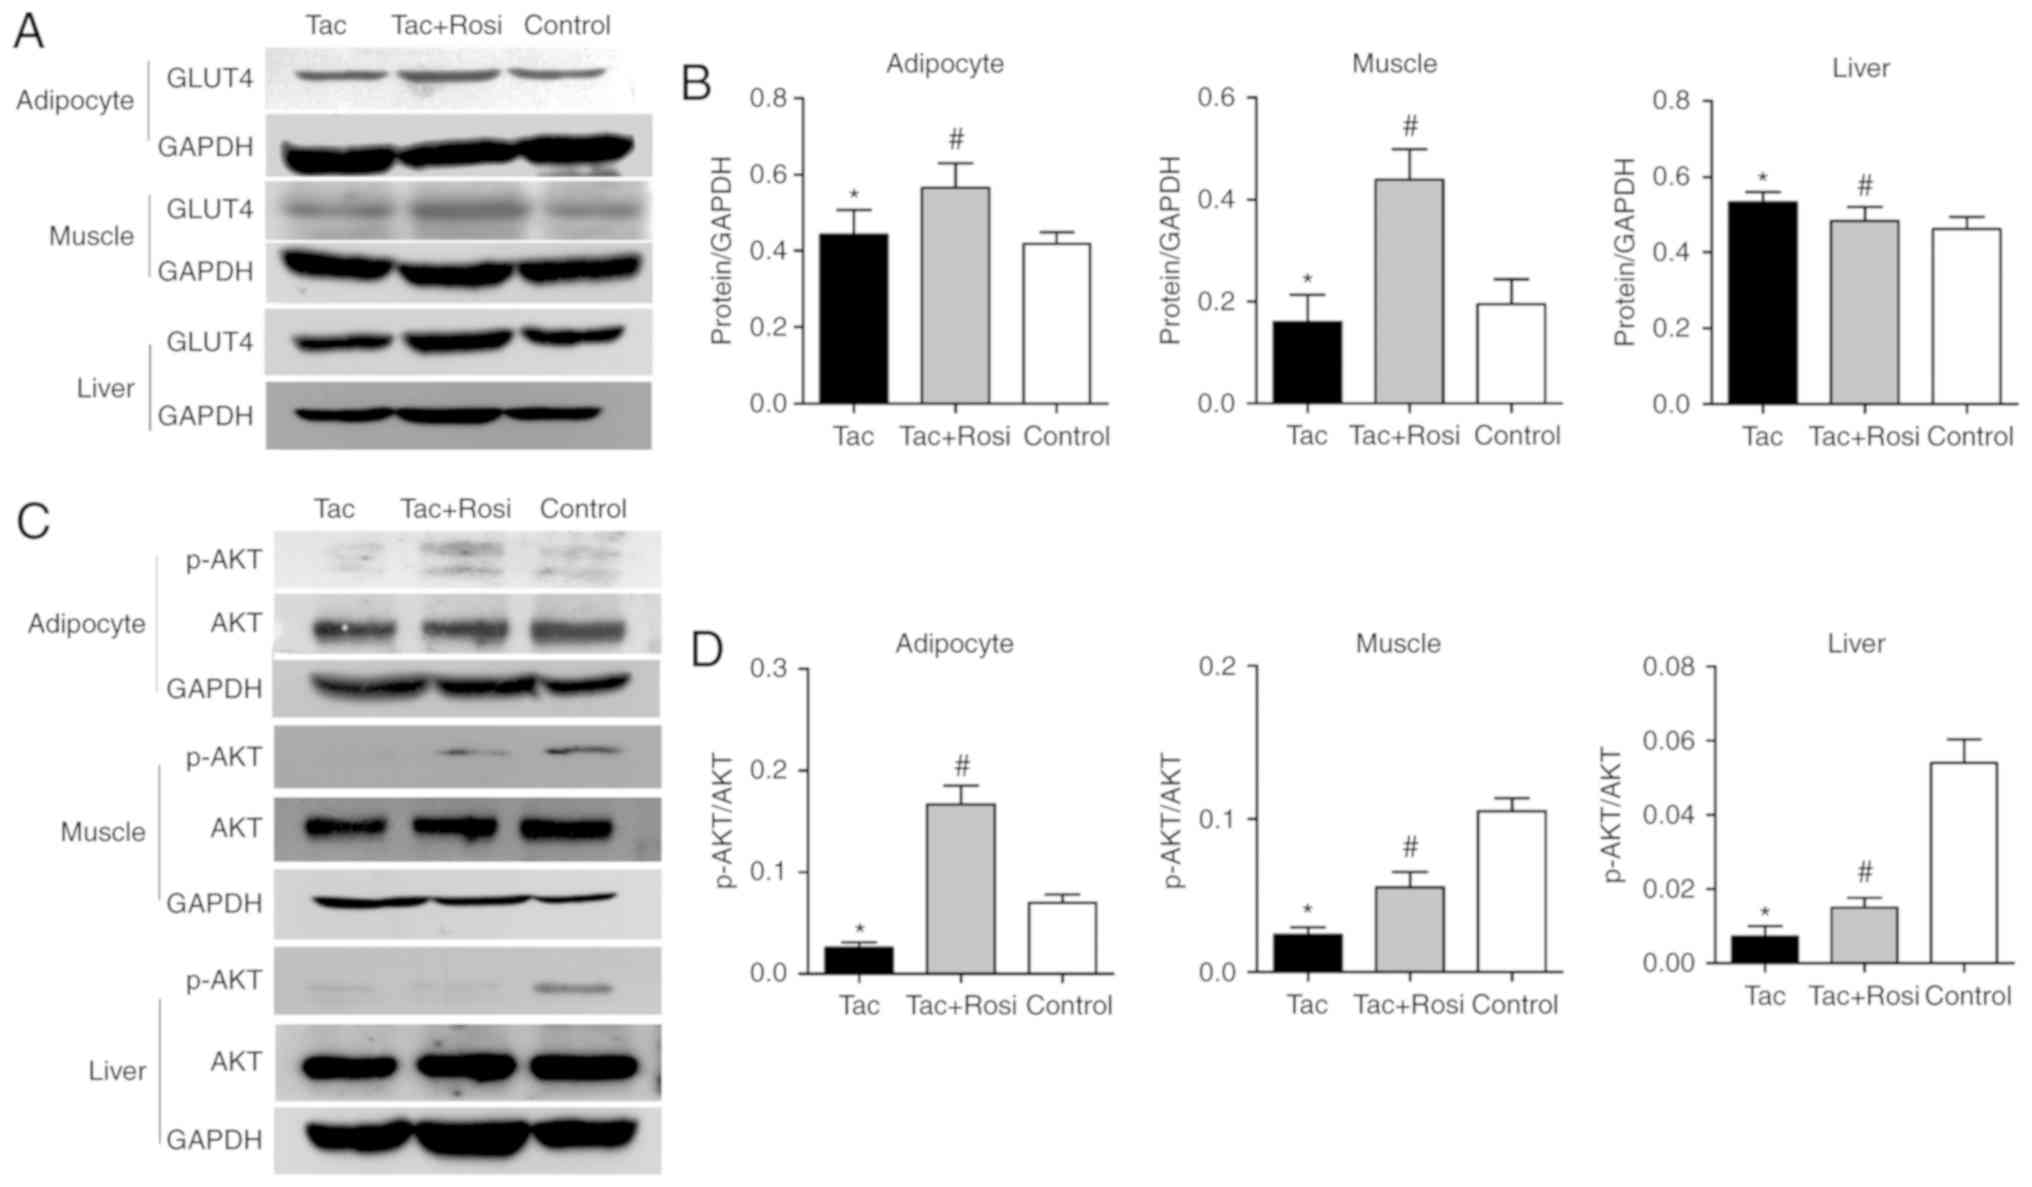
compared with the Tac group. RT-qPCR results were consistent with
the western blotting analysis (Fig.
5).
Akt activation was evaluated in this study (Fig. 5C and D). Compared with the control
group, the level of phosphorylation was significantly decreased by
61, 73 and 86% in the adipose, muscle or liver tissues of the Tac
group, respectively. Phosphorylation was significantly increased in
all tissues after Rosi treatment compared with the Tac group.
Interestingly, the increase in phosphorylation differed between
tissues and in the adipocyte tissue a higher value was observed in
the Tac+Rosi group compared with the control.
Discussion
Tac is one of the most frequently used
immunosuppressants in the treatment of transplantation recipients
(24). PTDM is considered an
important side effect of Tac treatment (25). There are several studies where
animal models have shown that different doses of Tac cause PTDM
after organ or cell transplantation (26,27); however, most recent studies
focused on islet cell injury (8,28).
Peripheral tissue is a vital location of the glucose metabolism
(29). Altered expression of
glucose metabolism associated genes in the insulin signaling
pathway may be associated with Tac induced PTDM. Therefore, in the
present study, an in vivo model was used to mimic
immunosuppressant therapy following organ transplantation. A
diabetic state was found after prolonged treatment of the rats with
Tac and hyperglycemia occurred after 10 days of Tac administration.
However, rats treated with Tac+Rosi stayed euglycemic.
Clinical studies have reported that insulin
resistance and β-cell dysfunction serve significant roles during
the process and pathogenesis of PTDM (30). The present study showed that
glucose tolerance in rats treated with Tac was impaired and the
HOMA-IR was increased compared with the control rats. This
demonstrated that insulin resistance may occur earlier than insulin
deficiency. PPAR-γ plays a significant role in type 2 diabetes
mellitus by regulating the secretion of adipocytokines through
PPAR-γ-mediated signaling pathways (31,32). Adipocytokines increase the
sensitivity to glucose and reduce insulin resistance, which reverse
glucose intolerance as reported in previous clinical studies
(33,34). Some studies found that Rosi
treatment is a safe option for patients with PTDM after kidney
transplantations (35). In this
study, it was found that Rosi increased expression of proteins of
the insulin signaling pathway and reduced insulin resistance. These
observations were consistent with the altered expression of PPAR-γ
reported previously (36). The
results of the current study demonstrated that the effect of Rosi
was PPAR-γ-dependent and suggested that the PPAR-γ agonist
ameliorated the inhibition of Tac to PPAR-γ. PPAR-γ and Tac may be
promising therapeutic targets for PTDM in the future.
Further experiments were performed to determine
PPAR-γ expression and the secretion levels of adipocytokines,
including adiponectin, IL-6, TNF-α, leptin, resistin, visfatin and
RBP4 in adipocyte. IL-6 and TNF-α are considered closely associated
with adiposity and insulin resistance and are highly expressed in
adipose tissues (37,38). In the present study, except for
impaired glucose tolerance, it was observed that expression of
adiponectin and leptin were significantly reduced in the Tac group
accompanied by increased expression of resistin, visfatin and RBP4
compared with the control Plasma concentrations of insulin and
adipocytokines were also measured. The level of insulin was
increased in the Tac+Rosi group compared with the Tac group, which
may be caused by a stress response. It is well known that PPAR-γ
agonists like Rosi promote the secretion of adiponectin and leptin
by stimulating the expression of PPAR-γ in the patients with
diabetes mellitus (39). It was
concluded that PPAR-γ and adipocytokines may serve an important
role in the induction of diabetes after treatment with Tac.
Insulin resistance describes the need for increased
insulin to achieve biological effects (40). The insulin signaling pathway is
composed of various molecules and proteins which initiate IR
tyrosine kinase activation and substrate phosphorylation (41). However, it is not known whether
this pathway is affected by the altered expression of proteins and
molecules, and the activation of enzymes and transcription factors
in peripheral tissue induced by Tac. IRS-1 is primarily observed in
adipocyte and muscle tissues and plays a critical role in process
of glucose metabolism (42,43). IRS-2 is primarily observed in the
liver and participates in the process of maintaining glucokinase
activity (44). In this study,
mRNA expression of IR, IRS-1/2 and GLUT4 were inhibited by Tac in
various peripheral tissues and the phosphorylation of Akt was
altered compared with the control. Rosi treatment further affected
the expression levels of these factors.
The effect of Tac in blocking immunoreaction is via
inhibition of calcineurin through the calcineurin/NFAT signaling
pathway. It was hypothesized that there may be an interaction
between calcineurin/NFAT and PPAR-γ in adipocytes, hepatocytes and
myocytes (45). Consistent with
this, the calcineurin inhibitor Tac was applied and PPAR-γ
expression was evaluated. It suggested that there may be an
association between calcineurin/NFAT and PPAR-γ in different
peripheral tissues. Tac has been reported to inhibit calcineurin
activity and downregulate the nuclear localization potentially
affected by PPAR-γ gene activation and decreased expression levels
of PPAR-γ and adiponectin (46).
Adiponectin is one of the most important adipocytokines to control
the glucose metabolism and insulin sensitivity, exerting
insulin-sensitizing effects through binding to specific receptors,
leading to AMPK and PPAR-α activation (47). It suppresses gluconeogenic gene
expression and its dysfunction has been implicated in insulin
resistance, diabetes and cardiovascular diseases.
It was found that the degree of decreased expression
of PPAR-γ varied among the three different tissues. Thus, a future
study may be designed using different types of cells, such as
adipocytes, muscle and liver cells. The preliminary results
obtained in this study provided a base for follow-up experiments
and the knockdown or inhibition of the PPAR-γ signaling pathway may
be studied to investigate whether the degree of insulin resistance
is associated with varied expression of PPAR-γ in multiple cell
lines. There were various limitations associated with the current
study. Since the occurrence of PTDM has been closely associated
with many factors in clinical and experimental studies (48), the aim of the present study was to
evaluate the effects of an immunosuppressant in the pathogenesis of
PTDM and an animal model was established using Tac. However, PTDM
animal models that follow kidney or other solid organ
transplantation require to be evaluated in the future. Furthermore,
the current study only measured a small selection of molecules from
the insulin signaling pathway in the glucose metabolism, and the
plasma adipocytokine and insulin-derived index levels have not been
fully validated in rodents and require to be further investigated.
The time point chosen to determine drug effect may have been too
short in this study and future evaluation may include multiple
response times.
In summary, the mechanisms responsible for the
occurrence of glucose intolerance induced by Tac may be attributed
to an increased insulin resistance in various peripheral tissues,
in addition the previously reported islet cell injury and
impairment of islet cell secretion (49). According to the results presented
in the current study, Tac induced insulin resistance may be closely
associated with the inhibition of PPAR-γ and altered adipocytokine
expression involved in the occurrence and development of PTDM.
These findings may provide a promising therapeutic target to
prevent PTDM caused by Tac in future.
Abbreviations:
|
PPAR-γ
|
peroxisome proliferator-activated
receptor
|
|
Tac
|
tacrolimus
|
|
IPGTT
|
intraperitoneal glucose tolerance
test
|
|
Rosi
|
rosiglitazone
|
|
HOMA-IR
|
homeostasis model of assessment for
insulin resistance
|
|
GLUT4
|
glucose transporter type-4
|
Acknowledgments
Not applicable.
Funding
This project was supported by the Municipal Science
and Technology Bureau of Wenzhou (grant no. Y20140672) and the
Public Welfare Project of Science and Technology Department of
Zhejiang Province (grant no. 2015C33186).
Availability of data and materials
All data generated or analyzed during this study are
included in this published article.
Authors' contributions
LZ and YH were involved in the conception, design
and drafting the manuscript. CW and MW collected and assembled the
data. XC and JL were involved in the data analysis and
interpretation. YC was involved in data analysis, figures
preparation and revised the manuscript. PX and BC participated in
the conception and design of this study, provided technical support
and final approval of the manuscript. All authors had full access
to the data in and take responsibility for the integrity and
accuracy of data analysis.
Ethics approval and consent to
participate
The present study was approved by The First
Affiliated Hospital of Wenzhou Medical University Ethics
Committee.
Patient consent for publication
Not applicable.
Competing interests
The authors declare that they have no competing
interests.
References
|
1
|
Moura Penteado LA, Lucena GM, Brandão
Peixoto MO, Barbosa TC, de Souza Leitão Arruda AC and Cimões R:
Evaluation of the effect of tacrolimus on periodontitis induced in
rats. Arch Oral Biol. 80:89–94. 2017. View Article : Google Scholar : PubMed/NCBI
|
|
2
|
Chien YS, Chen YT, Chuang CH, Cheng YT,
Chuang FR and Hsieh H: Incidence and risk factors of new-onset
diabetes mellitus after renal transplantation. Transplant Proc.
40:2409–2411. 2008. View Article : Google Scholar : PubMed/NCBI
|
|
3
|
Lancia P, Adam de Beaumais T and
Jacqz-Aigrain E: Pharmacogenetics of posttransplant diabetes
mellitus. Pharmacogenomics J. 17:209–221. 2017. View Article : Google Scholar : PubMed/NCBI
|
|
4
|
Montori VM, Basu A, Erwin PJ, Velosa JA,
Gabriel SE and Kudva YC: Posttransplantation diabetes: A systematic
review of the literature. Diabetes Care. 25:583–592. 2002.
View Article : Google Scholar : PubMed/NCBI
|
|
5
|
Demirci MS, Toz H, Yilmaz F, Ertilav M,
Asci G, Ozkahya M, Zeytinoglu A, Nart D and Ok E: Risk factors and
consequences of post-transplant diabetes mellitus. Clin Transplant.
24:E170–E177. 2010. View Article : Google Scholar : PubMed/NCBI
|
|
6
|
Ericzon B, Groth C, Bismuth H, Calne R,
McMaster P, Neuhaus P, Otto G, Pichlmayr R and Williams R: Glucose
metabolism in liver transplant recipients treated with FK 506 or
cyclosporin in the European multicentre study. Transplt Int.
7(Suppl 1): S11–S14. 1994. View Article : Google Scholar
|
|
7
|
Lohmann T, List C, Lamesch P, Kohlhaw K,
Wenzke M, Schwarz C, Richter O, Hauss J and Seissler J: Diabetes
mellitus and islet cell specific autoimmunity as adverse effects of
immun-suppressive therapy by FK506/tacrolimus. Exp Clin Endocrinol
Diabetes. 108:347–352. 2000. View Article : Google Scholar
|
|
8
|
Heit JJ, Apelqvist AA, Gu X, Winslow MM,
Neilson JR, Crabtree GR and Kim SK: Calcineurin/NFAT signalling
regulates pancreatic beta-cell growth and function. Nature.
443:345–349. 2006. View Article : Google Scholar : PubMed/NCBI
|
|
9
|
Hernández-Fisac I, Pizarro-Delgado J,
Calle C, Marques M, Sánchez A, Barrientos A and Tamarit-Rodriguez
J: Tacrolimus-induced diabetes in rats courses with suppressed
insulin gene expression in pancreatic islets. Am J Transplant.
7:2455–2462. 2007. View Article : Google Scholar : PubMed/NCBI
|
|
10
|
Rodriguez-Rodriguez AE, Triñanes J,
Porrini E, Velázquez-Garcia S, Fumero C, Vega-Prieto MJ,
Díez-Fuentes ML, Luis Lima S, Salido E and Torres A: Glucose
homeostasis changes and pancreatic β-cell proliferation after
switching to cyclosporin in tacrolimus-induced diabetes mellitus.
Nefrologia. 35:264–272. 2015.In English, Spanish.
|
|
11
|
Senior PA, Paty BW, Cockfield SM, Ryan EA
and Shapiro AM: Proteinuria developing after clinical islet
transplantation resolves with sirolimus withdrawal and increased
tacrolimus dosing. Am J Transplant. 5:2318–2323. 2005. View Article : Google Scholar : PubMed/NCBI
|
|
12
|
Desai NM, Goss JA, Deng S, Wolf BA,
Markmann E, Palanjian M, Shock AP, Feliciano S, Brunicardi FC,
Barker CF, et al: Elevated portal vein drug levels of sirolimus and
tacrolimus in islet transplant recipients: Local immunosuppression
or islet toxicity? Transplantation. 76:1623–1625. 2003. View Article : Google Scholar
|
|
13
|
Jahn I, Busch M, Ott U, Wolf G and
Battefeld W: Posttransplantation diabetes mellitus in patients
after kidney transplantation-Incidence and risk factors. Dtsch Med
Wochenschr. 141:e173–e182. 2016.In German. PubMed/NCBI
|
|
14
|
Liu JY, You RX, Guo M, Zeng L, Zhou P, Zhu
L, Xu G, Li J and Liu D: Tacrolimus versus cyclosporine as primary
immu-nosuppressant after renal transplantation: A meta-analysis and
economics evaluation. Am J Ther. 23:e810–e824. 2016. View Article : Google Scholar
|
|
15
|
Li Y, Goto T, Yamakuni K, Takahashi H,
Takahashi N, Jheng HF, Nomura W, Taniguchi M, Baba K, Murakami S
and Kawada T: 4-Hydroxyderricin, as a PPARγ agonist, promotes
adipogenesis, adiponectin secretion, and glucose uptake in 3T3-L1
cells. Lipids. 51:787–795. 2016. View Article : Google Scholar : PubMed/NCBI
|
|
16
|
Voytovich MH, Simonsen C, Jenssen T,
Hjelmesaeth J, Asberg A and Hartmann A: Short-term treatment with
rosiglitazone improves glucose tolerance, insulin sensitivity and
endothelial function in renal transplant recipients. Nephrol Dial
Transplant. 20:413–418. 2005. View Article : Google Scholar
|
|
17
|
Isokuortti E, Zhou Y, Peltonen M,
Bugianesi E, Clement K, Bonnefont-Rousselot D, Lacorte JM,
Gastaldelli A, Schuppan D, Schattenberg JM, et al: Use of HOMA-IR
to diagnose non-alcoholic fatty liver disease: A population-based
and inter-laboratory study. Diabetologia. 60:1873–1882. 2017.
View Article : Google Scholar : PubMed/NCBI
|
|
18
|
Bloom S, Ghatei M and Bech P: Measurement
of gut hormones in plasma. Methods. Mol Biol. 1065:147–170.
2013.
|
|
19
|
Pichaiwong W, Hudkins KL, Wietecha T,
Nguyen TQ, Tachaudomdach C, Li W, Askari B, Kobayashi T, O'Brien
KD, Pippin JW, et al: Reversibility of structural and functional
damage in a model of advanced diabetic nephropathy. J Am Soc
Nephrol. 24:1088–1102. 2013. View Article : Google Scholar : PubMed/NCBI
|
|
20
|
Arocho A, Chen B, Ladanyi M and Pan Q:
Validation of the 2-DeltaDeltaCt calculation as an alternate method
of data analysis for quantitative PCR of BCR-ABL P210 transcripts.
Diagn Mol Pathol. 15:56–61. 2006. View Article : Google Scholar : PubMed/NCBI
|
|
21
|
Park S, Kim DS and Kang S: Vitamin D
deficiency impairs glucose-stimulated insulin secretion and
increases insulin resistance by reducing PPAR-γ expression in
nonobese type 2 diabetic rats. J Nutr Biochem. 27:257–265. 2016.
View Article : Google Scholar
|
|
22
|
Massaro M, Scoditti E, Pellegrino M,
Carluccio MA, Calabriso N, Wabitsch M, Storelli C, Wright M and De
Caterina R: Therapeutic potential of the dual peroxisome
proliferator activated receptor (PPAR)α/γ agonist aleglitazar in
attenuating TNF-α-mediated inflammation and insulin resistance in
human adipocytes. Pharmacol Res. 107:125–136. 2016. View Article : Google Scholar : PubMed/NCBI
|
|
23
|
Dai C, Wang X, Wu Y, Xu Y, Zhuo S, Qi M,
Ji W and Zhan L: Polarity protein AF6 controls hepatic glucose
homeostasis and insulin sensitivity by modulating IRS1/AKT insulin
pathway in a SHP2-dependent manner. Diabetes. 68:1577–1590.
2019.PubMed/NCBI
|
|
24
|
Albaghdadi AJ, Hewitt MA, Putos SM, Wells
M, Ozolinš TR and Kan FW: Tacrolimus in the prevention of adverse
pregnancy outcomes and diabetes-associated embryopathies in obese
and diabetic mice. J Transl Med. 15:322017. View Article : Google Scholar : PubMed/NCBI
|
|
25
|
Gnatta D, Keitel E, Heineck I, Cardoso BD,
Rodrigues AP, Michel K and Garcia VD: Use of tacrolimus and the
development of posttransplant diabetes mellitus: A Brazilian
single-center, observational study. Transplant Proc. 42:475–478.
2010. View Article : Google Scholar : PubMed/NCBI
|
|
26
|
Dabrowska-Zamojcin E, Tarnowski M,
Szydlowski M, Romanowski M, Dziedziejko V, Safranow K, Domanski L
and Pawlik A: KCNJ11 and KCNQ1 gene polymorphisms are not
associated with post-transplant diabetes mellitus in kidney
allograft recipients treated with tacrolimus. Folia Biol (Praha).
63:115–119. 2017.
|
|
27
|
Torres A, Hernández D, Moreso F, Serón D,
Burgos MD, Pallardó LM, Kanter J, Díaz Corte C, Rodríguez M, Diaz
JM, et al: Randomized controlled trial assessing the impact of
tacrolimus versus cyclosporine on the incidence of posttransplant
diabetes mellitus. Kidney Int Rep. 3:1304–1315. 2018. View Article : Google Scholar : PubMed/NCBI
|
|
28
|
Jin J, Jin L, Luo K, Lim SW, Chung BH and
Yang CW: Effect of empagliflozin on tacrolimus-induced pancreas
islet dysfunction and renal injury. Am J Transplant. 17:2601–2616.
2017. View Article : Google Scholar : PubMed/NCBI
|
|
29
|
Gachon F, Loizides-Mangold U, Petrenko V
and Dibner C: Glucose homeostasis: Regulation by peripheral
circadian clocks in rodents and humans. Endocrinology.
158:1074–1084. 2017. View Article : Google Scholar : PubMed/NCBI
|
|
30
|
Duijnhoven EM, Boots JM, Christiaans MH,
Wolffenbuttel BH and Van Hooff JP: Influence of tacrolimus on
glucose metabolism before and after renal transplantation: A
prospective study. J Am Society Nephrol. 12:583–588. 2001.
|
|
31
|
Terauchi Y and Kadowaki T: PPAR and
diabetes. Nihon Rinsho. 63:623–629. 2005.In Japanese. PubMed/NCBI
|
|
32
|
Holguin F, Rojas M and Hart CM: The
peroxisome proliferator activated receptor gamma (PPARgamma) ligand
rosiglitazone modulates bronchoalveolar lavage levels of leptin,
adiponectin, and inflammatory cytokines in lean and obese mice.
Lung. 185:367–372. 2007. View Article : Google Scholar : PubMed/NCBI
|
|
33
|
Azaïs H, Leroy A, Ghesquiere L, Deruelle P
and Hanssens S: Effects of adipokines and obesity on uterine
contractility. Cytokine Growth Factor Rev. 34:59–66. 2017.
View Article : Google Scholar : PubMed/NCBI
|
|
34
|
Jaganathan R, Ravindran R and Dhanasekaran
S: Emerging role of adipocytokines in type 2 diabetes as mediators
of insulin resistance and cardiovascular disease. Can J Diabetes.
42:446–456. e12018. View Article : Google Scholar
|
|
35
|
Kurian B, Joshi R and Helmuth A:
Effectiveness and long-term safety of thiazolidinediones and
metformin in renal transplant recipients. Endocr Pract. 14:979–984.
2008. View Article : Google Scholar : PubMed/NCBI
|
|
36
|
Villanueva G and Baldwin D: Rosiglitazone
therapy of posttrans-plant diabetes mellitus. Transplantation.
80:1402–1405. 2005. View Article : Google Scholar : PubMed/NCBI
|
|
37
|
Gayet C, Leray V, Saito M, Siliart B and
Nguyen P: The effects of obesity-associated insulin resistance on
mRNA expression of peroxisome proliferator-activated receptor-gamma
target genes, in dogs. Br J Nutr. 98:497–503. 2007. View Article : Google Scholar : PubMed/NCBI
|
|
38
|
Choi KC, Ryu OH, Lee KW, Kim HY, Seo JA,
Kim SG, Kim NH, Choi DS, Baik SH and Choi KM: Effect of PPAR-alpha
and -gamma agonist on the expression of visfatin, adiponectin, and
TNF-alpha in visceral fat of OLETF rats. Biochem Biophys Res
Commun. 336:747–753. 2005. View Article : Google Scholar : PubMed/NCBI
|
|
39
|
Blüher M and Paschke R: Analysis of the
relationship between PPAR-gamma 2 gene variants and severe insulin
resistance in obese patients with impaired glucose tolerance. Exp
Clin Endocrinol Diabetes. 111:85–90. 2003. View Article : Google Scholar : PubMed/NCBI
|
|
40
|
Ruangkanchanasetr P, Sanohdontree N,
Supaporn T, Sathavarodom N and Satirapoj B: Beta cell function and
insulin resistance after conversion from tacrolimus twice-daily to
extended-release tacrolimus once-daily in stable renal transplant
recipients. Ann Transplant. 21:765–774. 2016. View Article : Google Scholar : PubMed/NCBI
|
|
41
|
Zhao J, Wang M, Deng W, Zhong D, Jiang Y,
Liao Y, Chen B and Zhang X: ADP-ribosylation factor-like GTPase 15
enhances insulin-induced AKT phosphorylation in the IR/IRS1/AKT
pathway by interacting with ASAP2 and regulating PDPK1 activity.
Biochem Biophys Res Commun. 486:865–871. 2017. View Article : Google Scholar : PubMed/NCBI
|
|
42
|
Moon MK, Kang GH, Kim HH, Han SK, Koo YD,
Cho SW, Kim YA, Oh BC, Park do J, Chung SS, et al:
Thyroid-stimulating hormone improves insulin sensitivity in
skeletal muscle cells via cAMP/PKA/CREB pathway-dependent
upregulation of insulin receptor substrate-1 expression. Mol Cell
Endocrinol. 436:50–58. 2016. View Article : Google Scholar : PubMed/NCBI
|
|
43
|
Cignarelli A, Genchi VA, Perrini S,
Natalicchio A, Laviola L and Giorgino F: Insulin and insulin
receptors in adipose tissue development. Int J Mol Sci. 20:pii:
E759. 2019. View Article : Google Scholar : PubMed/NCBI
|
|
44
|
Roncero I, Alvarez E, Acosta C, Sanz C,
Barrio P, Hurtado-Carneiro V, Burks D and Blázquez E:
Insulin-receptor substrate-2 (irs-2) is required for maintaining
glucokinase and glucokinase regulatory protein expression in mouse
liver. PLoS One. 8:e587972013. View Article : Google Scholar : PubMed/NCBI
|
|
45
|
Bendickova K, Tidu F and Fric J:
Calcineurin-NFAT signalling in myeloid leucocytes: new prospects
and pitfalls in immunosup-pressive therapy. EMBO Mol Med.
9:990–999. 2017. View Article : Google Scholar : PubMed/NCBI
|
|
46
|
Mathis AS, Jin S, Friedman GS, Peng F,
Carl SM and Knipp GT: The pharmacodynamic effects of sirolimus and
sirolimus-calcineurin inhibitor combinations on macrophage
scavenger and nuclear hormone receptors. J Pharm Sci. 96:209–222.
2007. View Article : Google Scholar
|
|
47
|
Aye IL, Gao X, Weintraub ST, Jansson T and
Powell TL: Adiponectin inhibits insulin function in primary
trophoblasts by PPARα-mediated ceramide synthesis. Mol Endocrinol.
28:512–524. 2014. View Article : Google Scholar : PubMed/NCBI
|
|
48
|
Boerner BP, Shivaswamy V, Wolatz E and
Larsen J: Post-transplant diabetes: Diagnosis and management.
Minerva Endocrinol. 43:198–211. 2018.
|
|
49
|
Li Z, Sun F, Zhang Y, Chen H, He N, Chen
H, Song P, Wang Y, Yan S and Zheng S: Tacrolimus induces insulin
resistance and increases the glucose absorption in the jejunum: A
potential mechanism of the diabetogenic effects. PLoS One.
10:e01434052015. View Article : Google Scholar : PubMed/NCBI
|