Introduction
The primary function of mdm2 is to negatively
regulate the expression and function of the p53 tumour suppressor
protein. As such, high mdm2 levels decrease p53 protein levels and
attenuate p53 function. In addition, studies have demonstrated that
mdm2 gene amplification and mutation of p53 are mutually exclusive
(1-5). mdm2 and p53 proteins form an
autoregulatory feedback loop to tightly control proper cellular
responses to various stress signals and factors, such as microRNAs
(miRs). miRs are small noncoding RNAs that serve a key role in the
post-transcriptional regulation of gene expression, and affect a
number of cellular processes, such as cell proliferation and
apoptosis. A previous study demonstrated that miR-26a serves a key
role in regulating liver regeneration (LR) via direct targeting of
the 3′-untranslated region (UTR) of cyclin E2 and cyclin D2
(6). In addition, decreased
miR-26a enhanced mouse hepatocyte proliferation, which was
accompanied by decreased levels of apoptotic hepatocytes and p53
expression (7). However, emerging
evidence suggests that p53 may not be a target of miR-26a.
Therefore, the authors of the present study hypothesized that
additional intermediate factors may be involved in the regulation
of LR by miR-26a.
The current study presents evidence to suggest that
mdm2 may be an important potential target of miR-26a in LR, and
that miR-26a may regulate LR via the direct targeting of the mdm2
3′-UTR. This may result in the subsequent regulation of hepatocyte
apoptosis via the mdm2/p53 negative autoregulatory feedback loop.
Under normal conditions, p53 protein activity is maintained at low
levels by mdm2, as mdm2 negatively regulates the stability of p53
(8-10). Upon DNA damage, the interaction
between mdm2 and p53 is weakened by the rapid activation of
p53-mediated signalling pathways, which leads to apoptosis or cell
cycle arrest (11,12). However, recent studies have
demonstrated that this network may be more complex than previously
thought and the current understanding of this network may be
incomplete (13-15). In particular, the mechanism by
which p53 escapes the mdm2/p53 negative feedback loop and
accumulates rapidly during LR is unclear. It is possible that a
third factor may function to serve the mdm2/p53 negative feedback
loop. The aim of the present study was to investigate this
further.
Materials and methods
Vector construction
Anti-miR-26a (5′-CGT GCA AGT AAC CAA GAA TAG GCG TGC
AAG TAA CCA AGA ATA GGC GTG CAA GTA ACC AAG AAT AGG-3′) and
pro-miR-26a (5′-AAG GCC GTG GCC TCG TTC AAG TAA TCC AGG ATA GGC TGT
GCA GGT CCC AAG GGG CCT ATT CTT GGT TAC TTG CAC GGG GAC GCG GGC
CTG-3′), mdm2-cDNA (5′-GCC TCT TGC TGC TGA CCA CAC TCC TGG TA-3′)
and mdm2-small interfering (si)RNA (5′-CTG CTA CCG TAC AGT CTC AGG
CAT GGA CG-3′) sequences were individually introduced (each, 0.6
µg/µl) into the pShuttle IRES vector (Agilent
Technologies, Inc., Santa Clara, CA, USA). Following linearization
with PmeI, the pAdEasy-1 (Agilent Technologies, Inc.) and
the pShuttle IRES vector were combined to generate a pAdEasy-IRES
vector. 293AD cells (Cell Biolabs, Inc., San Diego, CA, USA;
density, 1×10⁶) (16),
were subsequently transfected with the pAdEasy-IRES vector before
the liquid supernatant containing viral particles was isolated and
collected. The viral particles, including Ad5/anti/miR-26a,
Ad5/miR-26a, Ad5/mdm2-cDNA and Ad5/mdm2-siRNA vectors were
established individually.
Cell culture, transient transfection and
transfection efficiency assessment
The previously established, non-primary, mouse liver
cell line, nctc-1469 (American Type Culture Collection, Manassas,
VA, USA) (17), was obtained from
SuJi biotech company (Guangzhou, China). nctc-1469 cells were
cultured in Dulbecco's modified Eagle′s medium (Gibco; Thermo
Fisher Scientific, Inc., Waltham, MA, USA) supplemented with 10%
foetal bovine serum (Gibco; Thermo Fisher Scientific, Inc.) and
maintained in a humidified atmosphere containing 5% CO2
at 37°C. Cells were transfected with Ad5/anti/miR-26a vector
(2.5×10¹⁰ IU/ml) or Ad5/miR-26a vector
(2.5×10¹⁰ IU/ml) using Lipofectamine 2000 reagent
(Invitrogen; Thermo Fisher Scientific, Inc.), according to the
manufacturer's protocol. To assess transfection efficiency, at 3
days following transfection of each vector into nctc-1469 cells,
1×10⁶ cells were collected and miR-26a expression was
analysed by reverse transcription-quantitative polymerase chain
reaction (RT-qPCR).
Cell proliferation analysis using the MTS
assay
nctc-1469 cells were first transfected with the
Ad5/miR-26a vector (2.5×10¹⁰ IU/ml) or Ad5/anti-miR-26a
vector (2.5×10¹⁰ IU/ml) in 24-well plates, and then
re-seeded in 96-well plates at a density of 1,000 cells/well at 48
h following transfection. At 72 h following re-seeding in 96-well
plates, 10 µl MTS was added to the culture medium and the
cells were incubated for a further 4 h. The absorbance of each
sample at 490 nm was read using a microplate reader (Thermo Fisher
Scientific, Inc.).
Cell cycle analysis by flow
cytometry
nctc-1469 cells seeded in 6-well plates at a density
of 2×10⁵ cells/well, were transfected with Ad5/miR-26a
(2.5×10¹⁰ IU/ml) or Ad5/anti/miR-26a
(2.5×10¹⁰ IU/ml). At 72 h following transfection, the
cells were collected and fixed in 70% ethanol for 30 min at −20°C,
and then washed twice with ice-cold PBS. The cells were centrifuged
at 352 × g for 5 min at 4°C and resuspended in RNase-containing PBS
(dilution, 1:100) on ice before staining with propidium iodide at
4°C for 30 min. The cells were subsequently analysed using a flow
cytometer (FACSCalibur; BD Biosciences; Becton, Dickinson and
Company, San Jose, CA, USA) with ModFit software (LT v3.3; Verity
Software House, Inc.).
Cell apoptosis analysis by flow
cytometry
nctc-1469 cells were cultured in 6-well plates and
were transfected with Ad5/anti/miR-26a (2.5×10¹⁰ IU/ml)
or Ad5/miR-26a vector (2.5×10¹⁰ IU/ml). At 72 h
following transfection, the cells were collected for apoptotic
analysis by flow cytometry. An Annexin V detection kit (Fermentas;
Thermo Fisher Scientific, Inc.) was used to detect apoptotic cells.
Data acquisition and analysis were performed using a FACSCalibur
cytometer (BD Biosciences). A total of 1×10⁵ cells were
scanned for each analysis.
Surgical procedures
A total of 100 C57BL/6J male mice (age, 8 weeks;
weight, 18-21 g) were purchased from the Animal Experiment Center
of Sun Yat-sen University (Guangzhou, China) and raised in a
pathogen-free environment maintained at 22.0±2.0°C with a relative
humidity of 40-70%. A 12 h light/dark cycle was implemented and
mice received free access to food and water. Animals were randomly
divided into 4 groups (n=20/group) as follows: i) mdm2-siRNA group,
70% partial hepatectomy (PH) in mice was performed according to the
methods described by Mitchell and Willenbring (18) before the vector harbouring
mdm2-siRNA (0.5 ml; 2.5×10¹⁰ IU/ml) was injected into
liver tissues via the portal vein; ii) mdm2-cDNA group, following
the 70% PH procedure, mice were injected with the mdm2-cDNA vector
(0.5 ml; 2.5×10¹⁰ IU/ml); iii) negative control (NC)
group, following the 70% PH procedure mice were injected with a
blank vector (0.5 ml; 2.5×10¹⁰ IU/ml); iv) control
group, the PH surgical procedure was performed but mice were not
injected with any vectors. All mice were sacrificed at 72 h
following the surgical procedure, and the residual liver tissues
and blood samples (1.0-1.5 ml) were collected for various analyses,
including in vivo transfection efficiency assessments.
Liver function tests
Following sacrifice, blood samples were collected
via the postorbital venous plexus. Blood serum samples were
analysed for alanine aminotransferase (ALT), aspartate
aminotransferase (AST) and total bilirubin (Tbil) levels using
methods described previously (19).
Liver-to-body weight ratio (LBWR)
The mice were sacrificed at 72 h following the PH
surgical procedure. Total body weights were first measured and then
the liver tissues were resected and weighed. The ratio is presented
as a percentage and calculated using the following formula: LBWR
(%)=(liver tissue/body weight) ×100.
Immunohistochemical staining and
evaluation
Mouse liver tissues (tissue size, ~0.5×0.5×0.2
cm3) were collected at 72 h following the PH surgical
procedure. Samples were fixed in 4% paraformaldehyde at room
temperature for 24 h, embedded in paraffin and sliced to a
thickness of 2 mm. Immunohistochemical staining with Ki-67
antibodies (1:200; cat. no. ab15580; Abcam) was performed to
evaluate the proliferation of hepatocytes according to the
manufacturer's protocol (incubated at 4°C overnight). Horseradish
peroxidase-conjugated goat anti-rabbit IgG H&L Secondary
antibodies (1:500; cat. no. ab205718; Abcam) were then added and
incubated for 20 min at room temperature. Proliferation index was
defined as the percentage of Ki-67 positive cells randomly counted
in five high-power fields (light microscopy; magnification, ×200)
of each specimen.
Western blot analysis
To obtain whole-cell protein extracts, cells were
first homogenised in RIPA lysis buffer (Promega Corporation,
Madison, WI, USA), incubated for 30 min on ice and then centrifuged
at room temperature for 15 min at 14,000 × g. Prior to use, all
buffers were treated with a protease inhibitor cocktail (Konchem
Co., Ltd.). A BCA assay kit was used for protein determination
(Beijing TDY Biotech Co., Ltd.). Equal quantities (2 mg/ml) of
protein were separated discontinuously by 12-15% SDS-PAGE and
transferred to polyvinylidene fluoride membranes (Merck KGaA,
Darmstadt, Germany). Membranes were subsequently blocked with 5%
skimmed milk at room temperature for 1 h. Antibodies (all, 1:1,000)
included anti-p53 (cat. no. sc-71817), anti-mdm2 (cat. no.
sc-13161), anti-p21 (cat. no. sc-53870), anti-p27 (cat. no.
sc-53906; all, Santa Cruz Biotechnology, Inc., Dallas, TX, USA) and
anti-GAPDH (cat. no. KC-5G4; Kangcheng, China). Immunoblots were
developed using horseradish peroxidase (HRP)-conjugated anti-rabbit
secondary antibodies (cat. no. Q2435; 1:2,000; Dako; Agilent
Technologies, Inc.), followed by detection with immobilon western
chemiluminescence HRP substrate (Merck KGaA). GAPDH was used as a
referenced gene.
RT-qPCR
Total RNA was extracted from prepared liver cells
using TRIzol (Invitrogen; Thermo Fisher Scientific, Inc.). Reagents
and cDNA were synthesized according to the manufacturer's protocol
(Fermentas; Thermo Fisher Scientific, Inc.). The temperature
protocol of RT was as follows: 16°C for 30 min, 42°C for 30 min and
85°C 5 min. RT-qPCR was performed using a standard SYBR-Green PCR
Master Mix (Toyobo Life Science, Osaka, Japan) and PCR-specific
amplification was performed using the ABI7500 Applied Biosystems
real-time PCR machine (Applied biosystems; Thermo Fisher
Scientific, Inc.). The thermocycling conditions were as follows:
95°C for 5 min; 40 cycles at 95°C for 15 sec, 60°C for 15 sec and
72°C for 32 sec. The expression of miR-26a, U6, mdm2, p53, p21, p27
and GAPDH in all groups were calculated using the 2-ΔΔCq
method (20). The primers used
are listed in Table I. GAPDH was
used as reference gene for mdm2, p53, p21 and p27 expression, and
U6 was used as referenced gene for miR-26a expression. The
expression of miR-26a or anti/miR-26a groups were compared with
their respective control groups, and the mdm2-siRNA or mdm2-cDNA
groups were compared with their respective control groups.
 | Table IPrimers used in reverse transcription
and quantitative PCR. |
Table I
Primers used in reverse transcription
and quantitative PCR.
| miRNA and
genes | Primers
sequences |
|---|
| miR-26a
forward |
5′-ACACTCCAGCTGGGTTCAAGTAATCCAGGATAGGC |
| miR-26a
reverse |
5′-CTCAACTGGTGTCGTGGA |
| miR-26a RT |
5′-CTCAACTGGTGTCGTGGAGTCGGCAATTCAGTTGAGAGCCTATC |
| U6 forward |
5′-CTCGCTTCGGCAGCACA |
| U6 reverse |
5′-AACGCTTCACGAATTTGCGT |
| mdm2 forward | 5′-
GCAGAAGAAGGCTTGGATGT |
| mdm2 reverse | 5′-
GGAAGTCGATGGTTGGGAAT |
| p53 forward |
5′-GGCTCACTCCAGCTACCTGA |
| p53 reverse |
5′-TGCAGAGGCAGTCAGTCTGA |
| p21 forward |
5′-ATACCGTGGGTGTCAAAGCA |
| p21 reverse |
5′-CAGGGAGGGAGCCACAATAC |
| p27 forward |
5′-TTGGGTCTCAGGCAAACTCT |
| p27 forward |
5′-AGCAGGTCGCTTCCTCATCC |
| GAPDH forward |
5′-GTCAAGGCTGAGAACGGGAA |
| GAPDH reverse |
5′-AAATGAGCCCCAGCCTTCTC |
Dual-luciferase reporter assays
To perform the miRNA screen, the 293AD cells (Cell
Biolabs, Inc.) were seeded in 96-well plates at a density of 5,000
cells/well. Following 24 h, the cells were transiently transfected
with 5 ng of pRL/CMV (a Renilla luciferase reporter), 50 ng
of either p-LUC or p-LUC/mdm2 UTR (firefly luciferase reporter;
both, Promega Corporation) together with 5 pmol of miRNA mimics
using Lipofectamine 2000 (Invitrogen; Thermo Fisher Scientific,
Inc.). Firefly and Renilla luciferase activities were
measured at 36 h following transfection using a dual-luciferase
reporter assay kit (Promega Corporation). Firefly luciferase
activity was normalized to Renilla luciferase activity. The
pRL/CMV Renilla luciferase reporter and small RNAs were
simultaneously introduced into 293AD cells. These cells were
collected at 36 h following transfection and luciferase activity
was assayed using the aforementioned methods.
Statistical analysis
The results are expressed as the mean ± standard
deviation of at least three independent experiments. Statistical
analysis was performed using one-way analysis of variance (followed
by a post-hoc LSD test) or an independent-samples t-test. P<0.05
was considered to indicate a statistically significant
difference.
Results
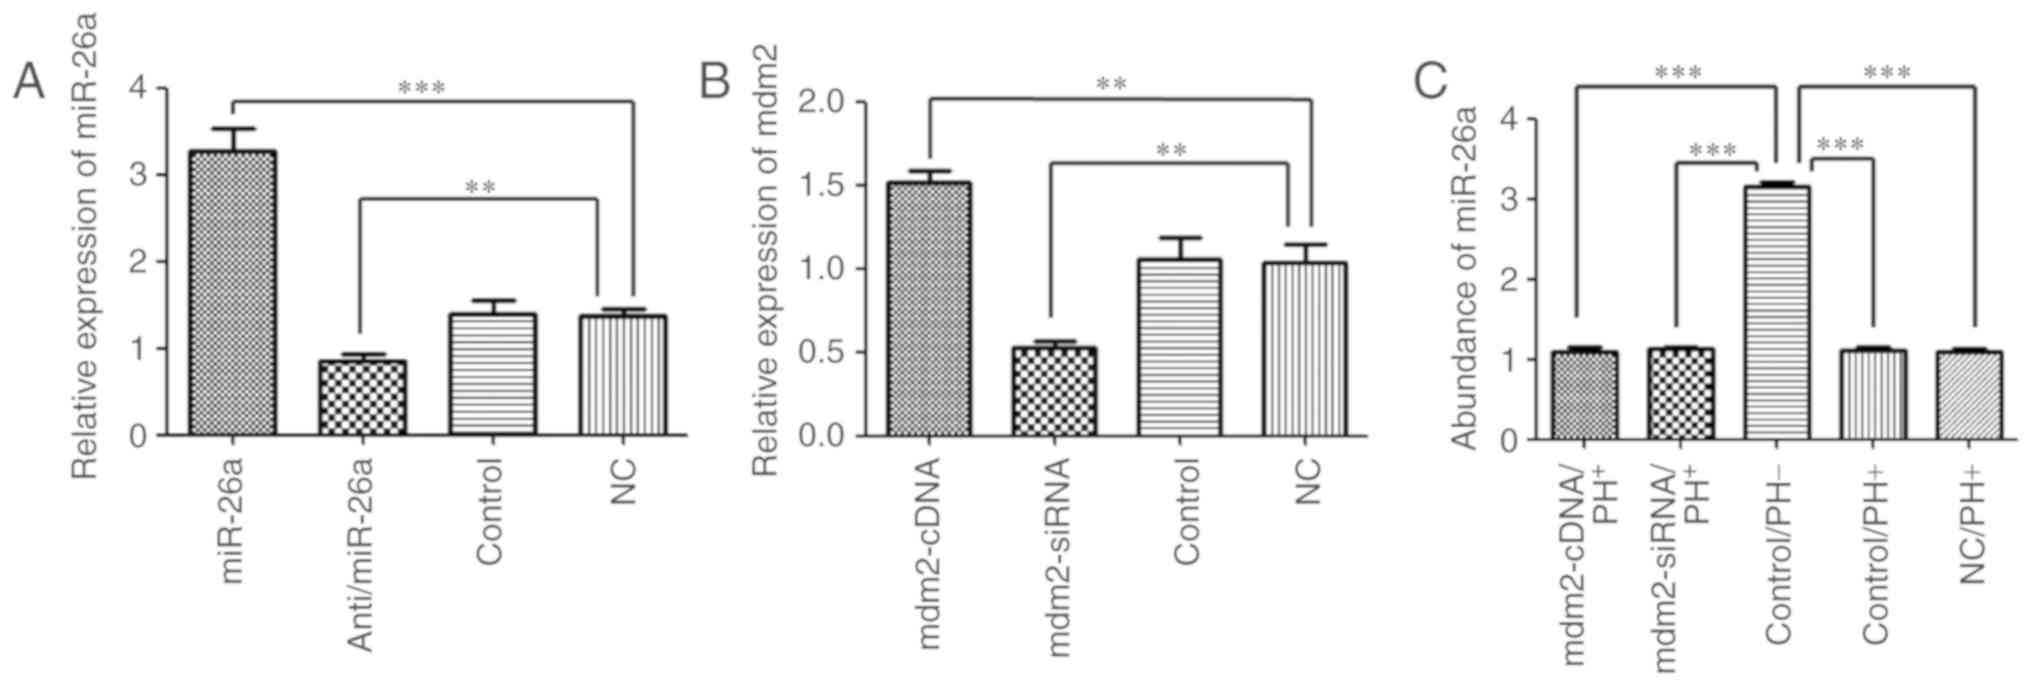
Transfection efficiency of vectors
To evaluate the in vitro transfection
efficiency, miR-26a expression in nctc-1469 mouse liver cells
transfected with the Ad5/miR-26a, Ad5/anti/miR-26a or Ad5/blank
vectors was first examined. The results demonstrated that miR-26a
expression in the miR-26a group was significantly increased
(3.27±0.25; P<0.001), whereas miR-26a expression in the
anti/miR-26a group was significantly decreased when compared with
the NC group (0.85±0.08 vs. 1.36±0.09; P<0.01). No significant
difference in miR-26a expression between the NC and control groups
were observed (1.40±0.15; Fig.
1A).
The expression of mdm2 in mice following induction
of 70% PH and injection with Ad5/mdm2-cDNA, Ad5/mdm2-siRNA or NC
vectors in vivo was then analysed. The results demonstrated
that mdm2 expression in the mdm2-siRNA group was significantly
decreased when compared with NC group (0.52±0.04 vs. 1.03±0.11;
P<0.01). By contrast, mdm2 expression in the mdm2-cDNA group was
significantly increased (1.52±0.06; P<0.01), as determined by
RT-qPCR analysis. No significant difference in mdm2 expression was
observed in the NC group compared with the control group
(1.06±0.12; Fig. 1B). These
results demonstrate that the construction and transfection of the
vectors in vitro and in vivo were successful.
Effect of mdm2 on the relative expression
of miR-26a and detection of miR-26a abundance
To detect the abundance of miR-26a in normal liver
tissues and determine the effect of mdm2 vector transfection, the
relative expression of miR-26a was analysed in vivo and
in vitro. The results indicated that miR-26a expression was
significantly increased in the wild-type group (3.14±0.06;
P<0.001) when compared with the mdm2-cDNA group (1.08±0.06),
mdm2-siRNA group (1.12±0.03), NC group (1.09±0.03) and the control
group (1.11±0.04) in vivo. In addition, no significant
difference among the four groups, apart from the wild-type group,
was observed (Fig. 1C). miR-26a
expression in liver cells was considered as the control group in
Fig. 1A. The results demonstrated
that the transfection of the vectors had no effect on the
expression of miR-26a.
Effect of miR-26a on mouse hepatocyte
proliferation
To investigate the effect of miR-26a on mouse
hepatocyte proliferation in vitro, an MTS assay was used to
detect hepatocyte proliferation. The results demonstrated that
transfection of anti/miR-26a vectors significantly enhanced
hepatocyte proliferation at 72 h following transfection when
compared with the NC group (1.56±0.05 vs. 1.02±0.1; P<0.001). By
contrast, overexpression of miR-26a significantly inhibited liver
cell growth (0.58±0.07; P<0.001). No observable difference in
cell proliferation between the NC and control groups was observed
(1.13±0.05; Fig. 2A). Cell cycle
analysis revealed that the percentage of cells in G1 phase in the
miR-26a group was significantly decreased compared with the NC
group (65.78±1.78% vs. 70.48±1.29%; P<0.05). By contrast, the
percentage of cells in G1 phase in the anti/miR-26a group was
significantly increased (83.81±2.47%; P<0.001). No difference in
the percentage of cells in G1 phase in the NC and control groups
were observed (71.1±1.75%; Fig.
2B-F). Cell apoptosis analysis demonstrated that the number of
apoptotic hepato-cytes in the anti/miR-26a group was significantly
decreased when compared with the NC group (4.33±0.51 vs. 6.65±0.43;
P<0.01), whereas the number of apoptotic cells in the miR-26a
group was significantly increased (8.65±1.02; P<0.01). No
difference in the number of apoptotic cells in the NC and control
groups was observed (6.50±0.43; Fig.
2G-K). Overall, these results indicate that miR-26a may serve a
key role in regulating liver cell proliferation and apoptosis.
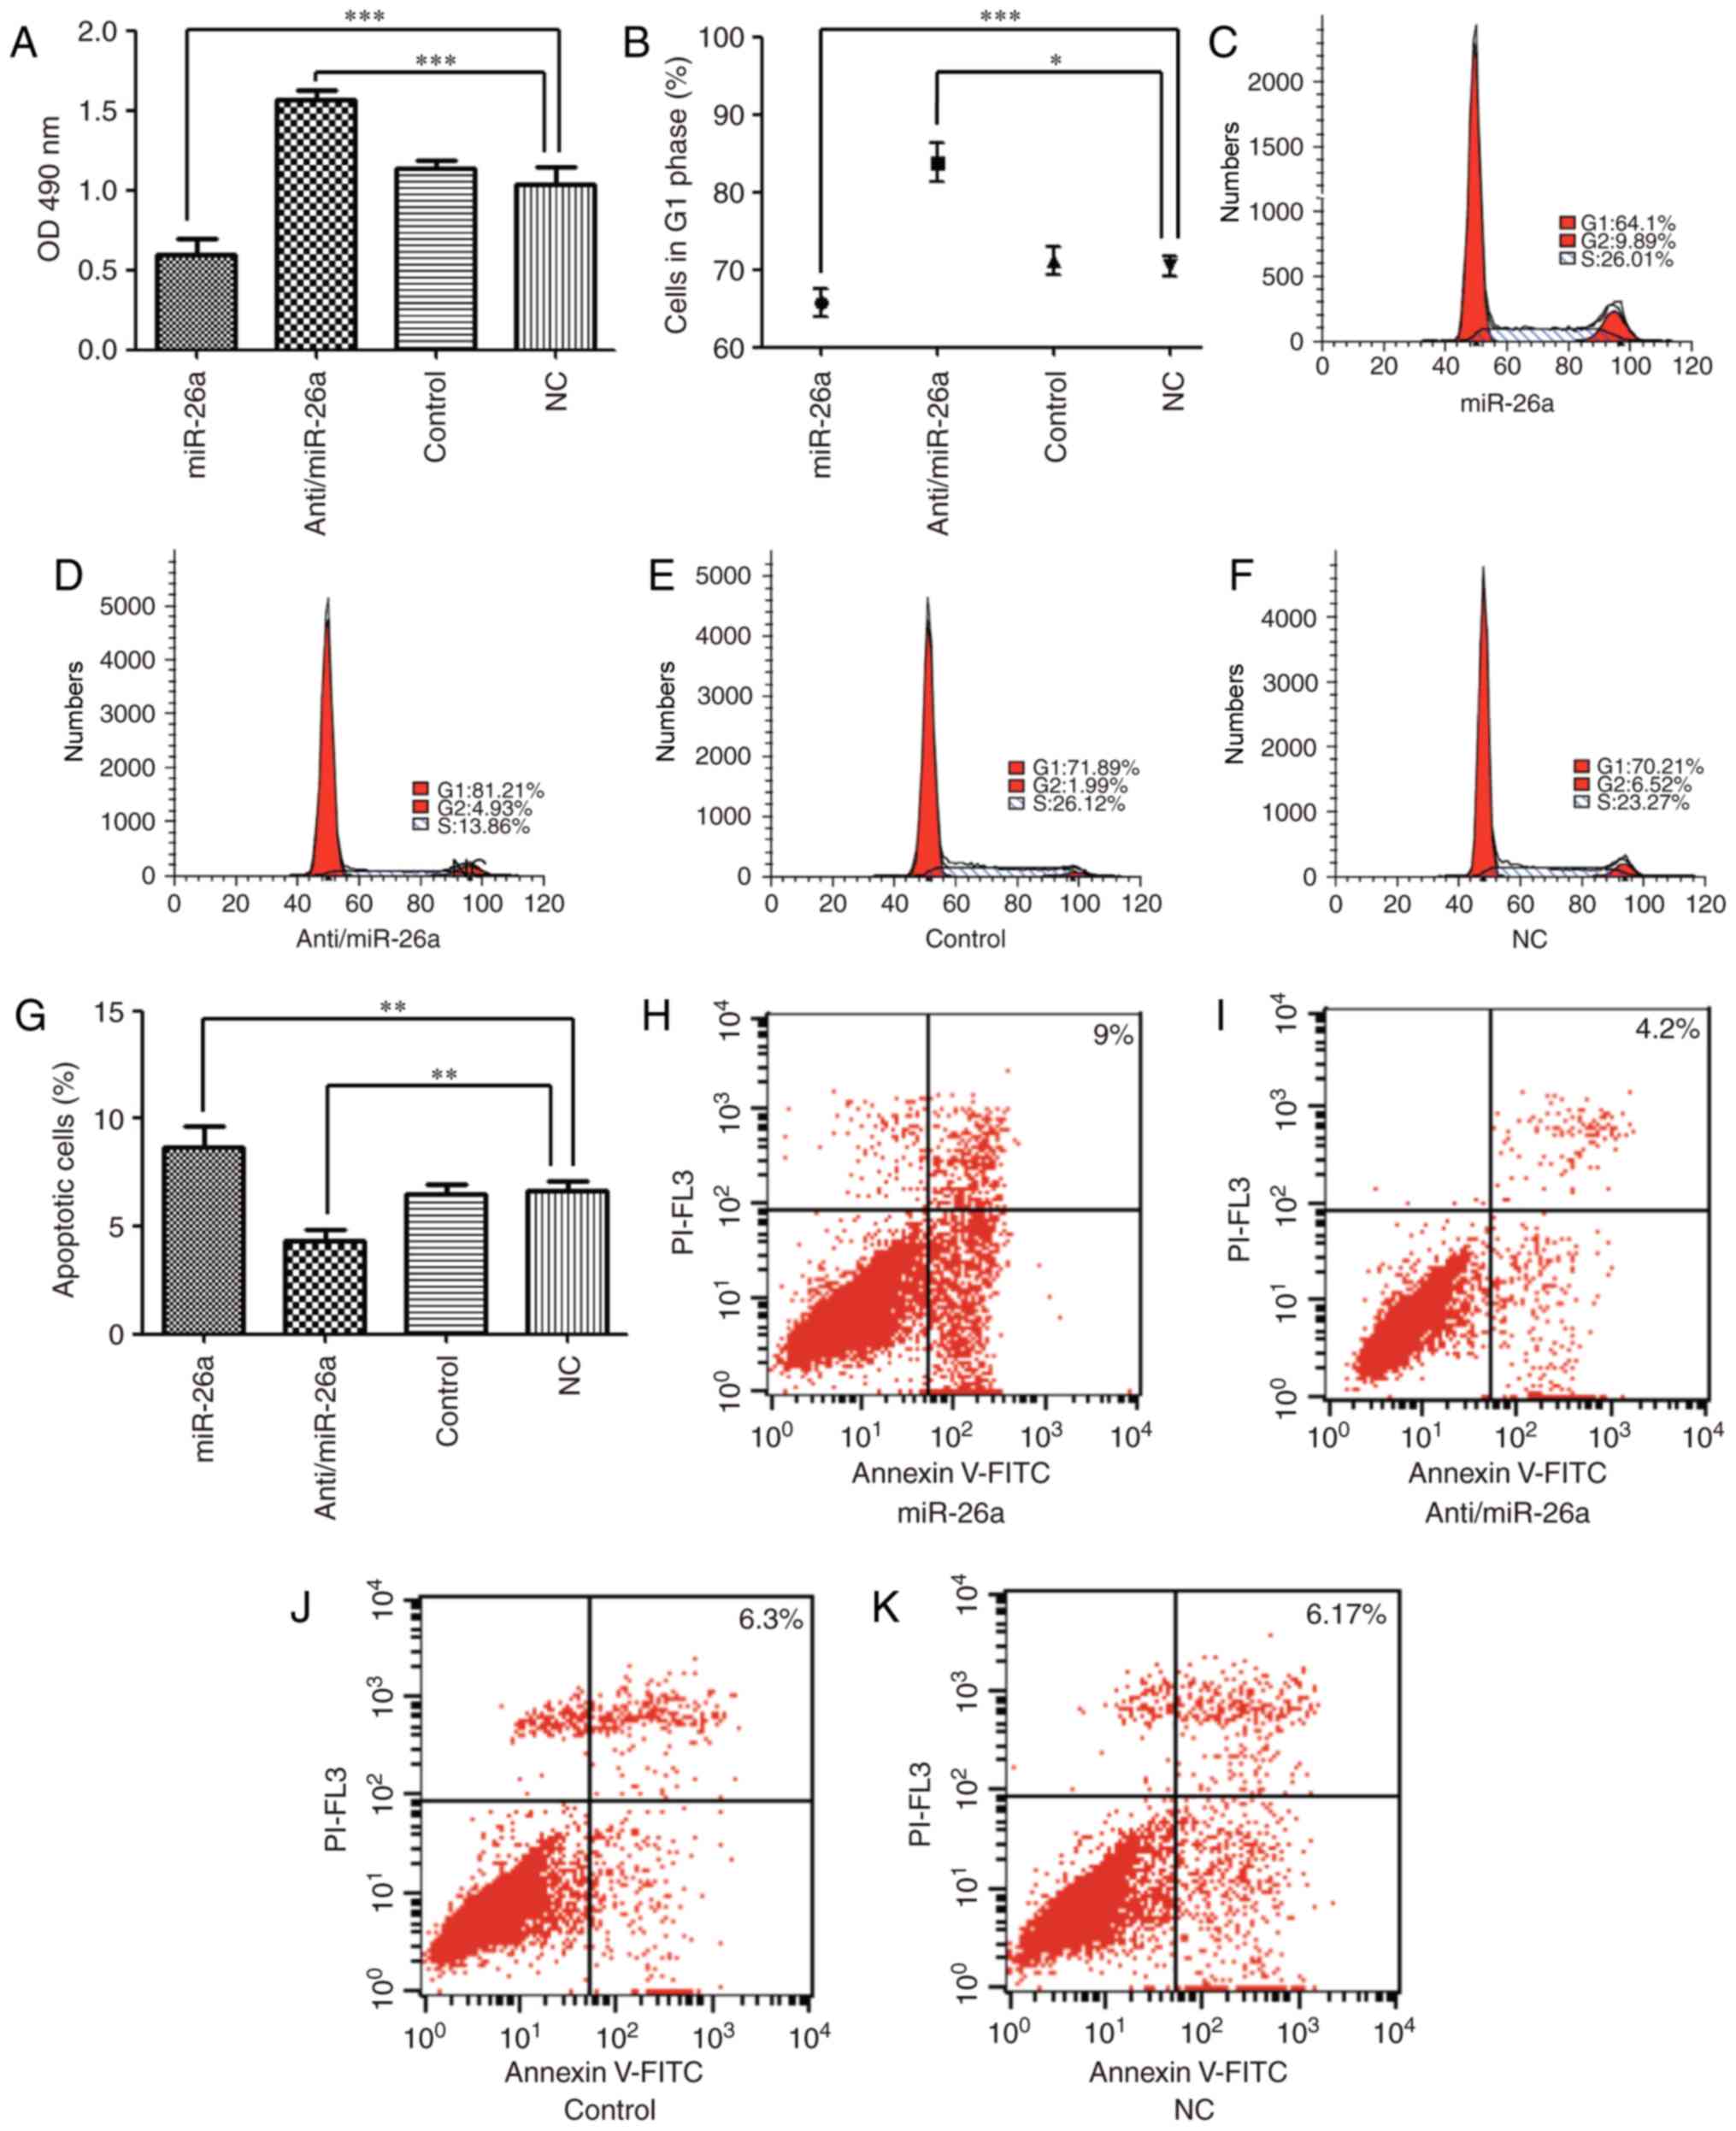 | Figure 2Effect of miR-26a on hepatocyte
proliferation, cell cycle and apoptosis. (A) Cell proliferation was
assessed by MTS assay at 72 h after transfection. (B) Cell cycle
was examined by flow cytometry at 72 h after transfection in the
(C) miR-26a group, (D) anti/miR-26a, (E) control group and (F) NC
group. (G) Apoptotic cells was examined by flow cytometry at 72 h
after transfection in the (H) miR-26a group, (I) anti/miR-26a
group, (J) control group and (K) NC group. *P<0.05,
**P<0.01 and ***P<0.001. miR, microRNA;
FITC, fluorescein isothiocyanate; NC, negative control; OD, optical
density. |
Effect of miR-26a on the expression of
mdm2, p53, p21 and p27
To investigate the mechanism by which miR-26a
modulates LR, the expression of mdm2, p53, p21 and p27 was analysed
by RT-qPCR and western blotting. The results demonstrated that mdm2
expression was significantly decreased in the miR-26a group when
compared with the NC group (0.54±0.03 vs. 1.04±0.03; P<0.001),
whereas mdm2 expression was significantly increased in anti/miR-26a
group (1.52±0.11; P<0.001). No difference in mdm2 expression
between control (1.06±0.08) and NC groups were observed (Fig. 3A). p53 expression was
significantly increased in the miR-26a group when compared with the
NC group (1.3±0.09 vs. 1.02±0.02; P<0.001), whereas p53
expression was significantly decreased in the anti/miR-26a group
(0.53±0.09; P<0.001). No difference in p53 expression between
the control (1.03±0.07) and NC groups was observed (Fig. 3B). p27 expression was
significantly increased in the miR-26a group when compared with the
NC group (1.32±0.06 vs. 1.04±0.03; P<0.001), whereas the
anti/miR-26a groups exhibited significantly lower p27 expression
levels (0.46±0.06; P<0.001). No difference between the control
(1.02±0.07) and NC groups was observed (Fig. 3C). p21 expression was also
significantly increased in the miR-26a group when compared with the
NC group (1.24±0.06 vs. 1.02±0.05; P<0.001), whereas the
anti/miR-26a group exhibited significantly lower p21 expression
levels (0.45±0.04; P<0.001). No difference between the control
(1.02±0.07) and NC groups was observed (Fig. 3D).
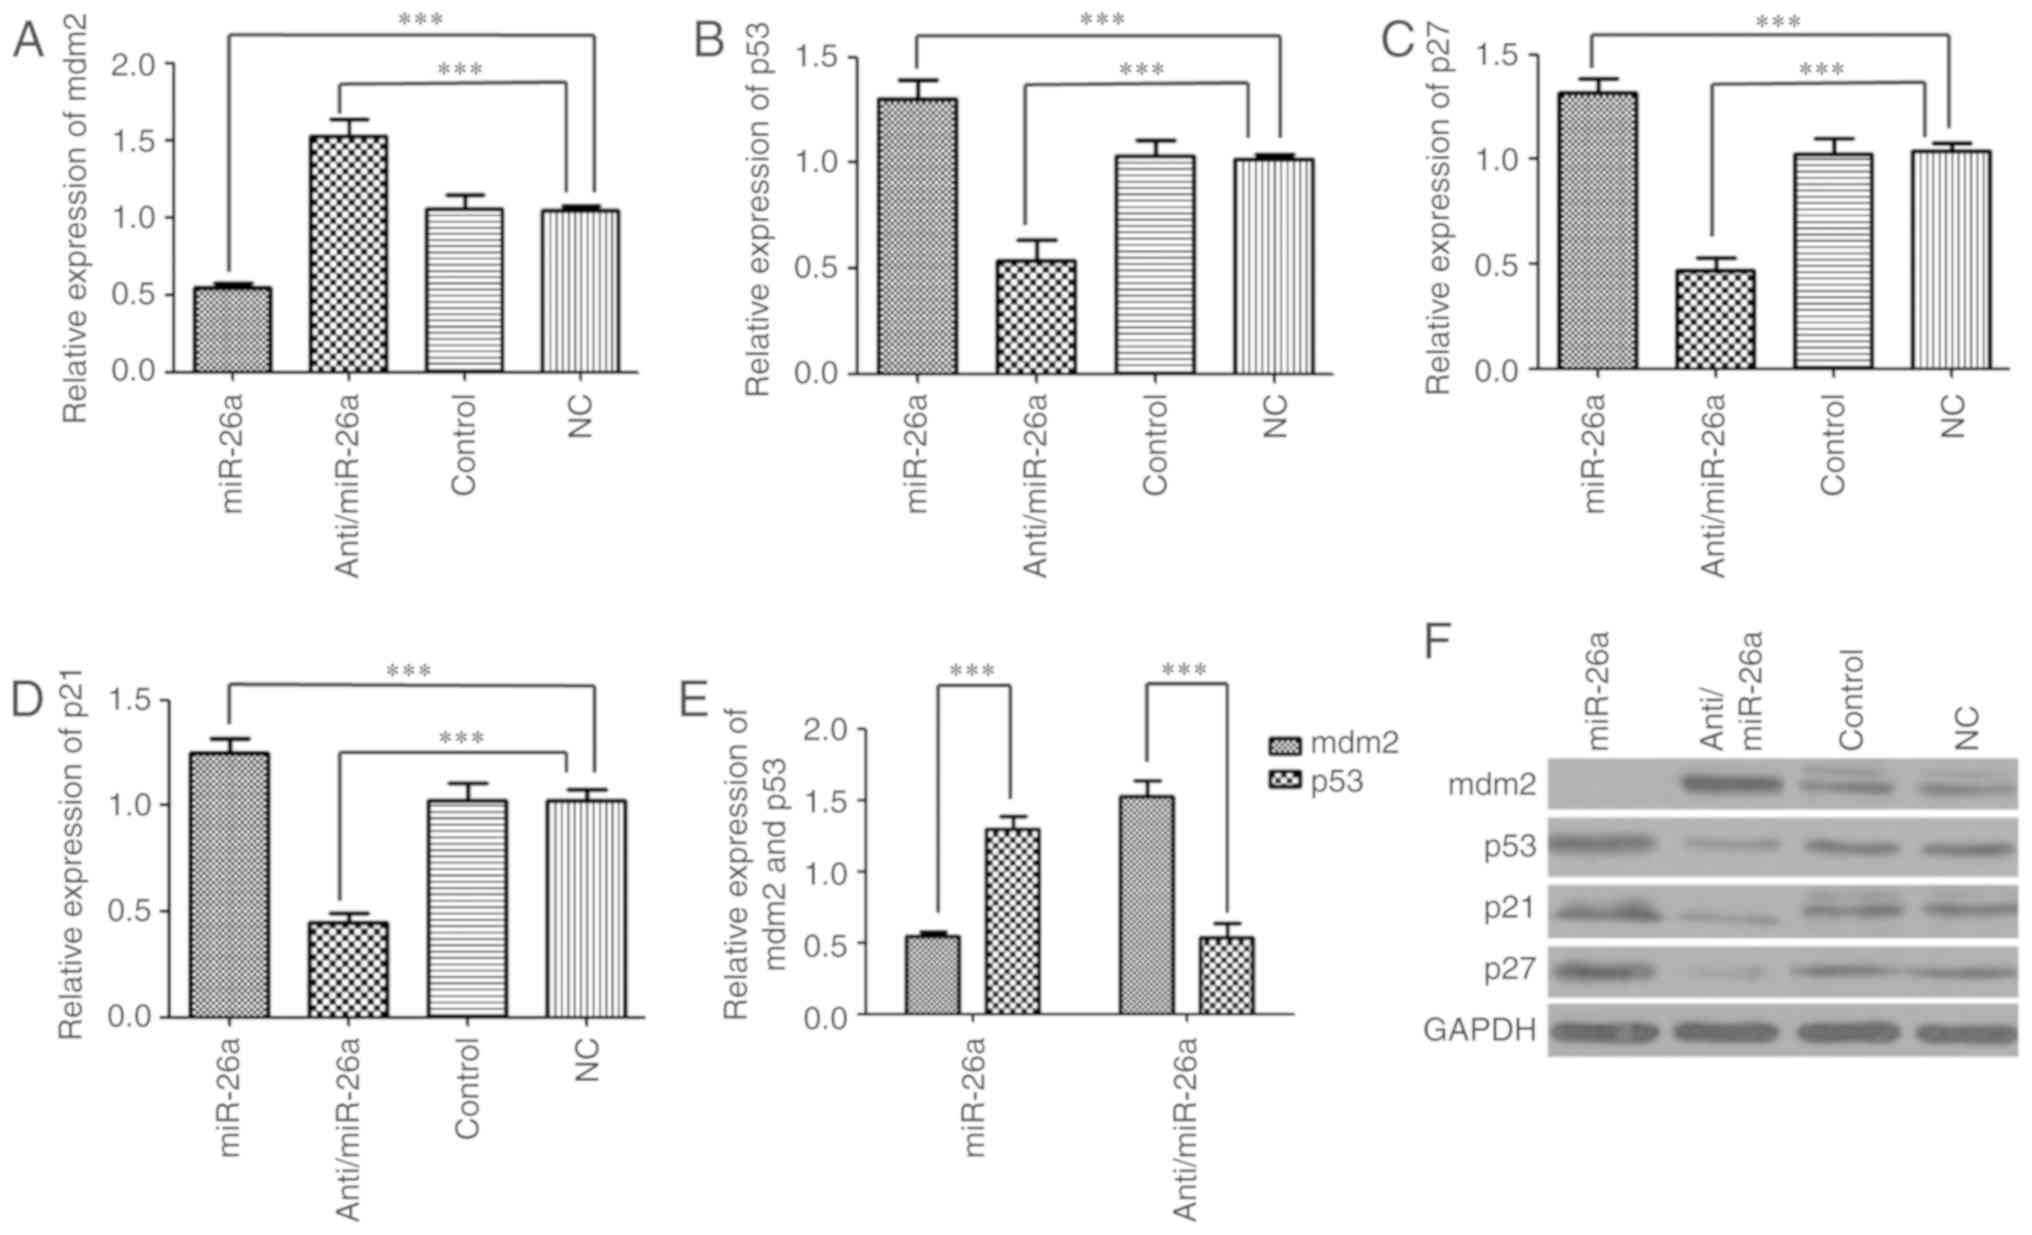 | Figure 3Effect of miR-26a on the expression
of mdm2, p53, p21 and p27. (A) Relative expression of mdm2 was
assessed in the miR-26a group, anti/miR-26a group, NC group and
control group at 72 h transfection by reverse
transcription-quantitative PCR. (B) P53 expression was assessed in
the miR-26a group, anti/miR-26a group, NC group and control group.
(C) P27 was assessed in the miR-26a group, anti/miR-26a group, NC
group and control group. (D) P21 was assessed in the miR-26a group,
anti/miR-26a group, NC group and control group. (E) Validation of
mdm2/p53 negative feedback loop in liver regeneration by miR-26a.
(F) Detection of protein levels of related genes regulated by
miR-26a. GAPDH was used as loading control.
***P<0.001. miR, microRNA; mdm2, E3 ubiquitin-protein
ligase Mdm2; NC, negative control. |
To identify the presence of the mdm2/p53 negative
feedback loop, mdm2 and p53 expression changes were analysed. The
results indicated that increased expression of mdm2 was accompanied
by decreased expression of p53 (P<0.001), and conversely, a
decrease in mdm2 expression was associated with increased
expression of p53 (P<0.001). This suggests that the mdm2/p53
negative feedback loop may be activated in response to hepatocyte
proliferation by miR-26a (Fig.
3E). Similar results were observed following western blot
analysis (Fig. 3F). Collectively,
these results verify the presence of the mdm2/p53 negative feedback
loop, which, together with p21 and p27, may be regulated by
miR-26a. miR-26a may therefore present a novel factor that
regulates the mdm2/p53 feedback loop.
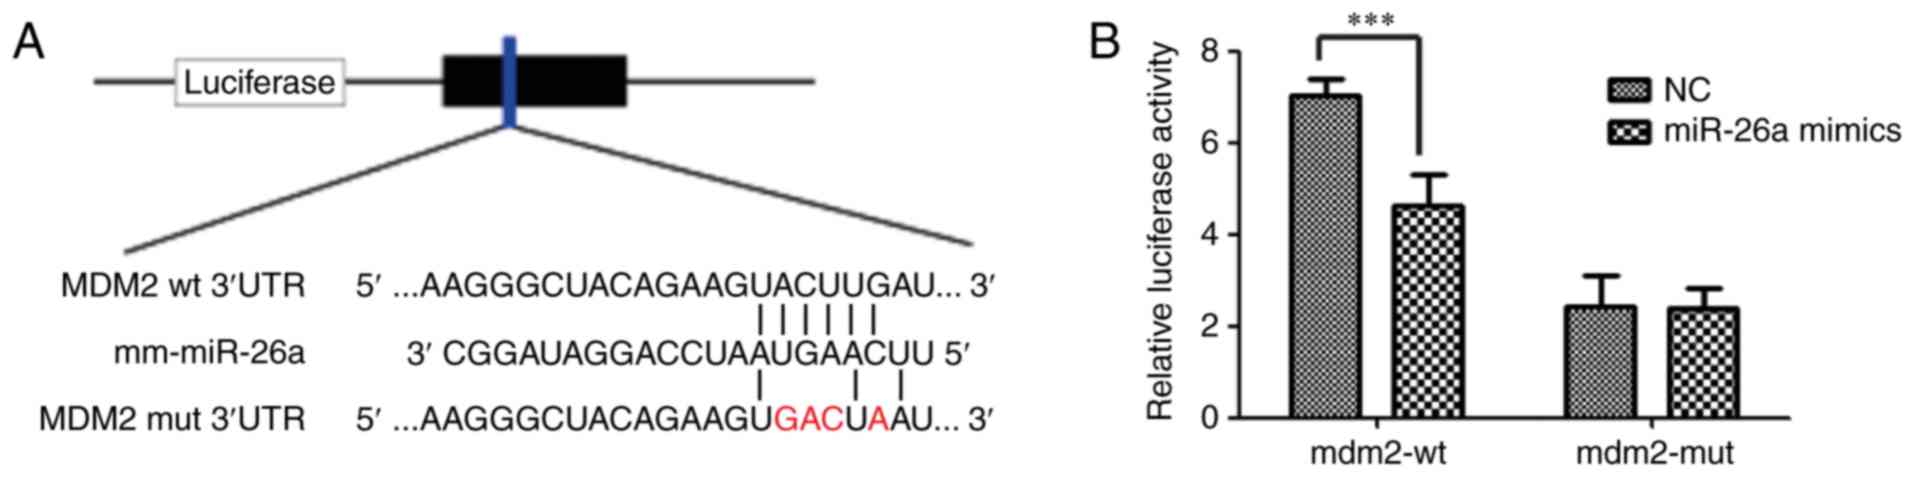
miR-26a targets mdm2 by directly binding
to its 3′-UTR
To elucidate the molecular mechanisms by which
miR-26a leads to an accumulation of p53, putative targets of
miR-26a were identified using miRanda, TargetScan and PicTar
databases (21-23). The results demonstrated that the
3′-UTR of mdm2, a negative regulator of p53, contains one predicted
miRNA-responsive element with regions that matched the seed
sequences of miR-26a. Full-length mdm2 mRNA 3′-UTR fragments
(containing wild-type and mutated miR-26a binding site sequences)
were generated and inserted immediately downstream of the
luciferase reporter gene. miR-26a mimics or control RNA were then
co-transfected into 293AD cells with the different
luciferase-3′-UTR constructs. The seed sequences (both wild-type
and mutant) of the mdm2 3′-UTR are presented in Fig. 4A. A significant difference in
relative luciferase activity between the miR-26a mimics group and
normal control (NC) group in cells transfected with the wild-type
mdm2 3′-UTR sequence was observed (4.08±0.85 vs. 7.08±0.28;
P<0.001). By contrast, no difference in relative luciferase
activity was observed between these groups in cells transfected
with the mutant mdm2 3′-UTR construct (3.47±0.96 vs. 3.37±0.94;
Fig. 4B). These results indicate
that miR-26a may target mdm2 by directly binding to its 3′-UTR.
Effect of mdm2 on LR
To determine whether mdm2 may serve a key role in
LR, the effect of Ad5/mdm2-siRNA, Ad5/mdm2-cDNA and Ad5/negative
control vector trans-fection on LR and liver function was
investigated in vivo. The results demonstrated that the LBWR
was significantly increased in the mdm2-cDNA group compared with NC
group (2.83±0.27 vs. 1.46±0.06; P<0.001), whereas the LBWR was
significantly decreased in the mdm2-siRNA group (1.05±0.16;
P<0.05). No difference in LBWR was observed between the control
(1.55±0.15) and NC groups (Fig.
5A). At the same time, the Ki-67 index was significantly
increased in the mdm2-cDNA group when compared with NC group
(76.96±1.6 vs. 56.86±1.56; P<0.001), whereas the Ki-67 was
significantly decreased in the mdm2-siRNA group (30.5±0.81;
P<0.001). No difference in Ki-67 was observed between the
control (56.9±1.05) and NC groups (Fig. 5B). AST levels were significantly
decreased in the mdm2-cDNA group compared with the NC group (320±20
vs. 419±9; P<0.01), whereas AST levels were significantly
increased in the mdm2-siRNA group (503±61; P<0.05). No
difference in AST levels between the control (412±11) and NC groups
was observed (Fig. 5C). ALT
levels were significantly decreased in the mdm2-cDNA group compared
with the NC group (206±25 vs. 277±18; P<0.01), whereas ALT
levels were significantly increased in the mdm2-siRNA group
(367±30; P<.01). No difference between the control (268±21) and
NC group was observed (Fig. 5D).
Tbil was significantly decreased in the mdm2-cDNA group compared
with the NC group (0.29±0.03 vs. 0.45±0.03; P<0.01), whereas
Tbil was significantly increased in the mdm2-siRNA group
(0.53±0.04; P<0.05). No difference between the control
(0.42±0.03) and NC groups were observed (Fig. 5E). Collectively, these results
indicate that mdm2 serves a key role in LR.
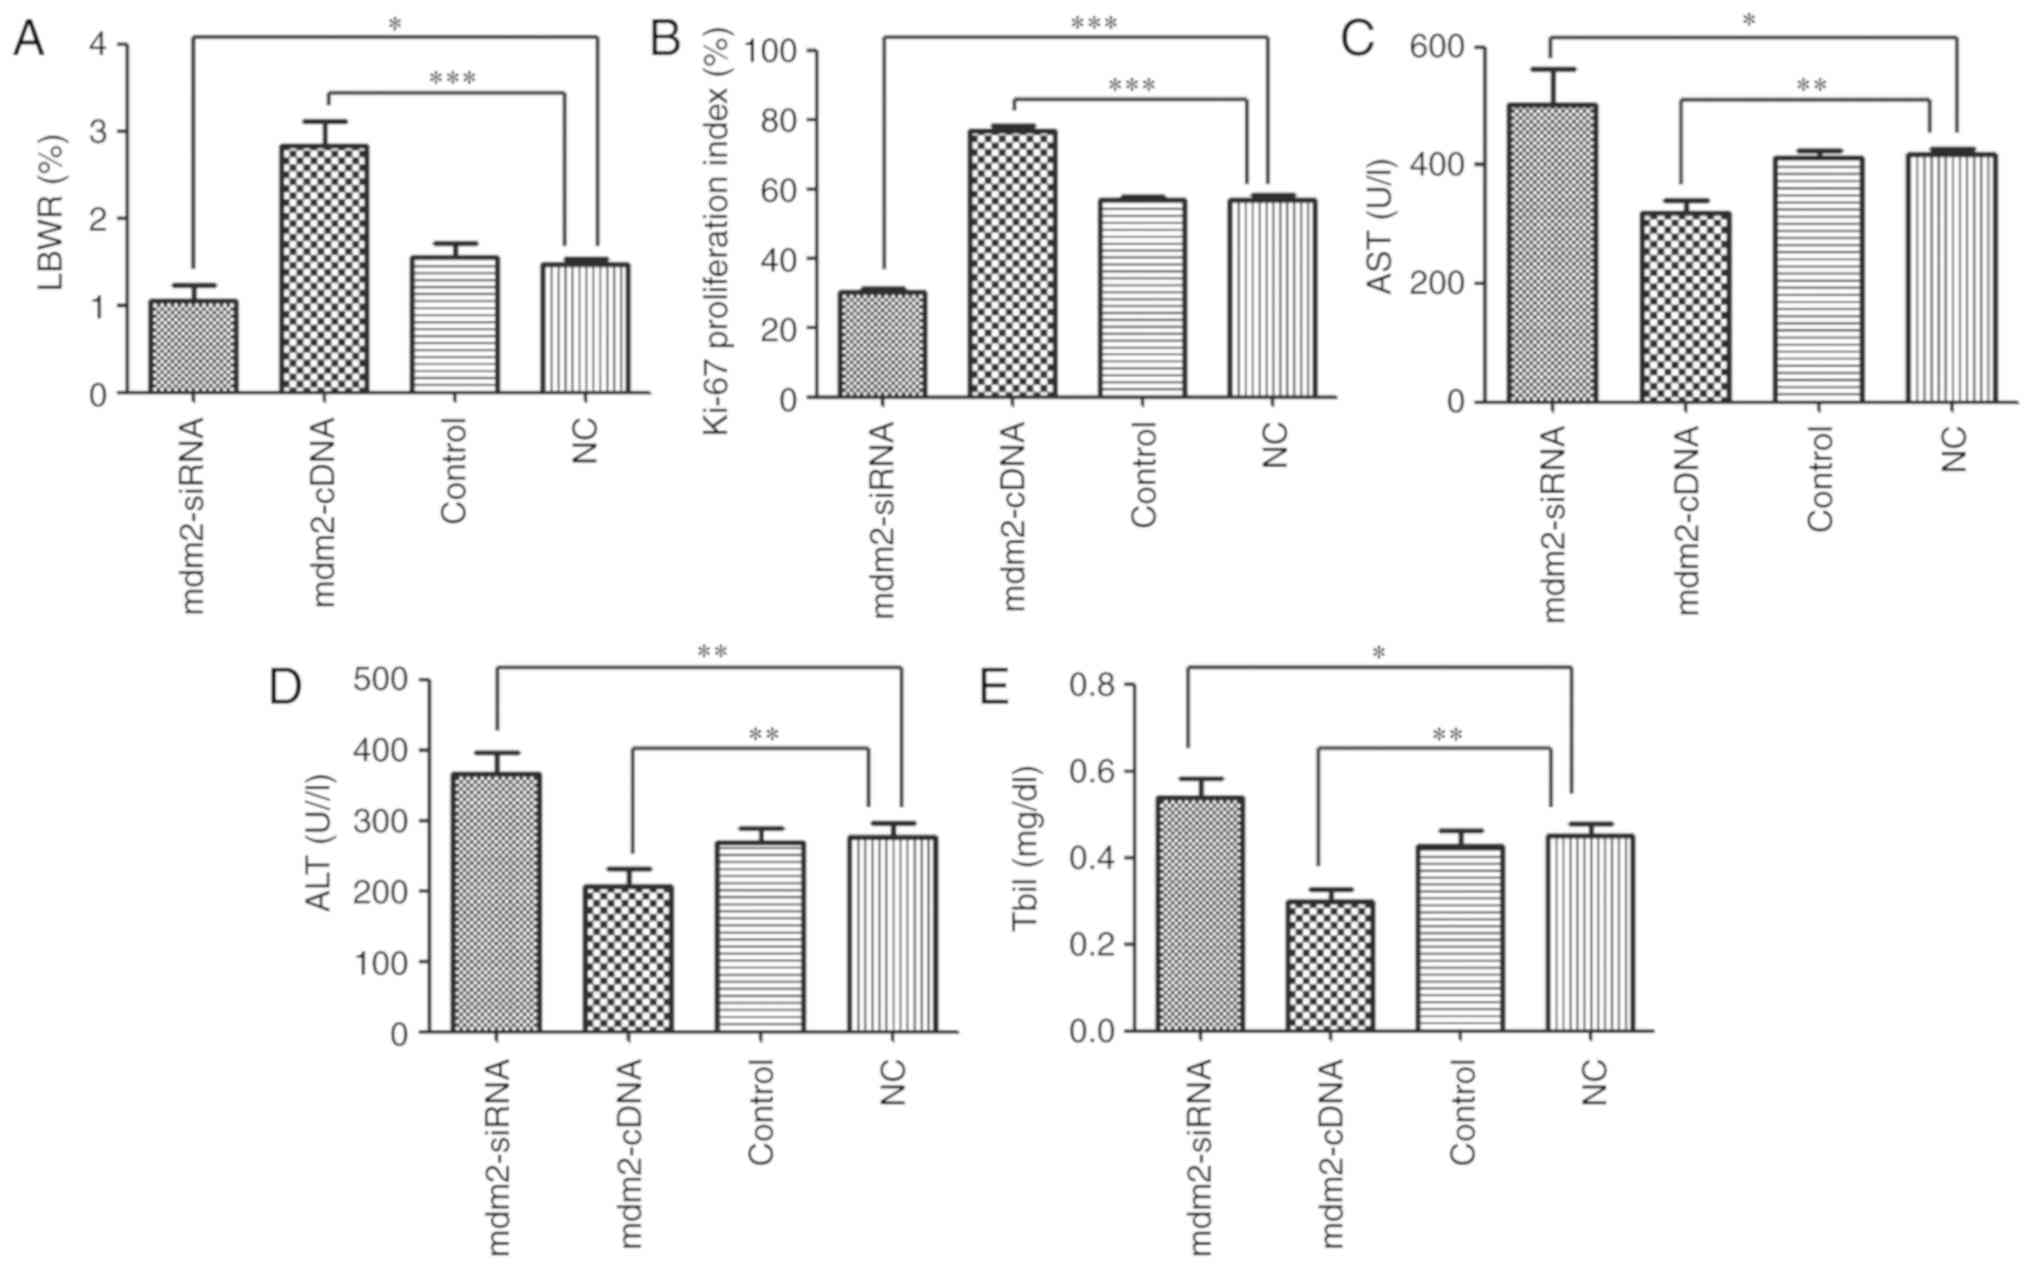 | Figure 5Effect of mdm2 on liver regeneration.
(A) Liver-to-body weight ratio was assessed in mdm2-cDNA group,
mdm2-siRNA group, NC group and control group. (B) The Ki-67
proliferation index following 70% partial hepatectomy in mdm2-cDNA
group, mdm2-siRNA group, NC group and control group. (C) AST was
tested in mdm2-cDNA group, mdm2-siRNA group, NC group and control
group. (D) ALT was tested in mdm2-cDNA group, mdm2-siRNA group, NC
group and control group. (E) Tbil was assessed in mdm2-cDNA group,
mdm2-siRNA group, NC group and control group.
*P<0.05, **P<0.01 and
***P<0.001. miR, microRNA; mdm2, E3 ubiquitin-protein
ligase Mdm2; NC, negative control; si, small interfering; Tbil,
total bilirubin; ALT, alanine aminotransferase; AST, aspartate
aminotransferase. |
Effect of mdm2 on the p53 network and
miR-26a expression
To investigate the effect of mdm2 on the p53 network
and miR-26a expression, the expression levels of p53, p21, p27 and
miR-26a following transfection with Ad5/mdm2-siRNA, Ad5/mdm2-cDNA
vector or NC was examined in vitro. The results demonstrated
that p53 expression was significantly decreased in the mdm2-cDNA
group compared with the NC group (0.58±0.08 vs. 0.84±0.04;
P<0.001), whereas increased p53 expression was observed in the
mdm2-siRNA group (1.3±0.11; P<0.001). No difference between the
control (0.88±0.06) and NC groups were observed (Fig. 6A). p21 expression was
significantly decreased in the mdm2-cDNA group when compared with
the NC group (0.55±0.08 vs. 0.99±0.02; P<0.001), whereas a
significant increase in p21 expression was observed in the
mdm2-siRNA group (1.29±0.06; P<0.001). No difference between the
control (0.99±0.02) and NC groups was observed (Fig. 6B). p27 expression was
significantly decreased in the mdm2-cDNA group when compared with
the NC group (0.62±0.11 vs. 0.94±0.07; P<0.001), whereas a
significant increase in p27 expression was observed in the
mdm2-siRNA group (1.31±0.02; P<0.001). No difference between the
control (0.95±0.09) and NC groups was observed (Fig. 6C). The expression of miR-26a among
all experimental groups was not statistically different (Fig. 6D). Consistent with these
observations, the same expression patterns were observed following
western blot analysis (Fig. 6E).
Collectively, these results suggest that mdm2 exerts a negative
regulatory effect on p53, p21 and p27, but not miR-26a.
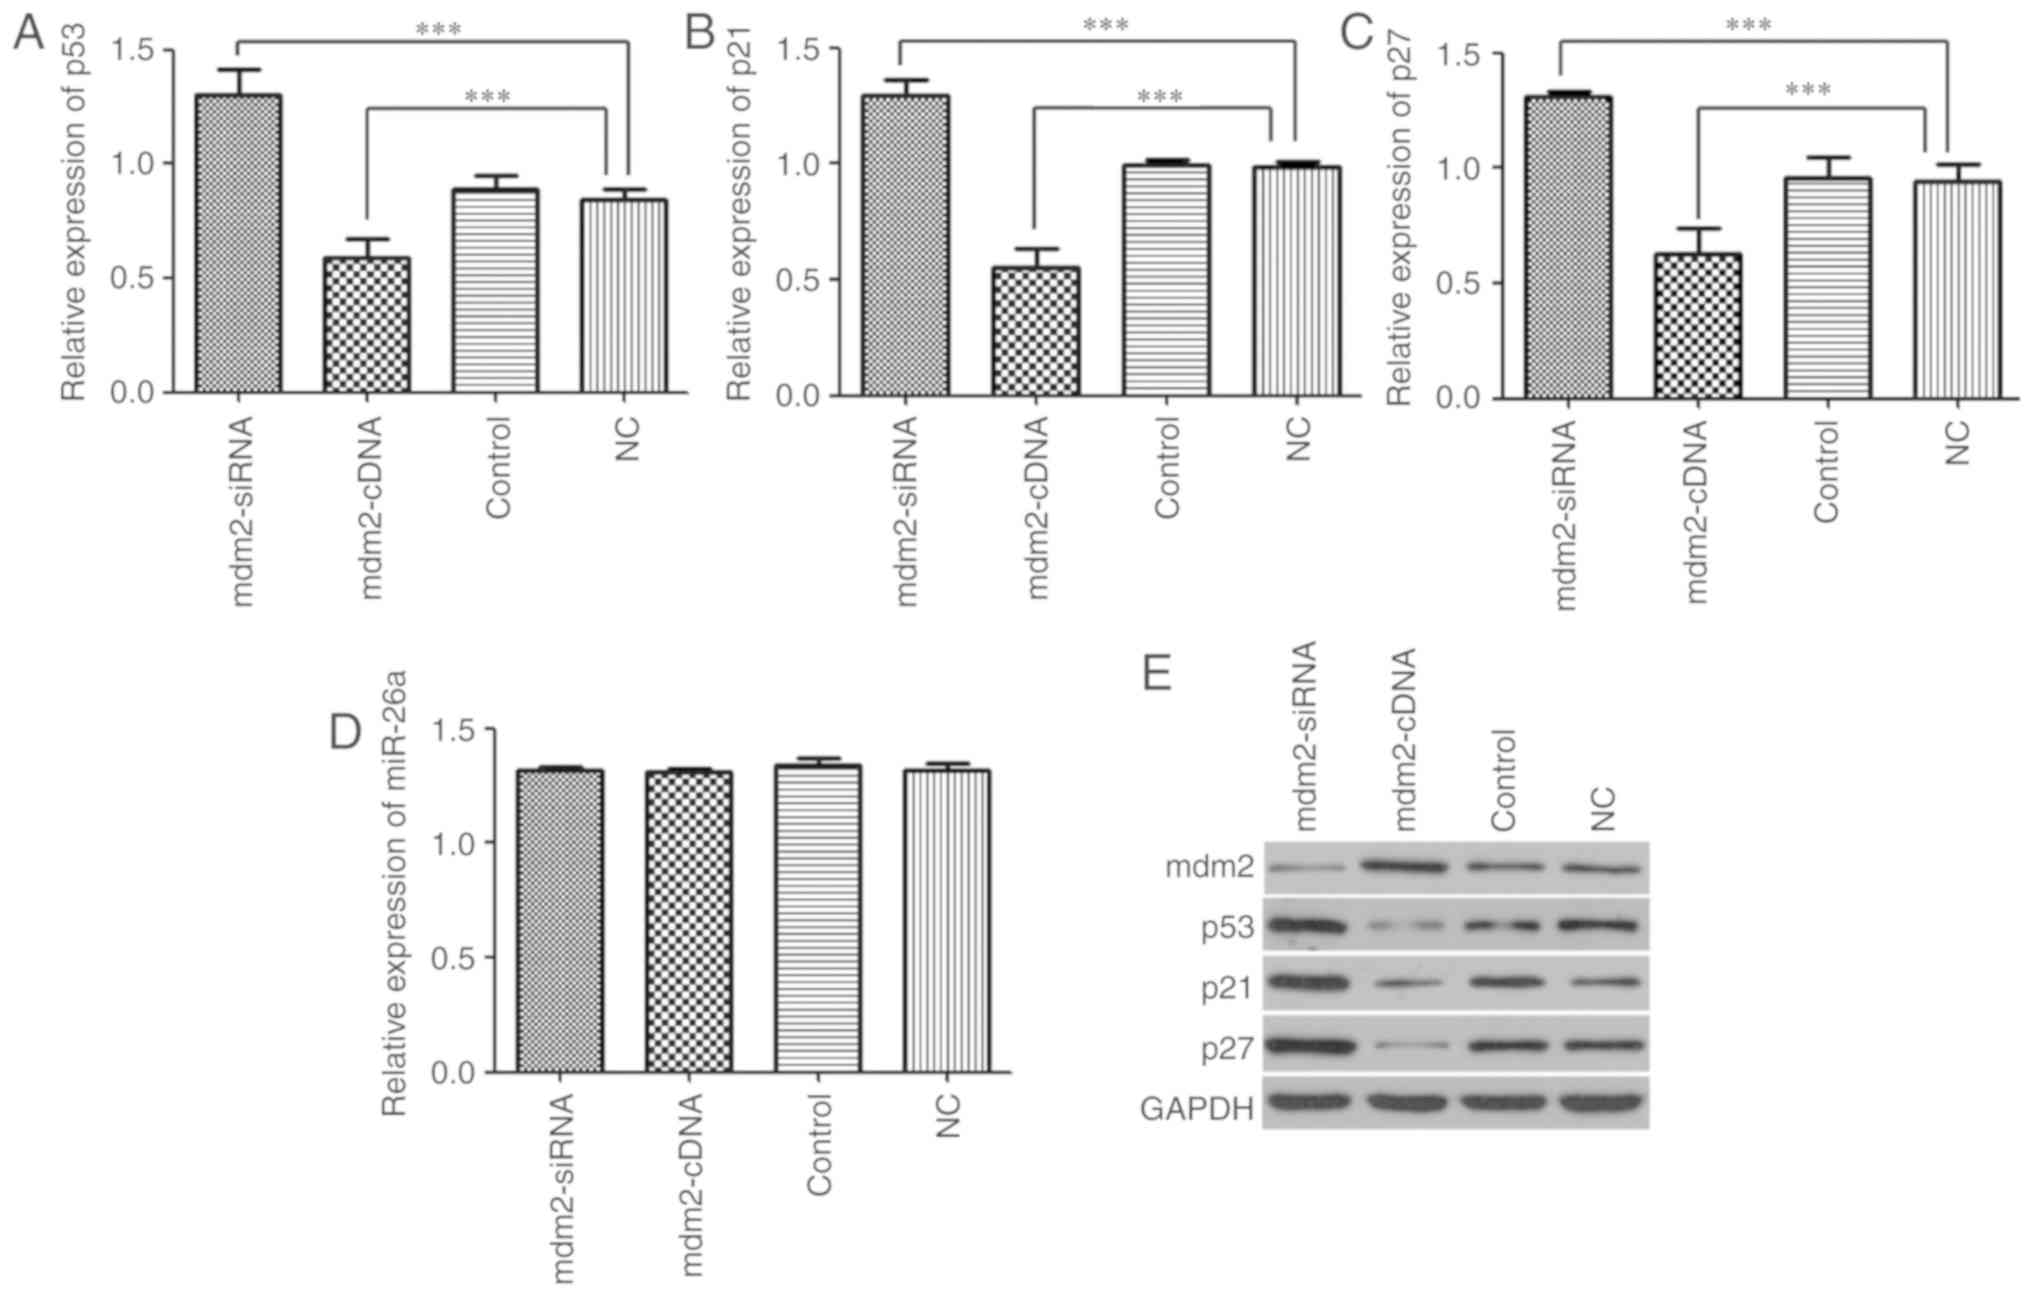 | Figure 6Effect of mdm2 on p53 network and
miR-26a expression. (A) Expression of p53 was assessed in mdm2-cDNA
group, mdm2-siRNA group, NC group and control group by reverse
transcription-quantitative PCR. (B) Expression of p21 was assessed
in mdm2-cDNA group, mdm2-siRNA group, NC group and control group.
(C) Expression of p27 was assessed in mdm2-cDNA group, mdm2-siRNA
group, NC group and control group. (D) miR-26a was assessed in
mdm2-cDNA group, mdm2-siRNA group, NC group and control group. (E)
Protein level of p53, p21 and p27 was assessed by western blotting.
GAPDH was used as a loading control. ***P<0.001. miR,
microRNA; mdm2, E3 ubiquitin-protein ligase Mdm2; NC, negative
control; si, small interfering. |
Discussion
It is known that miRs bind to partially
complementary sites in the 3′-UTRs of target genes, which leads to
the translational repression of target genes. To date, several miRs
that target mdm2 have been identified, including miR-25, miR-605,
miR-32, and miR-143/145 (24-26). miR-605 has also been identified as
a transcriptional target of p53, and it was demonstrated that
overexpression of miR-605 directly reduces mdm2 levels and enhances
p53 function (26). The results
of the current study also demonstrate that overexpression of
miR-26a directly decreases mdm2 levels and promotes p53 function.
Therefore, these miRs form feedback loops with mdm2/p53 to decrease
mdm2 protein levels and promote p53 function. Although each
cellular response, including cell cycle arrest, apoptosis, DNA
repair and senescence, has its own detector and signalling pathway,
each involves a common factor; the mdm2 protein. Positive or
negative regulation of the mdm2 protein in turn regulates p53
levels.
To investigate the importance of mdm2 activation in
LR in the current study, a 70% PH mouse model was generated and
mice were injected with Ad5/mdm2-siRNA or Ad5/mdm2-cDNA vectors.
The results demonstrated that mdm2 serves a key role in promoting
LR. mdm2 was originally identified in a spontaneously transformed
mouse 3T3 cell line (27). Its
role has become central to its putative function as an oncogene.
mdm2 has been extensively described as a physiologic antagonist of
p53, as it binds the N-terminal of p53 and blocks the
transactivation domain required for p53 transcriptional activity
(8,28). When activated, p53 positively
regulates mdm2 gene expression (11). However, mdm2 appears to exert a
broader biological role. A number of recent studies investigating
the effect of mdm2 overexpression in cell lines have demonstrated
that mdm2 may be antiproliferative under certain circumstances
(29,30).
It is well established that multiple cellular
stresses can disrupt the mdm2/p53 interaction. Proteins involved in
the DNA damage response enhance p53 stability and activation
through a series of post-translational modifications on mdm2 and
p53 (31,32). mdm2 is encoded by genes that are
responsive to p53 transactivation (33-35) and promotes the growth of normal
cells to maintain sufficient cell numbers in specific adult tissues
by inhibiting p53 activity. Several transfection studies have
revealed that the mdm2 protein binds to the p53 transcription
factor and sequesters it from p53 target gene promoters in
vitro (8,36,37). The present study investigated the
effect miR-26a on mdm2 and p53 and subsequent hepatocyte
proliferation, and the results indicated that the mdm2/p53 negative
feedback loop was activated in response to hepato-cyte
proliferation by miR-26a.
Studies have demonstrated that p53 regulates the
growth of mammalian cells by altering the expression of numerous
genes that affect cellular proliferation, apoptosis, metabolism and
senescence (38,39). Given that p53 affects a number of
different cellular functions directly and indirectly involved in
cell growth, p53 has been termed the 'guardian of the genome', as
it functions as a tumour suppressor and prevents the transmission
of mutations to subsequent generations of cells (40-42). p21, a potent cyclin-dependent
kinase (CDK) inhibitor, is one of the most well-studied downstream
target genes of p53 (43), It was
reported that enhanced expression of p21 and p27 proteins leads to
cell cycle arrest in the G1 phase by inhibiting CDK1, CDK2 and
CDK4/6 (44-47). Cell cycle progression is primarily
controlled by activation of several CDKs, which is also modulated
by p21, p27 and p53 (48). In
addition, increased expression of p53 enhances p21 expression
(49). The results of the present
study demonstrated that p53, p21 and p27 expression was positively
correlated with miR-26a expression in LR, but negatively correlated
with mdm2 expression. In addition, mdm2 negatively regulates p53,
p21 and p27, but not miR-26a.
There are two limitations of the current study.
Firstly, primary hepatocytes were not used for the in vitro
experiments. Secondly, only one cell line was used in the present
study. Results from several hepatocyte cell lines would increase
the current understanding of the effects of miR-26a on hepatocyte
proliferation. However, it should be noted that all in vivo
results were consistent with the major in vitro
observations.
In conclusion, the results of the current study are
the first to demonstrate that the mdm2/p53 negative feedback loop
may be targeted by miR-26a directly in response to LR, and mdm2
exerts a negative regulatory effect on p53, p21 and p27, but not
miR-26a. miR-26a may present a novel factor that regulates the
mdm2/p53 feedback loop. These results provide a novel insight into
the role of miR-26a in p53-mediated regulation of LR.
Acknowledgments
Not applicable.
Funding
The present study was supported by grants from the
Ph.D. Programs Foundation of Ministry of Education of China (grant.
no. 20130171120076), the National Natural Science Foundation of
China (grant. no. 81400655), the Natural Science Foundation of
Guangdong Province (grant. no. 2015A030313023) and the Science and
Technology Project of Guangdong Province (grant. no.
2017A020215166).
Availability of data and materials
All data used and/or analysed during the present
study are available from the corresponding author on reasonable
request.
Authors' contributions
JZ made substantial contributions to the design of
this study and wrote the manuscript. JZ, ZL, YH and WJ performed
experiments. DW and XZ performed data analysis. JZ and XH
interpreted the data. JZ, XZ and XH revised the critically. All
authors read and approved the final manuscript and agreed to the
publication of the final manuscript.
Ethics approval and consent to
participate
All experimental protocols involving animals were
approved by the Ethics Committee of the First Affiliated Hospital
of Sun Yat-sen University (Guangzhou, China).
Patient consent for publication
Not applicable.
Competing interests
The authors declare that they have no competing
interests.
References
|
1
|
Port JD and Sucharov C: Role of microRNAs
in cardiovascular disease: Therapeutic challenges and potentials. J
Cardiovasc Pharmacol. 56:444–453. 2010. View Article : Google Scholar : PubMed/NCBI
|
|
2
|
Lynn FC: Meta-regulation: MicroRNA
regulation of glucose and lipid metabolism. Trends Endocrinol
Metab. 20:452–459. 2009. View Article : Google Scholar : PubMed/NCBI
|
|
3
|
Pager CT, Wehner KA, Fuchs G and Sarnow P:
MicroRNA-mediated gene silencing. Prog Mol Biol Transl Sci.
90:187–210. 2009. View Article : Google Scholar : PubMed/NCBI
|
|
4
|
Hammond SM: MicroRNA therapeutics: A new
niche for antisense nucleic acids. Trends Mol Med. 12:99–101. 2006.
View Article : Google Scholar : PubMed/NCBI
|
|
5
|
He L and Hannon GJ: MicroRNAs: Small RNAs
with a big role in gene regulation. Nat Rev Genet. 5:522–531. 2004.
View Article : Google Scholar : PubMed/NCBI
|
|
6
|
Zhou J, Ju QW, Yuan XP, Zhu XF, Wang DP
and He XS: miR-26a regulates mouse hepatocyte proliferation via
directly targeting their 3′untranslated region of CCND2 and CCNE2.
Hepatobiliary Pancreat Dis Int. 15:65–72. 2016. View Article : Google Scholar : PubMed/NCBI
|
|
7
|
Zhou J, Ju W, Wang D, Wu L, Zhu X, Guo Z
and He X: Down-regulation of microRNA-26a promotes mouse hepatocyte
proliferation during liver regeneration. PLoS One. 7:e335772012.
View Article : Google Scholar : PubMed/NCBI
|
|
8
|
Momand J, Zambetti GP, Olson DC, George D
and Levine AJ: The mdm-2 oncogene product forms a complex with the
p53 protein and inhibits p53-mediated transactivation. Cell.
69:1237–1245. 1992. View Article : Google Scholar : PubMed/NCBI
|
|
9
|
Haupt Y, Maya R, Kazaz A and Oren M: Mdm2
promotes the rapid degradation of p53. Nature. 387:296–299. 1997.
View Article : Google Scholar : PubMed/NCBI
|
|
10
|
Eischen CM and Lozano G: p53 and MDM2:
Antagonists or partners in crime? Cancer Cell. 15:161–162. 2009.
View Article : Google Scholar : PubMed/NCBI
|
|
11
|
Barak Y, Juven T, Haffner R and Oren M:
Mdm2 expression is induced by wild-type p53 activity. EMBO J.
12:461–468. 1993. View Article : Google Scholar : PubMed/NCBI
|
|
12
|
Harris SL and Levine AJ: The p53 pathway:
Positive and negative feedback loops. Oncogene. 24:2899–2908. 2005.
View Article : Google Scholar : PubMed/NCBI
|
|
13
|
Cao LQ, Wang YN, Liang M and Pan MZ: CALB1
enhances the interaction between p53 and MDM2, and inhibits the
senescence of ovarian cancer cells. Mol Med Rep. 19:5097–5104.
2019.PubMed/NCBI
|
|
14
|
Xu X, Liu Q, Zhang C, Ren S, Xu L, Zhao Z,
Dou H, Li P, Zhang X, Gong Y and Shao C: Inhibition of DYRK1A-EGFR
axis by p53-MDM2 cascade mediates the induction of cellular
senescence. Cell Death Dis. 10:2822019. View Article : Google Scholar : PubMed/NCBI
|
|
15
|
Wurz RP and Cee VJ: Targeted degradation
of MDM2 as a new approach to improve the efficacy of MDM2-p53
inhibitors. J Med Chem. 62:445–447. 2019. View Article : Google Scholar
|
|
16
|
Shunchang S, Haitao C, Weidong C, Jingbo H
and Yunsheng P: Expression of truncated dystrophin cDNAs mediated
by a lentiviral vector. Neurol India. 56:52–56. 2008. View Article : Google Scholar : PubMed/NCBI
|
|
17
|
Guo J, Li M, Meng X, Sui J, Dou L, Tang W,
Huang X, Man Y, Wang S and Li J: miR-291b-3p induces apoptosis in
liver cell line NCTC1469 by reducing the level of RNA-binding
protein HuR. Cell Physiol Biochem. 33:810–822. 2014. View Article : Google Scholar : PubMed/NCBI
|
|
18
|
Mitchell C and Willenbring H: A
reproducible and well-tolerated method for 2/3 partial hepatectomy
in mice. Nat Protoc. 3:1167–1170. 2008. View Article : Google Scholar : PubMed/NCBI
|
|
19
|
Bockhorn M, Goralski M, Prokofiev D,
Dammann P, Grünewald P, Trippler M, Biglarnia A, Kamler M, Niehues
EM, Frilling A, et al: VEGF is important for early liver
regeneration after partial hepatectomy. J Surg Res. 138:291–299.
2007. View Article : Google Scholar : PubMed/NCBI
|
|
20
|
Livak KJ and Schmittgen TD: Analysis of
relative gene expression data using real-time quantitative PCR and
the 2(-Delta Delta C(T)) method. Methods. 25:402–408. 2001.
View Article : Google Scholar
|
|
21
|
Grimson A, Farh KK, Johnston WK,
Garrett-Engele P, Lim LP and Bartel DP: MicroRNA targeting
specificity in mammals: Determinants beyond seed pairing. Mol Cell.
27:91–105. 2007. View Article : Google Scholar : PubMed/NCBI
|
|
22
|
Betel D, Wilson M, Gabow A, Marks DS and
Sander C: The microRNA.org resource: Targets and expression.
Nucleic Acids Res. 36(Database issue): D149–D153. 2008. View Article : Google Scholar :
|
|
23
|
Krek A, Grün D, Poy MN, Wolf R, Rosenberg
L, Epstein EJ, MacMenamin P, da Piedade I, Gunsalus KC, Stoffel M
and Rajewsky N: Combinatorial microRNA target predictions. Nat
Genet. 37:495–500. 2005. View
Article : Google Scholar : PubMed/NCBI
|
|
24
|
Zhang J, Sun Q, Zhang Z, Ge S, Han ZG and
Chen WT: Loss of microRNA-143/145 disturbs cellular growth and
apoptosis of human epithelial cancers by impairing the MDM2-p53
feedback loop. Oncogene. 32:61–69. 2013. View Article : Google Scholar
|
|
25
|
Suh SS, Yoo JY, Nuovo GJ, Jeon YJ, Kim S,
Lee TJ, Kim T, Bakàcs A, Alder H, Kaur B, et al: MicroRNAs/TP53
feedback circuitry in glioblastoma multiforme. Proc Natl Acad Sci
USA. 109:5316–5321. 2012. View Article : Google Scholar : PubMed/NCBI
|
|
26
|
Xiao J, Lin H, Luo X and Wang Z: miR-605
joins p53 network to form a p53:miR-605:Mdm2 positive feedback loop
in response to stress. EMBO J. 30:524–532. 2011. View Article : Google Scholar : PubMed/NCBI
|
|
27
|
Cahilly-Snyder L, Yang-Feng T, Francke U
and George DL: Molecular analysis and chromosomal mapping of
amplified genes isolated from a transformed mouse 3T3 cell line.
Somat Cell Mol Genet. 13:235–244. 1987. View Article : Google Scholar : PubMed/NCBI
|
|
28
|
Chen J, Wu X, Lin J and Levine AJ: Mdm-2
inhibits the G1 arrest and apoptosis functions of the p53 tumor
suppressor protein. Mol Cell Biol. 16:2445–2452. 1996. View Article : Google Scholar : PubMed/NCBI
|
|
29
|
Brown DR, Thomas CA and Deb SP: The human
onco-protein MDM2 arrests the cell cycle: Elimination of its
cell-cycle-inhibitory function induces tumorigenesis. EMBO J.
17:2513–2525. 1998. View Article : Google Scholar : PubMed/NCBI
|
|
30
|
Dang J, Kuo ML, Eischen CM, Stepanova L,
Sherr CJ and Roussel MF: The RING domain of Mdm2 can inhibit cell
proliferation. Cancer Res. 62:1222–1230. 2002.PubMed/NCBI
|
|
31
|
Wade M, Wang YV and Wahl GM: The p53
orchestra: Mdm2 and Mdmx set the tone. Trends Cell Biol.
20:299–309. 2010. View Article : Google Scholar : PubMed/NCBI
|
|
32
|
Kruse JP and Gu W: Modes of p53
regulation. Cell. 137:609–622. 2009. View Article : Google Scholar : PubMed/NCBI
|
|
33
|
Juven T, Barak Y, Zauberman A, George DL
and Oren M: Wild-type p53 can mediate sequence-specific
transactivation of an internal promoter within the mdm2 gene.
Oncogene. 8:3411–3416. 1993.PubMed/NCBI
|
|
34
|
Wu X, Bayle JH, Olson D and Levine AJ: The
p53-mdm-2 auto-regulatory feedback loop. Genes Dev. 7:1126–1132.
1993. View Article : Google Scholar : PubMed/NCBI
|
|
35
|
Phillips A, Teunisse A, Lam S, Lodder K,
Darley M, Emaduddin M, Wolf A, Richter J, de Lange J, Verlaan-de
Vries M, et al: HDMX-L is expressed from a functional
p53-responsive promoter in the first intron of the HDMX gene and
participates in an autoregulatory feedback loop to control p53
activity. J Biol Chem. 285:29111–29127. 2010. View Article : Google Scholar : PubMed/NCBI
|
|
36
|
Oliner JD, Pietenpol JA, Thiagalingam S,
Gyuris J, Kinzler KW and Vogelstein B: Oncoprotein MDM2 conceals
the activation domain of tumour suppressor p53. Nature.
362:857–860. 1993. View Article : Google Scholar : PubMed/NCBI
|
|
37
|
Chen J, Lin J and Levine AJ: Regulation of
transcription functions of the p53 tumor suppressor by the mdm-2
oncogene. Mol Med. 1:142–152. 1995. View Article : Google Scholar : PubMed/NCBI
|
|
38
|
Vousden KH and Lu X: Live or let die: The
cell's response to p53. Nat Rev Cancer. 2:594–604. 2002. View Article : Google Scholar : PubMed/NCBI
|
|
39
|
Vousden KH and Ryan KM: p53 and
metabolism. Nat Rev Cancer. 9:691–700. 2009. View Article : Google Scholar : PubMed/NCBI
|
|
40
|
Lane DP: Cancer. p53, guardian of the
genome. Nature. 358:15–16. 1992. View Article : Google Scholar : PubMed/NCBI
|
|
41
|
Soussi T and Béroud C: Assessing TP53
status in human tumours to evaluate clinical outcome. Nat Rev
Cancer. 1:233–240. 2001. View Article : Google Scholar
|
|
42
|
Hollstein M, Sidransky D, Vogelstein B and
Harris CC: p53 mutations in human cancers. Science. 253:49–53.
1991. View Article : Google Scholar : PubMed/NCBI
|
|
43
|
Deng J, Yang M, Jiang R, An N, Wang X and
Liu B: Long non-coding RNA HOTAIR regulates the proliferation,
self-renewal capacity, tumor formation and migration of the cancer
stem-like cell (CSC) subpopulation enriched from breast cancer
cells. PLoS One. 12:e01708602017. View Article : Google Scholar : PubMed/NCBI
|
|
44
|
Nakae J, Kitamura T, Kitamura Y, Biggs WH
III, Arden KC and Accili D: The forkhead transcription factor Foxo1
regulates adipocyte differentiation. Dev Cell. 4:119–129. 2003.
View Article : Google Scholar : PubMed/NCBI
|
|
45
|
Dijkers PF, Medema RH, Pals C, Banerji L,
Thomas NS, Lam EW, Burgering BM, Raaijmakers JA, Lammers JW,
Koenderman L and Coffer PJ: Forkhead transcription factor FKHR-L1
modulates cytokine-dependent transcriptional regulation of
p27(KIP1). Mol Cell Biol. 20:9138–9148. 2000. View Article : Google Scholar : PubMed/NCBI
|
|
46
|
Ezhilarasan D, Evraerts J, Sid B, Calderon
PB, Karthikeyan S, Sokal E and Najimi M: Silibinin induces hepatic
stellate cell cycle arrest via enhancingp53/p27 and inhibiting Akt
downstream signaling protein expression. Hepatobiliary Pancreat Dis
Int. 16:80–87. 2017. View Article : Google Scholar : PubMed/NCBI
|
|
47
|
Gartel AL and Radhakrishnan SK: Lost in
transcription: p21 repression, mechanisms, and consequences. Cancer
Res. 65:3980–3985. 2005. View Article : Google Scholar : PubMed/NCBI
|
|
48
|
Hofseth LJ, Hussain SP and Harris CC: p53:
25 years after its discovery. Trends Pharmacol Sci. 25:177–181.
2004. View Article : Google Scholar : PubMed/NCBI
|
|
49
|
Saile B, Matthes N, El Armouche H,
Neubauer K and Ramadori G: The bcl, NFkappaB and p53/p21WAF1
systems are involved in spontaneous apoptosis and in the
anti-apoptotic effect of TGF-beta or TNF-alpha on activated hepatic
stellate cells. Eur J Cell Biol. 80:554–561. 2001. View Article : Google Scholar : PubMed/NCBI
|