Introduction
Lung cancer is one of the most aggressive cancers
and the world’s leading cause of cancer mortality. Nevertheless,
the treatment of lung cancer still remains unsatisfactory. The
5-year survival rate for lung cancer is reported to be less than
50% in Japan (1). Paclitaxel is a
potent anti-cancer agent that binds to β-tubulin and prevents
mitosis through microtubule over-stabilization. Paclitaxel is known
to be effective as a cancer chemotherapeutic agent for ovarian,
breast, gastric and lung cancers, but paclitaxel-based chemotherapy
for lung cancer is not as effective as it is for other cancer
types, with a response rate of 30–40% (2), since tumor cells develop mechanisms
of resistance to the agent.
Several mechanisms have been suggested for this
resistance to paclitaxel. The first mechanism reported as a
mediator of the resistance to paclitaxel was the overexpression of
the multidrug transporter gene, encoding for an efflux pump able to
efflux paclitaxel, thereby hampering drug retention. Studies have
shown that both the multidrug transporter ATP Binding Cassette,
sub-family B, member 1 (ABCB1, MDR1) (3,4) and
the ATP Binding Cassette, sub-family C, member 1 (ABCC1,
MRP1) (5) play a role in
enhancing the cellular efflux of anti-cancer drugs, including
paclitaxel. The second mechanism proposed indicated point mutation
in the β-tubulin gene at the paclitaxel binding site as being
responsible for the resistance to paclitaxel (6). A correlation was demonstrated between
β-tubulin point mutation and resistance to paclitaxel in lung
cancer patients (7). In
vitro studies on human cell lines demonstrated that the
resistance to paclitaxel resulted from mutations in human class I
(M40) β-tubulin, the predominant isotype, and class IVa β-tubulin,
thereby causing changes in the microtubule dynamics and stability
(8–15). Furthermore, altered expression
levels of tubulin isotypes have been associated with the
development of the resistance to paclitaxel (6,16).
Therefore, we addressed the issue of the mechanism of the
resistance to paclitaxel by employing three human non-small cell
lung cancer cell lines, each of which exhibited a different
sensitivity to paclitaxel.
First, we studied the expression of drug
transporters and β-tubulin mutations in the cell lines. However, no
correlation was shown between the expression of ABCB1 or
ABCC1 and the resistance to paclitaxel, and sequencing of
β-tubulin failed to disclose any mutation in the paclitaxel binding
site in any of these cell lines. Therefore, we further investigated
the intracellular pharmacokinetics of paclitaxel by measuring the
intracellular accumulation of paclitaxel and stabilized tubulin,
and by observing live cells treated with fluorescence-labeled
paclitaxel. We thus obtained the novel finding that
fluorescence-labeled paclitaxel was accumulated more in the
lysosomal and extra-lysosomal compartments in cells showing a
resistance to paclitaxel, compared with other cells.
Materials and methods
Cell lines and cell cultures
Human lung cancer cell lines II18, PC-14 and
RERF-LC-KJ were purchased from RIKEN Cell Bank (Tsukuba, Japan) and
RERF-LC-Ad1, A549, RERF-LC-Ad2 and Lu99B were purchased from the
Health Science Research Resources Bank (Osaka, Japan). A549 was
cultured in Eagle’s minimal essential medium (MEM) supplemented
with 10% fetal bovine serum (FBS). The other cell lines were
cultured in RPMI-1640 with 10% FBS. All of the media were
supplemented with penicillin-streptomycin sulfate (Nacalai Tesque
Inc., Kyoto, Japan). All of the cell lines were incubated in an
atmosphere of 95% air with 5% CO2 at 37°C.
Cytotoxicity assay and real-time
monitoring of cell proliferation to paclitaxel
Paclitaxel was obtained from Bristol-Myers Squibb
(Tokyo, Japan). Drug cytotoxicity for paclitaxel was measured using
2-(2-methoxy-4-nitrophenyl)-3-(4-nitrophenyl)-5-(2,4-disulfophenyl)-2H-tetrazolium
(WST-8) assays (Dojindo Laboratories, Kumamoto, Japan), according
to the manufa-cturer’s protocol. Cells were harvested with trypsin
and re-suspended at a final concentration of 2.5×10⁴
cells/ml for A549 and RERF-LC-KJ, a final concentration of
5.0×10⁴ cells/ml for RERF-LC-Ad1, RERF-LC-Ad2 and Lu99B,
and a final concentration of 1.0×10⁵ cells/ml for II18
and PC-14, in order to assure appropriate absorbance ranging from
1.0 to 2.0 at 450 nm. Aliquots of each of the suspended cells (100
μl) were prepared in triplicate and distributed into 96-well
microplates. After incubation for 24 h, the cells were exposed to
paclitaxel at various concentrations (ranging from 0.1 nM to 1 mM,
8 different concentrations) for 48 h. Subsequently, we then
refreshed the medium, followed by adding 10 μl WST-8 to each well
and incubation for 2 h at 37°C. The absorbance at 450 nm was
determined by a microplate reader (Bio-Rad Laboratories, Tokyo,
Japan). The concentrations required to inhibit growth by 50%
(IC50) were calculated using KaleidaGraph version 4.0
(Synergy Software, Reading, PA).
The xCELLigence® system (Roche
Diagnostics, Tokyo, Japan) was used to quantitatively measure the
cell proliferation. Cells (8×10⁴-1.3×10³
cells per well) were prepared in triplicate and distributed into
E-plate 96 microplates (Roche Diagnostics) to measure the cell
index (reflecting the surface area covered by the cells) in each
well after 96 h of incubation. In the cytotoxicity assay, cells
were re-suspended at 1×10⁴ cells for PC-14, A549 and
RERF-LC-Ad2, 2×10⁴ cells for II18 and Lu99B and
4×10⁴ cells for RERF-LC-Ad1 and RERF-LC-KJ,
respectively, in order to assure an appropriate cell index. Cells
were prepared in triplicate, with 200 μl of an appropriate medium
with 10% FBS. After 24 h of incubation, the cells were exposed to
25 μl of paclitaxel at various concentrations. The cells were
monitored every 15 min (up to 48 h), followed by monitoring at 1-h
intervals (from 48 to 96 h). IC50 was calculated using
the RTCA-integrated software of the xCELLigence®
system.
Total RNA preparation from
paclitaxel-exposed cells
We harvested the cells exposed to 3.2 nM (−8.5 logM)
paclitaxel at different time points, at 0, 6, 12, 18, 24 and 48 h
in culture, respectively. The total cellular RNA was isolated from
the cells using the RNeasy Mini Kit (Qiagen, Tokyo, Japan). After
treatment with RNase-free DNase I (Nippongene, Tokyo, Japan) for 30
min at 37°C, the RNA was processed for purification with an RNeasy
MinElute Cleanup Kit (Qiagen).
Real-time quantitative RT-PCR
First-strand cDNAs were synthesized with a
Superscript VILO® cDNA synthesis kit (Invitrogen, Tokyo,
Japan). Real-time quantitative PCR of the target genes was
performed with an ABI PRISM 7000 (Applied Biosystems, Carlsbad, CA)
and a SYBR Premix Ex Taq Perfect Real-Time (Takara-Bio, Otsu,
Japan). PCR reactions were carried out under the following
conditions: 95°C for 10 sec, followed by 40 cycles of 95°C for 5
sec and 65°C for 35 sec. The PCR primers were designed using Primer
3 Plus software® as follows: ABCB1,
5′-TCCTGGAGCGGTTCTACGAC-3′ (sense) and 5′-GCTGCAGTCAAACAGGATGG-3′
(antisense); ABCC1, 5′-GGAGACCTGGAAGCTGATGG-3′ (sense) and
5′-AGGGCTCCATAGACGCTCAG-3′ (antisense); GAPDH,
5′-GAAGGTGAAGGTCGGAGTC-3′ (sense), 5′-GAAGAT GGTGATGGGATTTC-3′
(antisense). The results were normalized to the levels of
GAPDH and relative quantification was calculated using the
ΔΔCT method (17). Relative mRNA
expressions were expressed as fold changes relative to the
expression level of the gene on A549 at time zero.
Sequencing of β-tubulin
The primers employed for the PCR amplification and
sequencing of the β-tubulin isotype are summarized in Table I. The total RNA (1 μg) was
reversely transcribed to cDNA using a SuperScript® II
RNase H-Reverse Transcriptase Kit (Invitrogen). PCR products were
synthesized using KOD-plus (Toyobo, Osaka, Japan) according to the
manufacturer’s protocols, and loaded onto 2% agarose gel. Following
electrophoresis, the appropriate bands were purified using
Wizard® SV Gel and PCR Clean-Up System (Promega,
Madison, WI) according to the manufacturer’s instructions. The
products were purified by ethanol precipitation and added to
BigDye® Terminator v3.1 Cycle Sequencing Kit (Applied
Biosystems) and then processed for sequencing using an Applied
Biosystems 3130 Genetic Analyzer (Applied Biosystems). Sequences of
the β-tubulin isotype were aligned using Clustal-W2 (European
Bioinformatics Institute) and Boxshade programs.
 | Table ISet of primers for PCR amplification
and nucleotide sequencing of β-tubulin isotype. |
Table I
Set of primers for PCR amplification
and nucleotide sequencing of β-tubulin isotype.
| Primer | Sequence for PCR
amplification | Primer | Sequence for
sequencing reaction |
|---|
| Class I |
| Forward
(88–108) |
ATACATACCTTGAGGCGAGCA | Forward
(687–706) |
CTCTCCGTCCATCAGTTGGT |
| Reverse
(1488–1507) |
GACGGCTAAGGGAACTGAGA | Reverse
(1017–1036) |
ACAGGCAGCCATCATGTTCT |
| Class II |
| Forward
(83–100) |
CACCATGCGCGAGATCGT | Forward
(702–721) |
GCCCTGTATGACATCTGCTT |
| Reverse
(1461–1480) |
CCATGCTTGAGGACAACAGA | Reverse
(1052–1070) |
CTCGTCCACCTCCTTCATG |
| Class III |
| Forward
(65–84) |
TATGAGGGAGATCGTGCACA | Forward
(644–661) |
GGAGAACACGGATGAGAC |
| Reverse
(1462–1482) |
GGTTTAGACACTGCTGGCTTC | Reverse
(944–962) |
CATGTTCTTGGCATCGAAC |
| Class IVa |
| Forward
(22–39) |
TCTCCGCCGCATCTTCCA | Forward
(683–703) |
GGTGGAGAATACGGATGAGAC |
| Reverse
(1472–1492) |
ATCAAAGGTCAGAAGCCTCGA | Reverse
(983–1004) |
CATGTTCTTGGCATCGAACATC |
| Class IVb |
| Forward
(50–71) |
TCTGCTGCTGTTTGTCTACTTC | Forward
(636–654) |
AGTGGTGGAGCCCTACAAC |
| Reverse
(1461–1480) |
GTTCACACTGCTTCCCTGCT | Reverse
(985–1005) |
AGCCATCATGTTCTTGGCATC |
Paclitaxel accumulation assay
The accumulation of paclitaxel in all of the cells
was measured using [3H]-paclitaxel (Moravec Biochemicals
Inc., Brea, CA), employing a modification of the methods previously
described (18,19).
First, the cells were quadricated and distributed
into 96-well plates at the described cellular count for a cytotoxic
assay with xCELLigence® system. After incubation for 24
h, the cells were exposed to 3.2 nM (−8.5 logM)
[3H]-paclitaxel for the following 6, 12, 18, 24 and 48
h. After washing three times with ice-cold phosphate-buffered
saline (PBS), the cells were trypsinized, and then triplicated and
solubilized with 1% Triton-X and 0.2% sodium dodecylsulfate (SDS)
in 10 mM PBS (pH 7.4), except for one well, which was employed for
cell counting. Each solution was transferred to
Optiplate-96® (Perkin-Elmer, Waltham, MA) and added to
Microscinti 40® (Perkin-Elmer). The radioactivity was
measured as counts per min (CPM) using a TopCount NXT®
(Perkin-Elmer, Inc.) microplate scintillation and luminescence
counter.
Tubulin polymerization assay
Soluble and polymerized tubulins from cell lysates
were divided by the following procedures based on a modification of
the previously reported method (6,13,20).
In brief, cells (1×10⁶ cells) exposed to 3.2 nM (−8.5
logM) paclitaxel for 0, 6, 12, 18, 24 and 48 h were lysed at 37°C
with 100 μl of hypotonic buffer [1 mM MgCl2, 2 mM EGTA,
0.5% NP-40, a complete mini protease inhibitor cocktail tablet
(Roche Diagnostics) and 20 mM Tris-HCl (pH 6.8)] for 5 min in the
dark. After an additional 100 μl of hypotonic buffer was added, the
cell lysates were vortexed briefly and sonicated on ice. Following
quantification of the protein concentration, the lysate was
centrifuged at 14,000 rpm for 10 min at room temperature. We
collected proteins from the supernatant, which contained the
soluble tubulin, and the pellet fraction, including polymerized
tubulin. Proteins were solubilized in 4X NuPAGE® LDS
Sample Buffer (Invitrogen) and 10X NuPAGE® Reducing
Agent (Invitrogen) and then sonicated on ice. Heat-denatured
proteins (10 μl) were separated using the NuPAGE® system
and NuPAGE® Novex 4–12% Bis-Tris Gel (Invitrogen), and
then transferred onto Hybond-P (GE Healthcare Ltd.,
Buckinghamshire, UK). SNAP-id (Millipore, Billerica, MA) was used
for immunoblotting. A mouse monoclonal anti-α-tubulin antibody
(1:500) (Sigma-Aldrich, St. Louis, MO) was applied and incubated
for 10 min. After the secondary reaction with ECL®
peroxidase-labelled anti-mouse NA931VS (1:1000) (GE Healthcare
Ltd.) for 10 min, the chemiluminescent signal was visualized by
using SuperSignal West pico® (Thermo Fisher Scientific
Inc., Waltham, MA) on Versadoc (Bio-Rad Laboratories). We analyzed
the protein expression using Quantity One software (Bio-Rad
Laboratories).
Measurement of acetylated tubulin
The amount of acetylated tubulin was measured by the
modified procedure previously described (14). Proteins were extracted from the
total cell lysate using a ProteoExtract® Protein
Precipitation Kit (Merck KGaA, Darmstadt, Germany). After
transferring the proteins to Hybond-P, the blots were incubated
with mouse monoclonal anti-acetylated α-tubulin antibody (1:1000)
(Abcam, Cambridge, UK) and anti-α-tubulin antibody (Sigma-Aldrich),
which was used for the tubulin polymerization assay. The secondary
reactions and the signal detection were performed similarly to the
method described in the section on the tubulin polymerization
assay.
Imaging of acetylated tubulin on
immunofluorescence microscopy
Seeded on glass coverslips, the cells were exposed
to paclitaxel for 6 and 24 h. After the exposure, the cells were
fixed with 4% paraformaldehyde and stained with mouse monoclonal
anti-acetylated α-tubulin antibody (1:1000). Alexa 488 conjugated
goat anti-mouse IgG was used as a secondary antibody. In order to
stain α-tubulin with the antibody described above, we used
Zenon® Mouse IgG Labeling Kits (Molecular probes,
Eugene, OR) according to the manufacturer’s manual. In order to
visualize the nuclei, the cells were stained with
4′,6-diamidino-2-phenylindole (DAPI). The immunostained cells were
observed and analyzed with a confocal laser microscope LSM 510
(Carl-Zeiss AG, Oberkochen, Germany) and LSM image browser
software.
Live cell imaging under confocal laser
microscope
All of the cell lines were grown to confluency in
culture dishes and trypsinized. Then, 1×10⁴ cells were
distributed into 4-well glass-bottom dishes (Matsunami Glass Ind.,
Inc., Osaka, Japan) coated with poly-L-lysine. After incubation for
24 h, each well was changed to pre-warmed fresh medium containing
100 nM Oregon Green® 488 conjugated paclitaxel (Tubulin
Tracker™) (Molecular probes) and incubated for 6 and 24 h, with the
addition of 100 nM LysoTracker® Red DND-99 (Molecular
probes) for 2 h. After the incubation, DAPI was added to the media,
followed by incubation for another 30 min. Each dish was washed
three times with PBS and observed immediately under the confocal
laser microscope LSM 510.
Statistical analysis
The correlation coefficient between the
IC50 value shown by the WST-8 assay and
xCELLigence® system was obtained using simple regression
analysis (Excel software). In order to determine if the differences
in the intracellular accumulation of paclitaxel and gene
expressions among the cell lines were statistically significant,
the data was analyzed employing one-way analysis of variance,
followed by Dunnett’s multiple comparisons test.
Results
Remarkably different resistance to
paclitaxel between lung cancer cell lines
In order to study the mechanisms underlying
paclitaxel-induced cytotoxicity, we first compared the cellular
responses to paclitaxel with two independent assays. Seven lung
cancer cell lines from human non-small lung cancers were studied to
assess the IC50, and it turned out that their
IC50 were widely distributed in the range from −3.70 to
−8.33 logM and −4.48 to −10.80 logM, according to the
xCELLigence® system and the WST-8 assay, respectively
(Table II). Simple regression
analysis showed a strong positive correlation (r2=0.771)
in both cytotoxicity assays.
| Table IICytotoxicity profile of lung cancer
cell lines to paclitaxel. |
Table II
Cytotoxicity profile of lung cancer
cell lines to paclitaxel.
|
IC50a |
|---|
|
|
|---|
| Exposure time
(h) | II18 | RERF-LC-Ad1 | PC-14 | A549 | RERF-LC-Ad2 | Lu99B | RERF-LC-KJ |
|---|
| 24 | −8.32 | −8.10 | −7.67 | −7.73 | −8.29 | −5.60 | −3.70 |
|
xCELLigence® | 48 | −8.33 | −7.78 | −7.65 | −7.69 | −8.15 | −5.10 | −4.51 |
| 72 | −8.18 | −8.41 | −7.69 | −7.07 | −7.99 | −5.35 | −4.83 |
| WST-8b | 48 | −10.80 | −9.36 | −9.34 | −8.48 | −7.26 | −7.68 | −4.48 |
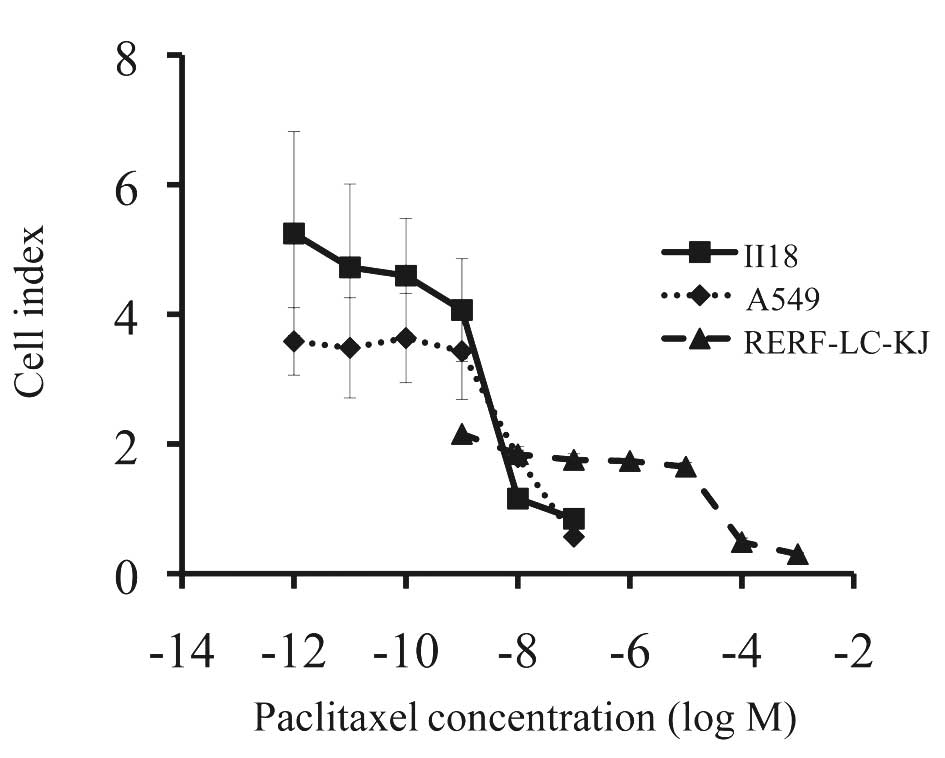
RERF-LC-KJ, the most resistant cell line among the
cell lines so far examined, was about 104 times more
resistant to paclitaxel than II18, the most sensitive cell line
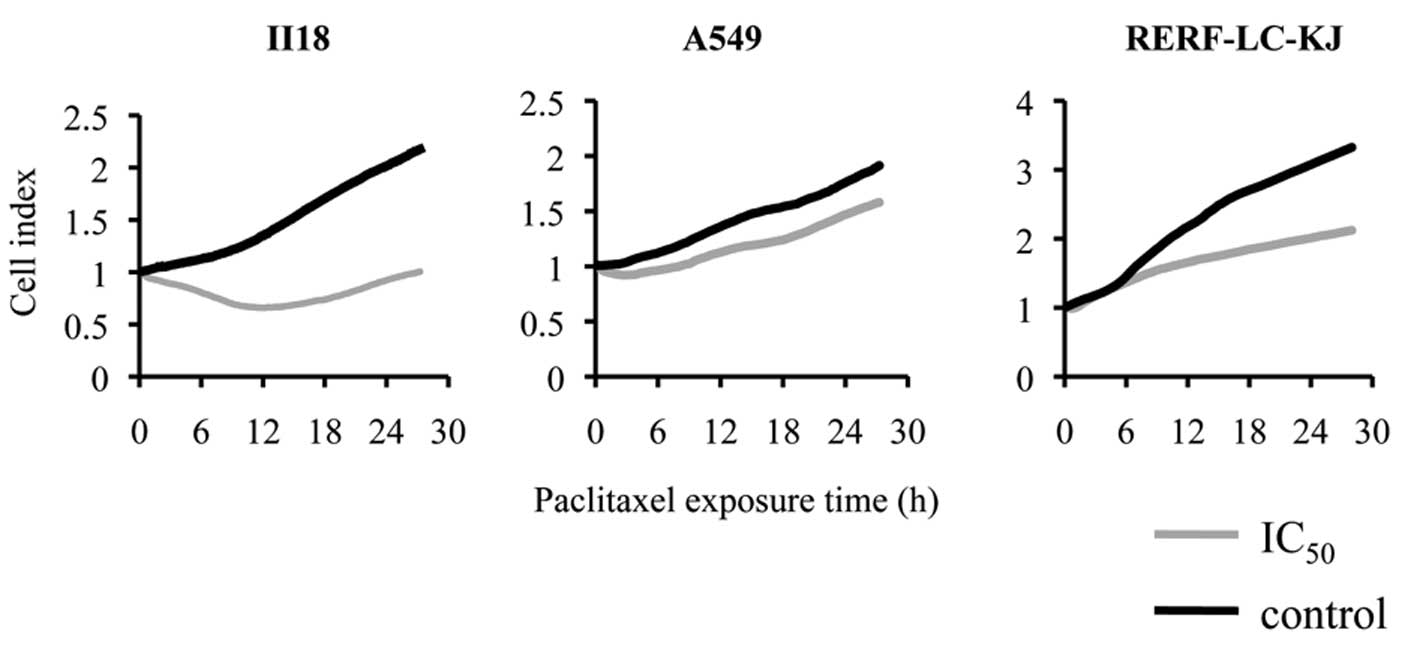
(Fig. 1). After examining the
effect of paclitaxel at calculated IC50 on cellular
proliferation with the xCELLigence® system, we concluded
that the cytotoxicity appeared most prominently between 6 and 18 h
after the exposure to paclitaxel, regardless of the cell line
(Fig. 2). Thus, we assumed that
the most remarkable changes in cellular behavior appeared in the
period before 24 h. Because a similar tendency in regard to the
resistance to paclitaxel was observed with two different assays, we
concluded that there was a wide variation in terms of the
sensitivity (or resistance) to paclitaxel among the different lung
cancer cell lines. We then decided to use three cell lines, i.e.,
RERF-LC-KJ, A549, and II18 for the following experiments. Taking
into consideration the IC50 of the most sensitive cell
line II18, we determined the concentration of paclitaxel being as
3.2 nM (−8.5 logM).
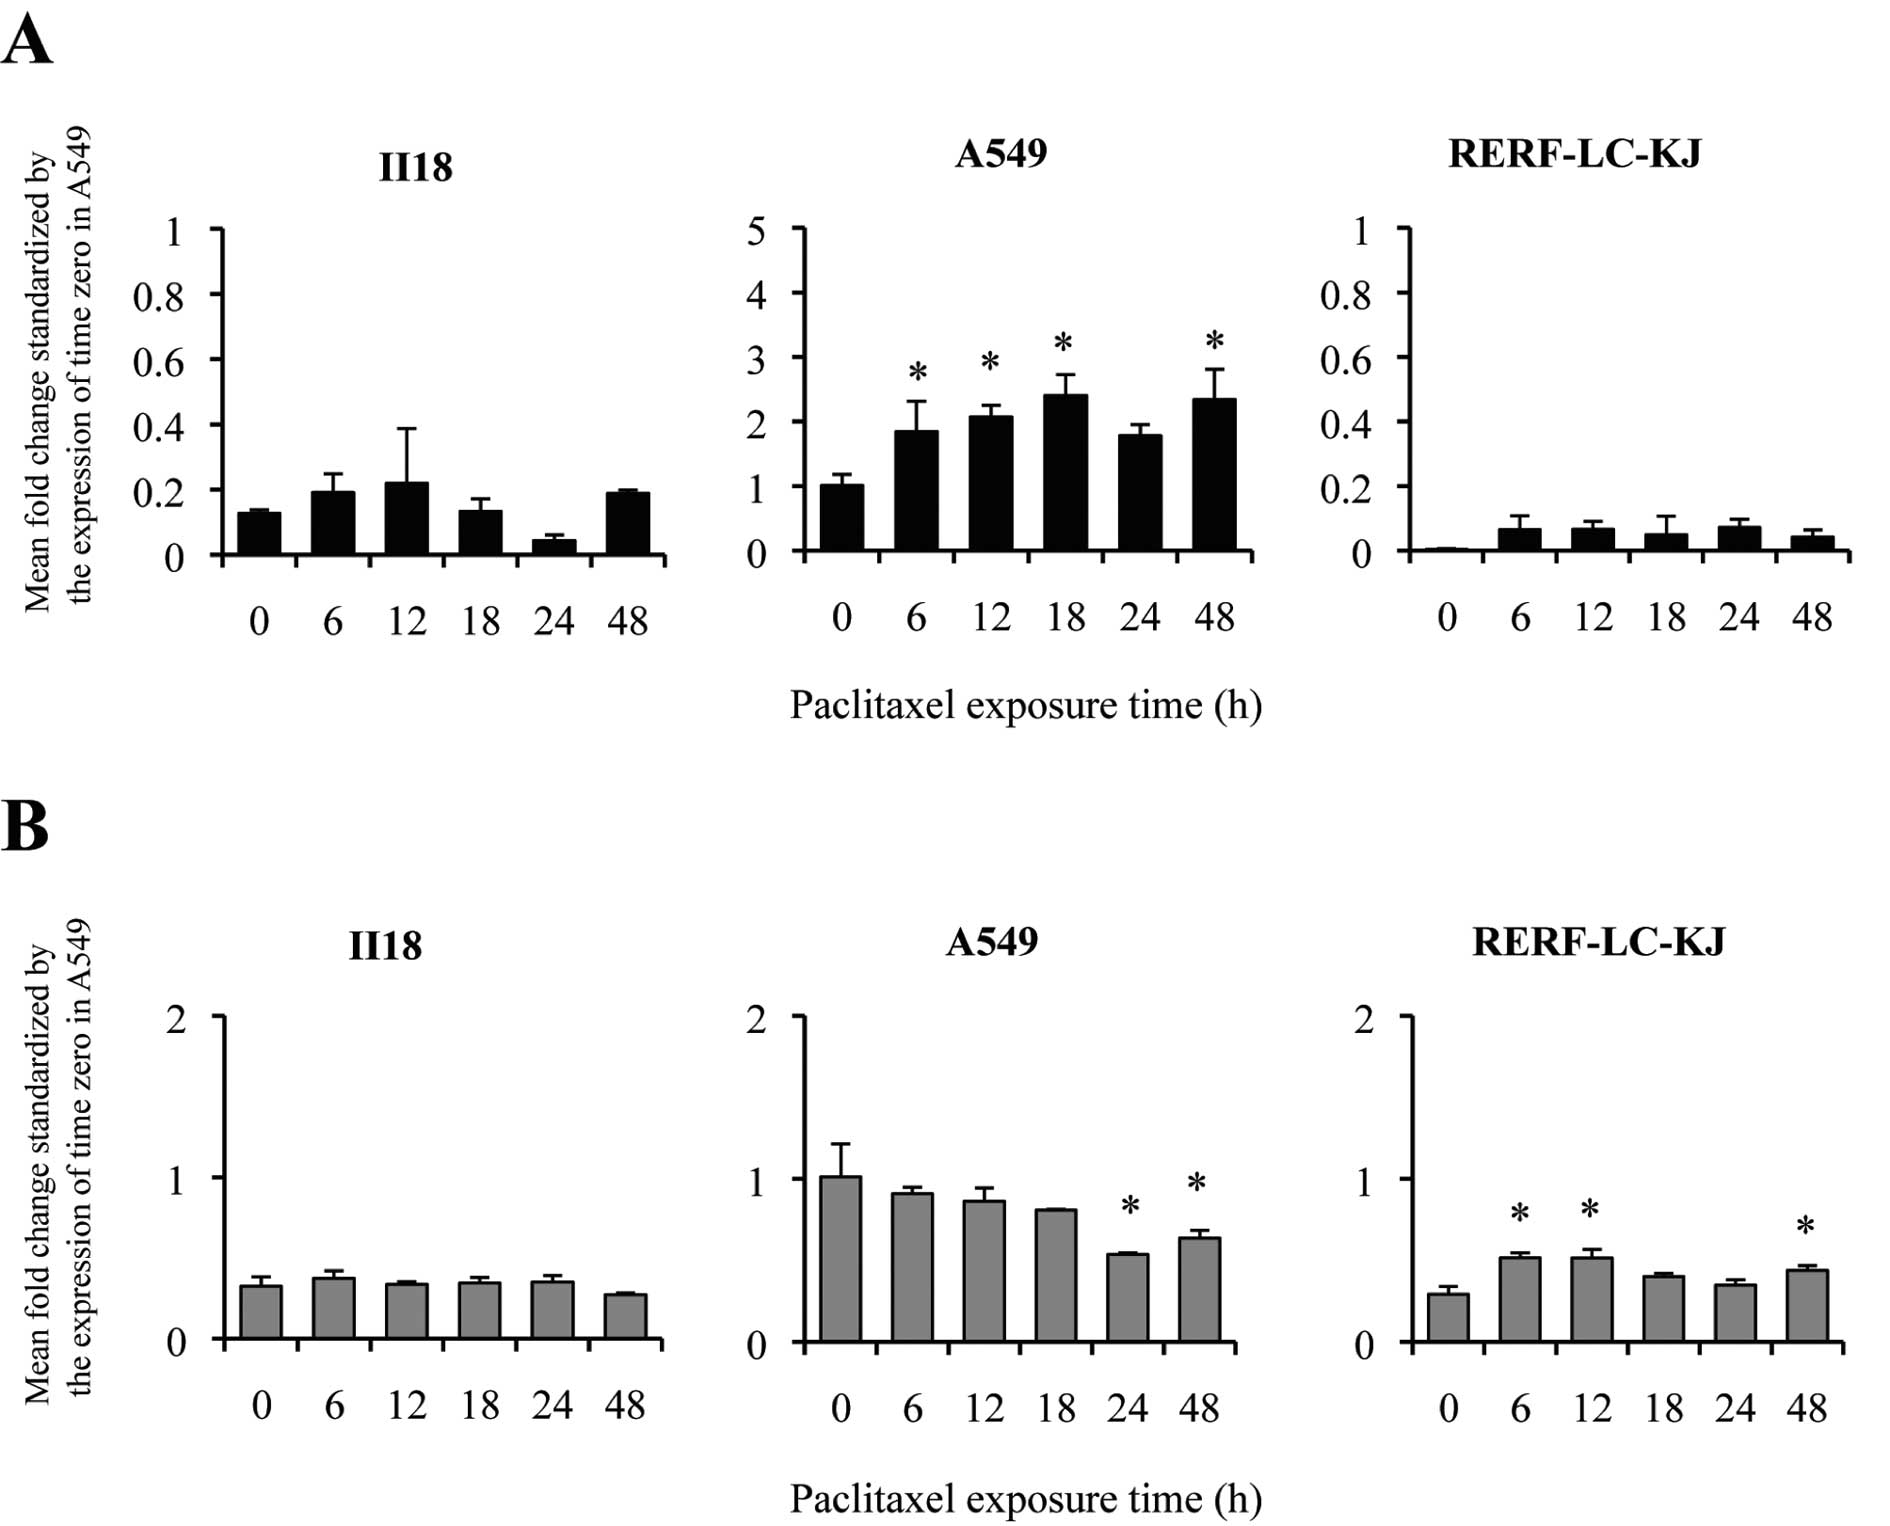
ABCB1 expression level change is not
related to resistance to paclitaxel
To further elucidate the relationship between the
major drug transporters and the resistance to paclitaxel, we
measured the expression of ABCB1 (Fig. 3A) and ABCC1 (Fig. 3B) in lung cancer cell lines by
quantitative real-time RT-PCR. A549 showed an elevation of the
expression level of ABCB1 between 6 and 12 h. On the other
hand, II18 and RERF-LC-KJ remained low throughout the experimental
period in terms of the expression level of ABCB1.
However, no correlation was shown between the
patterns of the expression level of ABCB1 and the resistance
to paclitaxel. The expression level of ABCC1 at time 0 for
A549 was significantly higher than that of the other cell lines.
The ratio of the expression level at time 0 for ABCC1
compared to A549 remained in the range from 0.18 to 0.58, and the
changes in the expression level were modest.
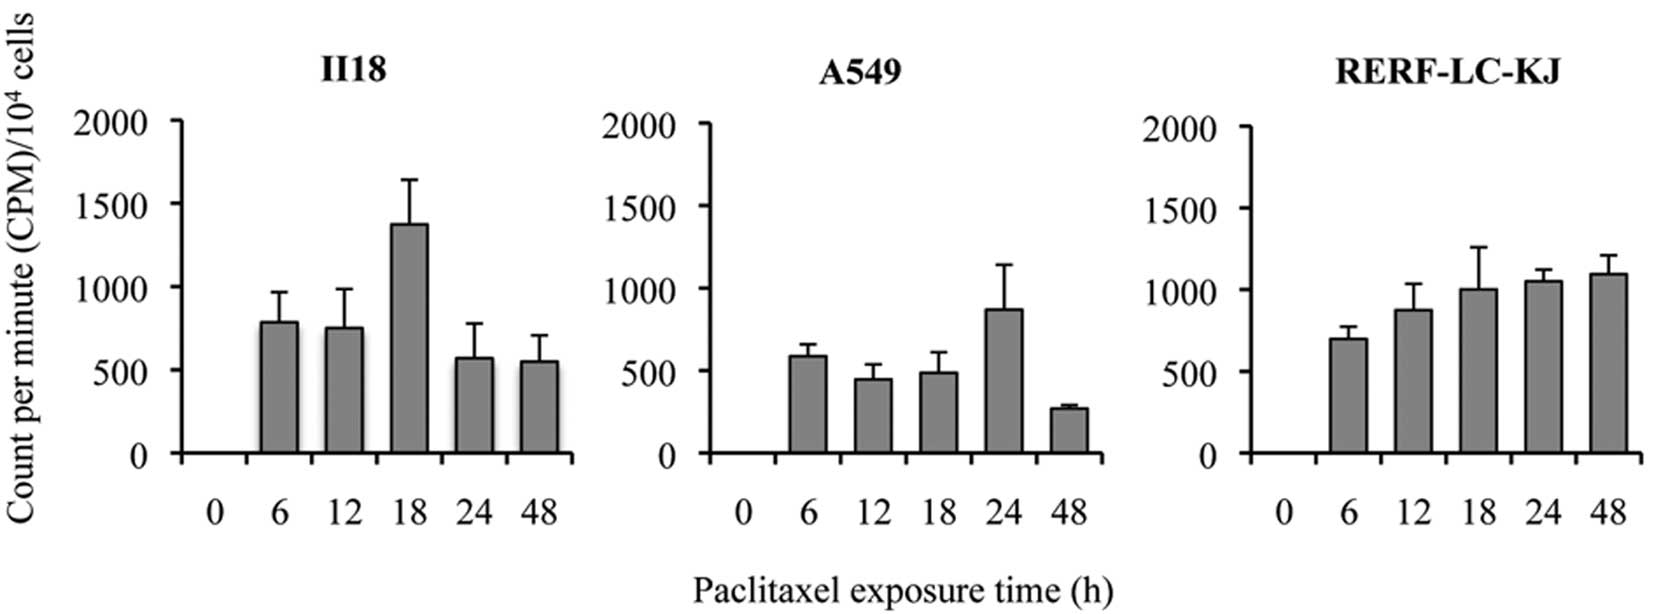
Accumulation of
[3H]-paclitaxel corresponded with the expression of
ABCB1 in two cell lines
In order to investigate whether the accumulation of
paclitaxel was regulated by ABCB1 and ABCC1, and
whether the degree of accumulation was correlated to the
development of the resistance to paclitaxel, we quantitatively
analyzed the time course of the accumulation of intracellular
[3H]-paclitaxel. The accumulation was evaluated as the
radioactivity of [3H]-paclitaxel using CPM divided by
the cell count for each well. The accumulation of
[3H]-paclitaxel increased gradually and continuously
with time for RERF-LC-KJ, whereas it increased until it reached a
peak between 12 or 24 h and then decreased in the other cell lines
(Fig. 4). RERF-LC-KJ showed a low
expression of ABCB1 throughout the entire time course of the
experiment, which corresponded with a higher accumulation of
[3H]-paclitaxel. The correlation coefficient between the
expression level of ABCB1 and the accumulation of
[3H]-paclitaxel was −0.804. On the contrary, the
accumulation of [3H]-paclitaxel in A549 remained low,
which correlated well with the high expression level of
ABCB1. However, this inverse relationship between the
accumulation of [3H]-paclitaxel and the expression of
ABCB1 did not apply to the II18 cell line. The correlation
coefficient between the expression level of ABCC1 and the
accumulation of [3H]-paclitaxel was −0.526. Thus, we
concluded that there was a stronger correlation between the
expression of ABCB1 and the intracellular accumulation of
paclitaxel compared to that between the expression of ABCC1
and the intracellular accumulation of paclitaxel.
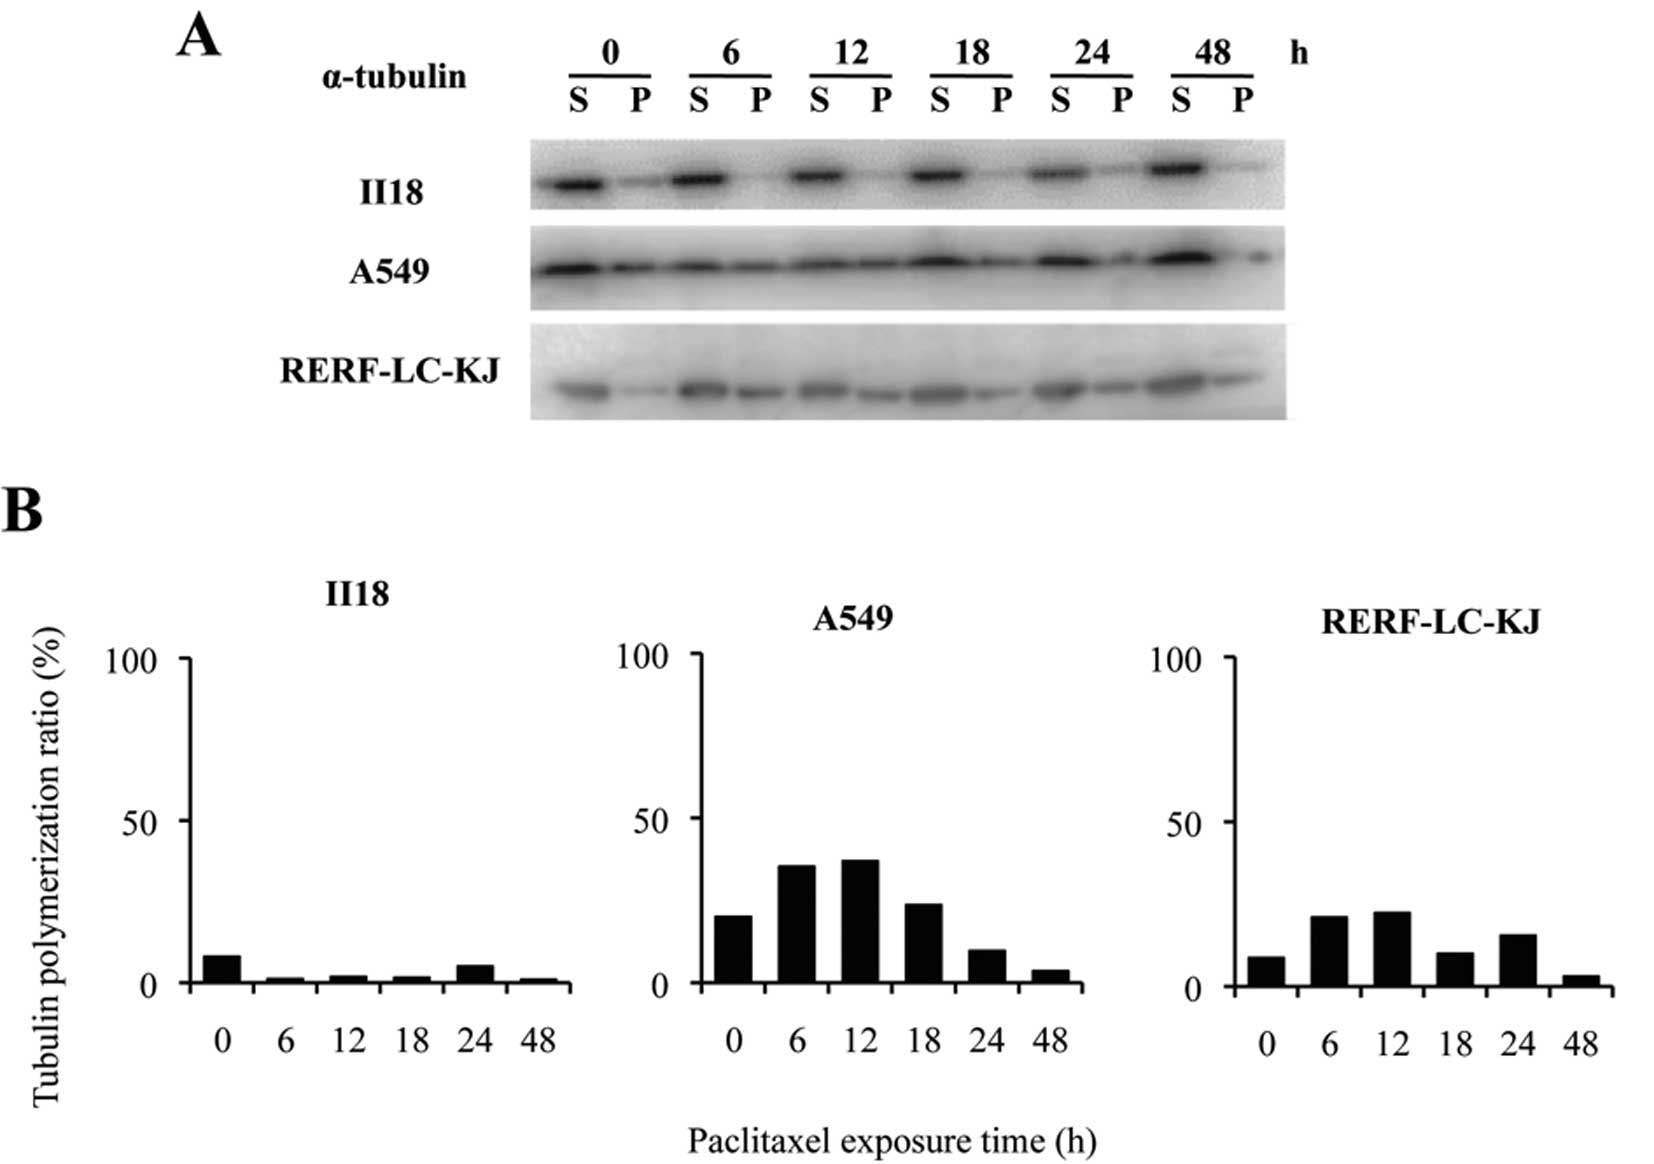
Changes in the quantity of polymerized
tubulin and acetylated tubulin after exposure to paclitaxel are not
related to the resistance to paclitaxel
In the II18 cell line, no correlation was found
between the expression level of ABCB1 and the extent of the
accumulation of [3H]-paclitaxel. Therefore, we next
performed tubulin polymerization assays to quantify the extent of
microtubule stabilization by paclitaxel. The tubulin-polymerized
ratio was defined as the percentage of polymerized α-tubulin, which
was calculated by dividing the densitometric value of polymerized
α-tubulin (insoluble) by the total α-tubulin contents (sum of the
densitometric values for soluble and polymerized α-tubulin)
(Fig. 5). The ratio of polymerized
tubulin remained low for 48 h in the II18 cell line, whereas it
increased until a peak value at 6 or 12 h after the exposure and
decreased from 18 to 48 h in the other two cell lines.
Post-translational acetylation of α-tubulin is
reported to be associated with the stability of microtubules
(21,22). Thus, we evaluated the expression
level of acetylated α-tubulin employing the Western blot method
(Fig. 6A) and immunocytochemistry
(Fig. 6C). The quantification of
acetylated α-tubulin and α-tubulin was performed by the same method
employed in the tubulin polymerization assay (Fig. 6B). Images obtained from
immunofluorescence staining were also analyzed by measuring the
fluorescent intensity at each 1-μm deep interval (Fig. 6D). The ratio of the acetylated
α-tubulin to the total α-tubulin remained low for 48 h in the II18
cell line, but it increased with time in the RERF-LC-KJ cell line.
These analytic results for acetylated α-tubulin were consistent
with the results obtained in the tubulin polymerization assay.
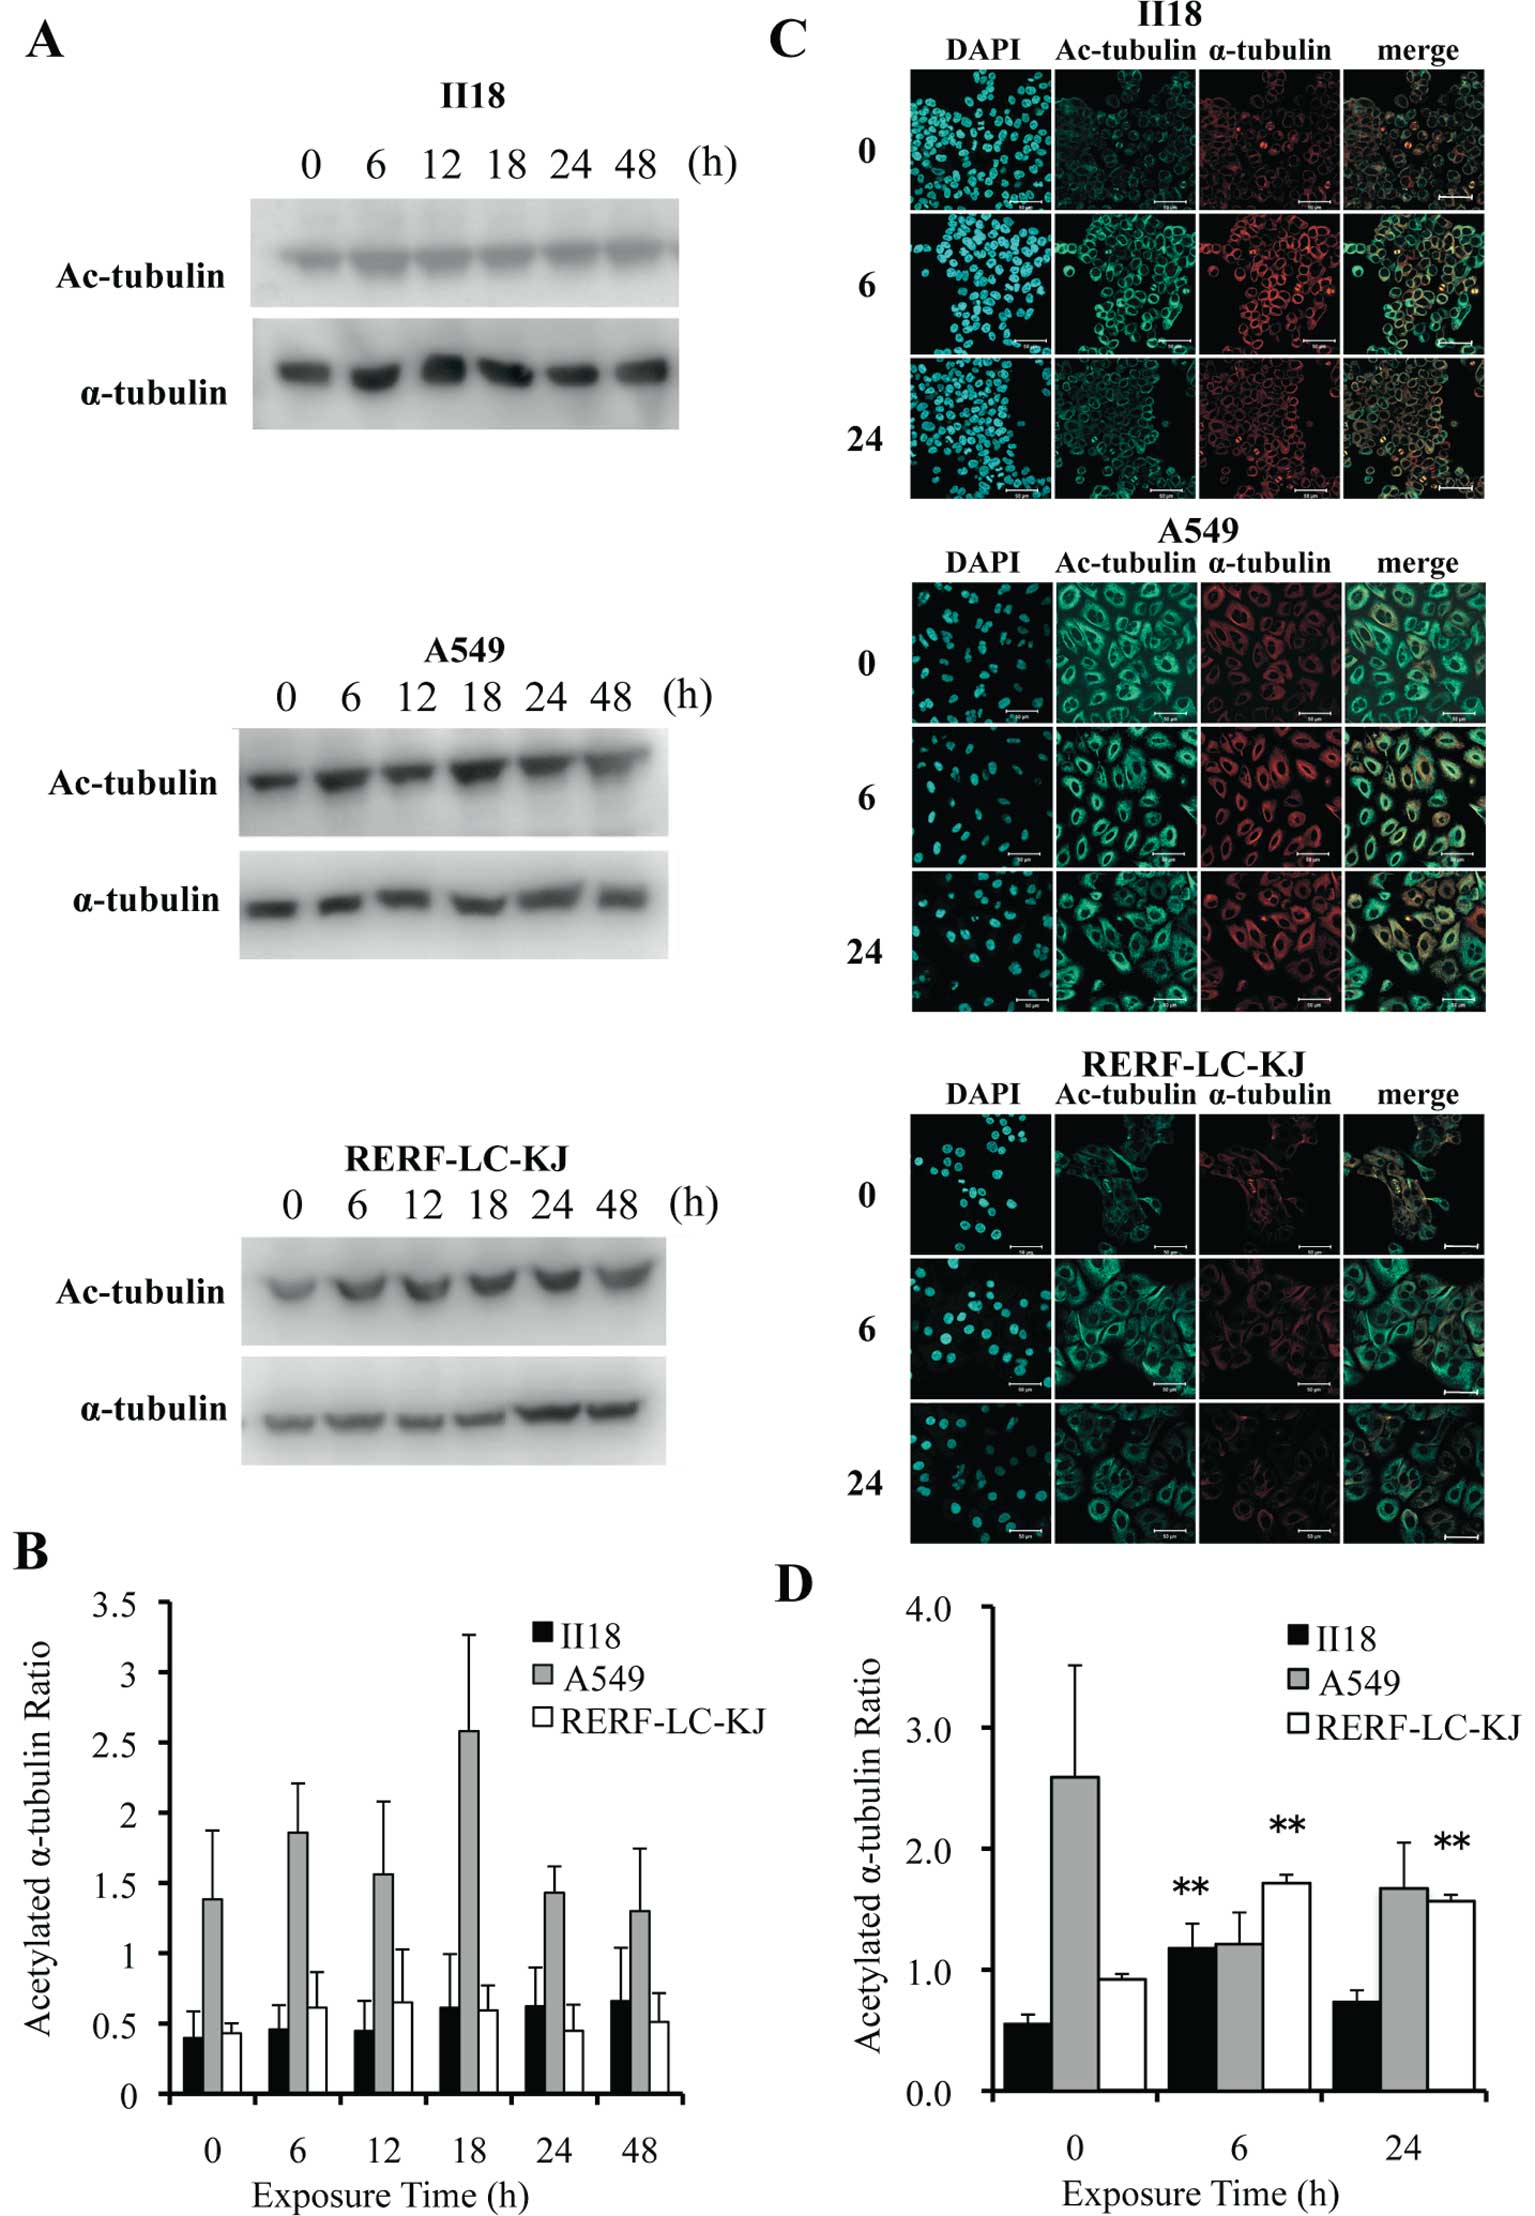 | Figure 6The expression of acetylated
α-tubulin remained low for 48 h in the II18 cell line, whereas it
increased with time in the RERF-LC-KJ cells. (A), The expressions
of acetylated α-tubulin and α-tubulin were analyzed with the
Western blot method using proteins extracted from cells exposed to
3.2 nM (−8.5 logM) paclitaxel for 6, 12, 18, 24 and 48 h and
untreated (0 h). (B), The ratio of the expression level of
acetylated α-tubulin to the total α-tubulin was measured. Columns,
the mean of value of three experiments; bar, SD. (C), Cellular
localization of acetylated microtubules (green) in cells exposed to
paclitaxel for 6 and 24 h and untreated cells. The cells were
stained with acetylated α-tubulin antibody, microtubules (red) with
α-tubulin antibody and nuclei (blue) with DAPI. Bar, 50 μm. (D),
The ratio of the expression of acetylated α-tubulin to that of
α-tubulin obtained with immunofluorescent staining was calculated
from integrating each fluorescent intensity on a series of stacked
images with a thickness of 1 μm. Columns, mean of value obtained
from 3 microscopic fields; bar, SD; **p<0.01 relative
to respective untreated (0 h) cells. |
No paclitaxel binding site mutations in
the β-tubulin isotype were observed in the 3 cell lines
In order to examine whether alterations of the
tubulin gene could account for the different levels of drug
sensitivity (resistance) to paclitaxel, we sequenced cDNA from the
β-tubulin isotype from the three cell lines. However, no mutations
were shown at the paclitaxel binding sites of the β-tubulin
isotypes in any of the cell lines examined (data not shown).
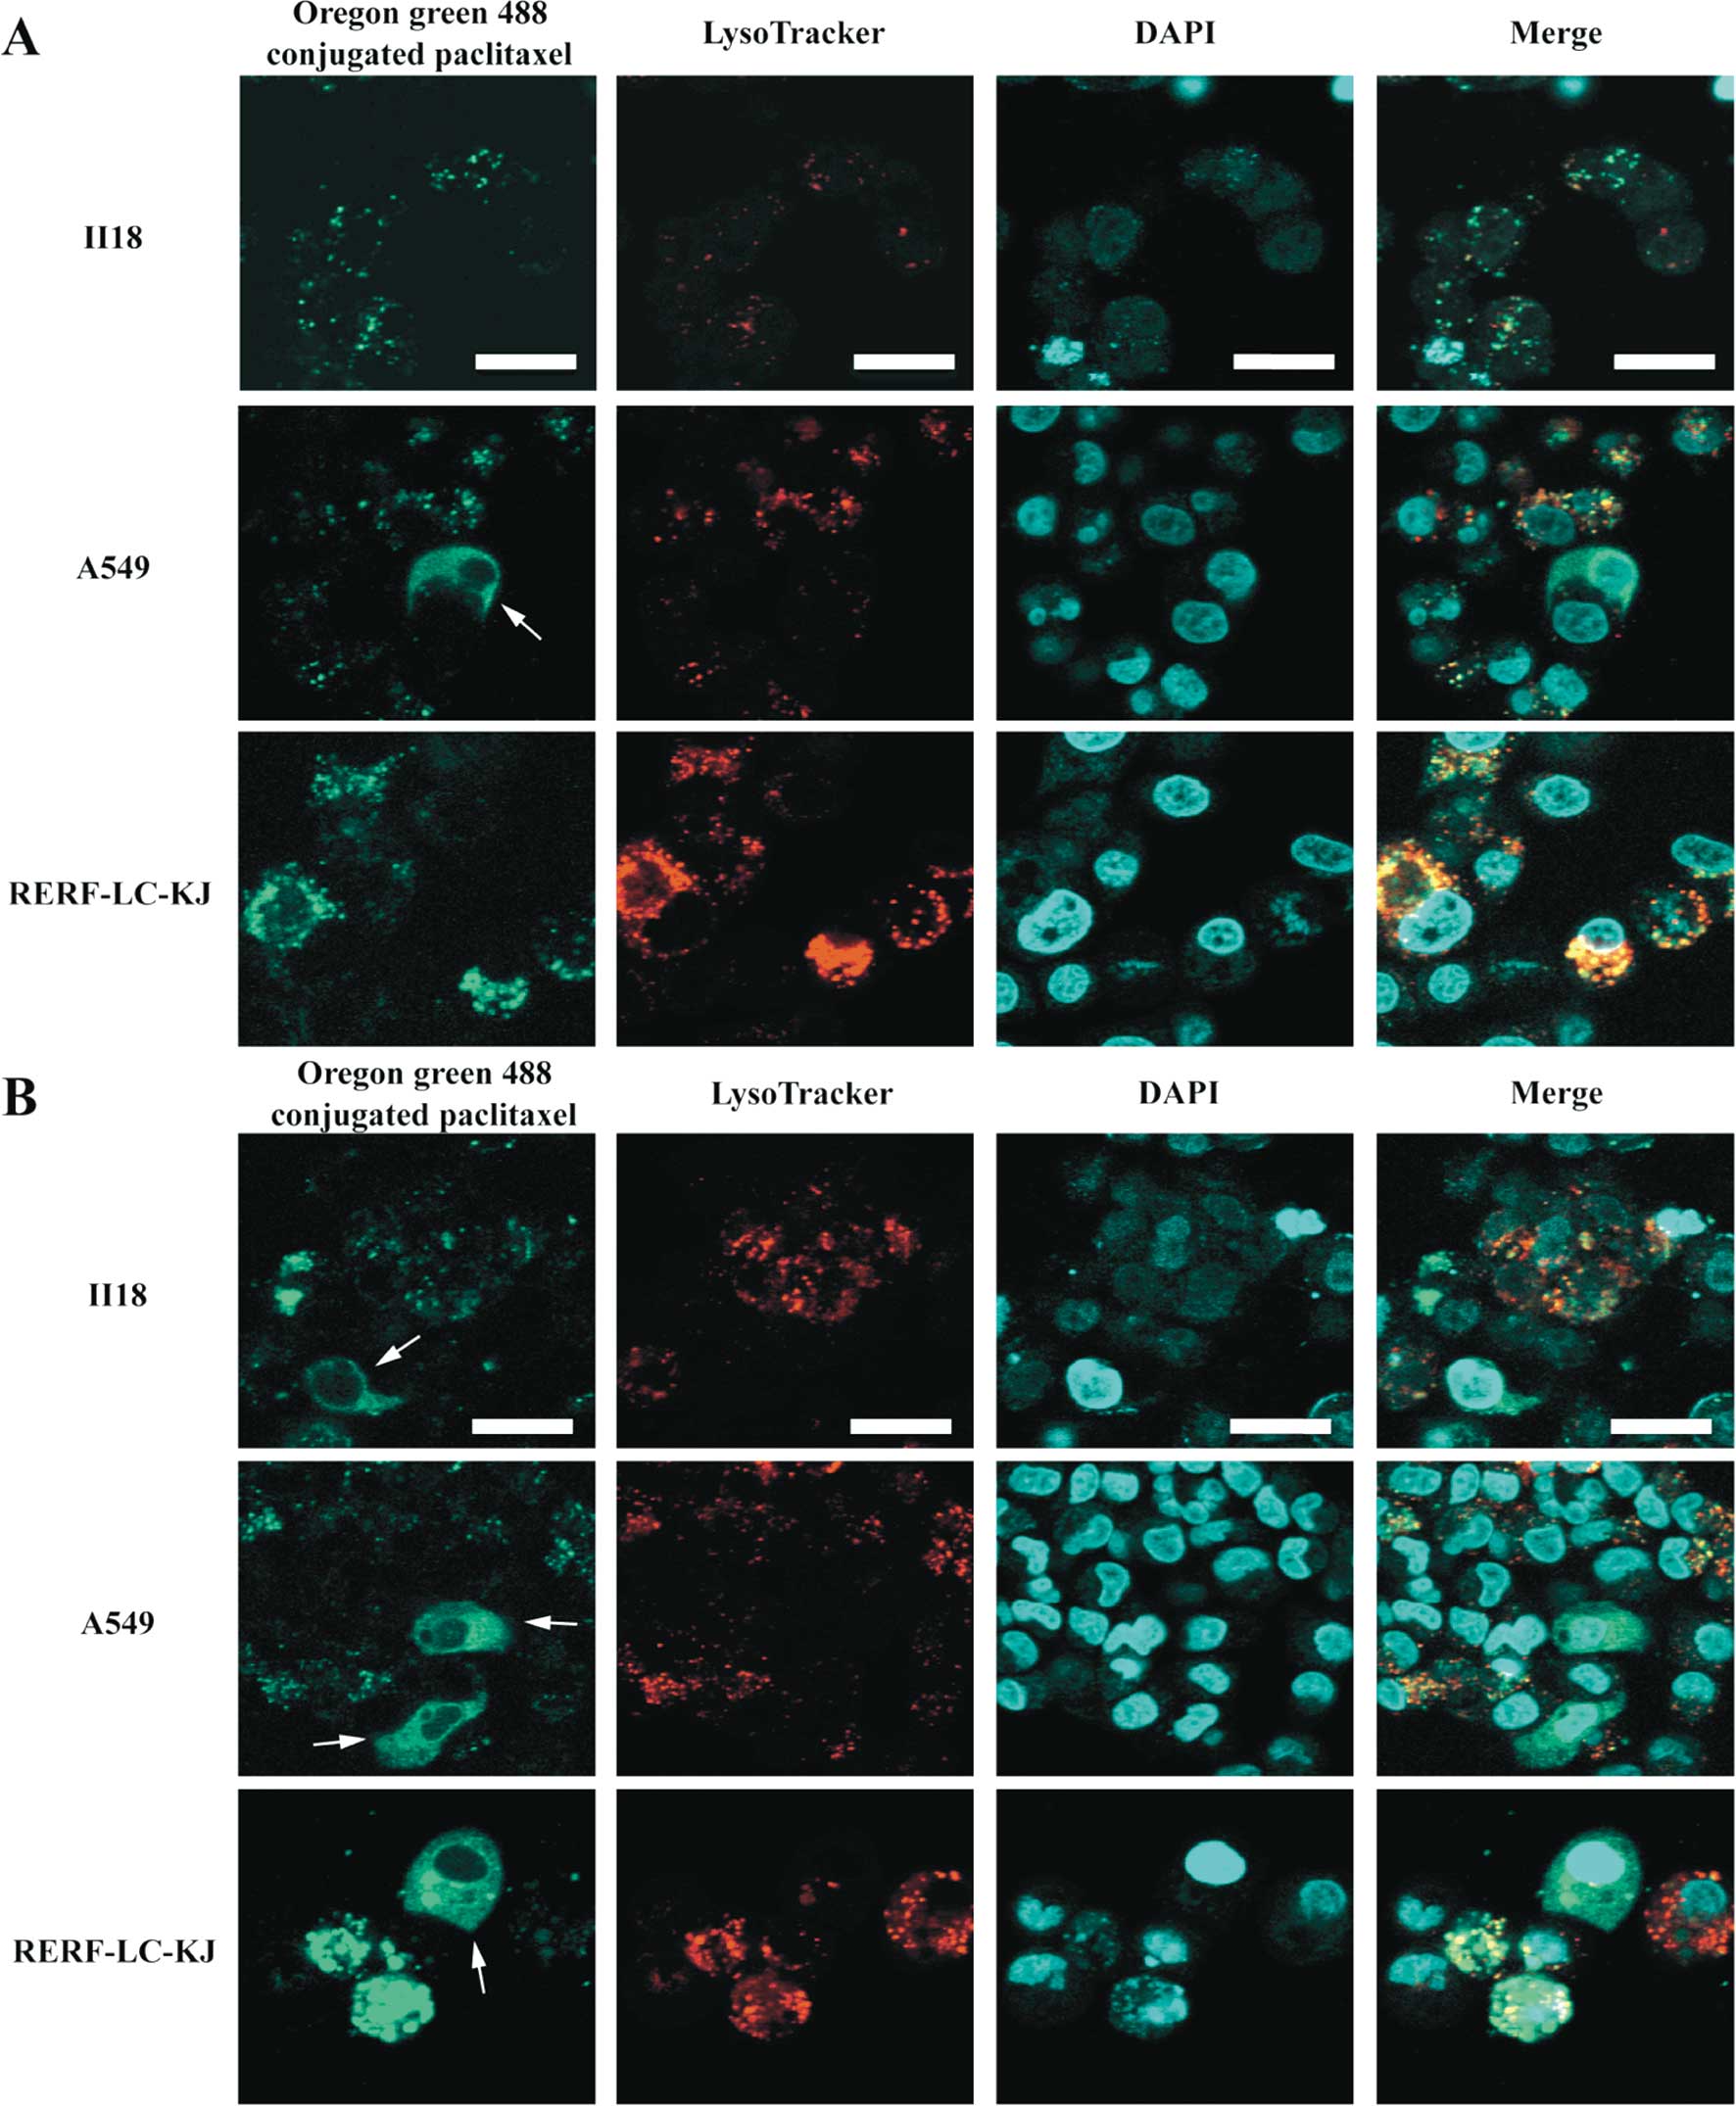
Differences in the intracellular
localization of paclitaxel are observed between RERF-LC-KJ and the
other cell lines
In order to study the dynamics of the paclitaxel
binding to β-tubulin and microtubules, we performed live cell
imaging using Oregon Green® 488 conjugated paclitaxel in
living cells. As shown in Fig. 7,
Oregon Green® 488 conjugated paclitaxel made it possible
to visualize not only the normal microtubule formation on the
partial cells, but also the aggregated vesicle formation in some of
the RERF-LC-KJ cells, whereas in the other cell lines this
phenomenon was not remarkable. Because these vesicular structures
did not appear to be composed of microtubules, we conducted tests
to determine what cell organelles were associated with these
structures, by employing Oregon Green® 488 conjugated
paclitaxel and LysoTracker® Red. It turned out that
colocalization between Oregon Green® 488 conjugated
paclitaxel with LysoTracker® Red was more frequent in
the RERF-LC-KJ cells, compared with the other cell lines. Moreover,
in the RERF-LC-KJ cells, Oregon Green® 488 conjugated
paclitaxel accumulated more in the intracellular compartments,
except the lysosomes, compared with the other cell lines.
The pharmacokinetics profile for
paclitaxel varies between the cell lines
We summarized the characteristics of the
pharmacokinetics for paclitaxel in each cell line from four
viewpoints, including the accumulation of paclitaxel, the extent of
ABCB1 expression, the quantity of the microtubules to which
paclitaxel binds, and the volume of paclitaxel which accumulates in
the intracellular compartments instead of binding to microtubules.
As shown in Table III, A549
exhibited a higher expression level of ABCB1, which resulted
in less accumulation of paclitaxel, compared with the other cells.
In the RERF-LC-KJ cell line, the expression of ABCB1 was
low, and the amount of paclitaxel accumulated intracellularly
increased with time. In addition, the rate of tubulin
polymerization was maintained at a stable level after the exposure
to paclitaxel. The paclitaxel that did not bind to tubulin
accumulated preferentially in the intracellular compartments
containing lysosomes, in the RERF-LC-KJ cell line. The II18 cell
line, the most sensitive to paclitaxel of the cell lines so far
examined, showed unique characteristics, since it exhibited lower
levels of expression of ABCB1, lower accumulation of
paclitaxel, little polymerization of tubulin due to paclitaxel, and
little accumulation of paclitaxel in the intracellular
compartments.
| Table IIIProfile of mechanisms of the
resistance to paclitaxel on each cell line. |
Table III
Profile of mechanisms of the
resistance to paclitaxel on each cell line.
Discussion
We demonstrated that a remarkable difference existed
in the IC50 values for paclitaxel among the cell lines
derived from human non-small cell lung cancers, by using two
cytotoxicity assays. Among the cell lines we examined, RERF-LC-KJ
exhibited the highest resistance to paclitaxel.
In order to study the underlying mechanism of such
high resistance, as seen in RERF-LC-KJ, we studied the time course
of the paclitaxel accumulation and the ratio of polymerized tubulin
to total tubulin. We found that the cells showed a continuous
uptake of paclitaxel with time and an increase in the ratio of
polymerized tubulin, with a peak value at 12 h after the exposure,
followed by a gradual decline until 48 h. No mutations were
demonstrated in the gene coding for the paclitaxel binding site of
the β-tubulin isotypes. Quantitative RT-PCR did not show any
overexpression of ABCB1 or ABCC1. It is noteworthy
that the aggregated vesicular structures containing paclitaxel
colocalized with lysosomes. Thus, these results might suggest that
cells resistant to paclitaxel possess some vesicular compartments
including lysosomes for sequestrating paclitaxel, thereby hindering
paclitaxel from binding to β-tubulin.
Lysosomes, one of the intracellular acidic
organelles, are known to play critical roles in producing
resistance to anticancer drugs, since they trap drugs with weak
basic properties in normal cells (23–27),
whereas in several cancer cells, the acidification mechanisms of
lysosomes were defective, and so the capacity to sequester
lysosomotrophic agents was diminished (26). As a result of the low pH gradient
between cytosol and lysosomes, cancer cells have a greater tendency
to accumulate drugs in the extra-lysosomal compartments of cells.
Paclitaxel, however, is a neutral molecule, because it has no
structure to be ionized. Therefore, the pH gradient between the
lysosomes and cytosol does not seem to be associated with the
intracellular dynamics of paclitaxel. The nature of the
extra-lysosomal compartments accumulating paclitaxel currently
remains unknown, but it is tempting to speculate that the
structures may possess some drug transporters involved in the
efflux or uptake of paclitaxel.
The A549 cell line maintained a higher expression of
ABCB1 through 48 h, compared with the other cell lines.
Thus, paclitaxel accumulation remained lower in A549, compared with
the other cell lines. When we applied the compartment model to the
A549 cell line, the cells showed few compartments, so paclitaxel
could effectively bind to β-tubulin. These results were compatible
with those seen in reports by Alvarez et al (28), Ambudkar et al (3) and Huang and Sadee (4). On the other hand, it is speculated
that there is little association between the expression of
ABCC1 and the drug resistance to paclitaxel.
The II18 cell line was the most sensitive to
paclitaxel, among the cell lines so far examined. Nevertheless, it
accumulated a considerable amount of paclitaxel, with a peak at 18
h after the exposure and tubulin polymerization proceeded little
even at 48 h after the exposure. We thus conclude that the II18
cell line has a unique feature in terms of its sensitivity to
paclitaxel. It would be worth conducting further studies on the
intracellular localization of paclitaxel in II18 cells, because it
might lead to the identification of a novel molecular target for
therapy.
In conclusion, there are multiple underlying
mechanisms involved in the development of resistance to paclitaxel,
and the predominant factors vary between cell lines. In addition to
the mechanisms already proven to be involved with drug resistance,
which include drug efflux transporters and mutations of the
paclitaxel binding site of β-tubulin, we hereby propose that a
novel mechanism also exists, in which paclitaxel accumulates in
some intracellular compartments, which could play an important role
in producing resistance to paclitaxel.
References
|
1
|
Sawabata N, Asamura H, Goya T, et al:
Japanese Lung Cancer Registry Study: first prospective enrollment
of a large number of surgical and nonsurgical cases in 2002. J
Thorac Oncol. 5:1369–1375. 2010. View Article : Google Scholar : PubMed/NCBI
|
|
2
|
Pujol JL, Barlesi F and Daures JP: Should
chemotherapy combinations for advanced non-small cell lung cancer
be platinum-based? A meta-analysis of phase III randomized trials.
Lung Cancer. 51:335–345. 2006. View Article : Google Scholar : PubMed/NCBI
|
|
3
|
Ambudkar SV, Kimchi-Sarfaty C, Sauna ZE
and Gottesman MM: P-glycoprotein: from genomics to mechanism.
Oncogene. 22:7468–7485. 2003. View Article : Google Scholar : PubMed/NCBI
|
|
4
|
Huang Y and Sadee W: Membrane transporters
and channels in chemoresistance and sensitivity of tumor cells.
Cancer Lett. 239:168–182. 2006. View Article : Google Scholar : PubMed/NCBI
|
|
5
|
Lee JT Jr, Steelman LS and McCubrey JA:
Phosphatidylinositol 3′-kinase activation leads to multidrug
resistance protein-1 expression and subsequent chemoresistance in
advanced prostate cancer cells. Cancer Res. 64:8397–8404. 2004.
|
|
6
|
Giannakakou P, Sackett DL, Kang YK, et al:
Paclitaxel-resistant human ovarian cancer cells have mutant
beta-tubulins that exhibit impaired paclitaxel-driven
polymerization. J Biol Chem. 272:17118–17125. 1997. View Article : Google Scholar
|
|
7
|
Monzó M, Rosell R, Sánchez JJ, et al:
Paclitaxel resistance in non-small-cell lung cancer associated with
beta-tubulin gene mutations. J Clin Oncol. 17:1786–1793.
1999.PubMed/NCBI
|
|
8
|
Hua XH, Genini D, Gussio R, et al:
Biochemical genetic analysis of indanocine resistance in human
leukemia. Cancer Res. 61:7248–7254. 2001.PubMed/NCBI
|
|
9
|
Gonzalez-Garay ML, Chang L, Blade K,
Menick DR and Cabral F: A beta-tubulin leucine cluster involved in
microtubule assembly and paclitaxel resistance. J Biol Chem.
274:23875–23882. 1999. View Article : Google Scholar : PubMed/NCBI
|
|
10
|
McGrogan BT, Gilmartin B, Carney DN and
McCann A: Taxanes, microtubules and chemoresistant breast cancer.
Biochim Biophys Acta. 1785:96–132. 2008.PubMed/NCBI
|
|
11
|
Orr GA, Verdier-Pinard P, McDaid H and
Horwitz SB: Mechanisms of Taxol resistance related to microtubules.
Oncogene. 22:7280–7295. 2003. View Article : Google Scholar : PubMed/NCBI
|
|
12
|
Berrieman HK, Lind MJ and Cawkwell L: Do
beta-tubulin mutations have a role in resistance to chemotherapy?
Lancet Oncol. 5:158–164. 2004. View Article : Google Scholar : PubMed/NCBI
|
|
13
|
Kavallaris M, Tait AS, Walsh BJ, et al:
Multiple microtubule alterations are associated with Vinca alkaloid
resistance in human leukemia cells. Cancer Res. 61:5803–5809.
2001.PubMed/NCBI
|
|
14
|
Hari M, Loganzo F, Annable T, et al:
Paclitaxel-resistant cells have a mutation in the
paclitaxel-binding region of beta-tubulin (Asp26Glu) and less
stable microtubules. Mol Cancer Ther. 5:270–278. 2006. View Article : Google Scholar : PubMed/NCBI
|
|
15
|
Yang H and Cabral F: Heightened
sensitivity to paclitaxel in Class IVa beta-tubulin-transfected
cells is lost as expression increases. J Biol Chem.
282:27058–27066. 2007. View Article : Google Scholar : PubMed/NCBI
|
|
16
|
Aoki D, Oda Y, Hattori S, et al:
Overexpression of class III beta-tubulin predicts good response to
taxane-based chemotherapy in ovarian clear cell adenocarcinoma.
Clin Cancer Res. 15:1473–1480. 2009. View Article : Google Scholar : PubMed/NCBI
|
|
17
|
Livak KJ and Schmittgen TD: Analysis of
relative gene expression data using real-time quantitative PCR and
the 2(−Delta Delta C(T)) method. Methods. 25:402–408. 2001.
|
|
18
|
Sumizawa T, Chen ZS, Chuman Y, et al:
Reversal of multidrug resistance-associated protein-mediated drug
resistance by the pyridine analog PAK-104P. Mol Pharmacol.
51:399–405. 1997.PubMed/NCBI
|
|
19
|
Shi Z, Tiwari AK, Shukla S, et al:
Inhibiting the function of ABCB1 and ABCG2 by the EGFR tyrosine
kinase inhibitor AG1478. Biochem Pharmacol. 77:781–793. 2009.
View Article : Google Scholar : PubMed/NCBI
|
|
20
|
Minotti AM, Barlow SB and Cabral F:
Resistance to antimitotic drugs in Chinese hamster ovary cells
correlates with changes in the level of polymerized tubulin. J Biol
Chem. 266:3987–3994. 1991.PubMed/NCBI
|
|
21
|
Westermann S and Weber K:
Post-translational modifications regulate microtubule function. Nat
Rev Mol Cell Biol. 4:938–947. 2003. View
Article : Google Scholar : PubMed/NCBI
|
|
22
|
Sasse R and Gull K: Tubulin
post-translational modifications and the construction of
microtubular organelles in Trypanosoma brucei. J Cell Sci.
90:577–589. 1988.PubMed/NCBI
|
|
23
|
Belhoussine R, Morjani H, Sharonov S,
Ploton D and Manfait M: Characterization of intracellular pH
gradients in human multidrug-resistant tumor cells by means of
scanning microspectrofluorometry and dual-emission-ratio probes.
Int J Cancer. 81:81–89. 1999. View Article : Google Scholar : PubMed/NCBI
|
|
24
|
Jiang LW, Maher VM, McCormick JJ and
Schindler M: Alkalinization of the lysosomes is correlated with ras
transformation of murine and human fibroblasts. J Biol Chem.
265:4775–4777. 1990.PubMed/NCBI
|
|
25
|
Altan N, Chen Y, Schindler M and Simon SM:
Defective acidification in human breast tumor cells and
implications for chemotherapy. J Exp Med. 187:1583–1598. 1998.
View Article : Google Scholar : PubMed/NCBI
|
|
26
|
Gong Y, Duvvuri M and Krise JP: Separate
roles for the Golgi apparatus and lysosomes in the sequestration of
drugs in the multidrug-resistant human leukemic cell line HL-60. J
Biol Chem. 278:50234–50239. 2003. View Article : Google Scholar : PubMed/NCBI
|
|
27
|
Kokkonen N, Rivinoja A, Kauppila A, Suokas
M, Kellokumpu I and Kellokumpu S: Defective acidification of
intracellular organelles results in aberrant secretion of cathepsin
D in cancer cells. J Biol Chem. 279:39982–39988. 2004. View Article : Google Scholar : PubMed/NCBI
|
|
28
|
Alvarez M, Paull K, Monks A, et al:
Generation of a drug resistance profile by quantitation of
mdr-1/P-glycoprotein in the cell lines of the National Cancer
Institute Anticancer Drug Screen. J Clin Invest. 95:2205–2214.
1995. View Article : Google Scholar : PubMed/NCBI
|