Introduction
Genetic and epigenetic diversity as well as
physiological variations due to intratumoral environmental
heterogeneity is a hallmark of solid tumors in vivo(1,2).
Recently, this heterogeneity became more complex by the
identification of a putative cancer stem cell (CSC) or
tumor-initiating cell (TIC) population. These cells were shown to
exhibit epithelial-to-mesenchymal-transition (EMT) characteristics
and seem to be more aggressive (3,4).
However, there is no firm evidence whether these populations truly
exist in solid cancers (5,6) and unique phenotypic or physiological
TIC markers are not identified yet (7–9).
In breast cancer, the in vivo inoculation of
low cell numbers of CD24−/CD44+ but not
CD24+/CD44+ or ESA-purified cells from
primary tumors gave rise to xenograft tumors (10). The relevance of this marker
combination has been confirmed for breast tumor cells lines,
although the percentage of putative
CD24−/CD44+ breast cancer tumorsphere TICs
did not correlate with tumorigenicity (11). Furthermore, the molecular and
phenotypic analysis of primary invasive breast carcinomas revealed
that CD24− and CD24+ subpopulations were
present but this could not be correlated to any tumor
characteristic (12,13). Moreover, CD24+ cells
were found to be significantly increased in distant metastases and
readily give rise to invasive progeny, questioning the relevance of
CD24 expression as an indicator of TICs (12,14).
Current experimental evidence indicates that the
CD24-population might represent a more drug resistant phenotype. In
several in vitro breast cancer models, the
CD24+/CD44+ population declined but the
CD24−/CD44+ fraction increased after
herceptin treatment (15). In a
similar study, paclitaxel treated CD24−/CD44+
breast cancer cells were more resistant to cytotoxic drug treatment
compared to the total population (16). In line with these studies, a
CD24−/CD44+ gene expression signature was
reported in breast cancer patients after chemo- or endocrine
therapy (17). However,
controversial data are reported for drug treated breast cancer
patients. For example, a histochemical analysis of breast
carcinomas revealed a lower percentage of
CD24−/CD44+ cells after chemotherapy and
there was no correlation with chemotherapy response or patient
survival (18).
In addition to cell surface markers, functional
parameters such as aldehyde dehydrogenase activity (ALDH1) or the
presence of an ABC transporter dependent Hoechst side population
(SP) were suggested to identify breast TICs. In a variety of breast
cancer cell lines, only the ALDH1 positive cell fraction developed
xenograft tumors (19–21) and lower metastasis-free survival
correlated with increased ALDH1 expression in inflammatory breast
cancer (21). Furthermore, in
established breast cancer cell lines the Hoechst SP was shown to be
more resistant to paclitaxel treatment and ionizing radiation and
displayed a higher in vivo take rate (16,22).
Additionally, a genetic analysis indicated that the
tumor-initiating cellular phenotype with EMT characteristics was
regulated by transcription factors like Twist, Snail or Zeb
(4,23). In breast cancer cells, Twist
expression correlates with an increase of TIC parameters such as
CD24−/CD44+ expression, enhanced ALDH1
activity and a higher SP fraction (24). Further support is given by Twist or
Snail expressing, immortalized human mammary epithelial cells
acquiring EMT characteristics and a more tumorigenic phenotype
in vivo(25).
Besides the serial transplantation of tumors, the
mammo- or tumorsphere technology is widely accepted for the
cultivation of mammary stem- or tumor-initiating cells (26). Pluripotency and differentiation
capability of TIC spheres was indicated by the induction of
differentiation related markers such as cytokeratins in their
monolayer derivatives (11,27).
Investigating CD marker expression, ALDH1 activity
and SP fraction, we report that no difference between highly and
low tumorigenic cells was observed. Also, stem cell relevant
transcription factors were not increased in the highly tumorigenic
spheres derived from cell line S2N. Hence, we suggest that still
unknown tumor cell markers and/or environmental factors affect the
increased tumorigenicity of sphere cells in vivo.
Materials and methods
Tumor specimens and cells
Tumor tissue from breast cancer patients (no.1
female, 55 years, G2; no.2 female, 85 years, G2) was obtained at
surgical treatment, in accordance with the ethical standards of the
responsible institutional committee at the University of Palermo on
human experimentation. Diagnosis was based on the histological
analysis and involvement of regional lymph nodes. Staging was
established according to the UICC TNM classification of malignant
tumor.
Enzymatic dissociation was performed using
collagenase (1.5 mg/ml, Aldrich, Taufkirchen, Germany) in PBS for 1
h at 37°C. Freshly purified breast tumor cells were depleted of
erythrocytes and leukocytes by ammonium chloride lysis and
microbeads, respectively (Miltenyi Biotec, Bergisch-Gladbach,
Germany). Mammospheres were grown as described previously in
mammary epithelial basal medium (Lonza, Cologne, Germany) utilizing
T75 low adhesion cell culture flasks (Corning Life Sciences,
Wiesbaden, Germany) and passaged every 3 to 4 days after sphere
formation (26). Monolayer
cultures were derived from mammosphere cells and cultivated in
collagen coated T75 cell culture flasks (BD Biosciences) using
mammary epithelial basal medium supplemented with 10% FBS
(Invitrogen). Monolayer cells were allowed to differentiate for at
least 10 days prior to analysis.
Cell cycle kinetics
Cell cycle kinetic analyses were performed as
described previously (28). DNA
fluorescence of nuclei was recorded using a FACS LSR II instrument
(BD Biosciences). Cell aggregates were excluded by PI-W/PI-A
gating.
Cell surface marker analysis
Disaggregated sphere or monolayer cells
(2×10⁵) were suspended in 100 μl ice-cold
MEBM/10% FBS. CD24-PE (clone ML5, BD Biosciences), CD29-A488 (clone
TS2/16, BioLegend, Eching, Germany), CD44-FITC (clone G44-26, BD
Biosciences), CD133-PE (clone TMP4, eBioscience), CD324
E-cadherin-A647 (clone 67A4, BioLegend), CD326 EpCAM-A647 (clone
1B7, eBioscience) antibodies and appropriate mouse-isotype controls
(BD Biosciences, BioLegend) were added according to the
manufacturer’s recommendations. Cells were stained for 30 min at
4°C in the dark and washed twice with 250 μl MEBM/10%
FBS.
Aldehyde-dehydrogenase-1 and side
population analysis
ALDH1 activity was measured using the AldeFluor
assay kit (Aldagen). Briefly, 5×10⁵ cells were suspended
in 500 μl assay buffer containing 2.5 μg ALDH1
substrate (BAAA) and incubated for 30 min at 37°C. An additional
sample was incubated concurrently with the specific ALDH1 inhibitor
diethylaminobenzaldeyde (DEAB).
The SP analysis was performed with 1×10⁶
cells/ml resuspended in 500 μl pre-warmed medium containing
5 μg/ml Hoechst 33342 (Sigma) in the presence (100
μg/ml) or absence of the ABCG2 inhibitor verapamil (Sigma).
Samples were incubated for 90 min at 37°C. Subsequently, cells were
pelleted at 375 g for 6 min at 4°C, resuspended in 300 μl
ice-cold medium and kept on ice until flow cytometric analysis.
Flow cytometry
Cells were analyzed on a FACSCanto II or LSR II (BD
Biosciences). Appropriate lasers and filters were used for PE,
FITC, A647 and A488 fluorescence recording. Hoechst 33342
excitation was performed at 355 nm and emission analysis was done
utilizing a 695/40 (Hoechst Red) and a 450/20 band pass filter
(Hoechst Blue). PI was excited at 488 nm and emission recording was
done with a 630/30 filter. Viable cells were identified as
PI-negative (2 μg/ml). Aggregates were excluded by single
cell gating in the side scatter/forward scatter width plot in all
experiments. Flow cytometry data were analyzed with the BD FACSDiva
(BD Biosciences) or FlowJo software (TreeStar, Olten,
Switzerland).
Protein isolation and western blot
analysis
Western blot analysis was carried out using the
NuPAGE System (Invitrogen) applying cells (2×10⁵/lane)
lysed in RIPA buffer (Sigma), supplemented with protease inhibitor
cocktail (Roche Diagnostics, Mannheim, Germany). For identification
of relevant proteins, PVDF membranes were incubated with 1:1,000
dilutions of rabbit polyclonal anti-human cytokeratin 5 (CK5;
Abcam, Cambridge, UK), mouse monoclonal anti-human CK18 (clone
C-04; Biozol, Eching, Germany), mouse monoclonal anti-human
vimentin (clone V9; Abcam) or mouse monoclonal anti-human GAPDH
(clone 6C5; Millipore, Schwalbach, Germany) at 4°C overnight. The
membranes were then washed, incubated with POD-conjugated
anti-mouse or anti-rabbit secondary antibody (Roche) at a dilution
of 1:1,000 and washed again. Bound secondary antibodies were
detected using standard chemiluminescence protocols utilizing
Lumi-Light western blotting substrates and Lumi-Film detection film
(Roche).
Gene expression analysis
Total-RNA was isolated using an RNeasy mini kit
(Qiagen, Hilden, Germany) followed by cDNA synthesis utilizing a
cDNA synthesis kit (Roche). Double-stranded cDNA was purified with
a Microarray Target Purification Kit (Roche) and transcribed into
cRNA using the Roche Microarray RNA Target Synthesis Kit (T7). cRNA
was purified with RNeasy Mini-Spin Columns (Qiagen). All kit
procedures were performed according to the manufacturer’s
instructions.
A total of 20 μg of the purified cRNA were
fragmented and processed for hybridization to Human Genome U133
Plus 2.0 arrays and scanning with an Affymetrix Gene Chip Scanner
3000 (7G) according to Affymetrix protocols. All samples were
measured in triplicates. Data were analyzed using in-house software
or Partek analysis suite (Partek).
Tumor xenograft mouse studies
Female NOD/SCID mice were purchased from 2 M&B
Bomholtgard (Ry, Denmark). Animals were quarantined for one week
for acclimatization and observation. Animals were kept under
SPF-conditions according to the international guidelines (GV-Solas;
Felasa; TierschG). All experiments were reviewed and approved by
the local government (Regierung von Oberbayern; registration no.
211.2531.2-22/2003). 1×10³, 1×10⁴ or
1×10⁶ tumor cells (viability >90%) per 50 μl
Matrigel (BD Biosciences) were injected subcutaneously. Sphere
cells were inoculated into the right and monolayer cells into the
left flank of the mice. Inoculation was directed to the backbone of
the mice. Tumor growth from 10 mice in each cohort was quantified
by caliper measurements. Tumor volume was calculated by callipering
the largest diameter (A) and its perpendicular (B) according to the
NCI protocol [TV = (A × B2)/2].
Results
In vivo, tumor-initiating cell
characteristics are only present in S2N spheres, but not in S2N
monolayer cells or S2 spheres or monolayer cells
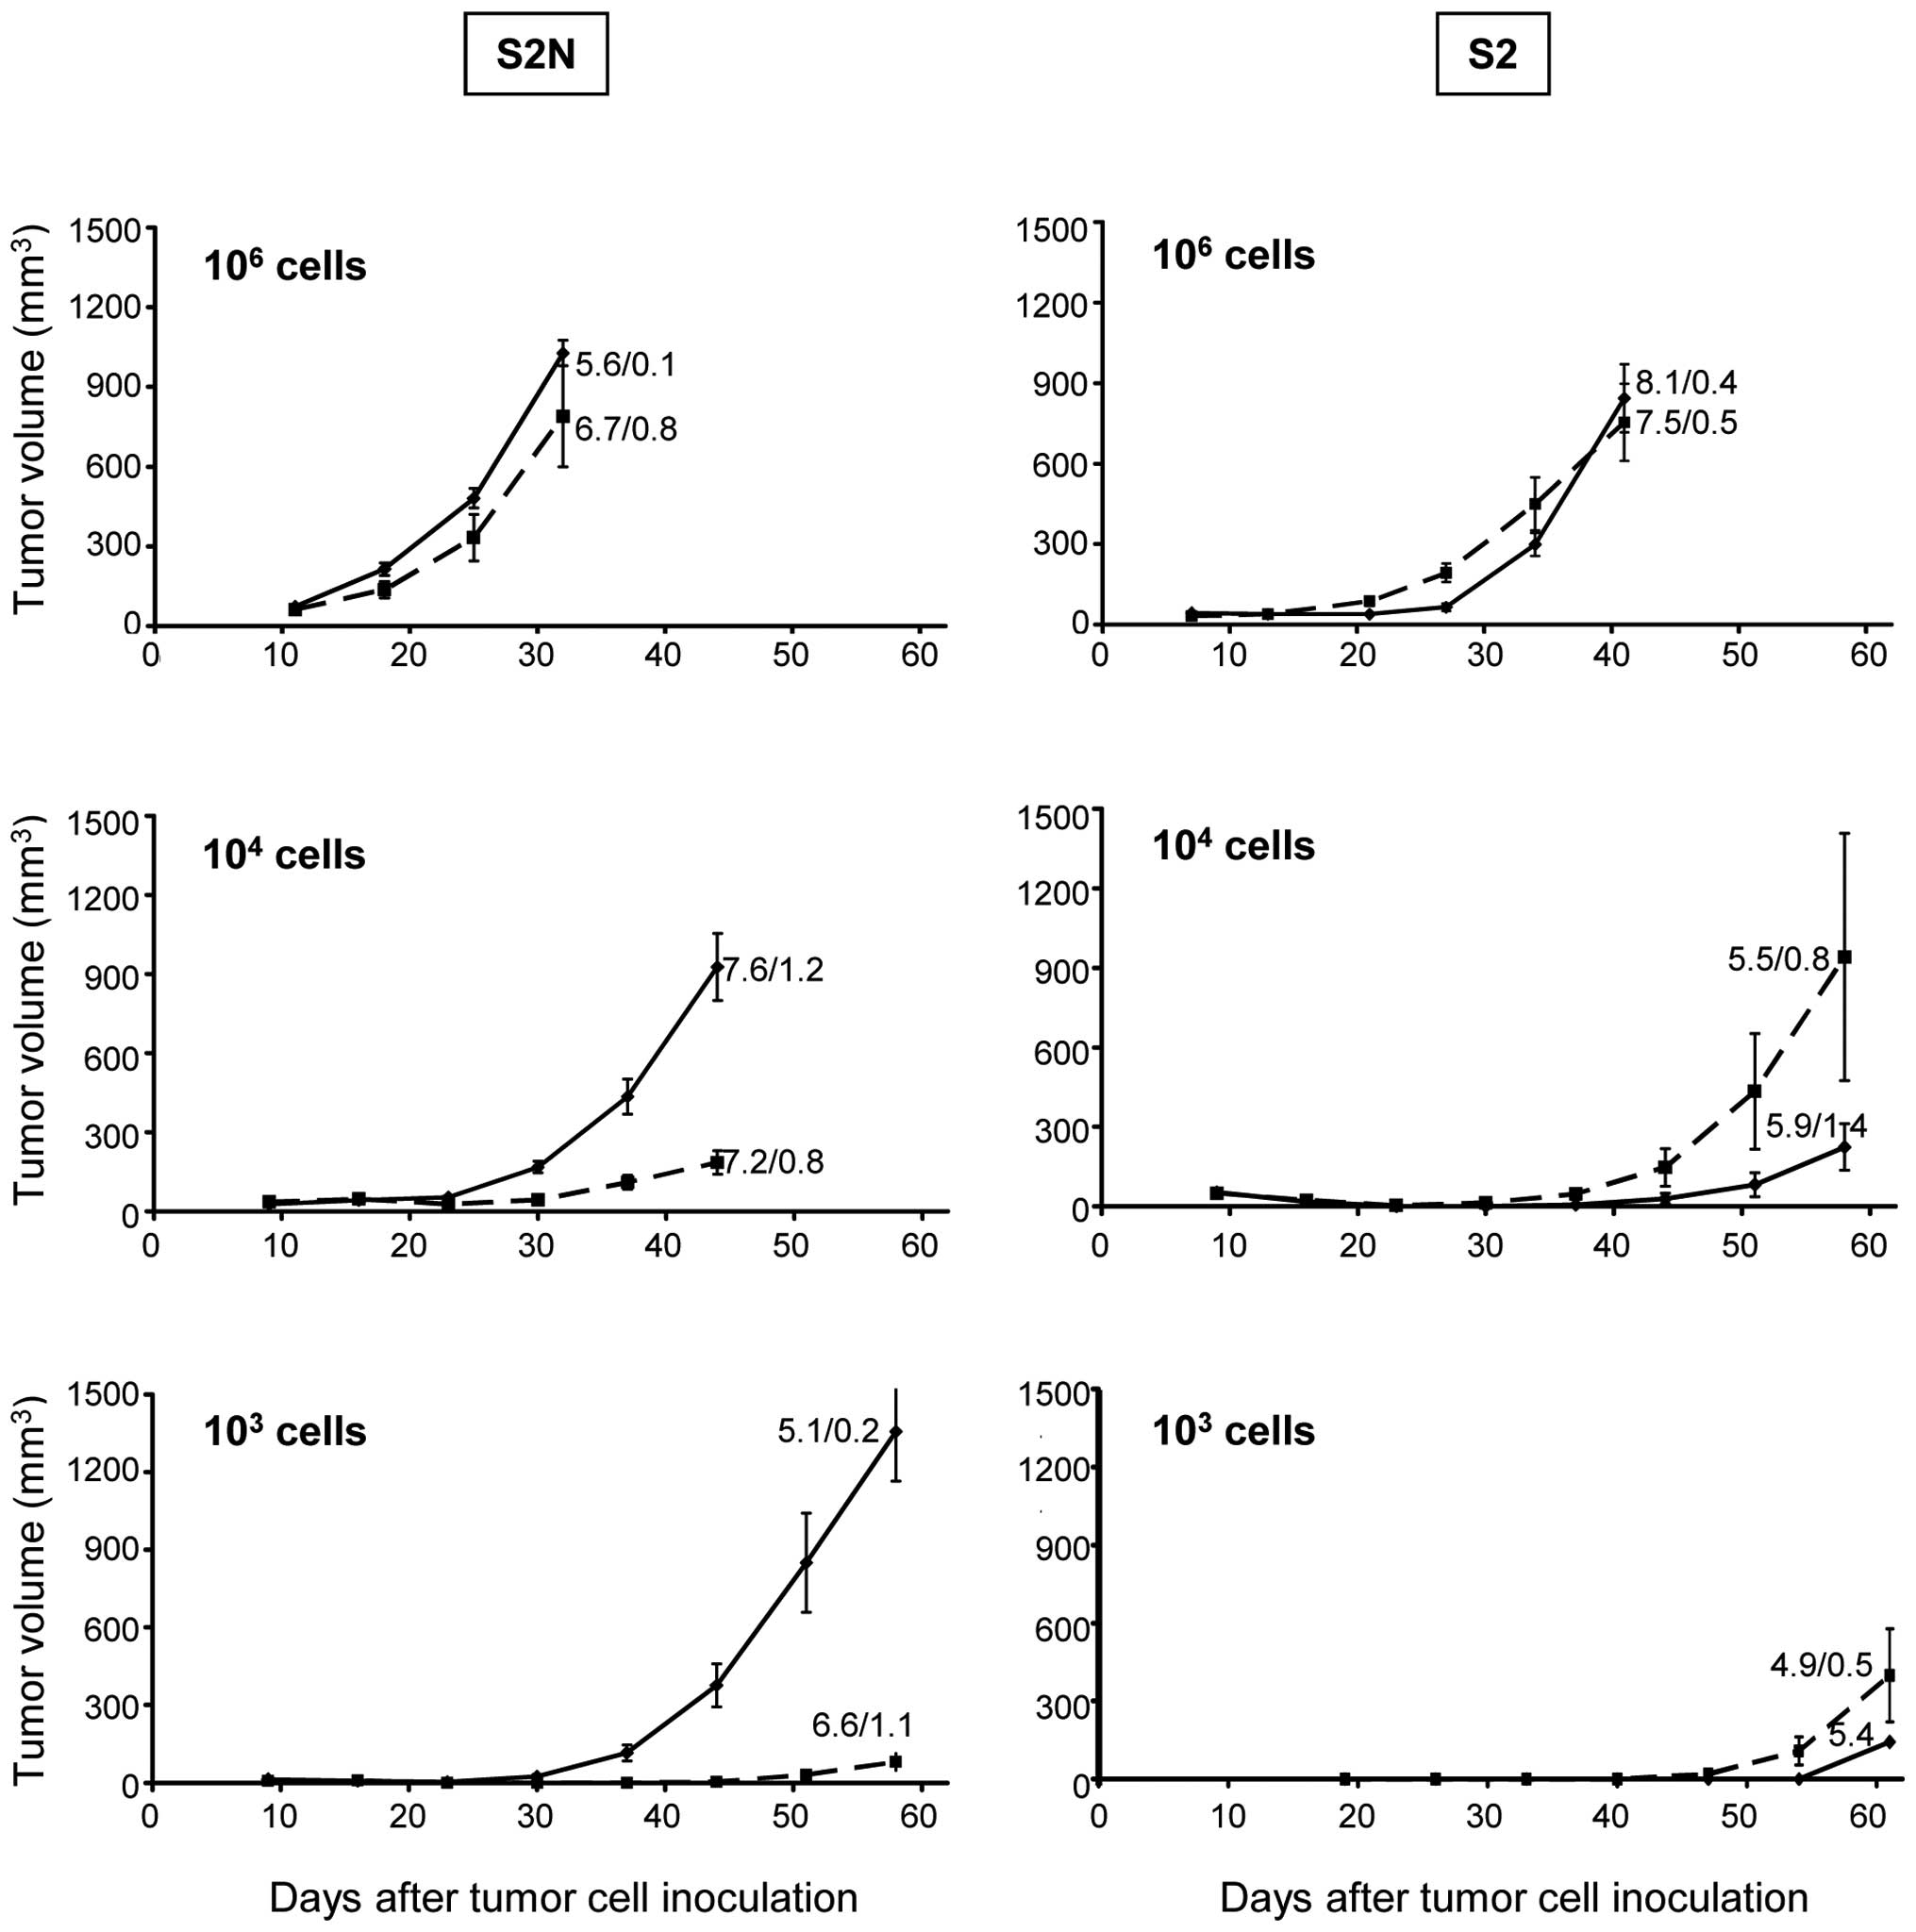
Tumor xenograft growth after inoculation of low cell
numbers in mice is an important criterion for cancer stem cells
in vivo. We therefore verified the tumor-initiating cell
capacities of our cell lines by inoculating serial dilutions of
disaggregated cells from monolayer and sphere cultures. The cell
lines S2 and S2N were isolated from human breast cancer tumors and
either cultivated on tissue culture plates (to differentiate) or in
suspension (to remain undifferentiated). These putative breast
cancer sphere TICs were subcutaneously inoculated into the right
flank whereas breast cancer monolayer cells were inoculated into
the left flank of the mice.
As shown in Fig. 1,
there were no differences in tumor growth between S2 spheres and
their respective monolayer cells after inoculation of
106 cells.
At lower inoculation cell numbers of 104,
we observed an even increased monolayer cell derived xenograft
tumor growth which, however, was due to the exceptionally high
growth rate of 3 tumors in the study cohort of this experiment
(Fig. 1 right column). Poor in
vivo growth was evident in the S2 103 cell
inoculation group for monolayer as well as sphere cells. S2N sphere
or monolayer cells inoculated with 106 cells displayed
growth characteristics comparable to S2 cells. However, there was
an increasingly strong and significant delay in tumor growth of
monolayer cultures compared to sphere cultures when the inoculation
cell numbers were reduced to 104 (p<0.01 at all study
days). The reduced tumor growth was even more pronounced at
103 cells (Fig. 1 left
column; p<0.01 at all study days).
In order to see whether individual growth rate
differences account for the different xenograft growth kinetics, we
calculated the population doubling times from the in vivo
growth curves. As evident by the numbers in Fig. 1, the population doubling times of
xenograft tumors ranged from 4.9 to 8.1 days; however, there was no
significant alteration between different cell numbers. Furthermore,
in vitro population doubling times between sphere and
monolayer cells as well as the highly tumorigenic S2N and weakly
tumorigenic S2 cell model were similar (data not shown).
Cell morphologies and cell cycle kinetics
of highly and weakly tumorigenic cell lines are similar
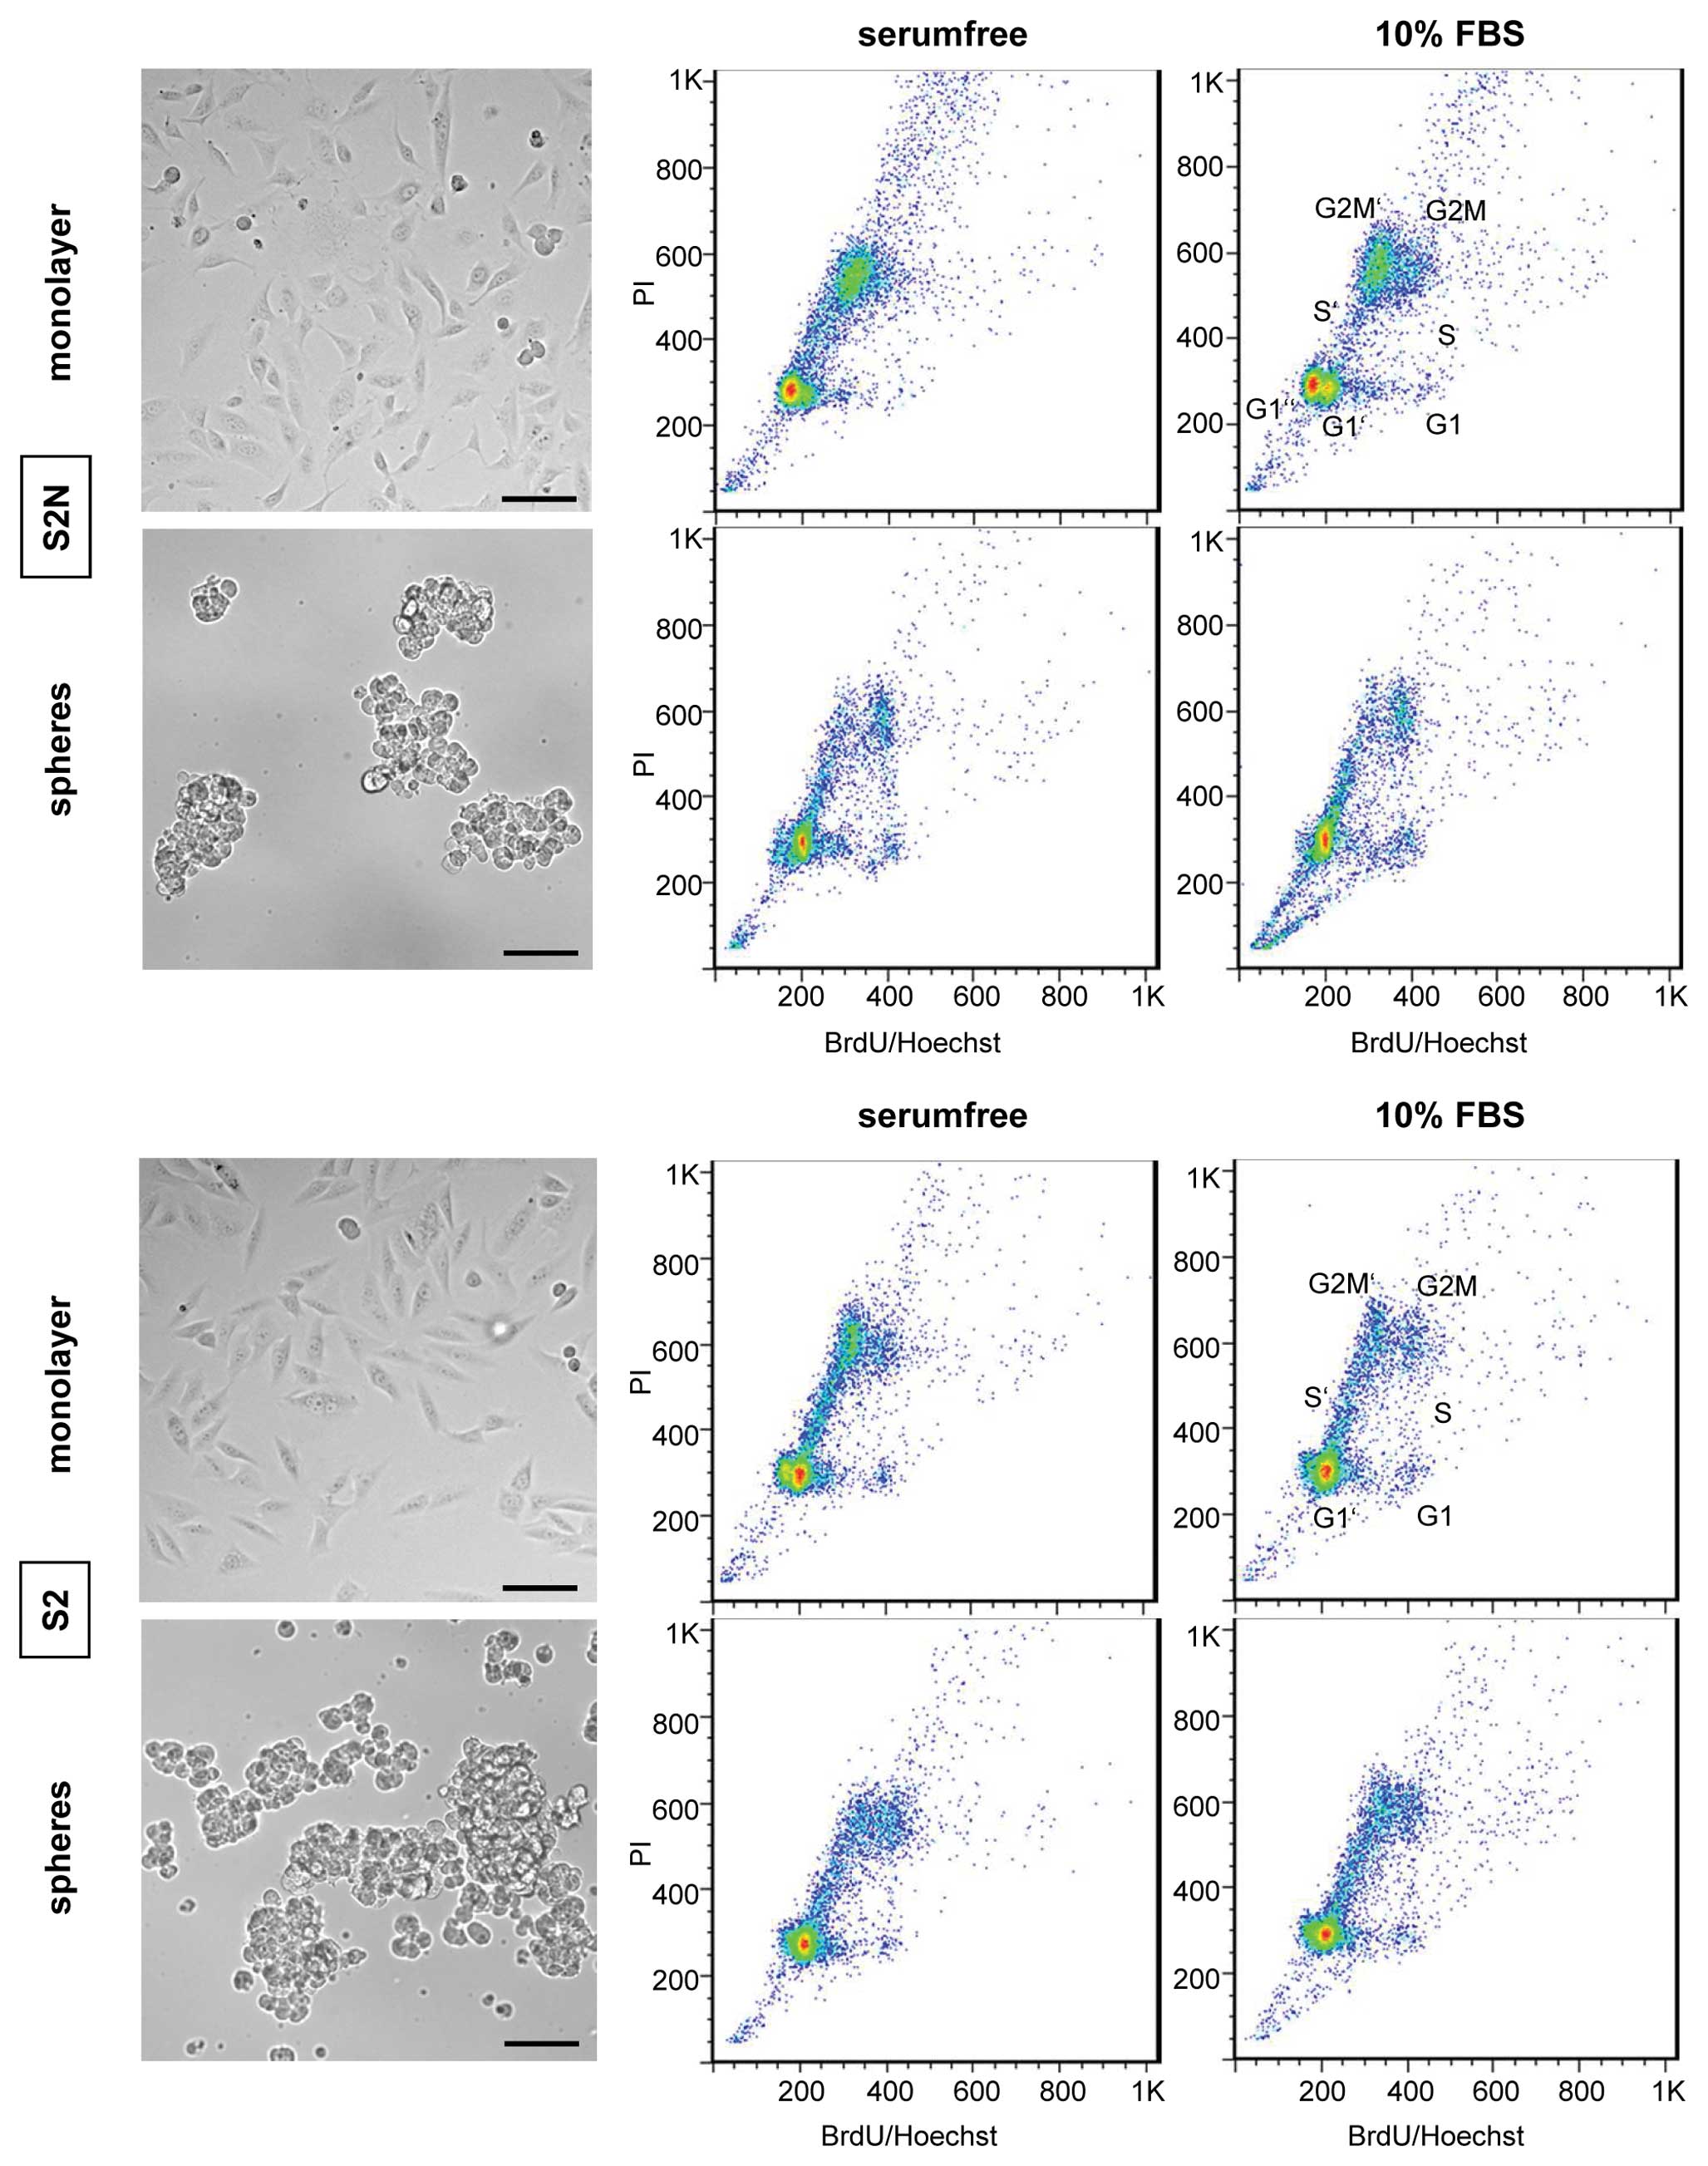
Both the highly tumorigenic S2N as well as the
weakly tumorigenic S2 cells exhibit similar cell morphologies when
grown as 2D monolayer or as 3D culture in suspension (Fig. 2). The 3D morphologies resemble
tight aggregates rather than true spheres, which obviously is due
to the absence of E-cadherin in both cell models (28). For any phenotype analysis and
functional in vitro study, cells were cultivated to
subconfluency (monolayer) or to 3D sizes (spheres) as shown in
Fig. 2.
Since in vitro growth rate differences might
affect comparative in vivo cell analytical results, we
evaluated whether in vitro cell cycle differences exist
between serum-free cultivated spheres and the monolayer cells grown
in 10% FBS. To this end, we applied a high resolution 48 h cell
cycle kinetic technique that displays up to 3 consecutive cell
cycles within one sample (29).
Fig. 2 shows that the S2N
monolayer cultures grew somewhat faster since more cells have
already reached the G2M’ phase in the 2nd and the G1” phase in the
3rd cell cycle compared to the sphere culture. The media
composition did not affect the cell growth rate since there was no
difference in the cell cycle kinetic pattern. The cell cycle
kinetic pattern of weakly tumorigenic S2 cells was neither affected
by different medium serum composition nor by 2D or 3D cultivation
technique (lower panels Fig.
2).
Monolayer cells display a
differentiation-like phenotype
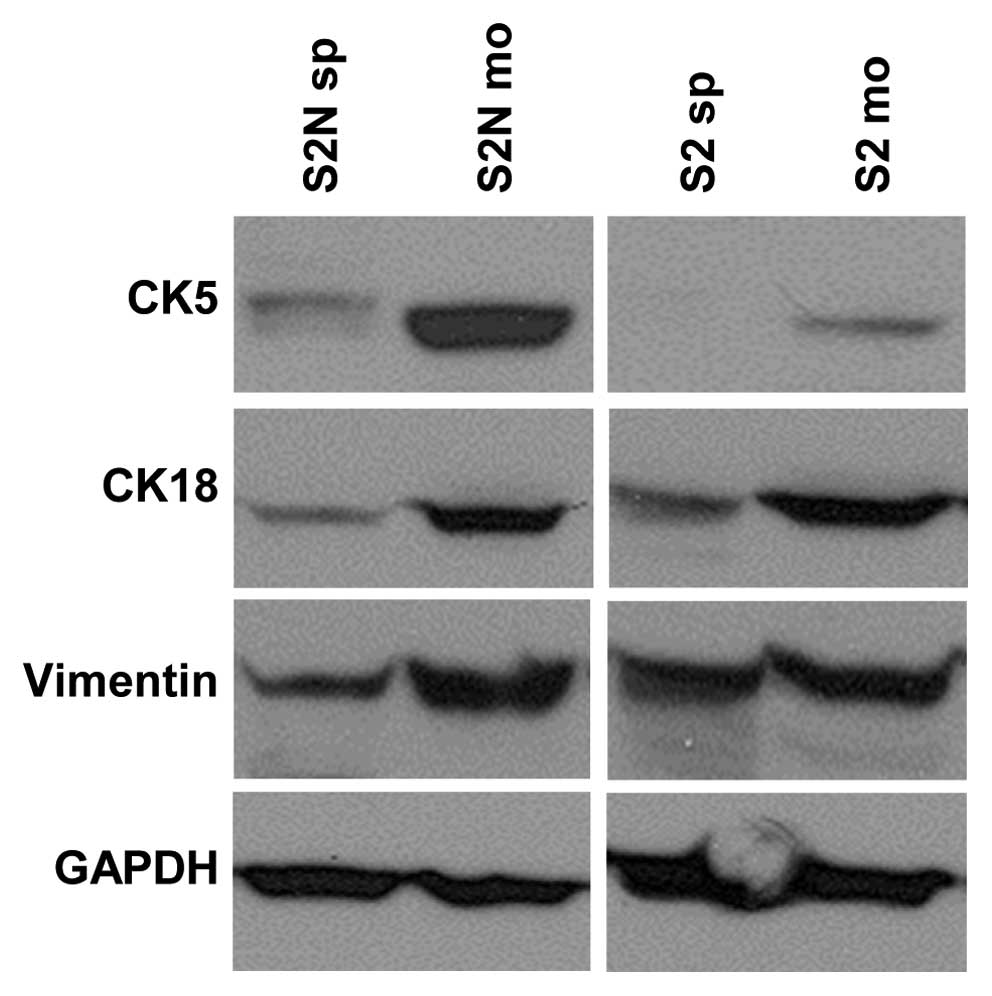
To determine the differentiation status of monolayer
and sphere cells, we performed western blot analyses targeting the
epithelial markers cytokeratin 5 (basal) and 18 (luminal) as well
as the mesenchymal marker vimentin (Fig. 3). 2D monolayer cultures were
derived from spheres by transferring the cells from a serum-free
environment to serum-containing medium. Cells were allowed to
adhere and grow on a collagen-coated surface for at least 10 days.
Differentiation-like events are indicated by upregulation of
epithelial markers. Indeed, basal cytokeratin 5 is slightly
expressed in monolayer cells of line S2, whereas no CK5 was
detected in corresponding spheres. Strong CK5 upregulation was
identified in S2N monolayers. Differences in luminal cytokeratin 18
expression were similar for both cell lines with slight
upregulation in monolayer cells. Furthermore, the decrease of
cadherin-11 (change factor 99.7), N-cadherin (16.3), SnaI2 (0.6)
and Twist (0.8) mRNA in S2N monolayer cells indicates a more
differentiated status of monolayer cells compared to serum-free
cultured spheres. This suggests that the spheroid cells might have
undergone epithelial-to-mesenchymal-transition (EMT) processes. The
intermediate filament marker vimentin was not useful as mesenchymal
indicator, since it is expressed in both cell lines independently
of tumorigenicity in the mouse xenograft model.
Established cancer stem cell markers are
not indicative of in vivo tumorigenicity
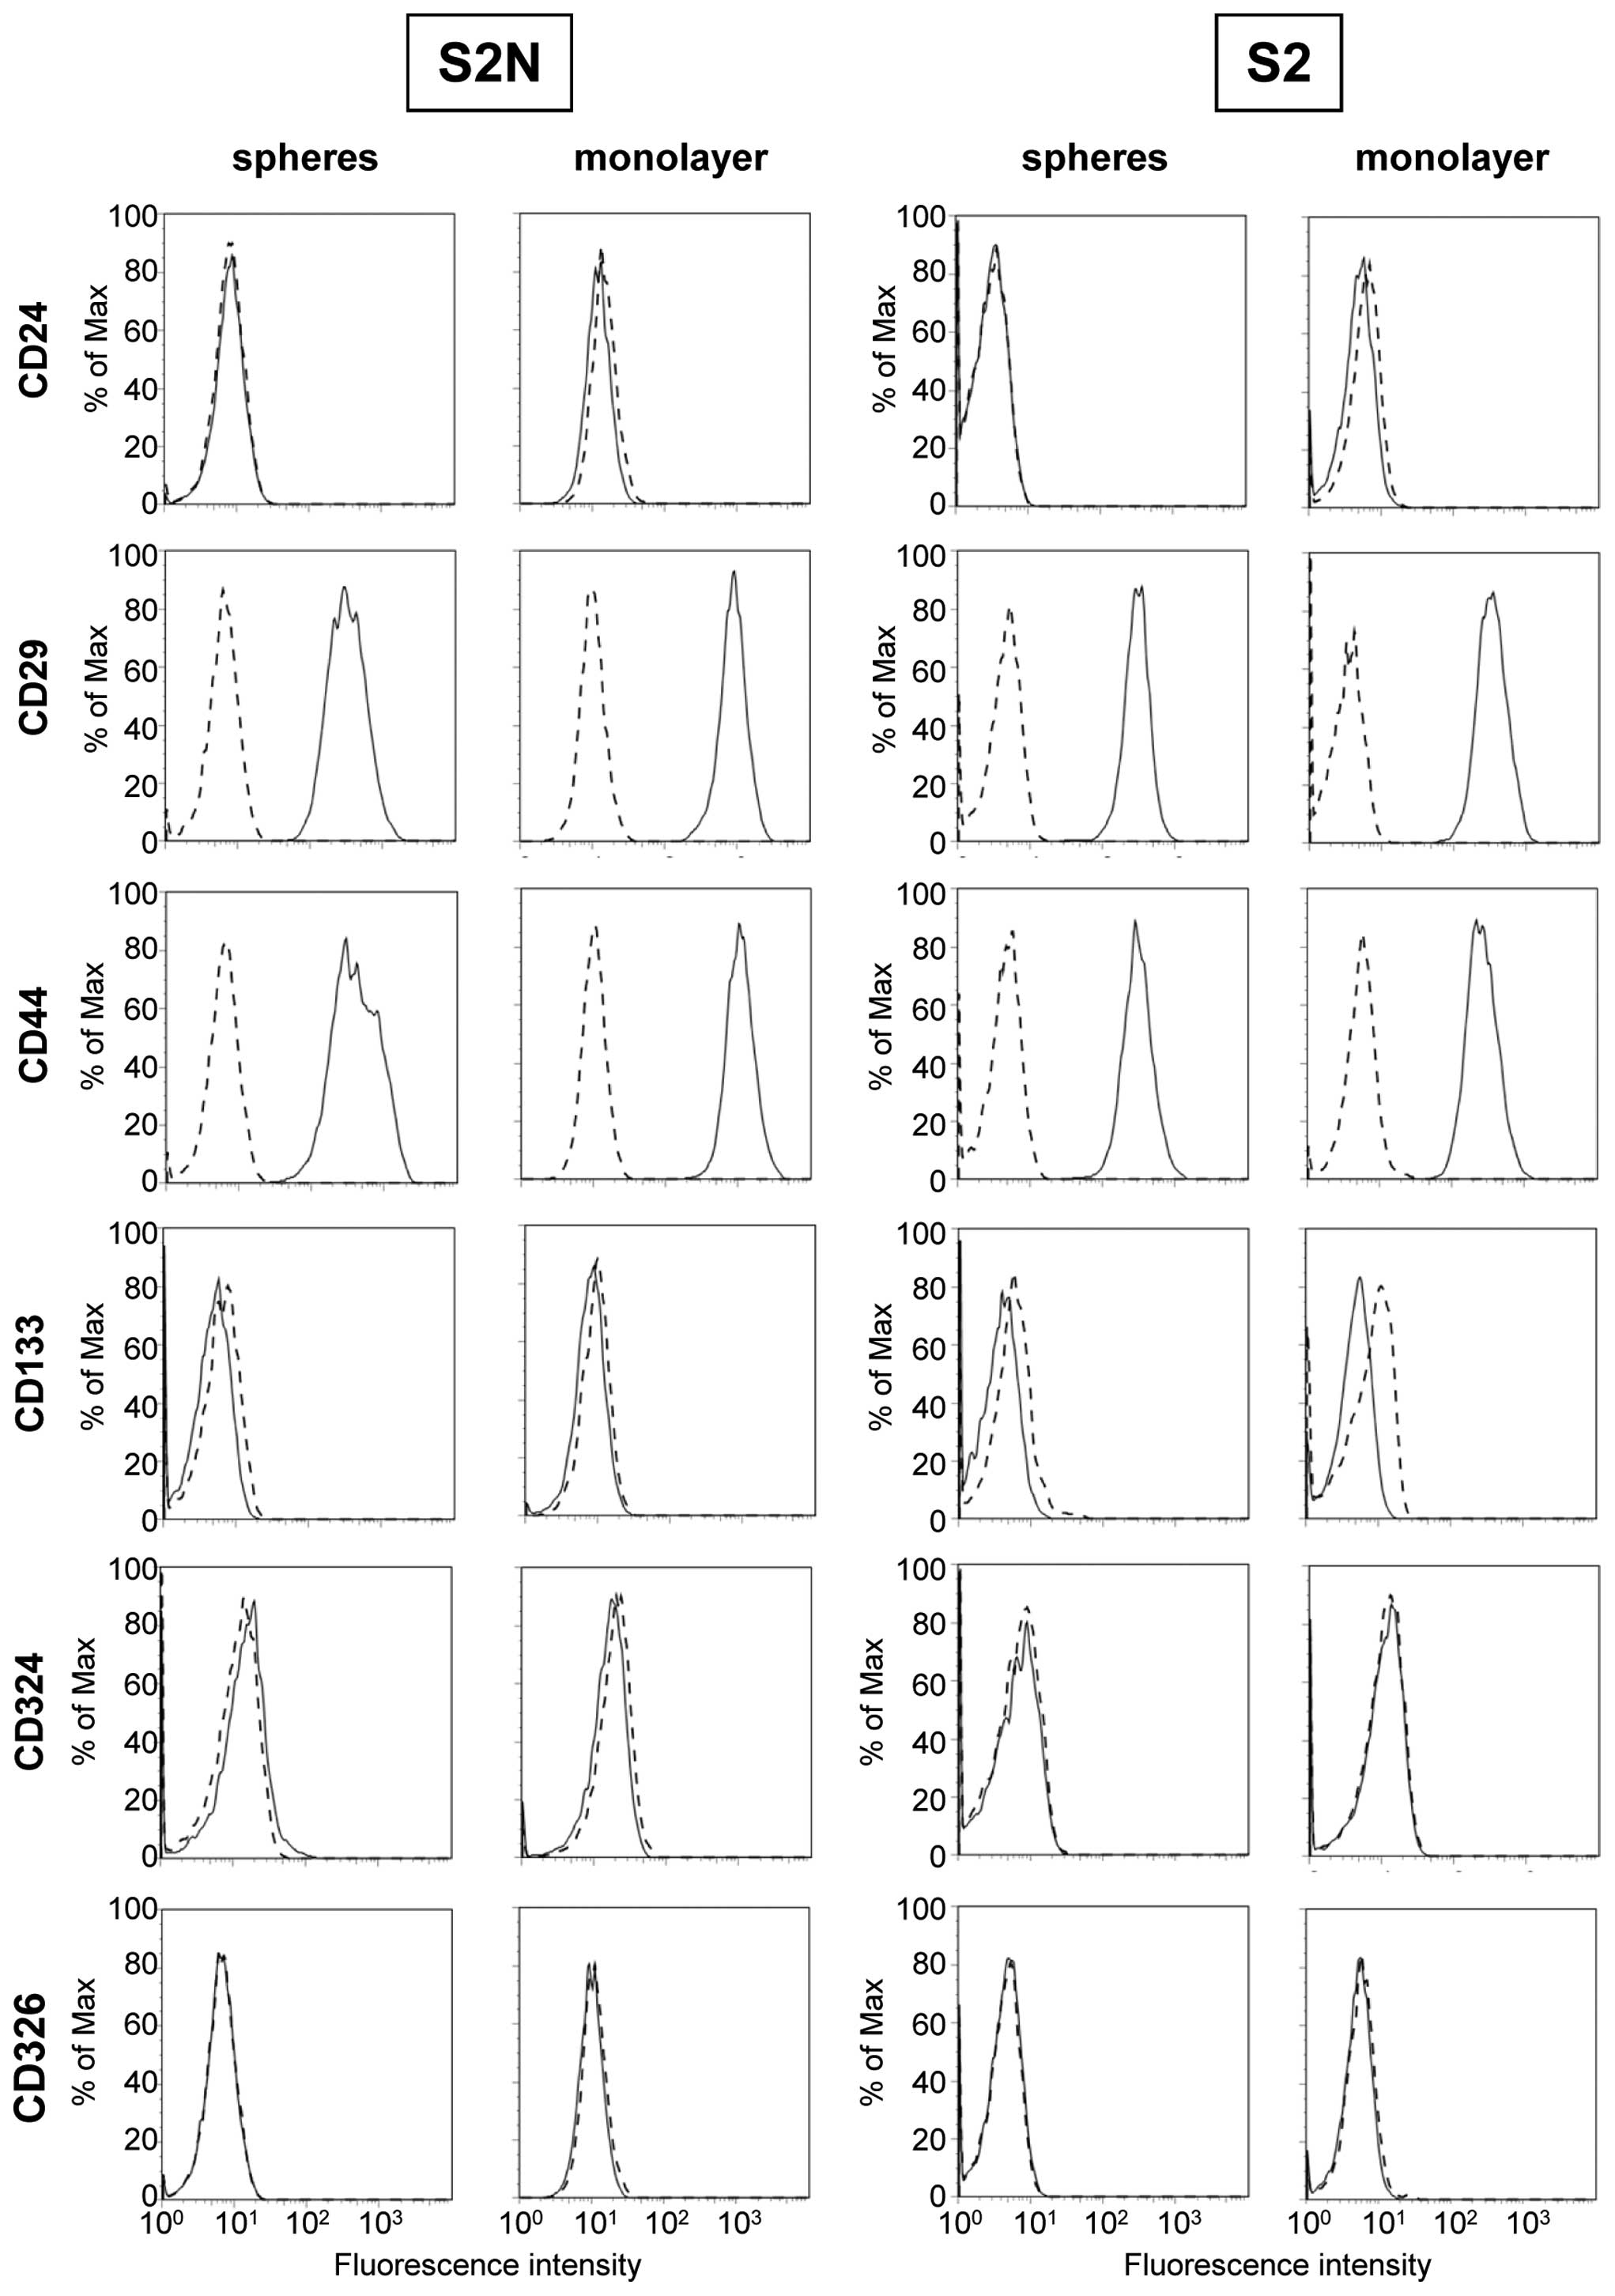
In order to verify published cancer stem cell
markers, we first compared surface molecule expression on monolayer
and sphere cells and evaluated differential expression on highly
tumorigenic cell line S2N and weakly tumorigenic line S2 (Fig. 4). All antibodies used were verified
using appropriate cell lines (data not shown). As displayed in
Fig. 4, both S2 and S2N lines are
CD24 negative, but strongly express CD44. There is no difference in
the CD24/CD44 expression pattern, either between spheres and
monolayer of the same cell line, or in comparison of the highly
tumorigenic versus the weakly tumorigenic cell line. Moreover, CD24
and CD44 double staining dot plots did not reveal any distinct,
minor subpopulations (data not shown). Similar to CD44, we
confirmed the presence of putative cancer stem cell marker CD29,
but the expression on sphere and mono-layer cells of both cell
lines was almost identical. The measured fluorescence intensity of
bound CD29 antibody was roughly two decades above background on all
sphere and monolayer cells. In addition to the CD24/CD44 marker
set, CD29 expression is also not correlated with the aggressive
growth characteristics of highly tumorigenic S2N spheres in mice.
Moreover, established cancer stem cell markers CD133 and CD326
(EpCAM) were not detected on any cell line (Fig. 4). Loss of CD324 (E-cadherin) is
thought to indicate an EMT process. All cell types were found to be
E-cadherin negative and therefore this marker cannot be correlated
with in vivo growth characteristics of highly and weakly
tumorigenic cells.
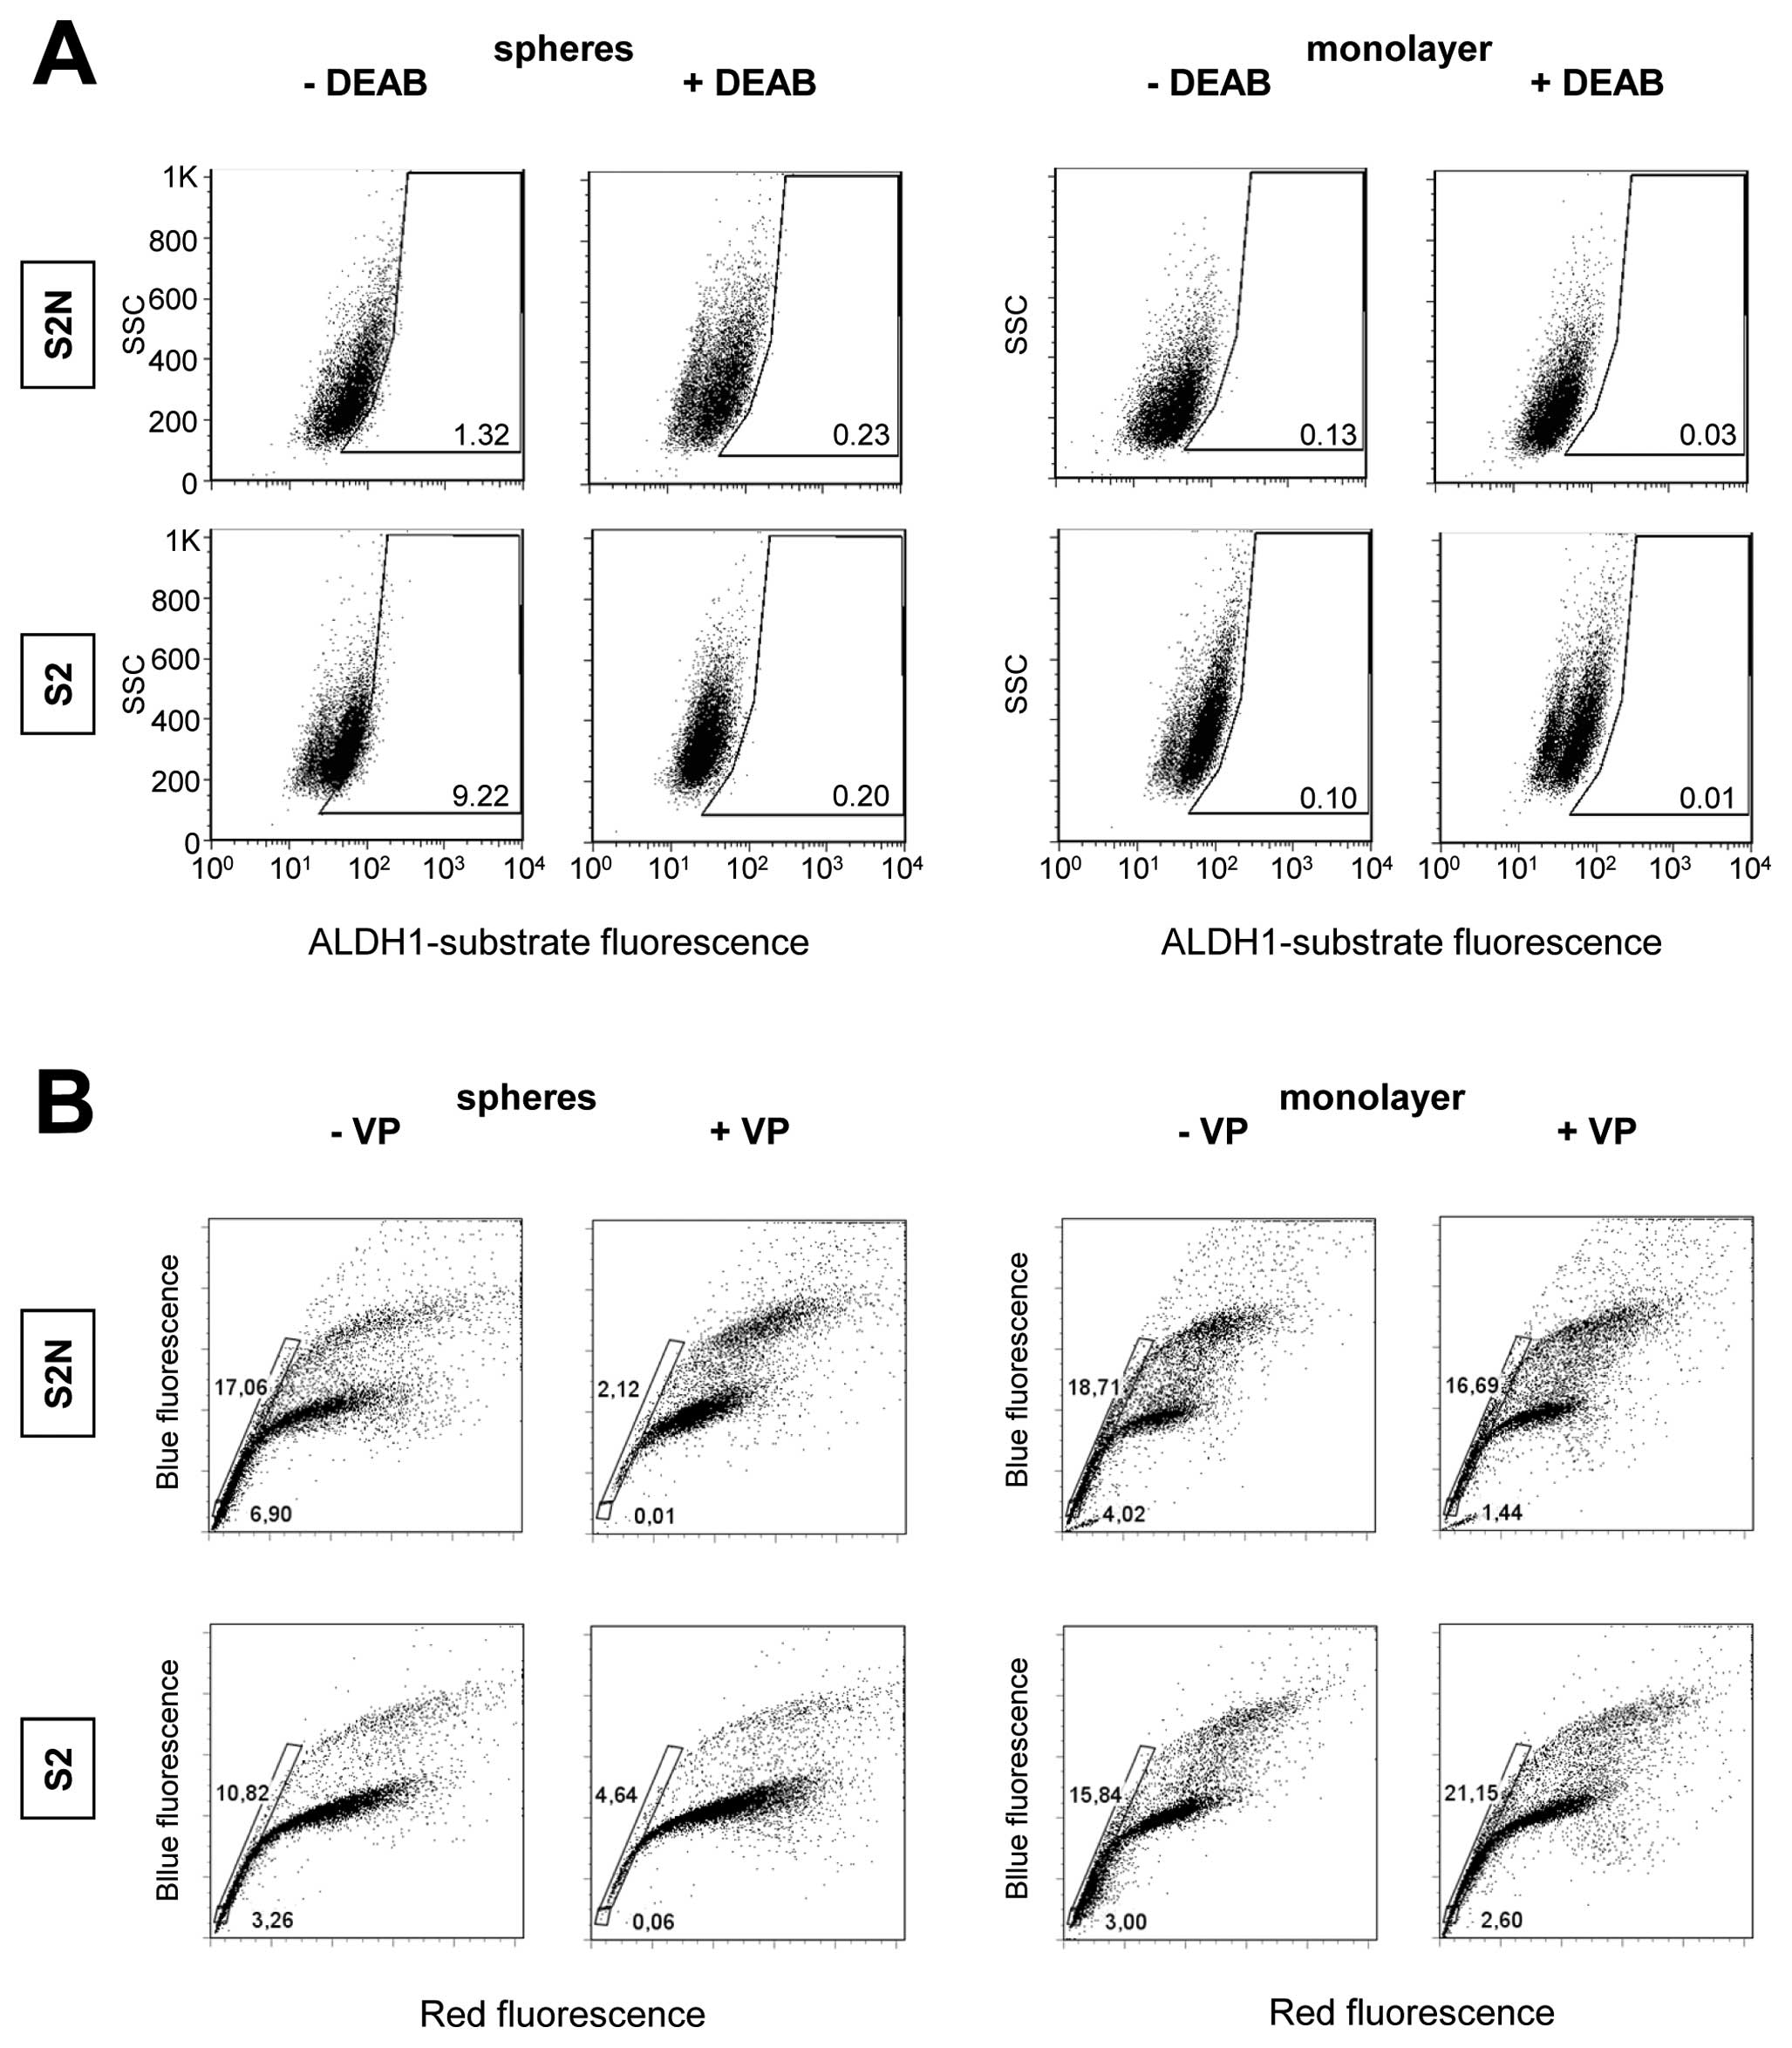
Increased ALDH1 activity has been reported as a
marker for cancer stem or stem-like cancer cells of some human
malignancies. The functionality of the ALDH1 assay was validated by
the DEAB sensitive, CD34+/CD38− stem/early
progenitor cell fraction from human bone marrow (data not shown).
We then tested S2N and S2 sphere and monolayer cells for ALDH1
activity. A baseline fluorescence region was set close to the
cluster of DEAB treated cells (Fig.
5A). Fig. 5, which displays a
representative experiment out of 3 replicates, shows that
independent of the in vivo tumorigenicity, S2N and S2 sphere
cells exhibited a fraction of DEAB sensitive ALDH1+
cells. Interestingly, this subpopulation was even higher in the
weakly tumorigenic S2 (± DEAB, 9.22/0.2%) compared to the highly
tumorigenic S2N cells (± DEAB, 1.32/0.23%). Much smaller fractions
of DEAB-sensitive ALDH1 positive cells were found in the monolayer
cells from both S2N and S2 cells. These findings are supported by
our gene array study which revealed that none of the ALDH1 isoforms
1A1, 1A2, 1A3, 1B1, 1L1 and 1L2 showed any correlation with the
tumorigenicity of the cells (data not shown). Of note is the fact
that the cell clusters shift to smaller ALDH1 values in the
presence of the DEAB with no evidence of a tumorigenicity related
change (fluorescence means ± DEAB, S2 spheres 46.9/24.3; S2
monolayer 68.1/51.0; S2N spheres 61.3/45.4; S2N monolayer
32.9/34.8). Finally, our analyses indicate the absence of true
ALDH1 positive subpopulations (Fig.
5A).
SP cells were reported to express various stem cell
markers, exhibit self-renewal capabilities and generate
differentiated cells. We investigated a putative association
between SP incidence in the cell lines and their tumorigenicity in
mouse xenograft experiments utilizing flow cytometry and Hoechst
dye efflux assays. As cells discard Hoechst 33342, a discrete side
population is formed in a Hoechst blue/Hoechst red plot, appearing
at the lower left to the stained cell clusters of G1, S and G2
phases (Fig. 5B). The ABCG2
inhibitor verapamil indicates the specificity of the SP relevant
transporter. Spheres of highly tumorigenic line S2N as well as
spheres of weakly tumorigenic cells display verapamil sensitive
side populations (Fig. 5B). S2N
spheres contain a slightly higher percentage of SP cells (18%, with
VP 2%) than S2 spheres (11%, with VP 5%). Interestingly, all
monolayer cells exhibit an even higher portion of SP cells (S2N,
19%; S2, 17%), but dye efflux was not reduced by adding verapamil.
The expression analysis of Hoechst 33342 transporter ABCG2 also
showed no correlation with the tumorigenicity of the cells (S2N
spheres 13.5, S2 spheres 236.4, S2N monolayer 90.6, S2 monolayer
176.9).
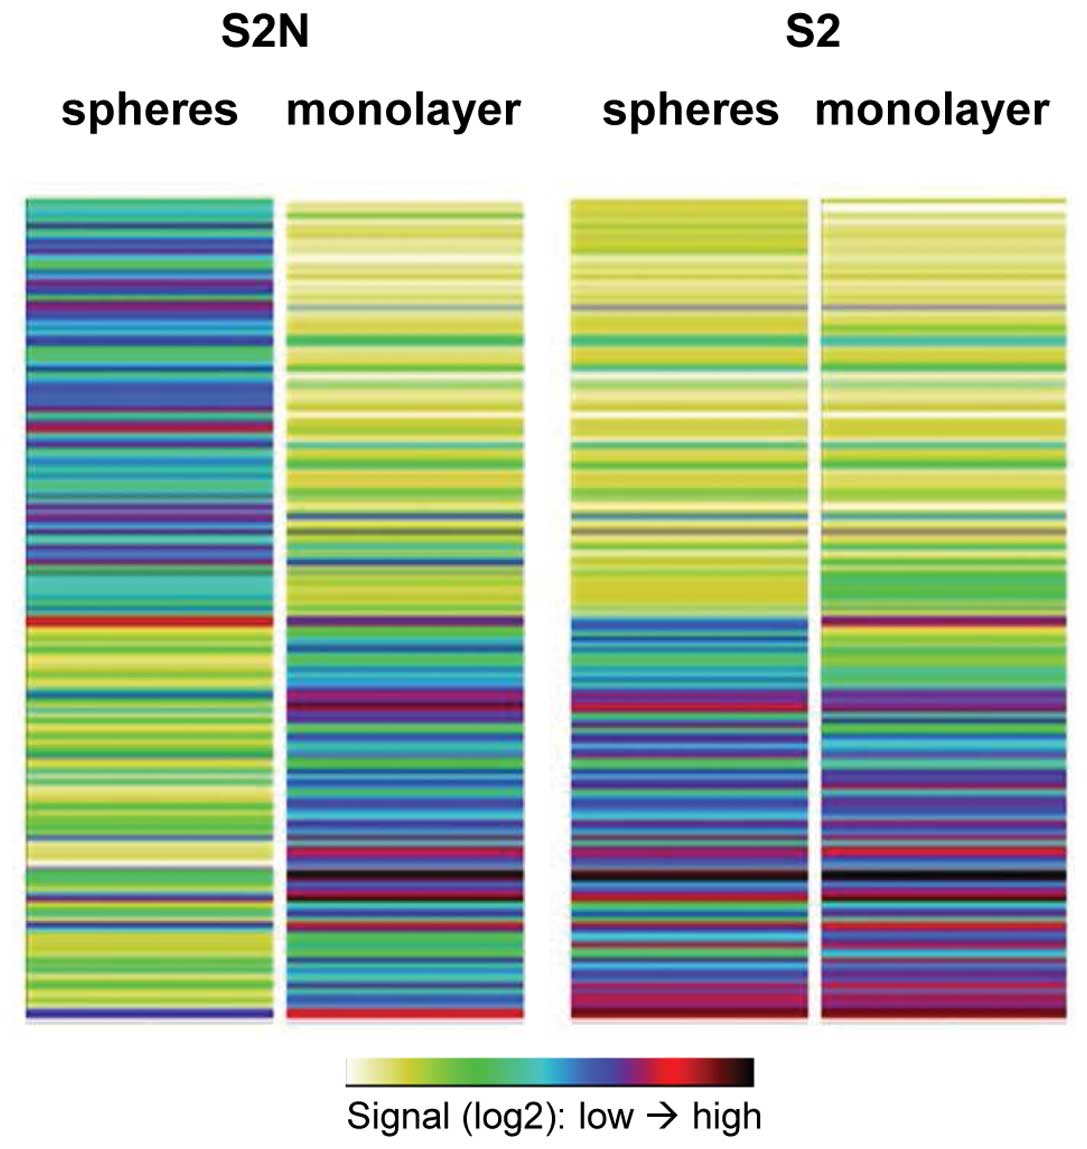
Highly tumorigenic S2N spheres display a
distinct mRNA expression pattern compared to monolayer cells and
weakly tumorigenic S2 spheres
Comparison of the gene expression patterns of S2N
and S2 sphere cells to their respective monolayer counterparts
revealed a unique expression pattern of highly tumorigenic S2N
sphere cells (Fig. 6).
Furthermore, there was a high similarity between the weakly
tumorigenic S2 sphere and monolayer cells with the more
differentiated S2N monolayer cells indicating that the in
vitro cultivation technique cannot solely explain the
tumorigenicity of our cell models.
To identify transcription factors reported to be
relevant for normal and tumor stem cell phenotype, we performed an
in depth gene expression analysis of the highly tumorigenic S2N
sphere versus their more differentiated, weakly tumorigenic
monolayer daughter cells. Stem cell associated mRNA species such as
Oct3, Sox1, Sox2 or Nanog were undetectable in both cell lines
(Table I). Although Oct3 and Sox1
proteins were weakly expressed and detectable by western blot
analysis, there was no increased expression in the highly
tumorigenic S2N spheroid cells (data not shown). Except KLF4 and
Notch 3, most of the stem cell relevant transcription factors were
even expressed at higher levels in monolayer cells. A slightly
higher expression of both EMT transcription factors SnaI2 and
Twist1 was found in the highly tumorigenic sphere cells, but the
expression differences were rather small.
 | Table IExpression of stem cell relevant
transcription factors in S2N cells. |
Table I
Expression of stem cell relevant
transcription factors in S2N cells.
| Gene name | Locus ID | Change expression
monolayer vs. sphere | Remark |
|---|
| Oct3 (Oct
4) | 5460 | | No signal above
background |
| Sox1 | 6656 | | No signal above
background |
| Sox2 | 6657 | | No signal above
background |
| Sox4 | 6659 | 2.74 | |
| Sox7 | 83595 | 1.22 | |
| Sox9 | 6652 | 1.35 | |
| KLF4 | 9314 | −1.36 | |
| Notch1 | 4851 | 0.23 | Statistically not
significant |
| Notch2 | 4853 | 0.67 | |
| Notch3 | 4854 | −3.30 | |
| Notch4 | 4855 | 0.24 | Statistically not
significant |
| Nanog | 79923 | | No signal above
background |
| Myc | 4609 | 0 | |
| SnaI2
(Slug) | 6591 | −0.59 | |
| Twist1 | 7291 | −0.83 | |
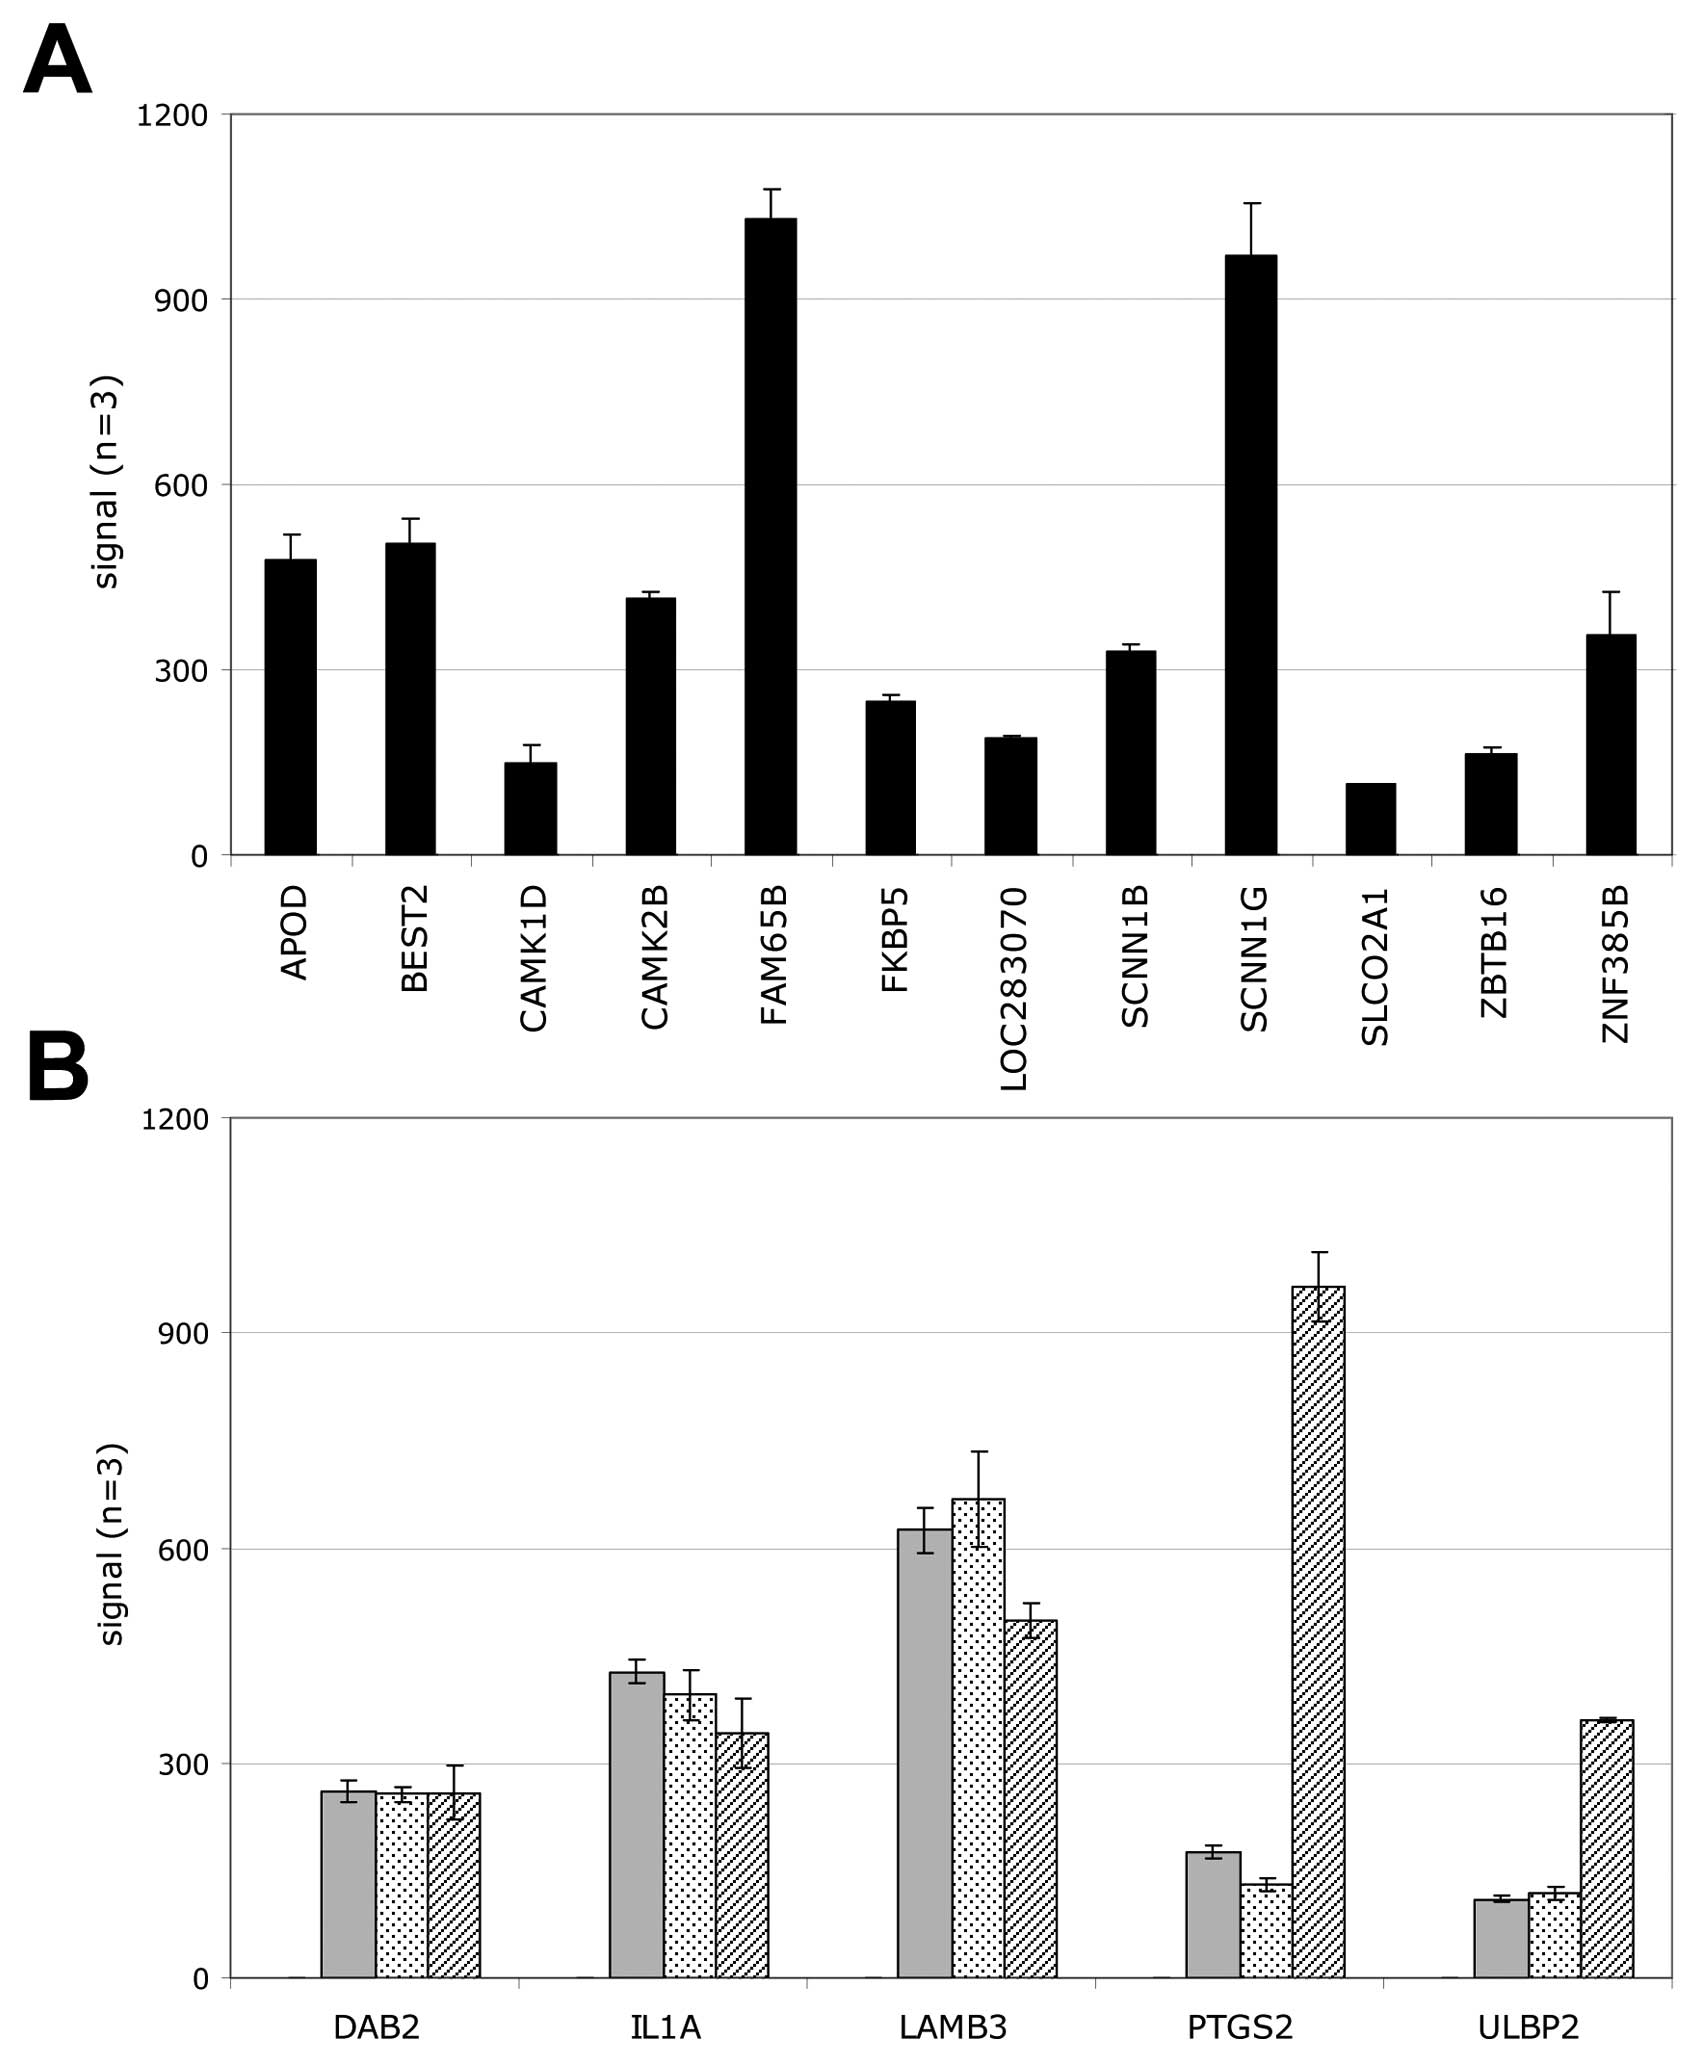
To identify genes that may explain the difference in
tumorigenicity of our cell models, we screened our array data for
genes which were either exclusively expressed in tumorigenic S2N
spheroid cells or for transcripts that were completely absent.
Using these filter criteria, we additionally eliminated gene
expression differences due to the different cell culture formats.
Fig. 7 shows that 12 genes were
expressed solely in the highly tumorigenic S2N cells and 5 genes
were not. The exclusively expressed genes include the EMT inducer
CAMK1D, the stem cell maintenance gene ZBTB16, tumorigenicity
related FAM65B and FKBP5 as well as an invasion facilitating
non-voltage Na+ channel SCNN1G (Fig. 7A). Genes not expressed in the
highly tumorigenic cells encompass the EMT process inhibiting DAB2
and LAMB3 which is frequently inactivated in breast cancer cells
increasing their invasiveness (Fig.
7B). Interestingly, two mRNAs relevant for immune escape are
also absent in the tumorigenic cells (IL1A, ULBP2).
Discussion
In a variety of ontogenetic different tumors,
tumor-initiating cells have been identified. These cells exhibit
more aggressive in vivo growth characteristics, and increase
the complexity of in vivo tumors (3,7).
However, there is not only controversy on the hierarchical versus
clonal evolution of putative TICs but also on the molecular,
physiological and phenotypic markers to identify these cells
(5,6,13).
In breast cancer, the CD24−/low/CD44+ marker
combination has been shown to identify in vivo tumorigenic
cell subpopulations (10),
although the percentage of the subfraction did not correlate with
the in vivo tumorigenicity (11). Furthermore, the presence of
CD24−/CD44+ or
CD24+/CD44+ cells in primary tumors did not
correlate with the overall or metastasis-free survival of breast
cancer patients (21).
Representative data from our S2N and S2 cell lines
also challenge the validity of the
CD24−/CD44+ marker combination and EpCAM
expression as tumorigenicity markers in breast cancer. All sphere
and monolayer derivative cell models investigated in this report
exhibit a unique CD24−/CD44+ marker
distribution, although only the S2N spheres were highly tumorigenic
at low inoculation cell numbers in vivo (Figs. 1 and 4; confirmed in 2 more primary breast
cancer cell models, data not shown). The highly tumorigenic as well
as the weakly tumorigenic cell models were EpCAM negative and
profiling analysis revealed a normal-like to basal-like breast
cancer origin (30). EpCAM
negative breast tumor spheres have been generated from primary
tumors (27), and EpCAM negative,
immortalized epithelial breast cancer stem cells have been reported
previously (Weinberg R, EMT and Cancer Progression Meeting,
Arlington, VA, 2010). Finally, basal-like and normal-like breast
cancer cell lines with a mesenchymal EMT phenotype such as MDA-MB
468 and MDA-MB 231, respectively, also lack EpCAM expression
(31). Therefore, EpCAM expression
should not be considered as an in vivo tumorigenicity marker
for normal-like to basal-like breast cancer stem cells (10).
Furthermore, there was no difference in
physiological CSC markers between our highly tumorigenic and weakly
tumorigenic cell models. The validation experiment of ALDH1
activity in early hematopoietic CD34+/CD38−
cells showed a clear DEAB inhibition (data not shown). However, we
did not identify an ALDH1 positive, DEAB sensitive subpopulation
indicative of a more tumorigenic cell fraction in any cell line
tested (Fig. 5A). This is in
contrast to reports showing that sorted ALDH1 positive breast tumor
cells from primary tumors (19) or
established cell lines (20,21)
are highly tumorigenic compared to their ALDH1 negative
counterparts. However, in a recent breast cancer IHC study, the
cumulative patient survival rate was not different between ALDH1
positive and negative tumors (32). Additionally, 70 to 80 or even 93%
of the breast tumor specimens proved to be negative for ALDH1
expression (19,32). Apparently, our ALDH1 negative,
primary cancer derived, highly tumorigenic mammosphere breast
cancer cell line represents such an ALDH1 negative CSC/TIC
population.
In line with our ALDH1 results is the absence of a
specific verapamil sensitive side population (SP) in the highly
tumorigenic cell model. A large verapamil sensitive SP fraction was
identified in highly tumorigenic S2N spheres as well as in weakly
tumorigenic S2 spheres (Fig. 5B).
Furthermore, even slightly higher percentages of SP were present in
both weakly tumorigenic monolayer counterparts, although there was
no or little verapamil sensitivity. Therefore, the in vivo
tumorigenicity is obviously not correlated with the verapamil
sensitive SP and one is tempting to speculate that the major role
of this cell fraction might just be a higher resistance to
exogenous toxic exposures (16,22).
The increase of basal (CK5) and luminal (CK18)
cytokeratins in both monolayer TIC cell lines are indicative of a
mesenchymal-epithelial transition, differentiation-like event
(Fig. 3). Since there is no
correlation with the in vivo phenotype, it could also be
possible that the cytokeratin MET pattern alteration is a surrogate
marker only. This hypothesis is supported by the fact that vimentin
is expressed at almost equal levels in the mammosphere as well as
in the monolayer cells. Finally, although the absence of E-cadherin
and the expression of vimentin should indicate a more mesenchymal,
de-differentiated phenotype (4,23),
our weakly tumorigenic S2 cell line puts the validity of these
markers as tumorigenicity identifier into question. Our suggestion
is supported by the fact that, in contrast to recent reports
(24,25), the induction of a more mesenchymal
cell phenotype increases the transcription factor mRNAs of SnaI2
and Twist1 in breast cancer cells only by a factor of 1.6 and 1.8,
respectively (Table I). Therefore,
it is unlikely that both factors solely mediate a more aggressive,
tumorigenic mesenchymal phenotype in vivo.
None of the stem cell related transcription factors
display a unique TIC expression pattern (Table I). Oct3, Sox1/2 or
Nanog mRNAs are undetectable and myc is not changed
in the highly tumorigenic S2N cell line. The Sox transcription
factors are even upregulated in the weakly tumorigenic monolayer
cells and only KLF4 and Notch3 are upregulated in the
S2N mammospheres. Finally, an 11-gene signature previously reported
to be predictive for therapy failure in multiple cancers (33) was not predictive for the
tumorigenicity of our cell models.
Our gene array data indicate that the molecular
mechanisms affecting the tumorigenicity of tumor-initiating cells
extend beyond the established markers. Genes that are only
expressed in our tumorigenic breast cancer cells encompass the EMT
inducer CAMK1D (34), the stem
cell maintenance gene ZBTB16 (=PLZF) (35) as well as the tumorigenicity related
FKBP5 (36). Not only genes that
are upregulated or exclusively expressed in tumorigenic spheres,
but also genes that are down-regulated or not expressed, such as
the EMT process inhibiting DAB2 (37) and the invasiveness lowering LAMB3
(38), may contribute to the
tumorigenicity of our models (Fig.
7).
In addition to intrinsic, genetically regulated
pathways, environmental factors affect the physiology and phenotype
of tumor cells (39,40). Inoculation of high monolayer or
sphere cell numbers of S2 cells displayed similar in vivo
growth characteristics compared to the highly tumorigenic TICs,
whereas at low cell numbers only S2N spheres were highly
tumorigenic (10,19). Currently, the most common
explanation for this ‘low sphere cell number’ phenomenon is the
higher percentage of putative TICs in the tumorigenic sphere cell
population. However, if TICs exhibit a more aggressive growth
phenotype, why is there no higher growth rate at higher in
vivo cell inoculation numbers? An alternative explanation for
the growth difference might be an improved adaptive survival
response at low tumor inoculation cell numbers of the tumorigenic
mammosphere breast cancer cells in vivo, which was shown
previously by the flexibility of TIC marker expression during in
vivo passages (14). Further
support comes from our findings that our gene chip array analysis
did not reveal a unique, tumorigenicity related alteration of a
cyclin/CDK or anti-apoptotic gene expression pattern (Fig. 7).
In summary, we give experimental evidence that
established cancer stem cell markers do not correlate with in
vivo growth characteristics of tumor-initiating cells. We show
that highly tumorigenic as well as weakly tumorigenic sphere cell
lines and their monolayer derivatives do not exhibit any difference
in putative TIC specific CD markers, ALDH1 activity or SP fraction.
Stem cell related transcription factors are not increased in the
highly tumorigenic cell line. Therefore, we suggest that other
functional, still unknown markers and/or environmental factors
might affect the increased tumorigenicity of breast cancer sphere
cell lines.
Acknowledgements
The breast cancer cell lines were
kindly provided by G. Stassi (Department of Surgical and
Oncological Sciences, Cellular and Molecular Pathophysiology
Laboratory, University of Palermo, Palermo, Italy). We thank Flora
Lovino for establishing the in vitro cell culture
(University of Palermo), Stefanie Fischer for help with the in
vivo animal studies (Roche Penzberg, Gemany) and Ute Baer for
running the Affymetrix analyses (Roche Penzberg).
References
|
1.
|
LD WoodDW ParsonsS JonesThe genomic
landscapes of human breast and colorectal
cancersScience31811081113200710.1126/science.114572017932254
|
|
2.
|
J StinglC CaldasMolecular heterogeneity of
breast carcinomas and the cancer stem cell hypothesisNat Rev
Cancer7791799200710.1038/nrc221217851544
|
|
3.
|
L VermeulenMR SprickK KemperG StassiJP
MedemaCancer stem cells - old concepts, new insightsCell Death
Differ15947958200810.1038/cdd.2008.2018259194
|
|
4.
|
K PolyakRA WeinbergTransitions between
epithelial and mesenchymal states: acquisition of malignant and
stem cell traitsNat Rev
Cancer9265273200910.1038/nrc262019262571
|
|
5.
|
RP HillIdentifying cancer stem cells in
solid tumors: case not provenCancer
Res6618911895200610.1158/0008-5472.CAN-05-345016488984
|
|
6.
|
M ShipitsinK PolyakThe cancer stem cell
hypothesis: in search of definitions, markers, and relevanceLab
Invest88459463200810.1038/labinvest.2008.1418379567
|
|
7.
|
RW ChoMF ClarkeRecent advances in cancer
stem cellsCurr Opin Genet
Dev184853200810.1016/j.gde.2008.01.017
|
|
8.
|
K PolyakBreast cancer stem cells: a case
of mistaken identity?Stem Cell
Rev3107109200710.1007/s12015-007-0020-817873341
|
|
9.
|
JC LawsonGL BlatchAL EdkinsCancer stem
cells in breast cancer and metastasisBreast Cancer Res
Treat118241254200910.1007/s10549-009-0524-919731012
|
|
10.
|
M Al-HajjMS WichaA Benito-HernandezSJ
MorrisonMF ClarkeProspective identification of tumorigenic breast
cancer cellsProc Natl Acad Sci
USA10039833988200310.1073/pnas.053029110012629218
|
|
11.
|
MJ GrimshawL CooperK PapazisisMammosphere
culture of metastatic breast cancer cells enriches for tumorigenic
breast cancer cellsBreast Cancer
Res10R52200810.1186/bcr210618541018
|
|
12.
|
M ShipitsinLL CampbellP ArganiMolecular
definition of breast tumor heterogeneityCancer
Cell11259273200710.1016/j.ccr.2007.01.01317349583
|
|
13.
|
SY ParkM GönenHJ KimF MichorK
PolyakCellular and genetic diversity in the progression of in situ
human breast carcinomas to an invasive phenotypeJ Clin
Invest120636644201010.1172/JCI4072420101094
|
|
14.
|
MJ MeyerJM FlemingMA AliMW PeseskyE
GinsburgBK VonderhaarDynamic regulation of CD24 and the invasive,
CD44pos CD24neg phenotype in breast cancer cell linesBreast Cancer
Res11R82200910.1186/bcr244919906290
|
|
15.
|
F ReimY DombrowskiC RitterImmunoselection
of breast and ovarian cancer cells with trastuzumab and natural
killer cells: selective escape of CD44high/CD24low/HER2low breast
cancer stem cellsCancer
Res6980588066200910.1158/0008-5472.CAN-09-0834
|
|
16.
|
H TanakaM NakamuraC KamedaThe Hedgehog
signaling pathway plays an essential role in maintaining the
CD44+CD24−/low subpopulation and the side
population of breast cancer cellsAnticancer
Res2921472157200919528475
|
|
17.
|
CJ CreightonX LiM LandisResidual breast
cancers after conventional therapy display mesenchymal as well as
tumor-initiating featuresProc Natl Acad Sci
USA1061382013825200910.1073/pnas.0905718106
|
|
18.
|
S AulmannN WaldburgerR PenzelM AndrulisP
SchirmacherHP SinnReduction of CD44(+)/CD24(−) breast cancer cells
by conventional cytotoxic chemotherapyHum Pathol415745812010
|
|
19.
|
C GinestierMH HurE Charafe-JauffretALDH1
is a marker of normal and malignant human mammary stem cells and a
predictor of poor clinical outcomeCell Stem
Cell1555567200710.1016/j.stem.2007.08.01418371393
|
|
20.
|
E Charafe-JauffretC GinestierF
IovinoBreast cancer cell lines contain functional cancer stem cells
with metastatic capacity and a distinct molecular signatureCancer
Res6913021313200910.1158/0008-5472.CAN-08-274119190339
|
|
21.
|
E Charafe-JauffretC GinestierF
IovinoAldehyde dehydrogenase 1-positive cancer stem cells mediate
metastasis and poor clinical outcome in inflammatory breast
cancerClin Cancer
Res164555201010.1158/1078-0432.CCR-09-163020028757
|
|
22.
|
JS HanDL CroweTumor initiating cancer stem
cells from human breast cancer cell linesInt J
Oncol3414491453200919360358
|
|
23.
|
G OuyangZ WangX FangJ LiuCJ YangMolecular
signaling of the epithelial to mesenchymal transition in generating
and maintaining cancer stem cellsCell Mol Life
Sci6726052618201010.1007/s00018-010-0338-220238234
|
|
24.
|
F VesunaA LisokB KimbleV RamanTwist
modulates breast cancer stem cells by transcriptional regulation of
CD24 expressionNeoplasia1113181328200920019840
|
|
25.
|
SA ManiW GuoMJ LiaoThe
epithelial-mesenchymal transition generates cells with properties
of stem
cellsCell133704715200810.1016/j.cell.2008.03.02718485877
|
|
26.
|
G DontuWM AbdallahJM FoleyIn vitro
propagation and transcriptional profiling of human mammary
stem/progenitor cellsGenes
Dev1712531270200310.1101/gad.106180312756227
|
|
27.
|
D PontiA CostaN ZaffaroniIsolation and in
vitro propagation of tumorigenic breast cancer cells with
stem/progenitor cell propertiesCancer
Res6555065511200510.1158/0008-5472.CAN-05-062615994920
|
|
28.
|
A IvascuM KubbiesDiversity of
cell-mediated adhesions in breast cancer spheroidsInt J
Oncol3114031413200717982667
|
|
29.
|
A IvascuM KubbiesRapid generation of
single-tumor spheroids for high-throughput cell function and
toxicity analysisJ Biomol
Screen11922932200610.1177/108705710629276316973921
|
|
30.
|
E LimF VaillantD WuAberrant luminal
progenitors as the candidate target population for basal tumor
development in BRCA1 mutation carriersNat
Med15907915200910.1038/nm.200019648928
|
|
31.
|
C StueltenSD MertinsIJ BuschComplex
display of putative tumor stem cell markers in the NCI60 tumor cell
line panelStem Cells28649660201010.1002/stem.32420178109
|
|
32.
|
V NeumeisterS AgarwalJ BordeauxRL CampDL
RimmIn situ identification of putative cancer stem cells by
multiplexing ALDH1, CD44, and cytokeratin identifies breast cancer
patients with poor prognosisAm J
Pathol17621312138201010.2353/ajpath.2010.09071220228222
|
|
33.
|
GV GlinskyO BerezovskaAB
GlinskiiMicroarray analysis identifies a death-from-cancer
signature predicting therapy failure in patients with multiple
types of cancerJ Clin
Invest11515031521200510.1172/JCI2341215931389
|
|
34.
|
A BergamaschiYH KimKA KweiCAMK1D
amplification implicated in epithelial-mesenchymal transition in
basal-like breast cancerMol
Oncol2327239200810.1016/j.molonc.2008.09.00419383354
|
|
35.
|
N KotajaP Sassone-CorsiPlzf pushes stem
cellsNat Genet36551553200410.1038/ng0604-55115167928
|
|
36.
|
JT DeAngelisY LiN MitchellL WilsonH KimTO
Tollefsbol2D difference gel electrophoresis analysis of different
time points during the course of neoplastic transformation of human
mammary epithelial cellsJ Proteom
Res10447458201110.1021/pr100533k
|
|
37.
|
JC MartinBS HerbertBA HocevarDisabled-2
down-regulation promotes epithelial-to-mesenchymal transitionBr J
Cancer10317161723201010.1038/sj.bjc.660597521063401
|
|
38.
|
UG SathyanarayanaA PadarCX HuangAbberant
promoter methylation and silencing of laminin-5-encoding genes in
breast carcinomaClin Cancer Res963896394200314695139
|
|
39.
|
D PontiN ZaffaroniC CapelliMG
DiadoneBreast cancer stem cells: an overviewEur J
Cancer4212191224200610.1016/j.ejca.2006.01.03116624548
|
|
40.
|
M HuK PolyakMicroenvironmental regulation
of cancer developmentCurr Opin Genet
Dev182734200810.1016/j.gde.2007.12.006
|