Introduction
Recent advancements in molecular imaging have
provided non-invasive analytical tools for continuous monitoring of
disease progression and evaluating drug efficacy in preclinical
models (1–3). The integration of a bioluminescent
imaging system into preclinical leukemia model studies allows
tracking of leukemic cell migration and dispersion patterns, and
evaluation of therapeutic drug efficacy with enhanced sensitivity
(4,5). Many studies of acute lymphoblastic
leukemia (ALL) have used in vivo leukemia models to explore
new chemotherapeutic candidates and efficient treatment regimens in
preclinical settings (6,7).
The majority of in vivo leukemia models are
initiated by intravenous (IV) or intraperitoneal (IP) injection of
primary leukemia cells of patient origin or leukemia cell lines
into immune-deficient mice such as NOD/SCID (8–10).
Cells bearing a bioluminescent signal introduced in vivo
have the potential to be tracked (11,12).
However, models that rely on IP or IV routes of introduction are
likely to result in weak and/or delayed bioluminescent signals,
which do not necessarily provide measurable parameters directly
corresponding to progression of the disease. In particular, number
and bioluminescent signals of leukemic cells within isolated organs
and blood from IP and IV leukemia model mice are very low.
In this study, IP and IV models have been compared
to intra-bone marrow transplantation (IBMT) leukemia animal model
in which leukemic cells are introduced directly into their
preferred microenvironment (13–15).
IBMT is the only method that directly delivers leukemic cells to
its preferred engraftment site with minimal loss of cells, thereby
improving successful engraftment of leukemic cells for development
of systemic disease model. IBMT model could be utilized to
recapitulate human leukemia and allow consistent and sensitive
bioluminescent evaluation.
Materials and methods
Cell culture
The T-cell acute lymphoblastic leukemia cell lines,
Jurkat and CCRF-CEM and acute lymphocytic leukemia cell line, Reh
were purchased from American Type Culture Collection (Manassas, VA)
and cultured in RPMI-1640 (Life Technologies, Grand Island, NY)
medium supplemented with 10% fetal bovine serum (FBS; Life
Technologies), 1% HEPES (Life Technologies), 100 U/ml of penicillin
(Life Technologies), and 100 mg/ml of streptomycin (Life
Technologies). These cell lines were maintained in a humidified 5%
CO2 atmosphere at 37°C.
Introduction of f-luciferase gene via
lentiviral infection
Reh, Jurkat and CCRF-CEM cell lines were transduced
by addition of 1 ml of viral stock consisting of pLenti6/V5-CMV
viral vector (Life Technologies) encoding firefly luciferase. To
facilitate the entrance of the viral vector into the cells, 8 μg/ml
of polybrene (Santa Cruz Biotechnologies, Santa Cruz, CA) was
added. Viable cells were washed with excess volume of
phosphate-buffered saline (PBS; Biowest, Nuaille, France) 4 times
and incubated directly in RPMI-1640 with 10% FBS, 1%
penicillin/streptomycin, 1% HEPES and 5 μg/ml blasticidine
(Sigma-Aldrich, St. Louis, MO) for clonal selection. To confirm
successful transduction of f-luciferase gene, 1×10⁶
clone cells were seeded in each well of a 6-well plate (Nalge Nunc,
Naperville, IL) for bioluminescent imaging. Bioluminescent clones
with the most luciferase activity of each cell lines were selected
for injection and designated these bioluminescent leukemia cell
lines as Reh/fLuc, Jurkat/fLuc and CCRF-CEM/fLuc.
Bioluminescent leukemia animal model
NOD.CB17/scid Arc (NOD/SCID) mice were purchased
from The Animal Resources (Canning Vale, WA, Australia) and
maintained at the Laboratory Research Animal Center of the Samsung
Biomedical Research Institute according to AAALAC approved
protocols. Bioluminescent leukemia models were prepared by
injecting 7-to 8-week old NOD/SCID mice with 1x10⁶
CCRF-CEM/fLuc via three different injection routes;
intraperitoneal, intravenous (tail-vein) and intra-bone marrow
(tibia) injection.
Bioluminescent imaging
These three types (IP, IV and IBMT) of leukemia
in vivo models were compared through continuous
bioluminescent monitoring using IVIS 100 imaging system (Xenogen
Corporation, Alameda, CA). D-luciferin (150 mg/kg) (Xenogen) was
injected intraperitoneally to each mouse prior to imaging. Mice
were anesthetized with vaporized isofurane (Abbott Laboratory,
Abbott Park, IL) and placed in imaging chamber. After 5.5 min, each
animal was imaged alone in supine and prone positions with an
exposure time of 1 min for each position weekly for 6 weeks. All
bioluminescent image data were provided by Living Image software
(version 1.0, Xenogen). Photons detected from leukemia models were
converted to average radiance (photon/sec/cm2/sr).
Average radiance values are quantitative data obtained from region
of intensity (ROI) where photons emitted by bioluminescent cells of
assigned rectangular area over the whole body of each mouse. Both
luminescence and image data were analyzed using Living Image
software.
Flow cytometric analysis
To validate bioluminescent correlation with
peripheral leukemic cells of leukemia burden in vivo model,
mice were sacrificed at week 6 after bioluminescent images were
obtained. Peripheral blood (PB), bone marrow (BM) aspirates, and
spleen were obtained to isolate human leukocytes using
Ficoll-Paque™ Plus (GE Healthcare, Uppsala, Sweden) solution.
Residual red blood cells were removed using erythrocyte lysis
buffer (Qiagen, Hilden, Germany) prior to double staining the
isolated cells with phycoerythrin (PE)-conjugated anti-human CD45
(hCD45) (BD Pharmigen™, San Diego, CA) and fluorescein
isothiocyanate (FITC)-conjugated anti-mouse CD45 (mCD45) (BD
Pharmigen™) antibodies. PB and BM of the mice treated with
vincristine and methylprednisolone were also analyzed to determine
the correlation between bioluminescent changes in responses to
vincristine or methylprednisolone within leukemia burdened mice.
Mononuclear cells isolated from PB of the second generation IBMT
leukemia model was evaluated with hCD45 and mCD45 antibodies once
again to validate that human leukemic cell of the first IBMT model
were responsible for the development of bioluminescent leukemia
model.
Cell viability assay: Alamarblue
assay
In vitro sensitivity of CCRF-CEM/fLuc cell
line to vincristine and methylprednisolone was validated using
Alamarblue® (Life Technologies) assay and luminescence
assay prior to transplantation. CCRF-CEM/fLuc cells
(1×10⁵) were seed in each well of 96-well. Five columns
of 4 wells were treated with vincristine at concentrations of 0.1,
0.5, 1, 5, and 10 ng/ml. Cells were exposed to vincristine for 48 h
before endpoint data analysis were conducted using Alamarblue
assay. Replicate vincristine in vitro assay was done and
analyzed with bioluminescent imaging, 2 μl (300 μg/ml) of
D-luciferin was added to each well, and image of the in
vitro assay plate was obtained. Another 96-well plate seeded
with CCRF-CEM/fLuc cells of the identical experimental setting as
vincristine was prepared to determine effective cytotoxic
concentration of methylprednisolone, 100, 250, 500 and 1000 μg/ml
of methylprednisolone were treated for 48 h. Alamarblue and
bioluminescent assay were also used to assess in vitro
responses of CCRF-CEM/fLuc to methylprednisolone.
In vivo evaluation of anti-leukemic drug
responses
Mice in groups of three were treated with two
different vincristine (Hospira, Mulgrave, Australia) concentrations
starting at week 3. Vincristine (0.1 and 0.5 mg/kg) in 100 μl PBS
were injected intravenously into tail vein 3 times in 7 days
interval. Control mice were injected with 100 μl PBS every week as
well. The effects of vincristine on leukemia mouse models were
monitored once a week from the initial treatment for 21 days. Prior
to administration of vincristine, bioluminescent images of the mice
were obtained. Standard bioluminescent imaging protocol was used to
monitor changes in vincristine treated mice. Another set of IBMT
leukemia mouse model was prepared according to methods described
previously. These mice were treated weekly with two different
concentrations of methylprednisolone (Pfizer, Puurs, Belgium)
starting at week 3. Methylprednisolone (2 and 10 mg/kg) in 100 μl
PBS were administered intravenously into tail vein. Monitoring
responses to methylprednisolone was done by weekly imaging and
images were obtained according to the protocol described in
bioluminescent imaging section of Materials and methods.
Secondary engraftment of CCRF-CEM/fLuc
cells
CCRF-CEM/fLuc cells were isolated from peripheral
blood of IBMT-leukemia mouse model via density gradient removal of
RBC using Ficoll solution. Cells were maintained in RPMI-1640 with
10% FBS, 1% antimycotic-antibiotic and 1% HEPES. To assess
luciferase expression level of ex vivo CCRF-CEM/fLuc, the
number of cells ranging between 103 and 107
cells were suspended in 100 μl of PBS and plated on flat-bottom
96-well plate. 2 μl (300 μg/ml) of D-luciferin was added to each
well, then bioluminescent signal were detected for 30 sec with CCD
camera. Bioluminescent leukemia mouse model was reconstituted by
injecting 10 μl of 1×10⁶ of the isolated CCRF-CEM/fLuc
cells directly into tibia of the secondary recipient mice (n=5).
Leukemia development was monitored weekly. Mice were given an
intraperitoneal injection of D-luciferin (150 mg/ml) and imaged 5.5
min later. Each mouse in prone and supine positions according to
previously described in bioluminescent imaging section of Materials
and methods.
Statistical analysis
Statistical analysis of the data was performed using
Prism 5 (Graphpad Software, La Jolla, CA). In vitro data
represent mean of triplicates and correlation between
bioluminescent signals and number of viable leukemic cells was
determined via Spearman correlation analysis. Kruskal-Wallis
analysis was performed with Dunn Multiple Comparison test to
compare experimental groups to controls.
Results
Establishment of bioluminescent leukemia
cell lines stably expressing firefly luciferase
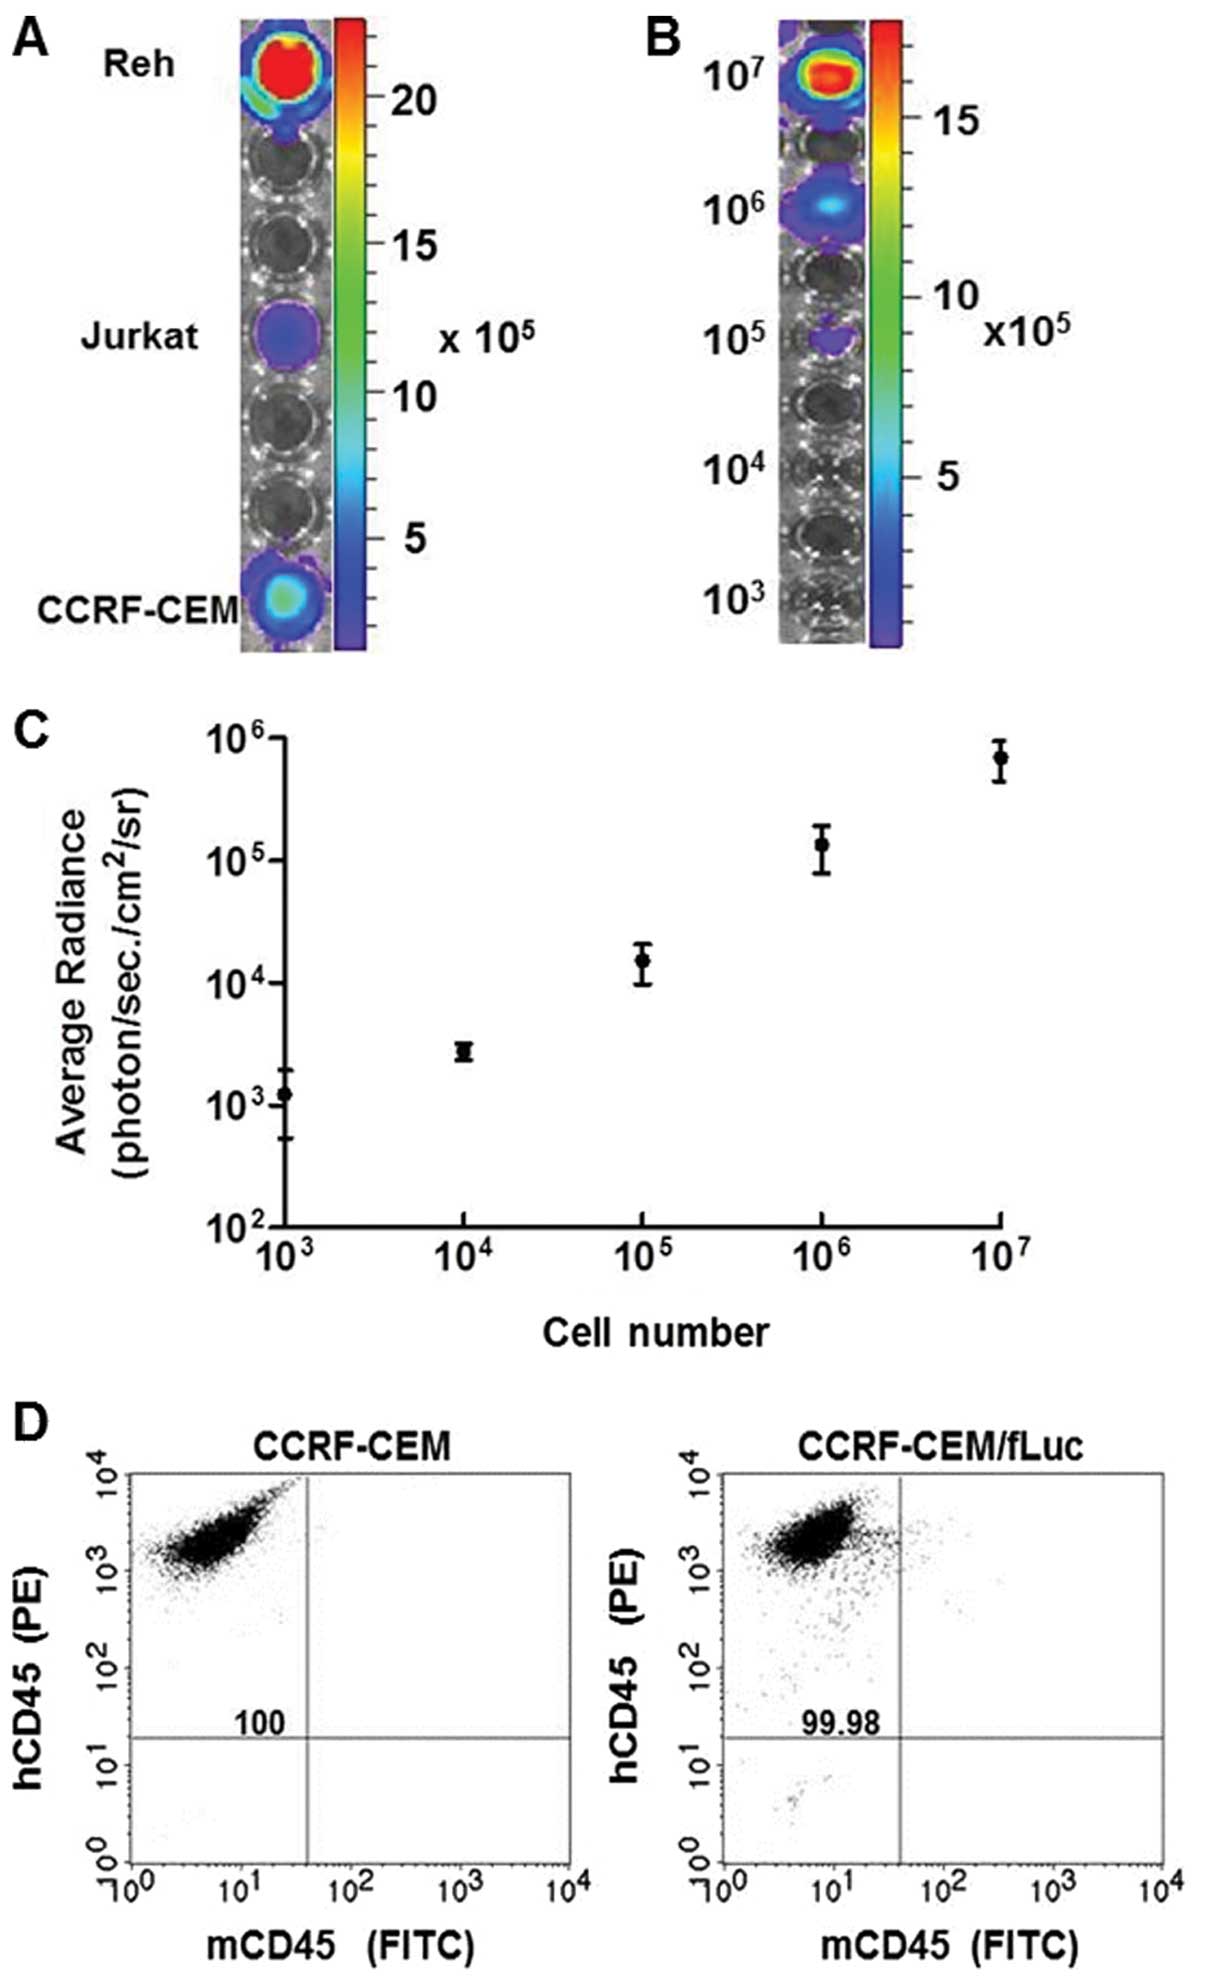
Bioluminescent leukemia cell lines were established
using a firefly luciferase (fLuc) gene-encoding vector delivered
via lentiviral infection into human ALL cell lines Reh, Jurkat and
CCRF-CEM. Stable expression of fLuc in these cell lines was
confirmed by analyzing the bioluminescent intensity of
106 cells of each, quantified in average radiance
(photon/sec/cm2/sr) (Fig.
1A). The bioluminescent intensity was measured in serial
dilutions (107–103) of CCRF-CEM/fLuc cells
(Fig. 1B), and the signal
intensity was converted into average radiance
(photon/sec/cm2/sr) (Fig.
1C). Bioluminescent intensity was directly proportional to the
number of viable cells (p<0.001). To assess purity of the
established human cell lines, CCRF-CEM and CCRF-CEM/fLuc cells were
analyzed by flow cytometry for expression of common human leukocyte
antigen marker, CD45 using PE-conjugated hCD45 and FITC-conjugated
mCD45 antibodies (Fig. 1D). Double
staining analysis ensures that only human-origin cell lines were
used for leukemia model development. Both cell lines were positive
for hCD45 and negative for mCD45. These results established the
correlation between viable, luciferase-expressing CCRF-CEM/fLuc
cells and bioluminescent signal intensity.
In vivo monitoring of bioluminescent
leukemia progression in a NOD/SCID mouse model
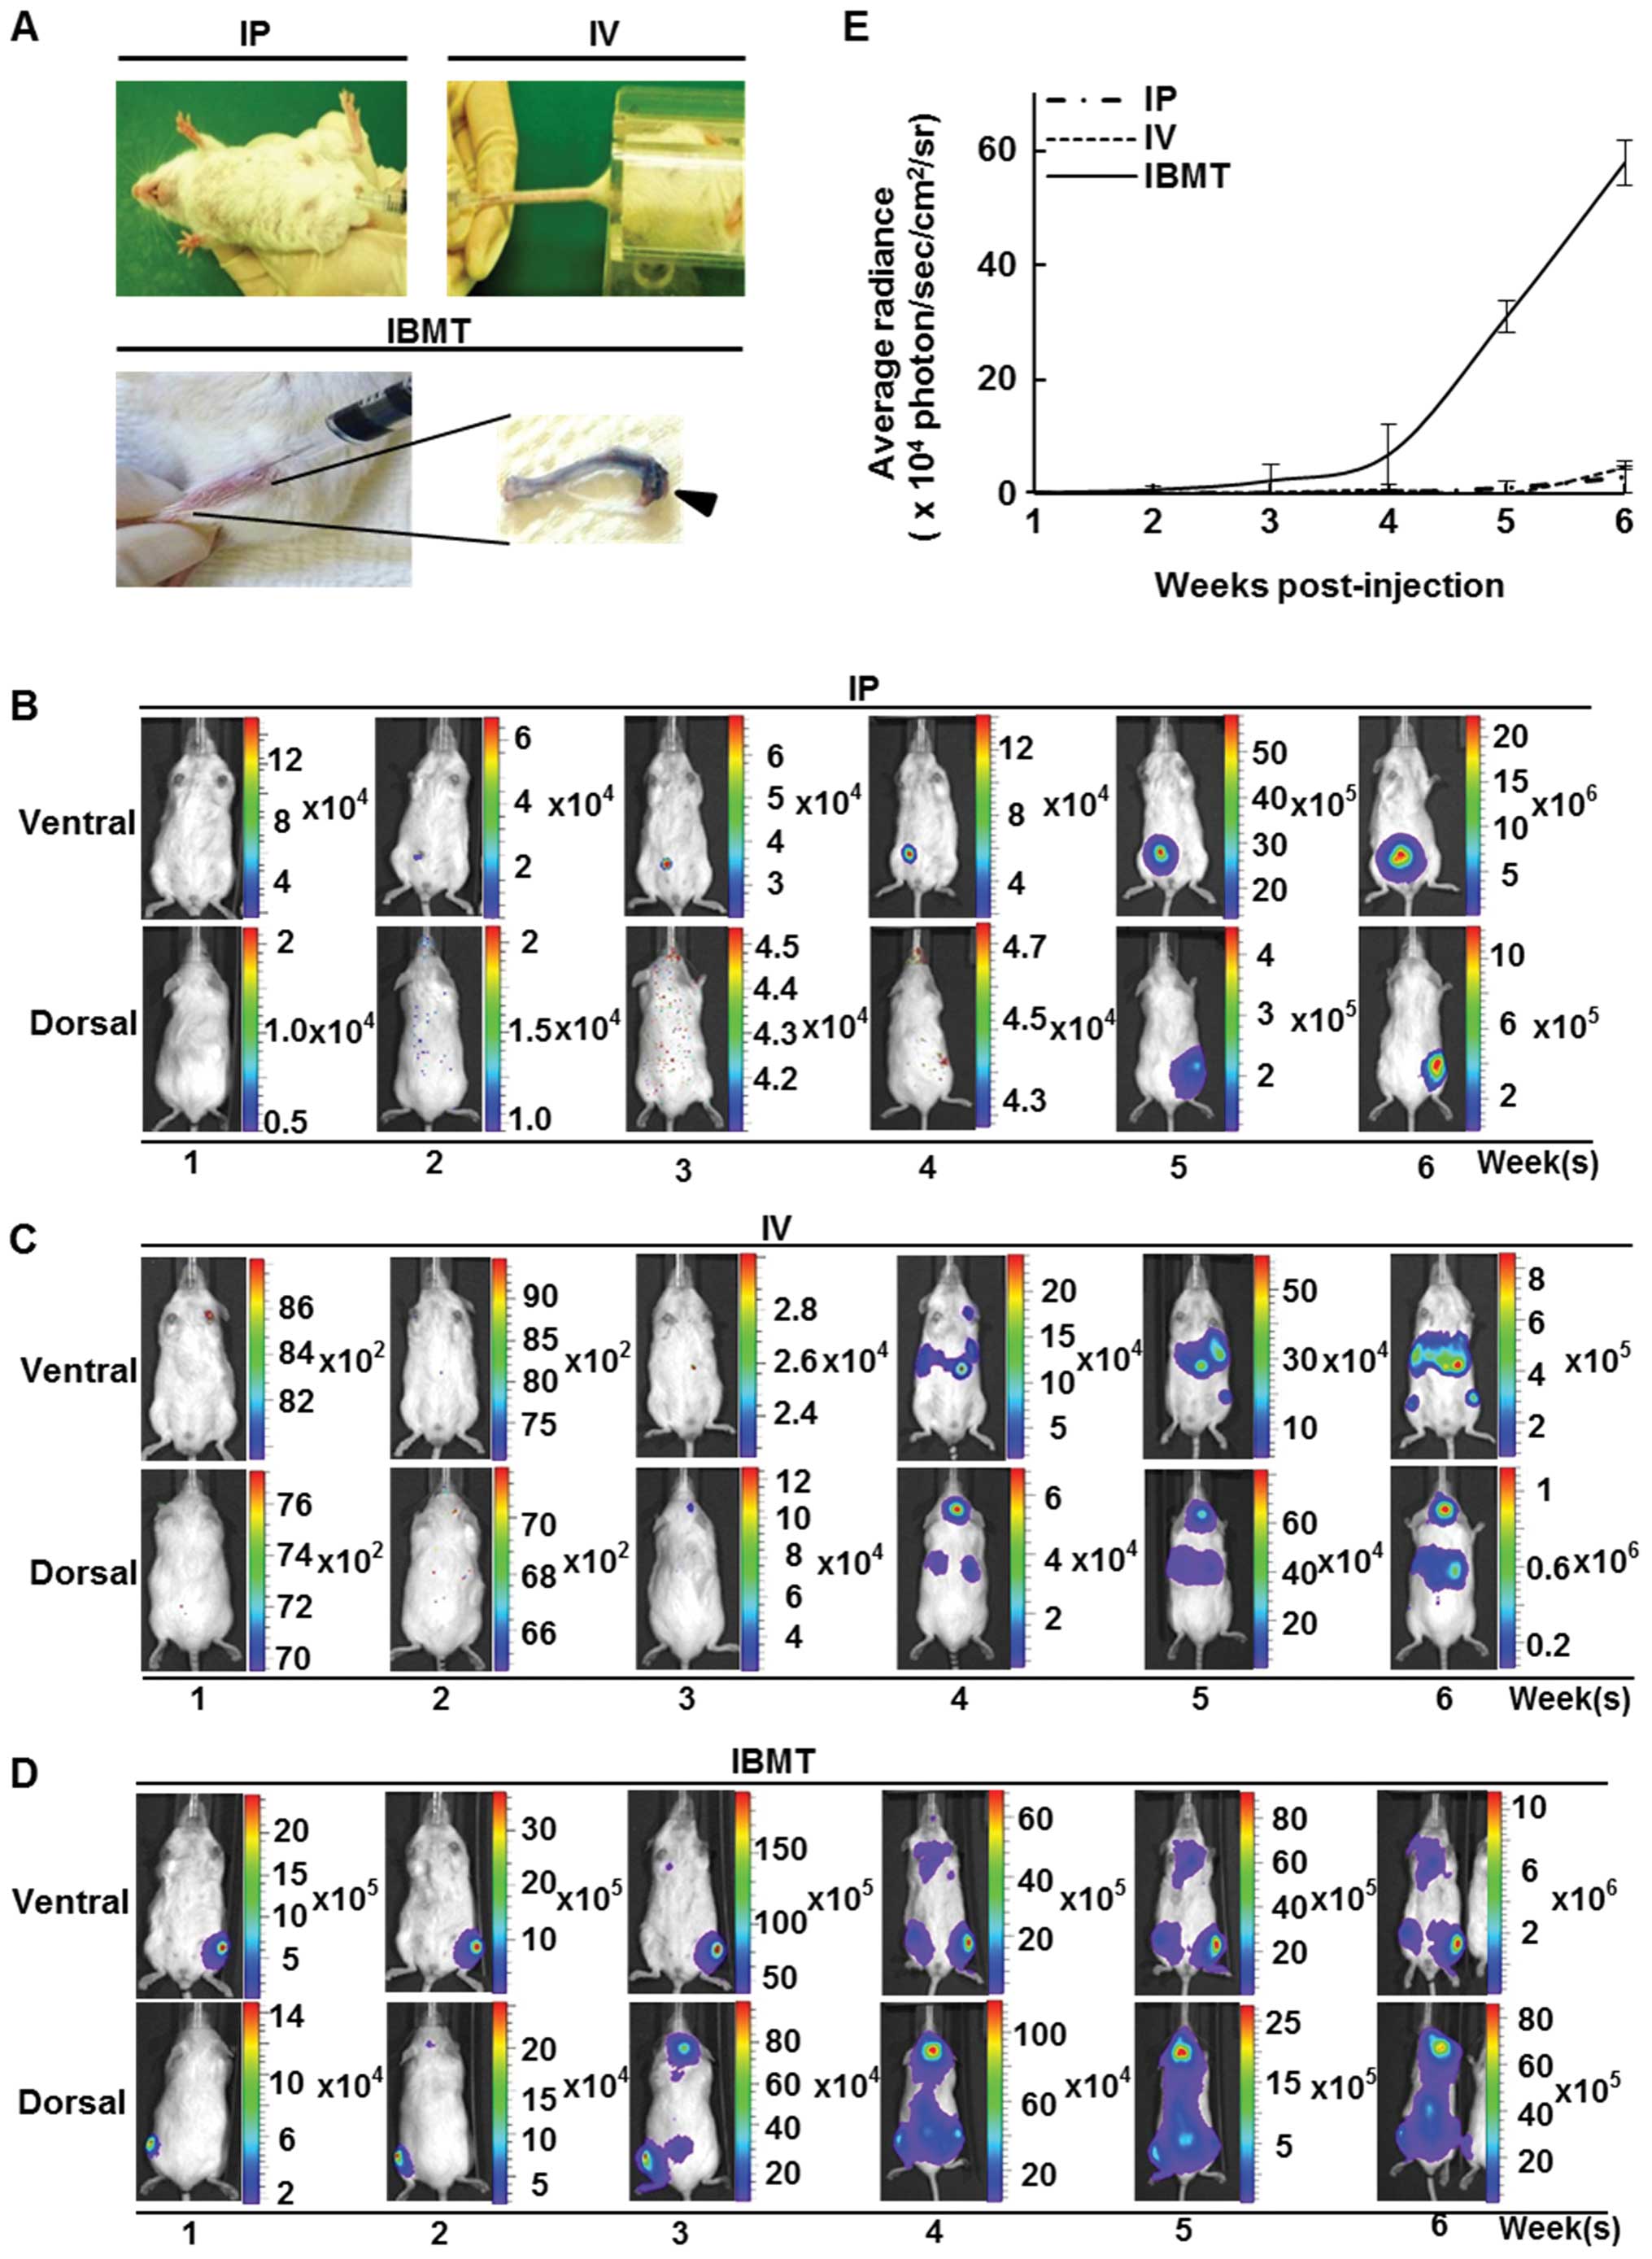
NOD/SCID mice were inoculated with 106
CCRF-CEM/fLuc cells via IP, IV or IBMT routes (Fig. 2A) and examined using the
bioluminescent imaging system every week for 6 weeks. For mice
injected with IP, bioluminescent signals were localized and
detected only at the site of injection (Fig. 2B); however, in mice inoculated with
IV, the average radiance from luciferase activity of viable
CCRF-CEM/fLuc was within the detectable range but was insufficient
for visualization during the first three weeks after
transplantation. Bioluminescent signals from the lower border of
the sternum on the ventral side, head and upper sternum on the
dorsal side became visible at week 4 (Fig. 2C). Unlike leukemia models prepared
via IP and IV injections, bioluminescent signals of mice inoculated
via IBMT were detectable in the tibia as early as one week after
the inoculation of CCRF-CEM/fLuc cells. At week 4, strong
bioluminescent signals were detected in mice in both supine and
prone positions. The highest intensity signals were mainly detected
in the head and backbone in the prone position, and in the upper
sternum and hind legs in the supine position (Fig. 2D). Fig. 2E shows the mean radiance values for
each inoculation group (n=15) over 6 weeks of monitored time. At
week 6, IBMT model exhibited significantly stronger bioluminescent
signals (p<0.001) than IP or IV mediated leukemia models. These
results indicate that the visualization and quantification of
leukemia progression can vary with the leukemia cell
transplantation method.
Comparative analysis of the route of
transplantation for establishing a bioluminescent leukemia in vivo
model
To compare leukemia burden level in IP, IV and IBMT
leukemia models with accuracy, calibrated signal intensity ranges
representing the optimal range of signals above noise but below
saturation level detected by CCD camera were assigned to each type
of leukemia mouse model. In particular, images of week 4, 5 and 6
were compiled and compared with calibrated signal intensity ranges
within each type leukemia model (Fig.
3A). The gradual increase in bioluminescent signal intensity
from week 4 through 6 images was observed. In addition, images from
one representative mouse at week 5 in each of the IP, IV and IBMT
groups were pooled and compared within the calibrated signal
intensity range (Fig. 3B). The
IBMT leukemia model exhibited the strongest signal intensity; this
represents the highest degree of leukemia burden among the three
leukemia models. The corresponding bioluminescent intensity of
isolated organs (brain, heart, lung, liver and spleen) from these
leukemia model mice at week 5 was assessed (Fig. 3C). Organ images revealed that only
those from the IBMT leukemia model had strong bioluminescent
signals. It was investigated by flow cytometry whether the
bioluminescent areas observed corresponded to leukemic cells in the
organs from the IBMT leukemia model. Disease burden, i.e., human
leukemic cells, in PB, BM and spleen cells from IP, IV and IBMT
leukemia model mice sacrificed at week 5 post-injection was
quantified by flow cytometric analysis of hCD45 and mCD45
expression (Fig. 3D). BM aspirates
from the tibia (LBM) of IBMT mice contained mainly
hCD45+ cells (96.89%), PB contained 79.06%
hCD45+ cells and the spleen contained 15.08%
hCD45+ cells. However, in the IP model, less than 1% of
cells in PB, BM and spleen were hCD45+, and in the IV
model, less than 2.26% of cells in PB, BM and spleen were
hCD45+. Overall, results from comparative analyses of
IP, IV and IBMT leukemia models indicate that detectable
bioluminescent leukemia development in NOD/SCID can be effectively
achieved using an IBMT route of administration.
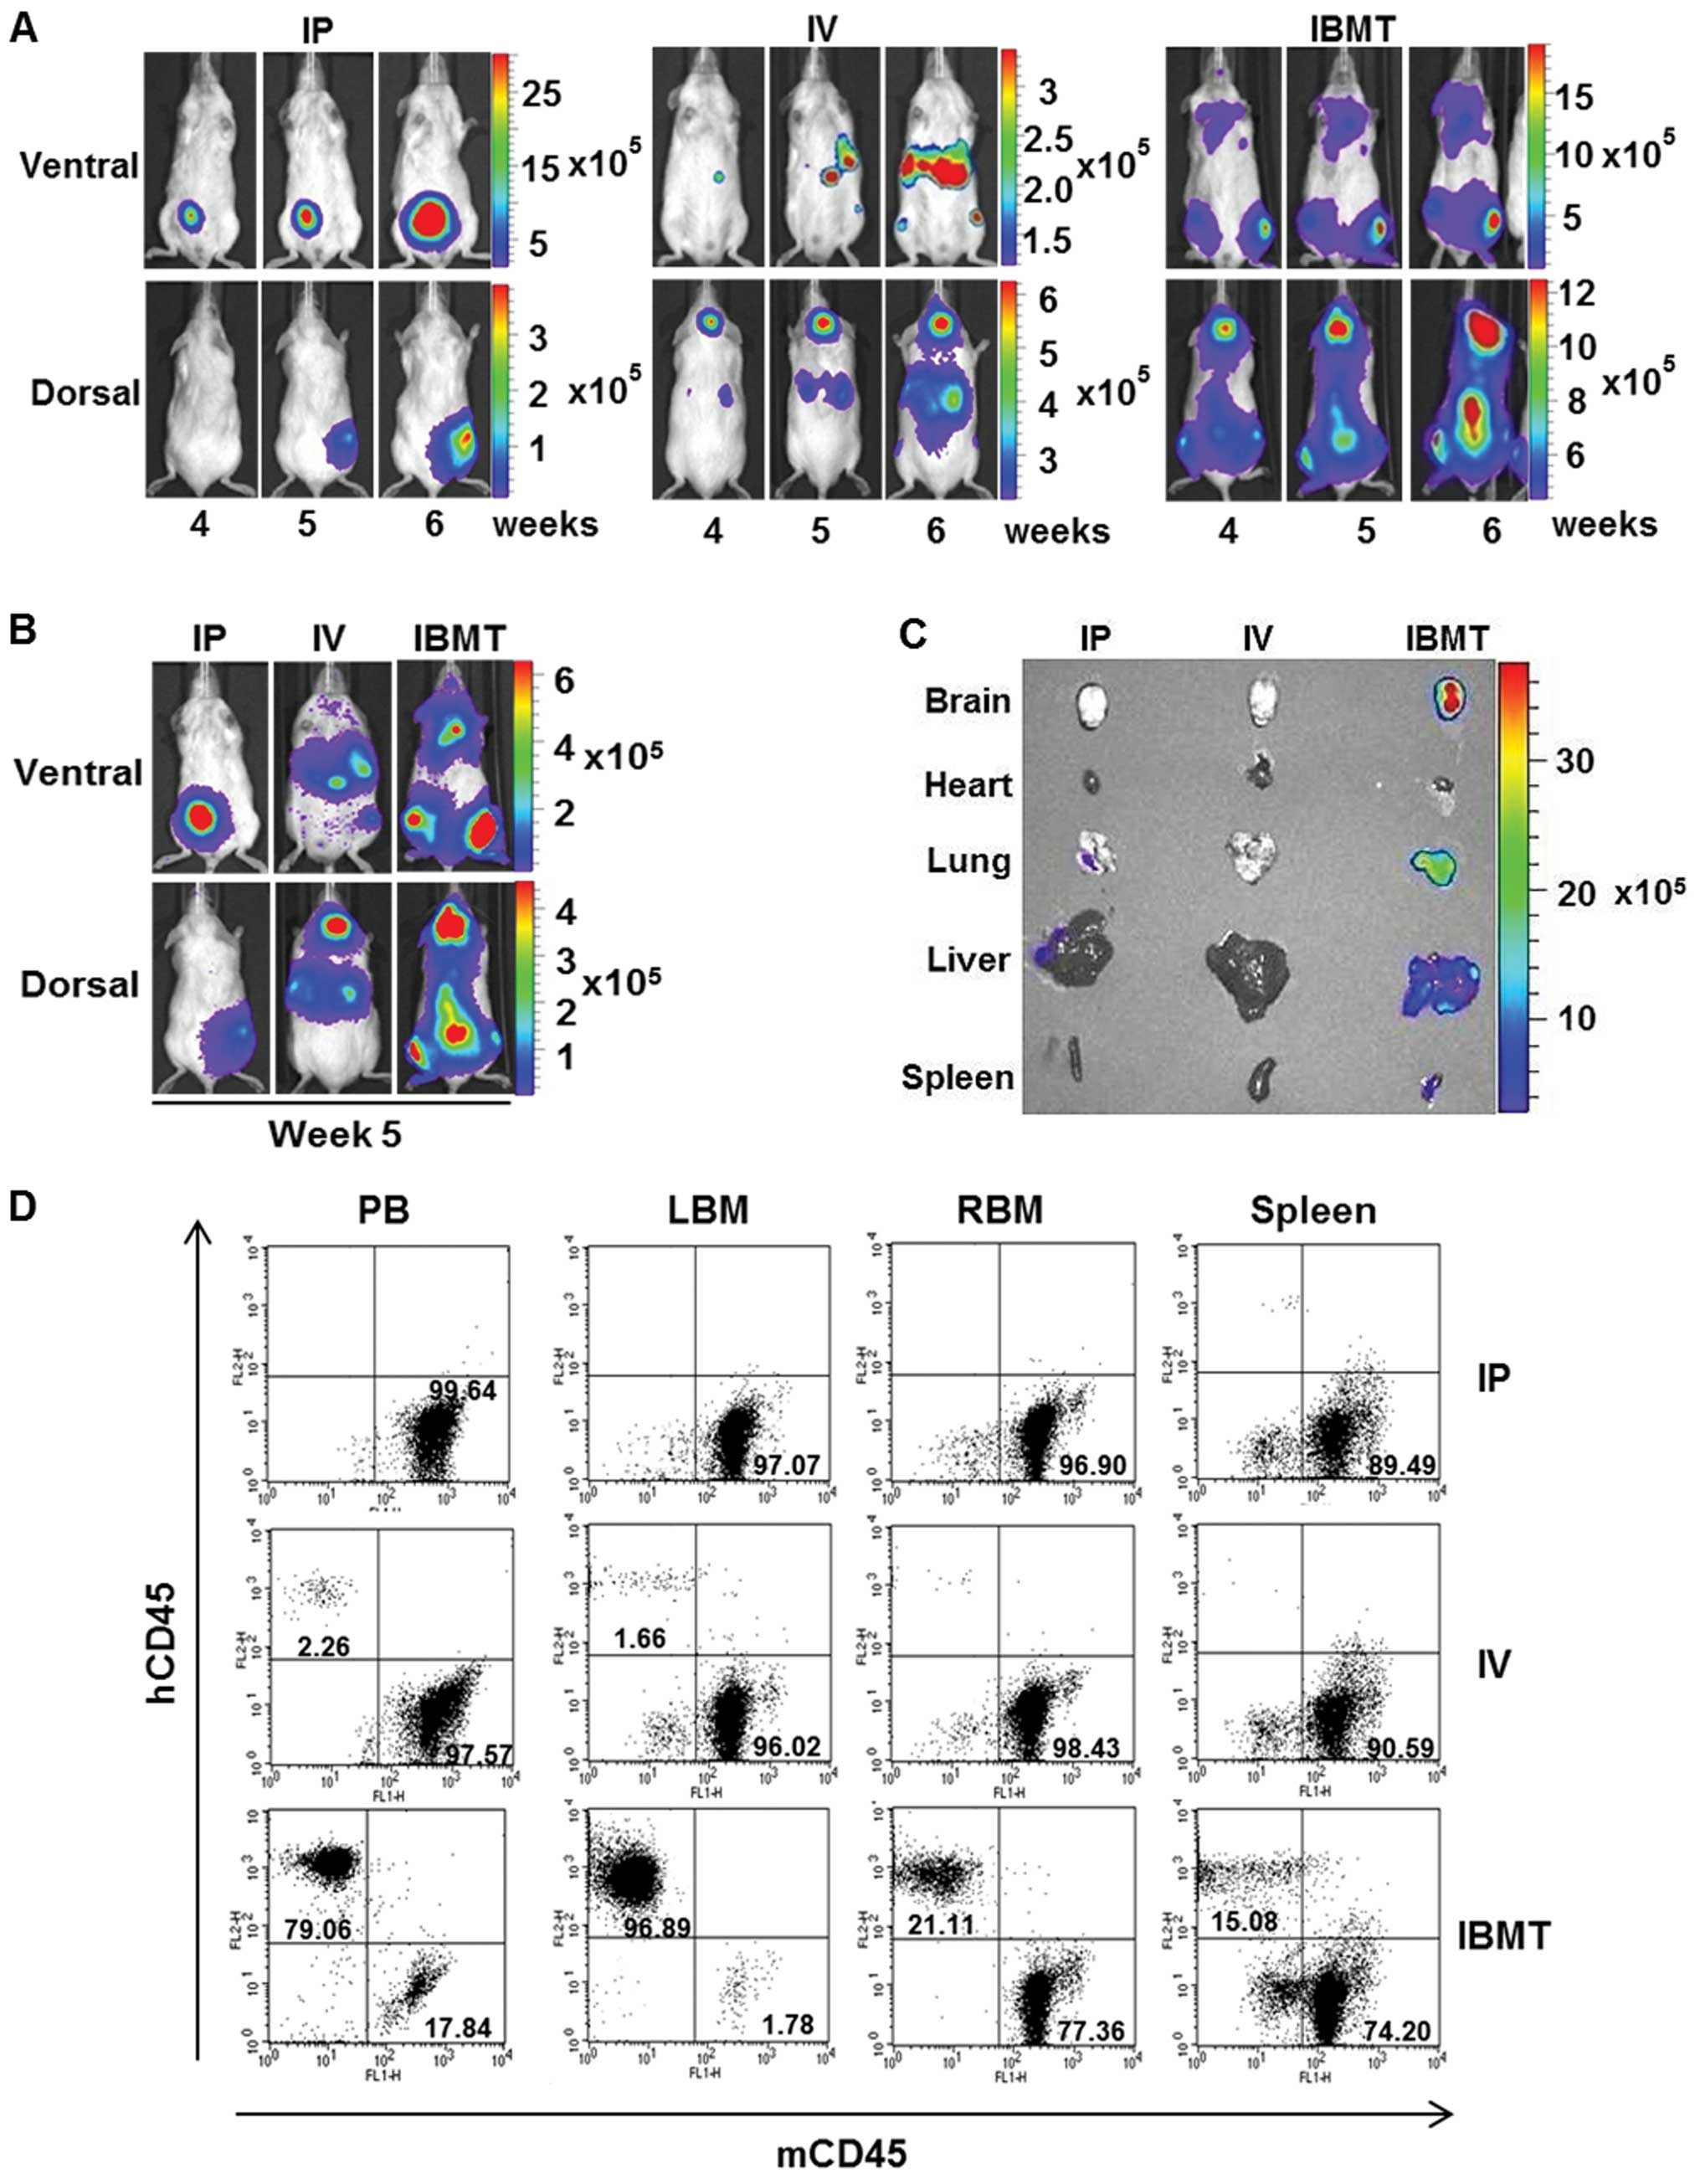 | Figure 3Quantitative correlation between
leukemia burden and level of organ infiltration by leukemic cells
established with the bioluminescent IBMT model. (A), The
bioluminescent intensity of each group from week 4 to 6 was
normalized to show the significant bioluminescent signal range
within each group using a signal intensity scale. Changes of
bioluminescent intensity over the course of monitoring are shown
for clearer comparative analysis within each group. (B),
Representative images from each group at week 5 with a normalized
signal intensity scale, which includes the bioluminescent signal
range from IP, IV and IBMT model mice, for comparative analysis.
(C), Bioluminescent images of organs from representative mice from
each group isolated at week 5. The only bioluminescent signals
detected were in the IBMT model mouse brain, lung, liver and
spleen. (D), The level of human leukemic cells in IP, IV and IBMT
models was analyzed using flow cytometric analysis of PB, spleen
and BM from left (LBM) and right tibia (RBM). The human leukemic
cell burden of the IBMT model was significantly higher in the
peripheral blood (79.06% of hCD45+, 17.84% of
mCD45+), BM (96.89% of hCD45+ in left tibia
and 21.11% of hCD45+ in right tibia in the prone
position), and spleen (15.08% of hCD45+, 74.20% of
mCD45+) of IBMT mice than in mice injected IP and
IV. |
Bioluminescent IBMT leukemia model
enables non-invasive monitoring of anti-leukemic treatment
responses with greater sensitivity
To demonstrate that the IBMT bioluminescent leukemia
model can be used to show the correlation between in vivo
responses to anti-leukemic treatments and its corresponding
bioluminescent intensity changes, IBMT leukemia mice were monitored
by whole body bioimaging after treatment with anti-cancer drugs,
vincristine and methylprednisolone. Response to the drugs was first
tested in vitro. Viability of the leukemia cell line
decreased as the concentration of vincristine increased (Fig. 4A). Bioluminescent evaluation of the
viability assay confirmed a decrease in bioluminescent viable
leukemic cells with an increase of vincristine concentration
(Fig. 4B and C). Next,
bioluminescent imaging of the IBMT leukemia model was evaluated
during treatment with vincristine at two concentrations; 0.1, 0.5
mg/kg and PBS (Fig. 4D). Where
bioluminescence at week 3 was initially detected pre-treatment, the
intensity reduced significantly (p<0.01) after three weekly
doses of vincristine at 0.5 mg/kg (Fig. 4E). The control group mouse (no
vincristine) became moribund shortly after the image was taken at
week 6. The reduction of whole body bioluminescent signals observed
with the higher dose of vincristine was also observed in isolated
organ images. The higher concentration of vincristine resulted in a
reduction in leukemic cell infiltration of organs (Fig. 4F). The reduction in bioluminescent
signals from vincristine-treated mice was validated by flow
cytometric evaluation of isolated PB and BM cells (Fig. 4G). The percentage of
hCD45+ cells in PB of 0.1 and 0.5 mg/kg
vincristine-treated mice was lower than in PB from a control mouse.
BM aspirates taken at the site of injection (left tibia) of the
control IBMT mice and 0.1 mg/kg vincristine-treated IBMT mice were
greater than 90% hCD45+. In contrast, analysis of BM
aspirates from the injection site of a 0.5 mg/kg
vincristine-treated mouse revealed a significantly lower percentage
of hCD45+ cells (25.66%). In BM aspirates from the right
tibia, compared to the control (92.23%), the percentage of
hCD45+ cells in 0.1 mg/kg (10.79%) and 0.5 mg/kg (0.58%)
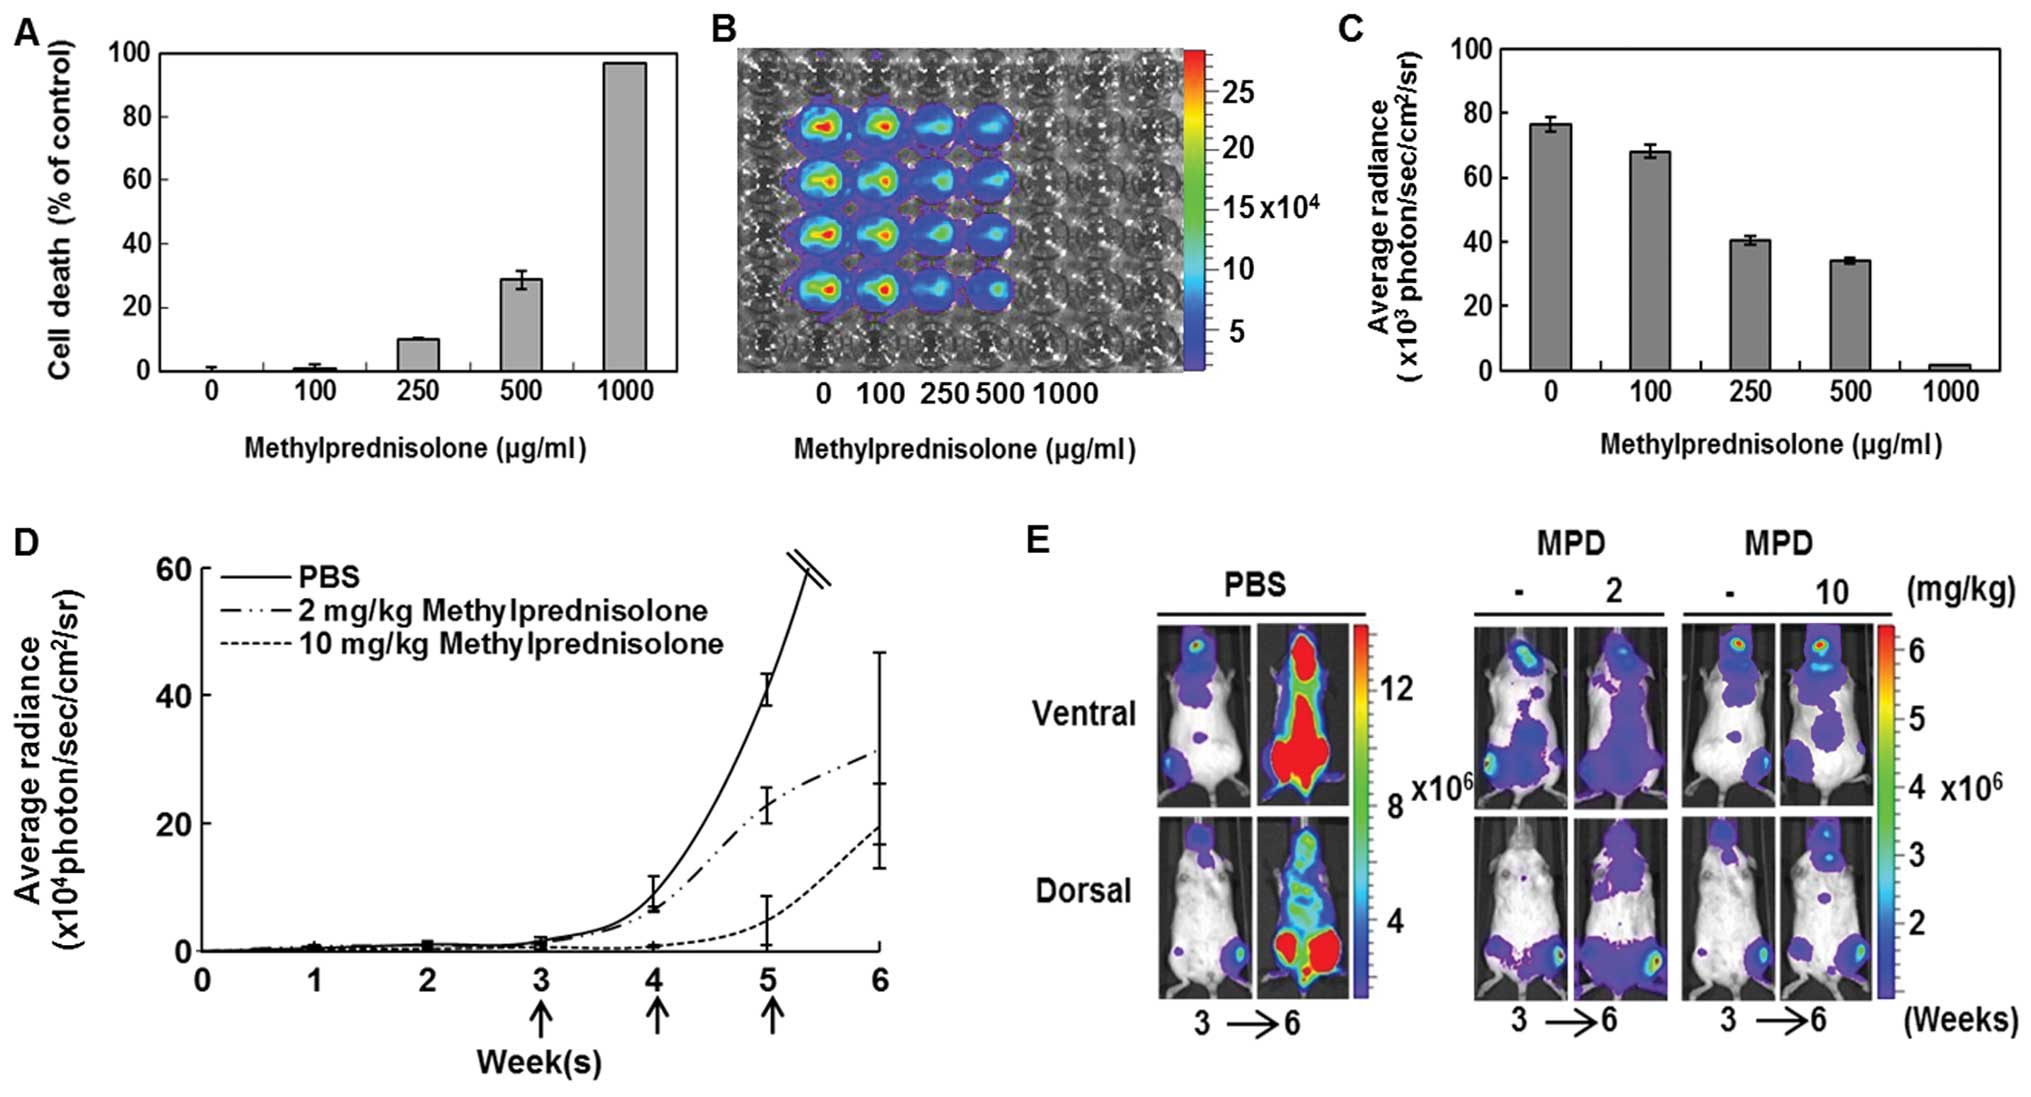
vincristine-treated mice was significantly lower. In addition, a
viability assay of CCRF-CEM/fLuc with methylprednisolone was
conducted. The endpoint analyses from Alamarblue assay (Fig. 5A) and bioluminescent evaluation
(Fig. 5B and C) showed that the
viability of the leukemic cells decreased with an increase in
methylprednisolone concentration. The mice were treated with PBS
(control, n=9), 2 mg/kg (n=9) or 10 mg/kg (n=9) methylprednisolone
once a week for 3 weeks. Each dotted line represents average
bioluminescent intensity values for each treatment group (Fig. 5D). Methylprednisolone treatments
(10 mg/kg) resulted in significantly (p<0.01) lower
bioluminescence than 2 mg/kg or PBS treatment groups at week 6.
Before (week 3) and after (week 6) images of representative mice
treated with methylprednisolone show that the IBMT leukemia model
can capture sensitive treatment responses (Fig. 5E). The results indicate that
bioluminescent images of the IBMT in vivo leukemia model can
provide an accurate representation of sensitive responses to
candidate drugs.
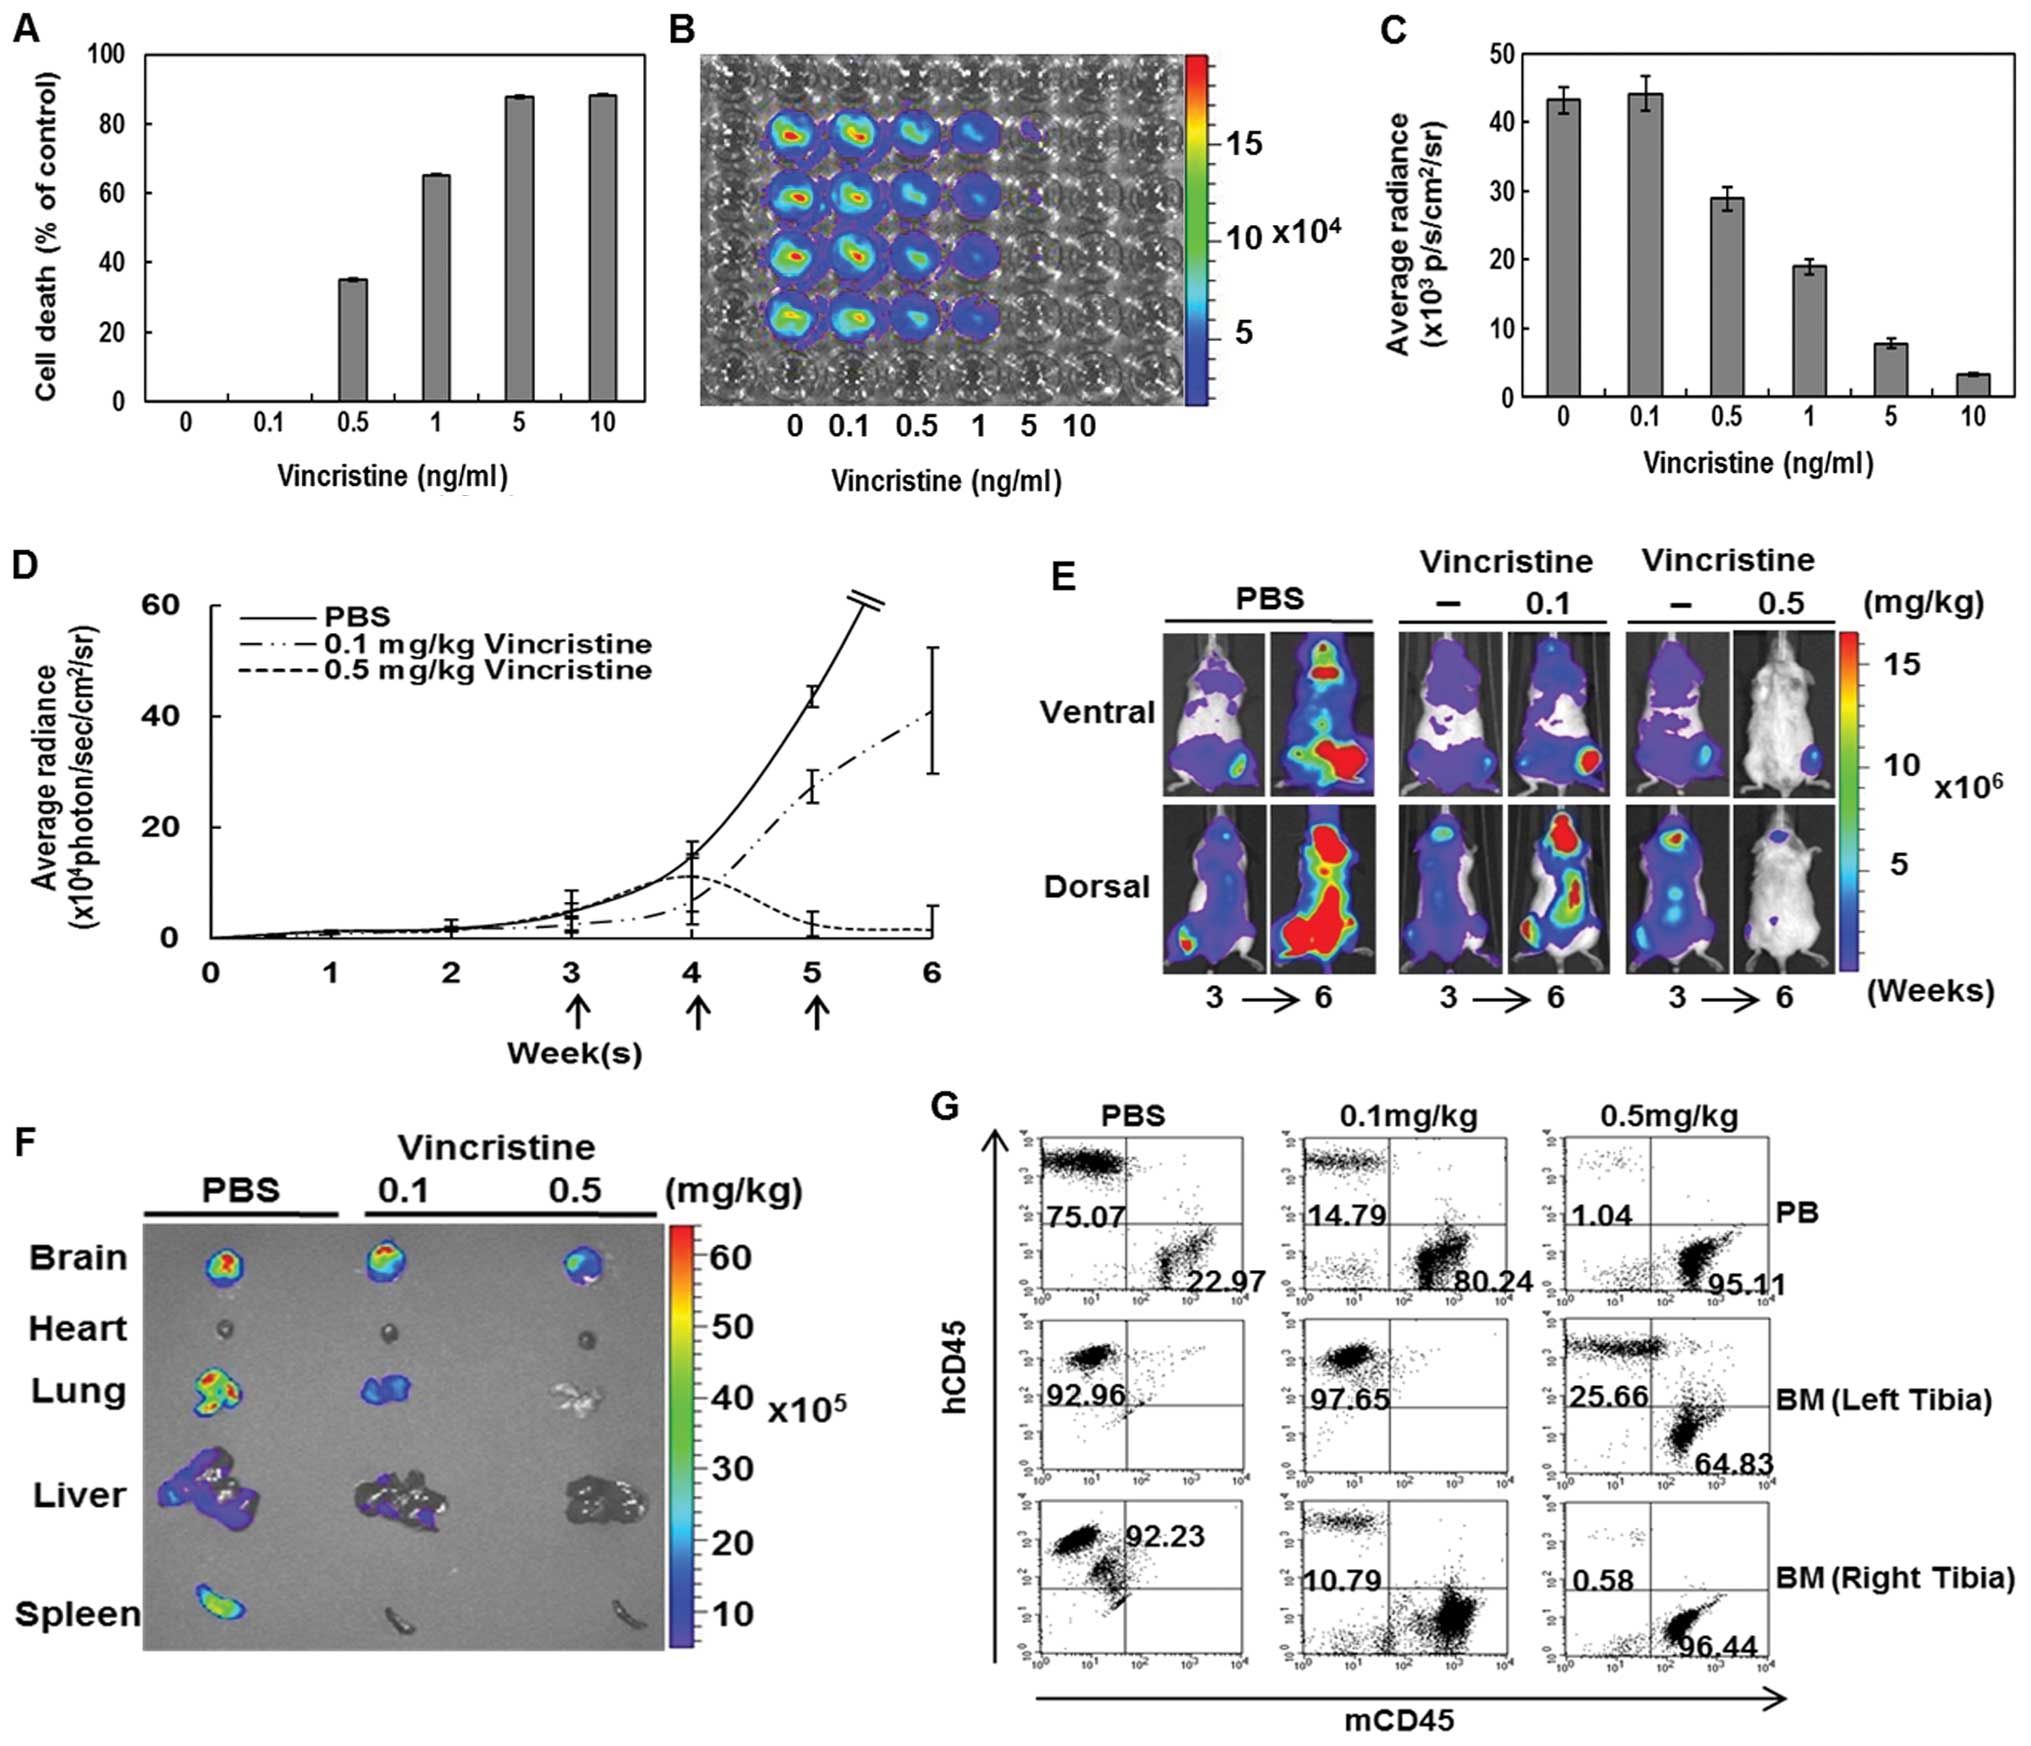 | Figure 4Bioluminescent imaging-based
evaluation of sensitivity to vincristine in the IBMT model. (A),
In vitro sensitivity of CCRF-CEM/fLuc to vincristine (0,
0.1, 0.5, 1, 5, or 10 ng/ml) was determined using Alamarblue assay.
(B, C), Bioluminescence of the cell line treated with vincristine
at different concentrations. Cell death of CCRF-CEM/fLuc cell line
increased and bioluminescence decreased with vincristine
concentration. (D), In vivo sensitivity of bioluminescent
leukemic cell-xenografted mice to 0.1 and 0.5 mg/kg vincristine.
Weekly treatment responses were evaluated with bioluminescent
imaging. Quantification of bioluminescent CCRF-CEM/fLuc responses
over time to weekly intravenous tail-vein treatment of vincristine
0.1 mg/kg (n=9), 0.5 mg/kg (n=9) or PBS (n=9) for 3 weeks. (E),
Bioluminescent leukemia responses in control mouse and to 0.1 and
0.5 mg/kg vincristine were evaluated by comparing images before
treatment at week 3 and after final treatment at week 6
(p<0.01). (F), Bioluminescent organ images of control mouse and
mice treated with high or low concentrations of vincristine taken 1
week after final treatment. (G), Flow cytometric analyses of
leukemic cell burden in PB and BM of vincristine-treated mice and
six control mice. |
IBMT facilitates the establishment of a
bioluminescent leukemia in vivo model in secondary recipient
mice
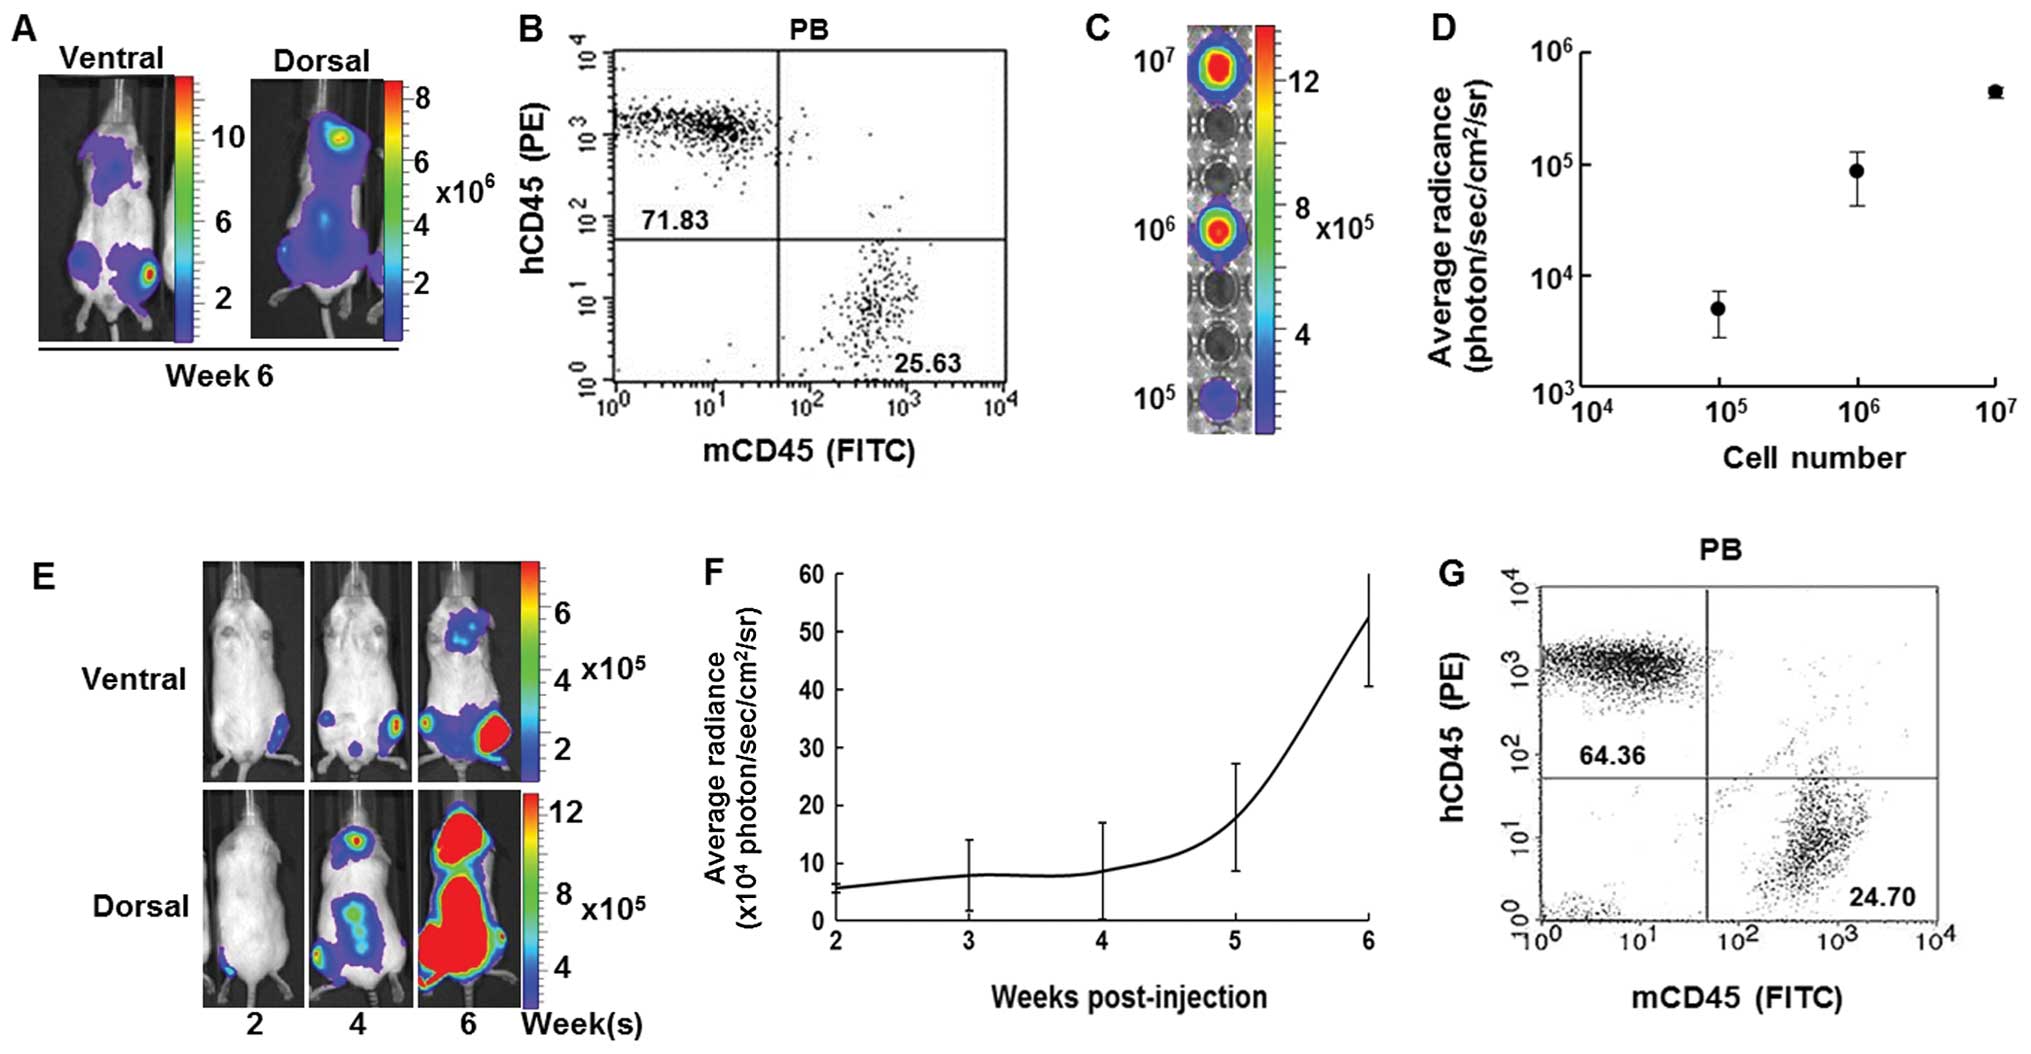
To demonstrate that the IBMT route of administration
is an effective method for generating a reproducible in vivo
leukemia model, leukemia cells from PB of the first generation
leukemia model mice at week 6 (Fig.
6A) were isolated. PB mononuclear cells from an IBMT leukemia
model mouse that comprised 71.83% hCD45+ cells along
with 25.63% mCD45+ cells (Fig. 6B). The luciferase expression level
of the ex vivo leukemic cells was evaluated to ensure that
these cells maintained characteristics of the human leukemia cell
line, CCRF-CEM/fLuc, which was originally transplanted.
Bioluminescent images of 105, 106 and
107 isolated, ex vivo expanded cells were
obtained and their average radiance values were plotted (Fig. 6C and D). These ex vivo cells
proliferated and stably expressed luciferase during long-term in
vitro culture (data not shown). After ex vivo expansion,
the isolated leukemic cells were xenografted into the left tibia of
secondary recipient NOD/SCID mice (Fig. 6E). The second generation model mice
showed a similar course of bioluminescent intensity to that of the
first (Fig. 6F). Bioluminescent
activity of human leukemic cells in PB from the second generation
was quantified by flow cytometric analysis 6 weeks after
transplantation of the first generation leukemic cells. PB
comprised 64.36% hCD45+ cells and 24.70%
mCD45+ cells (Fig. 6G).
These results indicate that the IBMT route is able to generate a
reproducible in vivo leukemia model.
Discussion
The comparison of in vivo leukemia models
established with three different injection methods in this study
revealed that IBMT of leukemic cells with bioluminescence was able
to facilitate quantification of disease level and its corresponding
bioluminescent signal range which can be useful in evaluation of
prospective therapies. Recent studies have suggested that the BM
microenvironment contributes to the progression of leukemia
(16) where cross-talk with stroma
favors their localization (17–19).
Among many contributing factors, interleukin (IL)-7, produced by
stroma cells, has been implicated as playing a significant role in
promoting the viability and proliferation of leukemic cells.
Expedited progression of leukemia by inducing the upregulation of
Bcl-2 and down-regulation of p27Kip1 was found to be
IL-7-dependent (20). Another
study reported that leukemia cell growth preferentially occurs in
BM, moreover, leukemic cells can transform normal stromal
environment into its favorable malignant microenvironment (21). Therefore, our rationale for IBMT
approach to establish leukemia animal model was based on evidence
that bone marrow microenvironment plays a significant role in
promoting survival and proliferation of leukemic cells (22).
A growing number of in vivo models for
experimental therapeutics relevant to human cancers, such as
hematological malignancies, are used in combination with a
bioluminescent imaging system to trace leukemia progression in
real-time and elucidate underlying biological mechanisms of
leukemogenesis (23–27). Furthermore, the combination of
bioluminescence and imaging has superseded previous invasive
monitoring methods, including serial tail-vein PB sampling, as a
more desirable alternative (28).
The bioluminescent imaging evaluation is equipped with a powerful
technique for cancer cell labeling in which expression of a
reporter gene (usually firefly luciferase) provides high detection
sensitivity and can be imaged for both spatial and quantitative
information (29). Importantly, to
use bioluminescent images reliably for preclinical validation of
leukemia treatments, in vivo models should incorporate the
range of detectable bioluminescent signals that reflects leukemic
cell activity in model mice. Leukemia studies using in vivo
models have commonly used IV (tail-vein) and IP injections as
methods to deliver bioluminescent cells (15,30–33).
In this study, we demonstrated that in vivo
bioluminescent monitoring was possible with IBMT of leukemic cells
by comparing the bioluminescent images of the three leukemia models
over the course of 6 weeks. The comparison revealed that leukemic
cells were detected earlier in IBMT model compared to IP and IV
models. High intensity bioluminescent signals were visible and
detectable in multiple sites of IBMT leukemic model mouse. However,
bioluminescent image-based comparison was difficult using images
alone because bioluminescent signal ranges for all three models
greatly varied and differences between these ranges were too wide
to conduct comparison. Especially, in IP and IV models luminescent
signal values were significantly lower than IBMT. Therefore, in
order to compare the three models, luminescent values displayed as
color scale bar must be evaluated along with the images. This color
scale bar represents level of intensity of the leukemic cell
bioluminescent signals accumulated during 1 min of imaging.
Considering these factors, we have chosen week 5 images of the
three leukemia models and adjusted images so that large
bioluminescent signal gap between these models can be reduced. High
signal regions indicated by red color observed from the IP and IV
model images of week 5 have changed to lower signal intensity
indicated by blue-violet color whereas high signal regions expanded
and intensified in the IBMT model. The comparison of the
bioluminescent images and its bioluminescent signal values revealed
that leukemic cells in IBMT model were populated systemically and
exhibited strong luciferase activity compared to IP and IV
models.
In addition, we investigated whether the correlation
between bioluminescent signals observed in images and presence of
human leukemic cells in the model mice can be established. Although
correlation between the signals and level of human leukemic cells
were established using bioluminescent images of isolated organs and
cells from PB, BM and spleen, we could only found very small
portion in IP and IV models whereas large percentage human leukemic
cells would be detected in IBMT model. High intensity of
bioluminescent signals from the image data could be traced to
bioluminescent images of internal organs and significantly higher
percentage of hCD45+ cells were identified in PB
(79.06%) and BM (96.89%) of IBMT model than of IP and IV models.
Bioluminescent signal intensity concentrated in localized region of
the IP models often saturated image which made assessment of
leukemia burden difficult. These finding suggested that for the
purpose of therapeutic response studies, such small number of
leukemic cells present in IP and IV models could provide misleading
results of in vivo leukemic cell responses to potential
therapeutic candidates. In addition, variations between
experimental cohorts could arise from IP- and IV-injected leukemic
cells becoming lodged in tissue microvasculature, unable to migrate
to the proliferation site. These delivery routes may have
contributed to delayed progression of leukemia in mice since the
engraftment rates of leukemic cells appear to be dependent on the
homing potential and time required to reach its microenvironment
from the blood (34,35). Another aspect of bioluminescent
in vivo model must be considered is that since large
bioluminescent signals represent large number of leukemic cells in
IBMT model mouse, any changes in these values can be representative
data of in vivo leukemic cell responses. We demonstrated
that bioluminescent IBMT model can be used to evaluate in
vivo responses to anti-leukemic drugs using well-known drugs
such as vincristine and methylprednisolone.
Experiments using primary leukemia cells are
integral in studies for elucidating critical molecular targets,
drug screening and preclinical validation to establish new
therapeutic strategy. Unfortunately, maintaining sufficient numbers
of primary leukemia cells ex vivo is inherently limiting
because, unlike cell lines, they undergo spontaneous apoptosis
in vitro (36–38). Such limited availability of these
cells renders experiments reliant on the introduction of the
luciferase gene particularly challenging. In 2011, Barrett et
al proposed a bioluminescent approach for a non-invasive
disease monitoring model system using primary human leukemic cells
obtained from in vivo expansion in mice. They demonstrated
that it was possible to improve primary cell expansion and detect
engraftment rates in immunodeficient mice using in
vivo-cultured bioluminescent primary leukemia cells (39). However, their approach in
establishing an in vivo model for patient primary leukemia
used IV injection, which may have contributed to the finding that
greater than 1% human leukemic cells in PB could only be detected
when bioluminescent leukemia burden had reached greater than
1x10¹⁰ photon/sec/sr/cm2 inconsistently. We
believe that IBMT could reduce varietal differences and improve
sensitivity of preclinical primary leukemia in vivo model to
avoid mischaracterization of pharmacodynamics and remedial effects
of anti-leukemic drugs.
In conclusion, this study has demonstrated that
intramedullary xenograft of leukemia cells into its favored
microenvironment, such as the tibia of NOD/SCID mice, can result in
consistent establishment of systemic leukemia in an in vivo
model. Injection of leukemic cells by other routes, namely IP and
IV, provided inconsistent and highly variable leukemia development
patterns in NOD/SCID mice with a limited range of bioluminescent
signals. Based on these findings, the bioluminescent IBMT in
vivo leukemia model could improve current non-invasive
longitudinal disease monitoring. It enables the quantitative data
range for bioluminescent imaging-based analysis to be extended,
allowing more sensitive evaluation of disease burden, more precise
quantification of treatment responses. Finally, further adaptation
of the IBMT approach to the bioluminescent primary leukemia model
could advance developments of novel leukemia patient-tailored
therapies.
Acknowledgements
This research was supported by Basic
Science Research Program through the National Research Foundation
of Korea (NRF) funded by the Ministry of Education, Science and
Technology (2011-0015112).
References
|
1.
|
Seaman ME, Contino G, Bardeesy N and Kelly
KA: Molecular imaging agents: impact on diagnosis and therapeutics
in oncology. Expert Rev Mol Med. 12:e202010. View Article : Google Scholar : PubMed/NCBI
|
|
2.
|
Desar IM, van Herpen CM, van Laarhoven HW,
Barentsz JO, Oyen WJ and van der Graaf WT: Beyond RECIST: molecular
and functional imaging techniques for evaluation of response to
targeted therapy. Cancer Treat Rev. 35:309–321. 2009. View Article : Google Scholar : PubMed/NCBI
|
|
3.
|
Shu ST, Nadella MV, Dirksen WP, et al: A
novel bioluminescent mouse model and effective therapy for adult
T-cell leukemia/lymphoma. Cancer Res. 67:11859–11866. 2007.
View Article : Google Scholar : PubMed/NCBI
|
|
4.
|
Siegers GM, Felizardo TC, Mathieson AM,
Kosaka Y, Wang XH, Medin JA and Keating A: Anti-leukemia activity
of in vitro-expanded human gamma delta T cells in a xenogeneic
Ph+ leukemia model. PLoS One. 6:e167002011. View Article : Google Scholar : PubMed/NCBI
|
|
5.
|
Inoue Y, Izawa K, Tojo A, Nomura Y, Sekine
R, Oyaizu N and Ohtomo K: Monitoring of disease progression by
bioluminescence imaging and magnetic resonance imaging in an animal
model of hematologic malignancy. Exp Hematol. 35:407–415. 2007.
View Article : Google Scholar : PubMed/NCBI
|
|
6.
|
Bhadri VA, Cowley MJ, Kaplan W, Trahair TN
and Lock RB: Evaluation of the NOD/SCID xenograft model for
glucocorticoid-regulated gene expression in childhood B-cell
precursor acute lymphoblastic leukemia. BMC Genomics. 12:5652011.
View Article : Google Scholar : PubMed/NCBI
|
|
7.
|
Nijmeijer BA, Willemze R and Falkenburg
JH: An animal model for human cellular immunotherapy: specific
eradication of human acute lymphoblastic leukemia by cytotoxic T
lymphocytes in NOD/scid mice. Blood. 100:654–660. 2002. View Article : Google Scholar : PubMed/NCBI
|
|
8.
|
Fichtner I, Becker M and Baumgart J:
Antileukaemic activity of treosulfan in xenografted human acute
lymphoblastic leukaemias (ALL). Eur J Cancer. 39:801–807. 2003.
View Article : Google Scholar : PubMed/NCBI
|
|
9.
|
Lock RB, Liem N, Farnsworth ML, et al: The
nonobese diabetic/severe combined immunodeficient (NOD/SCID) mouse
model of childhood acute lymphoblastic leukemia reveals intrinsic
differences in biologic characteristics at diagnosis and relapse.
Blood. 99:4100–4108. 2002. View Article : Google Scholar
|
|
10.
|
Nijmeijer BA, Mollevanger P, van
Zelderen-Bhola SL, Kluin-Nelemans HC, Willemze R and Falkenburg JH:
Monitoring of engraftment and progression of acute lymphoblastic
leukemia in individual NOD/SCID mice. Exp Hematol. 29:322–329.
2001. View Article : Google Scholar : PubMed/NCBI
|
|
11.
|
Inoue Y, Izawa K, Kiryu S, Kobayashi S,
Tojo A and Ohtomo K: Bioluminescent evaluation of the therapeutic
effects of total body irradiation in a murine hematological
malignancy model. Exp Hematol. 36:1634–1641. 2008. View Article : Google Scholar : PubMed/NCBI
|
|
12.
|
Jenkins DE, Oei Y, Hornig YS, et al:
Bioluminescent imaging (BLI) to improve and refine traditional
murine models of tumor growth and metastasis. Clin Exp Metastasis.
20:733–744. 2003. View Article : Google Scholar : PubMed/NCBI
|
|
13.
|
Sipkins DA, Wei X, Wu JW, et al: In vivo
imaging of specialized bone marrow endothelial microdomains for
tumour engraftment. Nature. 435:969–973. 2005. View Article : Google Scholar : PubMed/NCBI
|
|
14.
|
Fragoso R, Pereira T, Wu Y, Zhu Z,
Cabecadas J and Dias S: VEGFR-1 (FLT-1) activation modulates acute
lymphoblastic leukemia localization and survival within the bone
marrow, determining the onset of extramedullary disease. Blood.
107:1608–1616. 2006. View Article : Google Scholar
|
|
15.
|
Bonnet D and Dick JE: Human acute myeloid
leukemia is organized as a hierarchy that originates from a
primitive hematopoietic cell. Nat Med. 3:730–737. 1997. View Article : Google Scholar : PubMed/NCBI
|
|
16.
|
Ayala F, Dewar R, Kieran M and Kalluri R:
Contribution of bone microenvironment to leukemogenesis and
leukemia progression. Leukemia. 23:2233–2241. 2009. View Article : Google Scholar : PubMed/NCBI
|
|
17.
|
Zhou J, Mauerer K, Farina L and Gribben
JG: The role of the tumor microenvironment in hematological
malignancies and implication for therapy. Front Biosci.
10:1581–1596. 2005. View
Article : Google Scholar : PubMed/NCBI
|
|
18.
|
Veiga JP, Costa LF, Sallan SE, Nadler LM
and Cardoso AA: Leukemia-stimulated bone marrow endothelium
promotes leukemia cell survival. Exp Hematol. 34:610–621. 2006.
View Article : Google Scholar : PubMed/NCBI
|
|
19.
|
Schmitz M, Breithaupt P, Scheidegger N, et
al: Xenografts of highly resistant leukemia recapitulate the clonal
composition of the leukemogenic compartment. Blood. 118:1854–1864.
2011. View Article : Google Scholar : PubMed/NCBI
|
|
20.
|
Silva A, Laranjeira AB, Martins LR, et al:
IL-7 contributes to the progression of human T-cell acute
lymphoblastic leukemias. Cancer Res. 71:4780–4789. 2011. View Article : Google Scholar : PubMed/NCBI
|
|
21.
|
Colmone A, Amorim M, Pontier AL, Wang S,
Jablonski E and Sipkins DA: Leukemic cells create bone marrow
niches that disrupt the behavior of normal hematopoietic progenitor
cells. Science. 322:1861–1865. 2008. View Article : Google Scholar : PubMed/NCBI
|
|
22.
|
Ninomiya M, Abe A, Katsumi A, et al:
Homing, proliferation and survival sites of human leukemia cells in
vivo in immunodeficient mice. Leukemia. 21:136–142. 2007.
View Article : Google Scholar : PubMed/NCBI
|
|
23.
|
Rauch D, Gross S, Harding J, Niewiesk S,
Lairmore M, Piwnica-Worms D and Ratner L: Imaging spontaneous
tumorigenesis: inflammation precedes development of peripheral NK
tumors. Blood. 113:1493–1500. 2009. View Article : Google Scholar : PubMed/NCBI
|
|
24.
|
Inoue Y, Tojo A, Sekine R, et al: In vitro
validation of biolumine-scent monitoring of disease progression and
therapeutic response in leukaemia model animals. Eur J Nucl Med Mol
Imaging. 33:557–565. 2006. View Article : Google Scholar : PubMed/NCBI
|
|
25.
|
Lassailly F, Griessinger E and Bonnet D:
‘Microenvironmental contaminations’ induced by fluorescent
lipophilic dyes used for non-invasive in vitro and in vivo cell
tracking. Blood. 115:5347–5354. 2010.
|
|
26.
|
Tsai HJ, Kobayashi S, Izawa K, et al:
Bioimaging analysis of nuclear factor-kappaB activity in
Philadelphia chromosome-positive acute lymphoblastic leukemia cells
reveals its synergistic upregulation by tumor necrosis
factor-alpha-stimulated changes to the microenvironment. Cancer
Sci. 102:2014–2021. 2011. View Article : Google Scholar
|
|
27.
|
Liem NL, Papa RA, Milross CG, et al:
Characterization of childhood acute lymphoblastic leukemia
xenograft models for the preclinical evaluation of new therapies.
Blood. 103:3905–3914. 2004. View Article : Google Scholar : PubMed/NCBI
|
|
28.
|
Zhou B, Ju SG, Ju SW, Xie F and Zhang XG:
Establishment of human acute monocytic leukemia model in severe
combined immunodeficient (SCID) mice and the analysis of
pathological changes. Xi Bao Yu Fen Zi Mian Yi Xue Za Zhi.
23:501–503. 2007.PubMed/NCBI
|
|
29.
|
Mezzanotte L, Fazzina R, Michelini E,
Tonelli R, Pession A, Branchini B and Roda A: In vivo
bioluminescence imaging of murine xenograft cancer models with a
red-shifted thermostable luciferase. Mol Imaging Biol. 12:406–414.
2010. View Article : Google Scholar : PubMed/NCBI
|
|
30.
|
Samuels AL, Peeva VK, Papa RA, et al:
Validation of a mouse xenograft model system for gene expression
analysis of human acute lymphoblastic leukaemia. BMC Genomics.
11:2562010. View Article : Google Scholar : PubMed/NCBI
|
|
31.
|
Komeno Y, Kitaura J, Watanabe-Okochi N, et
al: AID-induced T-lymphoma or B-leukemia/lymphoma in a mouse BMT
model. Leukemia. 24:1018–1024. 2010. View Article : Google Scholar : PubMed/NCBI
|
|
32.
|
Barabe F, Kennedy JA, Hope KJ and Dick JE:
Modeling the initiation and progression of human acute leukemia in
mice. Science. 316:600–604. 2007. View Article : Google Scholar : PubMed/NCBI
|
|
33.
|
Hoyos V, Savoldo B, Quintarelli C, et al:
Engineering CD19-specific T lymphocytes with interleukin-15 and a
suicide gene to enhance their anti-lymphoma/leukemia effects and
safety. Leukemia. 24:1160–1170. 2010. View Article : Google Scholar : PubMed/NCBI
|
|
34.
|
Messinger Y, Chelstrom L, Gunther R and
Uckun FM: Selective homing of human leukemic B-cell precursors to
specific lymphohematopoietic microenvironments in SCID mice: a role
for the beta 1 integrin family surface adhesion molecules VLA-4 and
VLA-5. Leuk Lymphoma. 23:61–69. 1996. View Article : Google Scholar
|
|
35.
|
Cesano A, O’Connor R, Lange B, Finan J,
Rovera G and Santoli D: Homing and progression patterns of
childhood acute lymphoblastic leukemias in severe combined
immunodeficiency mice. Blood. 77:2463–2474. 1991.PubMed/NCBI
|
|
36.
|
Biagi E, Bambacioni F, Gaipa G, Casati C,
Golay J, Biondi A and Introna M: Efficient lentiviral transduction
of primary human acute myelogenous and lymphoblastic leukemia
cells. Haematologica. 86:13–16. 2001.PubMed/NCBI
|
|
37.
|
Konopleva M, Konoplev S, Hu W, Zaritskey
AY, Afanasiev BV and Andreeff M: Stromal cells prevent apoptosis of
AML cells by up-regulation of anti-apoptotic proteins. Leukemia.
16:1713–1724. 2002. View Article : Google Scholar : PubMed/NCBI
|
|
38.
|
Horisberger MA: A method for prolonged
survival of primary cell lines. In Vitro Cell Dev Biol Anim.
42:143–148. 2006. View Article : Google Scholar : PubMed/NCBI
|
|
39.
|
Barrett DM, Seif AE, Carpenito C, et al:
Noninvasive bioluminescent imaging of primary patient acute
lymphoblastic leukemia: a strategy for preclinical modeling. Blood.
118:e112–117. 2011. View Article : Google Scholar
|