Introduction
Hepatocellular carcinoma (HCC) is the third leading
cause of mortality worldwide; there are 600,000 estimated new HCC
cases annually and almost as many as deaths (1). This malignancy occurs more often in
men than in women, with higher incidence rates reported in several
areas of Asia and Africa.
Sorafenib is one of the FDA-approved molecular
targeted drugs for advanced HCC, and it confers significantly
improved survival. Despite such advances in HCC therapy, the poor
prognosis of HCC is still unavoidable due to the rapidly dividing
cells that are the primary targets of traditional anticancer
therapy (2). In the cancer stem
cell (CSC) theory, only a limited number of cells within the tumor,
which are termed CSCs, are proposed to persist in tumors as a
distinct population and cause relapse and metastasis by giving rise
to new tumors. CSCs have been identified and isolated from
hematopoietic malignancies and other solid tumors, including
glioblastoma, breast cancer, colon cancer and hepatocellular
carcinoma (3–7). Currently, there is no drug that
specifically targets this fraction of tumor cells; therefore,
CSC-targeted anticancer interventions are potential therapies for
this malignancy.
The epigenetic regulator polycomb group (PcG) genes
are thought to control cell fate, cell differentiation and cancer
development. Bmi1 is one of the core components of the PcG protein
complex, which is involved in axial patterning, hematopoiesis, cell
proliferation and senescence (8–11).
Bmi1 was first identified as an oncogene for the generation of B-
or T-cell leukemia in cooperation with c-Myc, which is dysregulated
in various human cancers, such as colorectal carcinoma, HCC and
lung cancer (12–14). Furthermore, Bmi1 as a stem
cell gene has been defined by the fact that its deficiency leads to
compromised adult stem cell function (15). It has been demonstrated that Bmi1
is necessary for the maintenance of stemness in leukemic stem cells
and solid tumor stem cells, including HCC cells (16–18).
Importantly, the overexpression of Bmi1 correlates with therapy
failure in many tumor types, including those in breast, prostate,
lung and ovarian cancer patients (14,19,20).
In the present study, we performed detailed analyses
to examine the roles of Bmi1 in HCC. Bmi1 expression was evaluated
by western blot analysis and immunohistochemical staining in normal
liver and HCC tissues. Bmi1 knockdown in the HCC cell lines
inhibited tumorsphere formation in vitro and cell growth and
tumor formation in vivo. A cell cycle analysis clarified
that the knockdown of Bmi1 induced cell cycle arrest. Furthermore,
Bmi1 knockdown also enhanced the sensitivity of HCC to the
therapeutic agent, sorafenib.
Materials and methods
Patients and clinicopathological
analysis
Surgical resection samples were obtained from 47
patients (including 9 females and 38 males) diagnosed with HCC at
the First Affiliated Hospital, Medical College of Xi’an Jiaotong
University, Xi’an, China from 2001 to 2003. The clinicopathological
data of these patients, including the tumor stage, grade,
differentiation, and survival time, were collected, and the
follow-up data were updated through June 2006. A total of 9
match-paired HCC tissues and adjacent non-tumor tissues were
collected from the Department of Hepatobiliary Surgery, First
Affiliated Hospital, Medical College of Xi’an Jiaotong University.
All of the tissue samples were obtained from untreated patients who
were undergoing surgery. The study was approved by the Medical
Ethics Committee of the First Affiliated Hospital, Medical College
of Xi’an Jiaotong University, and all the patients formally
consented to be a part of the study to the best of their
understanding.
Immunohistochemistry
A standard immunostaining procedure was performed
using mouse monoclonal antibodies against Bmi1 (Millipore; Boston,
MA, USA), proliferating cell nuclear antigen (PCNA; Maixin Bio,
Fujian, China), Ki-67 (Maixin Bio) or an isotype-matched control
antibody. The immunoreactivity and subcellular localization of Bmi1
were evaluated independently by 3 investigators.
Bmi1 staining was classified into 2 groups, negative
or positive, based on the percentage of positive cells and the
staining intensity. The percentage of positive cells was divided
into 4 ranks of scores: <10% (1), 0–25% (2), 25–50% (3) and
>50% (4). The intensity of staining was also divided into 4
ranks of scores: no staining (1), light brown (2), brown (3) and
dark brown (4). The positivity of Bmi1 staining was determined by
the following formula: immunohistochemistry score = percentage
score × intensity score. An overall score of ≤8 was defined as
negative and >8 as positive.
Cells and cell culture
The HCC-derived cell lines, Bel-7402 (CCTCC GDC035),
SMMC-7721 (CCTCC GDC064) and HepG2 (CCTCC GDC024), were all
purchased from the China Center for Type Culture Collection (CCTCC;
Wuhan, China). The cells were maintained in RPMI-1640 medium
(Invitrogen, Carlsbad, CA, USA) supplemented with 10% fetal bovine
serum (FBS, Invitrogen) in a humidified atmosphere at 37°C with 5%
CO2. The MHCC97 cells (Cell Bank of Chung Shan Hospital,
Shanghai, China) were maintained in Dulbecco’s modified Eagle’s
medium (DMEM, Invitrogen) supplemented with 10% FBS in a humidified
atmosphere at 37°C with 5% CO2.
Bmi1 shRNA vector construction and
transfection
The oligonucleotide insert for the hairpin siRNA
targeting the Bmi1 mRNA sequences was GGAGGAACCTTTAAAGGA TTA. The
oligonucleotide sequences were 5′-CACCGGAG
GAACCTTTAAAGGATTATTCAAGAGATAATCCTTTAA AGGTTCCTCCTTTTTTG-3′ and
5′-GATCCAAAAAAGG AGGAACCTTTAAAGGATTATCTCTTGAATAATCCTTT
AAAGGTTCCTCC-3′. The synthesized oligonucleotide (GenePharma,
Shanghai, China) inserts were annealed and cloned into the
PGPU6/GFP/neo-shRNA expression vector (GenePharma) to generate
PGPU6/GFP/neo-shBmi1. The plasmid PGPU6/GFP/neo-shControl
(GenePharma) was used as the negative control and encoded a hairpin
siRNA with a nonsense sequence.
For stable cell line generation, the transfection
was performed using Lipofectamine 2000 (Invitrogen) following the
manufacturer’s instructions. Bmi1 stable-knockdown cells and the
control cells were selected using 0.8 mg/ml G418 (Calbiochem, La
Jolla, CA, USA).
Western blot analysis
Western blot analyses were performed as previously
described using cell lysates (21). The crude proteins were then
subjected to SDS-PAGE and then transferred onto a PVDF membrane.
After blocking, the membrane was incubated with the appropriate
antibody against Bmi1 (Millipore) or β-actin (Santa Cruz
Biotechnology, Santa Cruz, CA, USA) at 4°C overnight, followed by a
horseradish peroxidase-labeled secondary antibody. The blots were
developed using a chemiluminescent detection system (Amersham Life
Science, Buckinghamshire, UK).
Cell cycle assay
Cells (1×10⁶) were cultured in 6-well
plates for 24 h and then harvested and washed with PBS, followed by
fixation with 70% ethanol overnight at 4°C. After washing with PBS
twice, the cells were stained in PBS with 50 μg/ml propidium
iodide (PI; Sigma, St. Louis, MO, USA) and 10 μg/ml RNase A
(Sigma) at room temperature in the dark. The cell cycle was
assessed by flow cytometry (FACSCalibur; BD Biosciences, Franklin
Lakes, NJ, USA), and the data were analyzed with the FACSCalibur
flow cytometer using ModFit LT software.
Cell proliferation and colony formation
assay
Cell proliferation was evaluated on days 1, 3, 5,
and 7 after seeding the cells (5×10⁴) in triplicate in
6-well plates. A total of 200 cells plated on 100-mm cell culture
dishes in triplicate were cultured for 3 weeks. The cell colonies
were stained with Giemsa solution after being fixed in methanol for
15 min at room temperature.
Tumor xenografts
The stable Bmi1 knockdown or control cell line
(106 cells) was injected into the subcutaneous tissue in
the dorsum of 4–6-week-old male Balb/c-nude mice. Three animals per
group were used in each experiment. The tumors were measured weekly
using a vernier caliper, and the volume was calculated according to
the following formula: length × width2/2. At the end of
the experiment, the tumors were dissected, and their net weights
were measured. The experimental protocols were evaluated and
approved by the Animal Care and Use Committee of the Medical
College of Xi’an Jiaotong University.
Drug experiments
Sorafenib was dissolved in DMSO (Sigma) and diluted
with RPMI-1640 to the desired concentration (5 μM), with a
final DMSO concentration of 0.1% for the in vitro studies.
DMSO at 0.1% (v/v) was used as a solvent control.
Cells (1×10³) were plated on 100-mm cell
culture dishes in triplicate, and cultured for 3 weeks. Sorafenib
or the solvent was added at the appropriate concentration after 24
h. The cell colonies were stained with Giemsa solution after being
fixed in methanol for 15 min at room temperature.
A total of 5,000 cells were inoculated in 96-well
microtiter plates and incubated overnight at 37°C in a humidified
incubator with 5% CO2. The cell viability was quantified
every day using 3-(4,5-dimethylthiazol-2-yl)-2,5-diphenyl
tetrazolium bromide (MTT; Sigma) staining, according to a standard
protocol. The cells were incubated with sorafenib at various
concentrations for an additional 72 h to evaluate the inhibitory
effect of sorafenib on cell proliferation. The number of viable
cells was determined by measuring the absorbance at 490 nm.
Statistical analysis
All the experiments were repeated at least in
triplicate. The data from all of the experiments were pooled, and
the results are expressed as the means ± SD. The statistical
analysis was performed using SPSS 16.0 software (SPSS Inc.;
Chicago, IL, USA). The two-tailed χ2 test was used to
determine the significance of the differences between the
co-variates. For 2-group analyses, Student’s t-test was used to
determine the statistical significance, whereas Pearson’s linear
regression analysis was performed to examine the correlation
between 2 quantitative variables. P<0.05 was considered to
indicate a statistically significant difference.
Results
Bmi1 expression in human HCC tissues and
cell lines
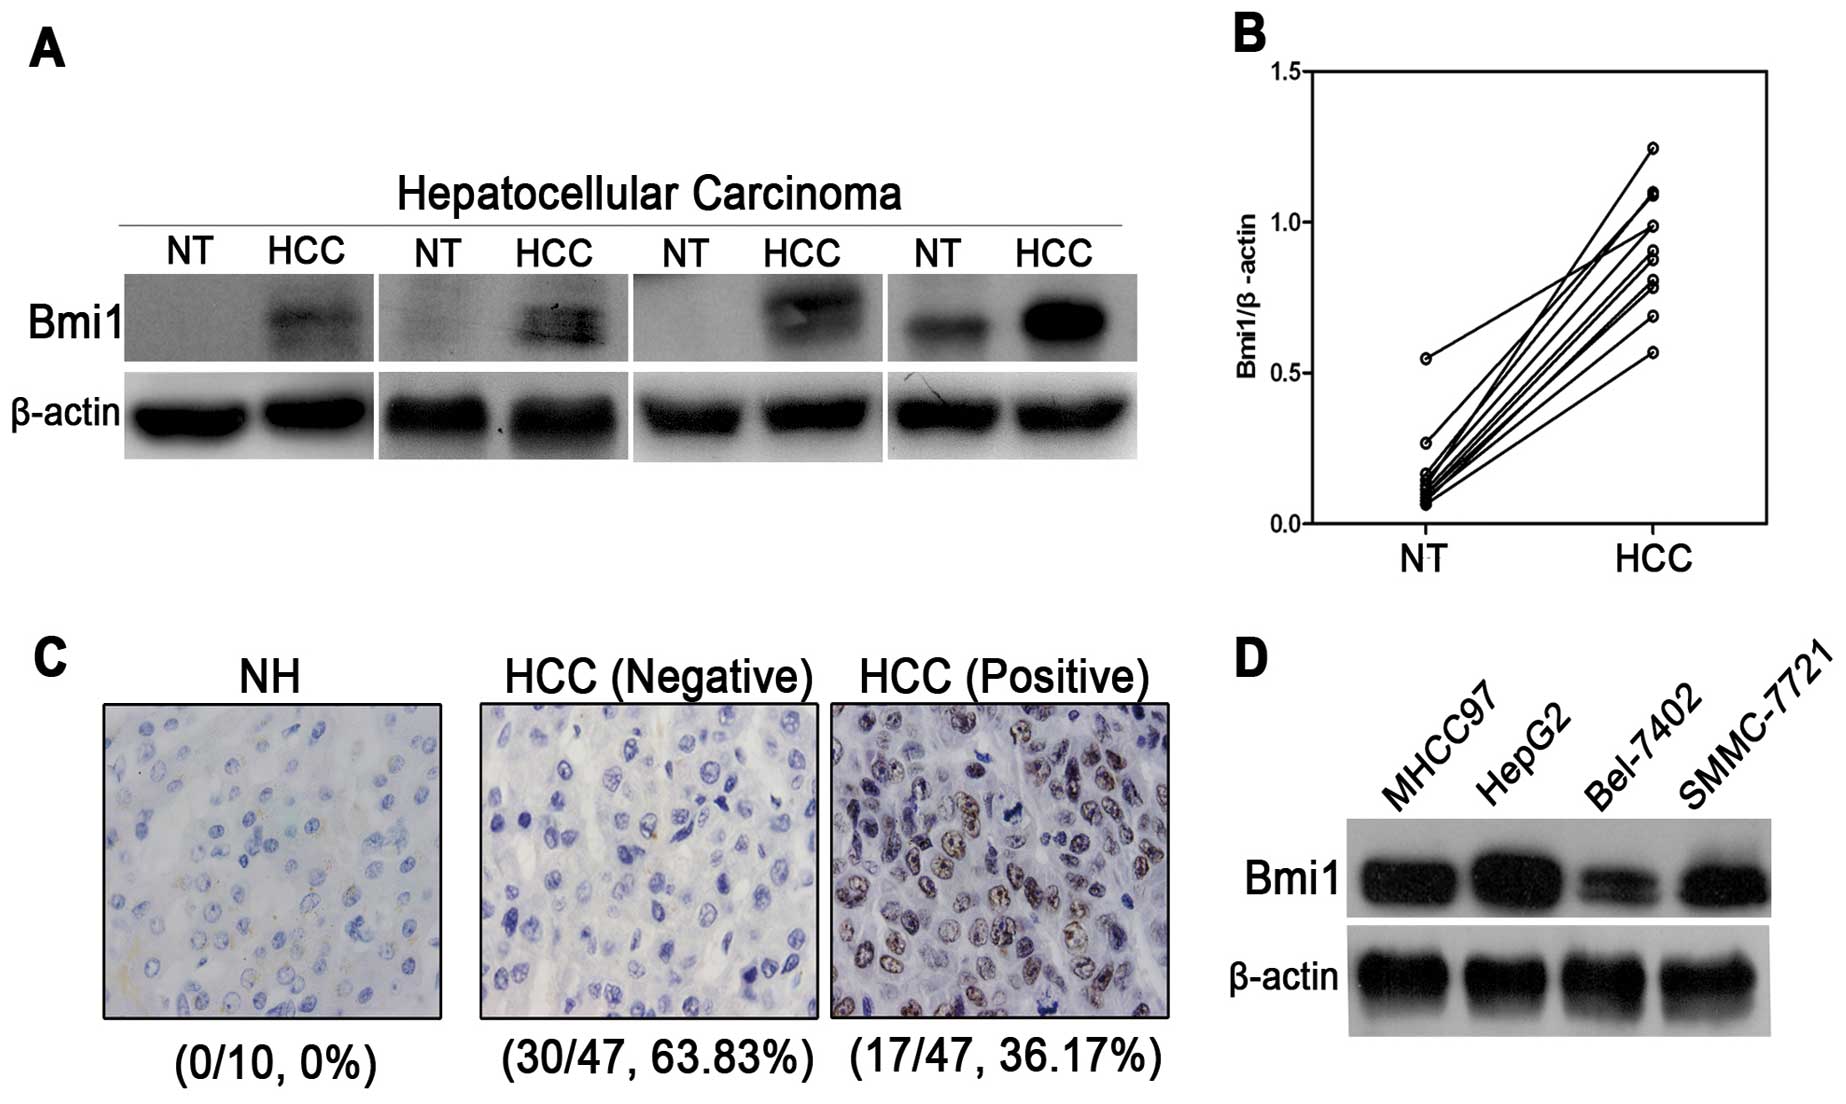
To evaluate Bmi1 expression, western blot analysis
was performed using 9 pairs of HCC tissues and their corresponding
adjacent non-tumor tissues. Bmi1 expression was normalized to
β-actin expression for the semi-quantification analyses. As shown
in Fig. 1A and B, Bmi1 expression
was significantly higher in all 9 of the cancer tissues than in the
matched non-tumor tissues (P<0.001). Furthermore, to determine
whether Bmi1 overexpression was linked to the clinical progression
of HCC, 47 HCC tissues and 10 normal hepatic tissues were
characterized for Bmi1 expression by immunohistochemistry. However,
none of the 10 normal tissues were found to be positive for Bmi1,
whereas Bmi1 expression was detected in 17 of the 47 cases of HCC
(36.17%) (Fig. 1C). In addition,
there was no significant correlation between Bmi1 expression and
clinicopathological features (Table
I). Bmi1 expression in 4 HCC cell lines was detected using
western blot analysis (Fig. 1D).
Bmi1 showed a high level of expression in the HepG2 and MHCC97 cell
lines. Taken together, the western blot and IHC semi-quantitative
analyses consistently support the notion that Bmi1 upregulation is
required for hepatocellular carcinogenesis, indicating that Bmi1
may function as an oncogene in HCC.
 | Table I.Summary of Bmi1 immunohistochemistry
staining in hepatocellular carcinoma. |
Table I.
Summary of Bmi1 immunohistochemistry
staining in hepatocellular carcinoma.
| | Bmi1
| |
|---|
|
Characteristics | No. | Negative | Positive | P-value |
|---|
| Age/year | | | | |
| ≤45 | 18 | 10 | 8 | 0.352 |
| >45 | 29 | 20 | 9 | |
| Histological
grade | | | | |
|
Well-moderate | 39 | 26 | 13 | 0.371 |
| Poor | 8 | 4 | 4 | |
| Extrahepatic
metastasis | | | | |
| Absence | 15 | 7 | 8 | 0.094 |
| Present | 32 | 23 | 9 | |
| Tumor size | | | | |
| ≤50 mm | 19 | 14 | 5 | 0.247 |
| >50 mm | 28 | 16 | 12 | |
| Gender | | | | |
| Male | 38 | 26 | 12 | 0.178 |
| Female | 9 | 4 | 5 | |
Bmi1 knockdown inhibits the proliferation
and tumorsphere formation of HCC cells
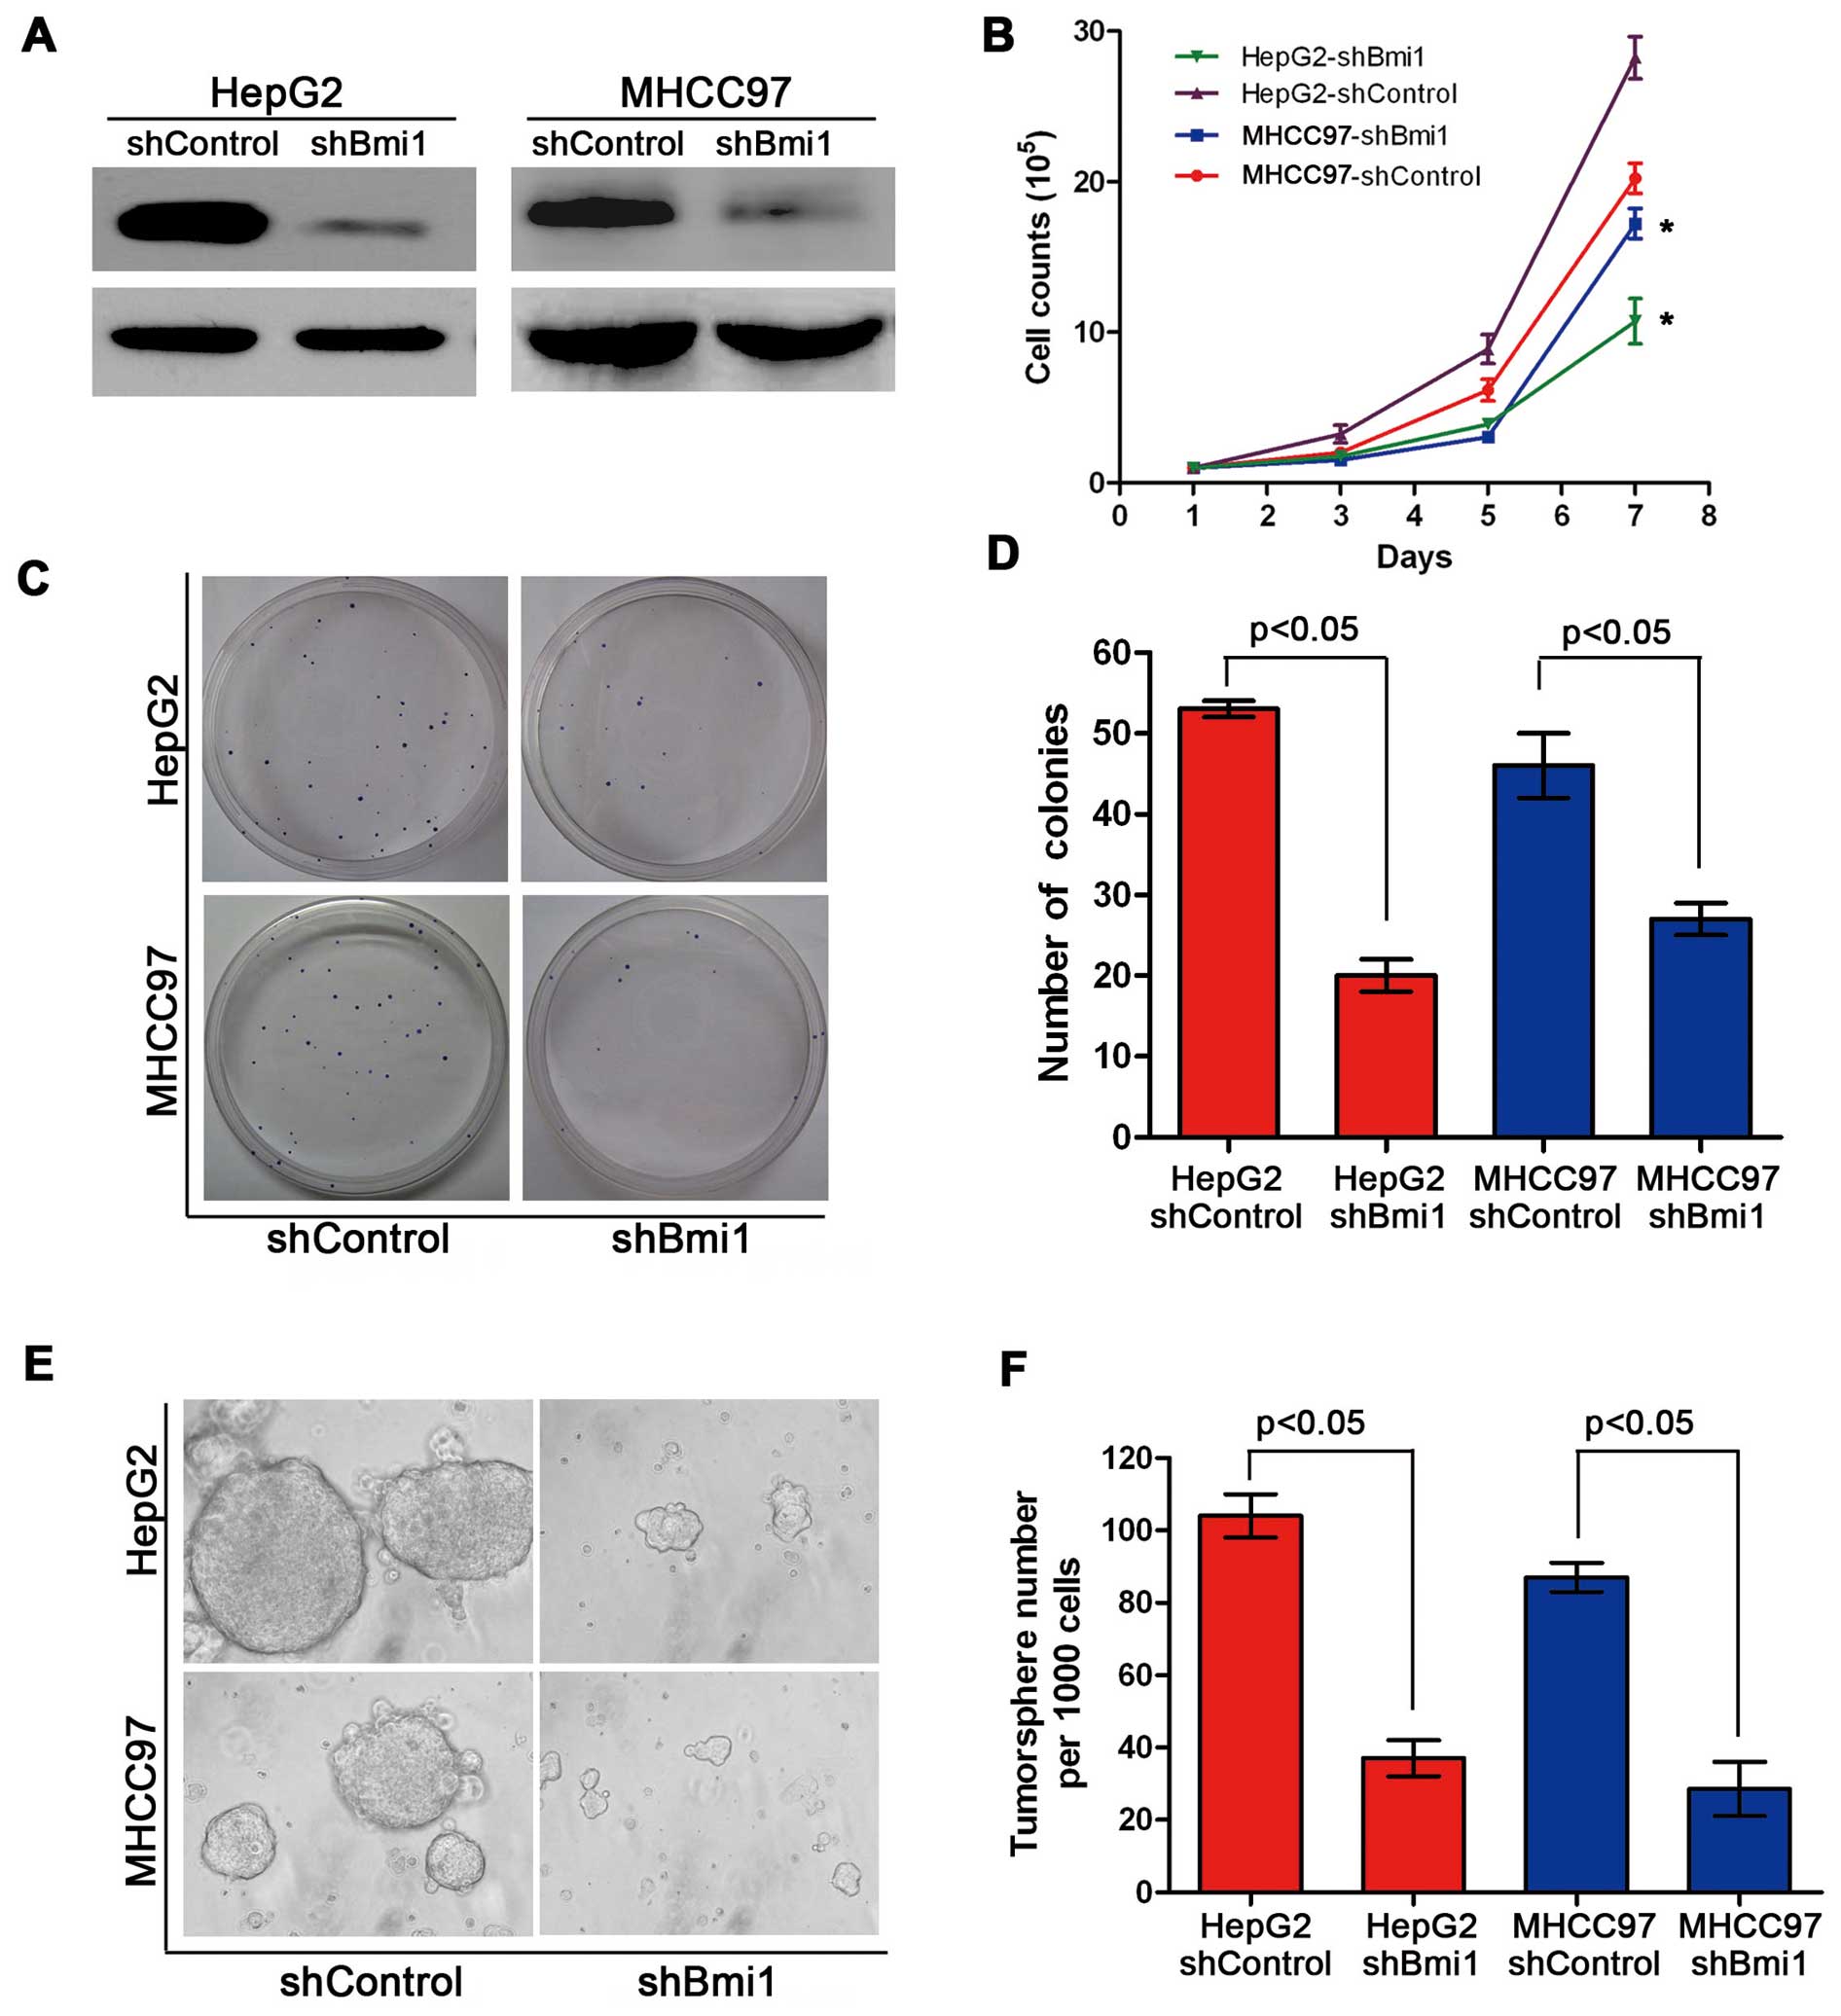
To explore the role of Bmi1 in the development of
HCC, we introduced shRNAs to suppress Bmi1 gene expression in HepG2
and MHCC97 cells (Fig. 2A); we
also wished to examine how Bmi1 modulates the proliferation of HCC
cells. The HepG2 and MHCC97 cells in which Bmi1 was knocked down
(HepG2-shBmi1 and MHCC97-shBmi1) presented significantly lower
proliferation rates than the HepG2-shControl and MHCC97-shControl
cells. These results showed that the knockdown of Bmi1 expression
significantly inhibited the in vitro proliferation of HCC
cells (Fig. 2B). The clone
formation assay showed that the Bmi1 knockdown cells formed fewer
clones on the plates than the controls (P<0.05) (Fig. 2C and D), suggesting that the
knockdown of Bmi1 expression significantly inhibited the in
vitro proliferation of HCC cells. Recently, a number of studies
have indicated the existence of CSCs in HCC, cells that are
critical for the maintenance of tumor growth, progression and
metastasis (22,23). It has been demonstrated that Bmi1
regulates the proliferation and differentiation of CSCs in other
types of cancer in addition to HCC stem cell formation. We used a
tumorsphere culture system to investigate the potential role of
Bmi1 in tumorsphere formation. Fig.
2E illustrates that the knockdown of Bmi1 expression inhibited
tumorsphere formation and growth, as evidenced by the significantly
reduced numbers of tumorspheres compared with the numbers in the
control cells (P<0.05). Our findings indicate that Bmi1 is a
critical regulator of cell proliferation in HCC and
tumorsphere-forming CSCs.
Bmi1 knockdown blocks the cell cycle
transition from the G0/G1 to the S phase
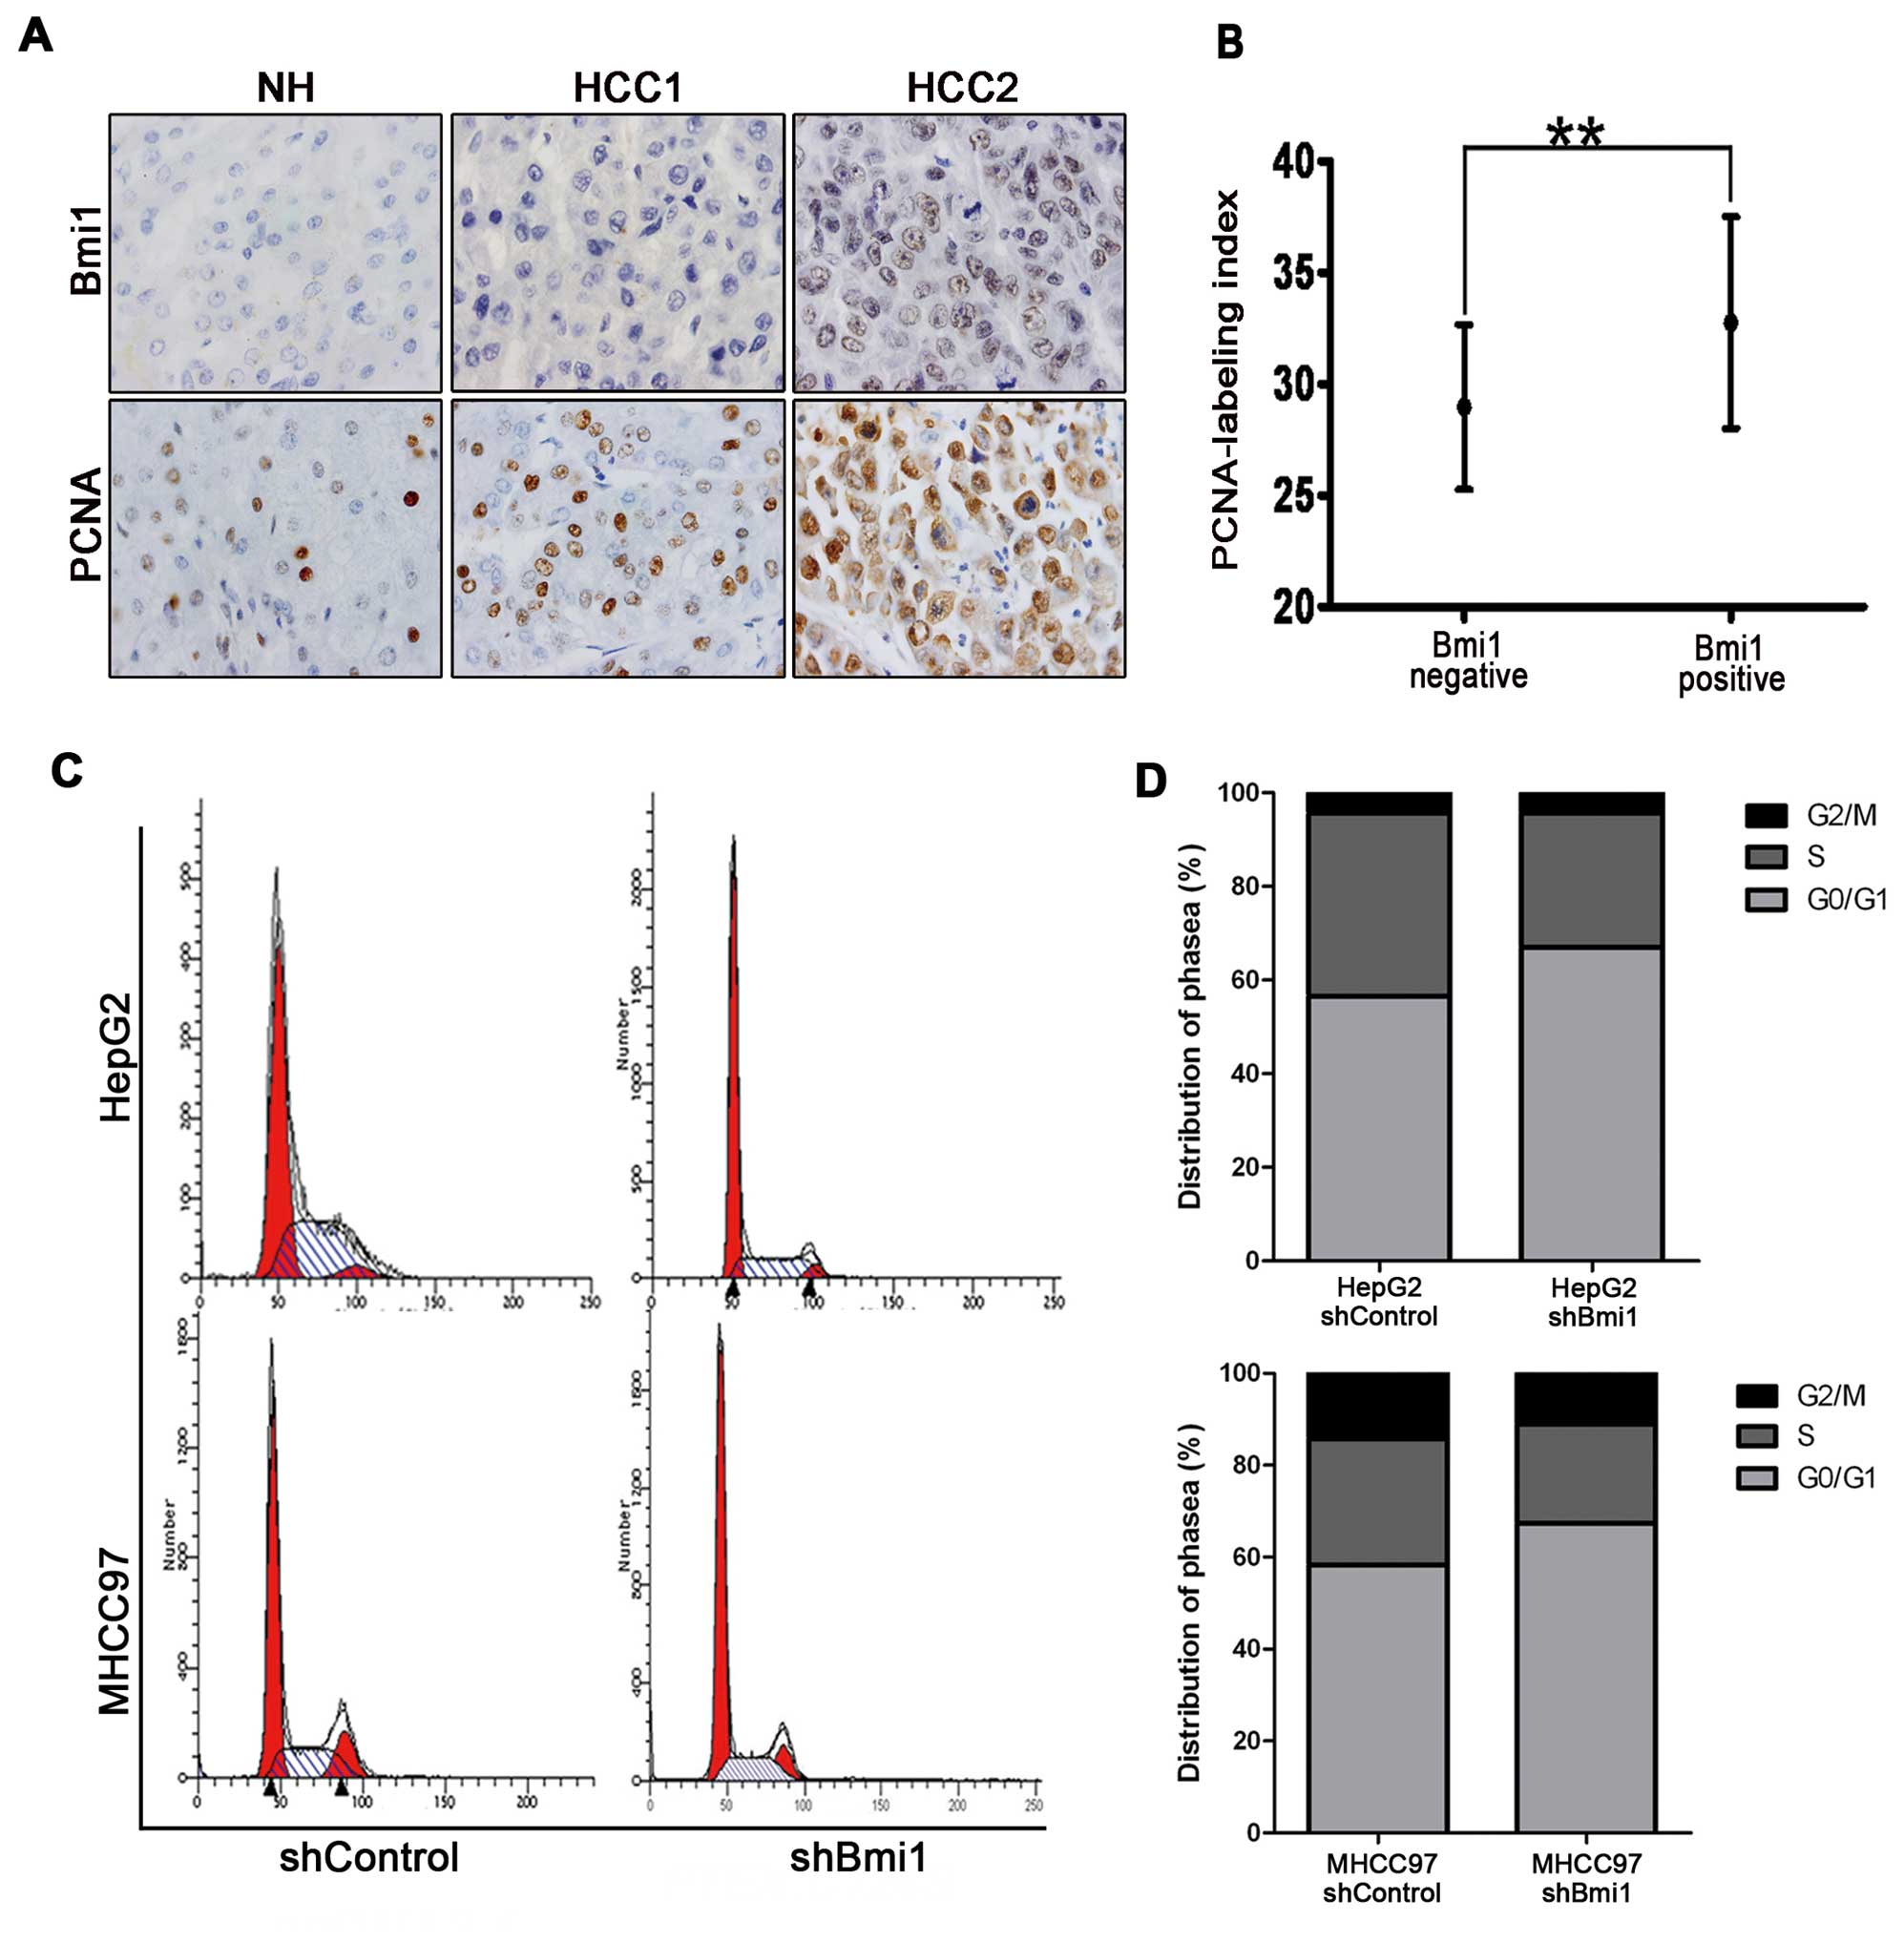
To determine whether Bmi1 is involved in the
abnormal proliferation of HCC, we examined PCNA staining in HCC
pathological specimens. The PCNA labeling index (PCNA-LI) was the
cell proliferation index, and we examined the correlation between
Bmi1 staining and cell proliferation activity in HCC tissues. The
results showed increased cell proliferation activity in the tissues
with higher Bmi1 expression (32.76±4.75 vs. 28.97±3.71%, Fig. 1A and B). Changes in cell
proliferation are typically associated with cell cycle modulation,
and Bmi1 has been reported to promote the proliferation of a
cervical cancer cell line by accelerating the cell cycle. To
investigate the mechanisms by which Bmi1 regulates HCC cell
proliferation, the cell cycle was investigated using flow cytometry
after Bmi1 knockdown using shRNA. As shown in Fig. 3C, the percentage of HepG2-shControl
cells in the G0/G1 phase was significantly greater (71.52%) than
that of HepG2-shBmi1 cells (67.34%). A similar trend was observed
for the MHCC97-shControl cells (66.95%) and MHCC97-shBmi1 cells
(56.63%), suggesting that the Bmi1 knockdown led to cell cycle
arrest (Fig. 3D). Furthermore,
there were no significant differences in cell apoptosis between the
HepG2-shBmi1- and HepG2-control-transfected cells (data not shown),
indicating that silencing Bmi1 inhibited tumorigenicity and was a
result of the arrested cell cycle transition and not cell
apoptosis.
Bmi1 knockdown inhibits the tumor
formation of HCC cells in vivo
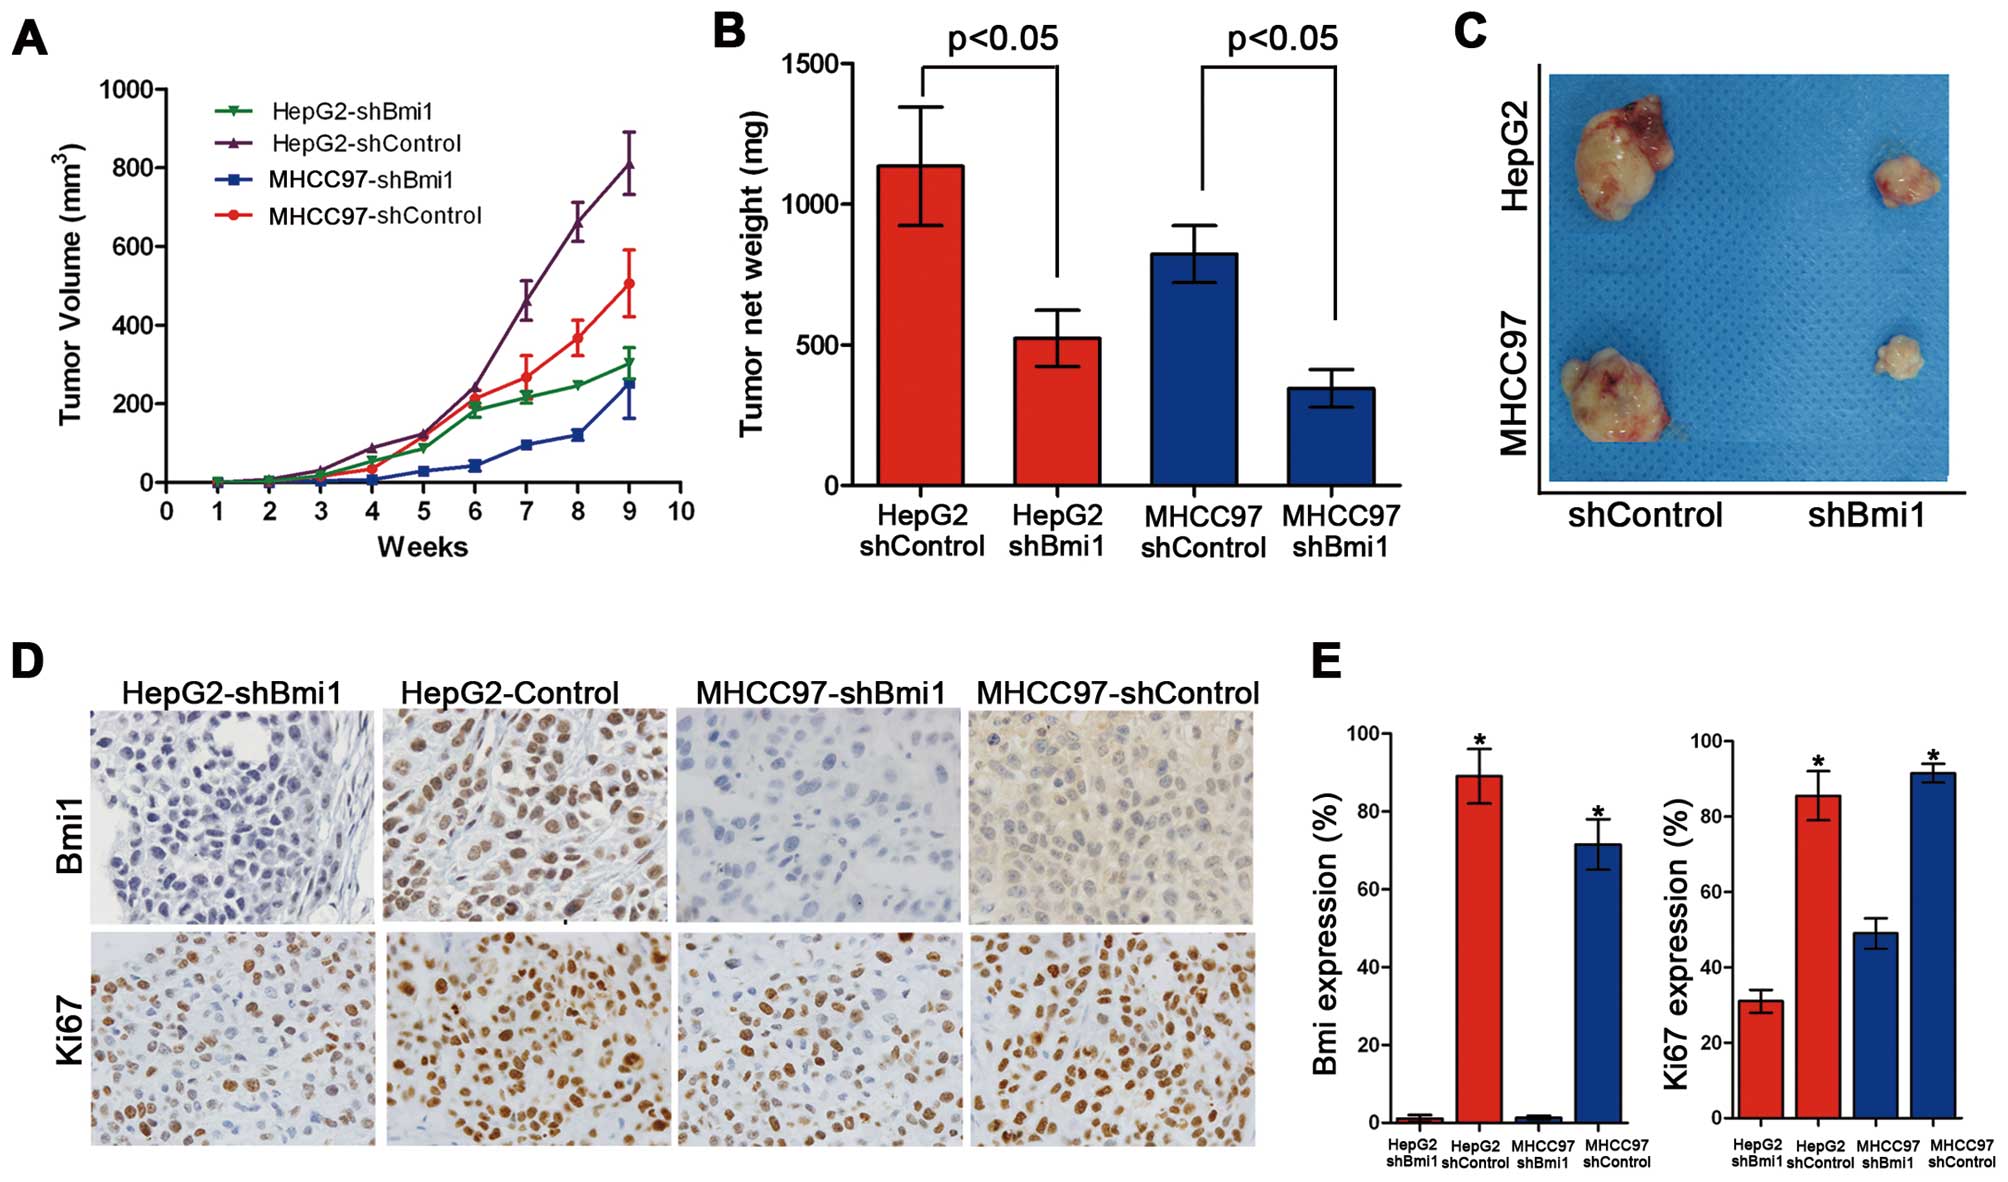
To validate the role of Bmi1 in tumor formation
in vivo further, xenograft assays were performed by
injecting Bmi1-silenced HCC cells and control cells into nude mice.
Although the HepG2-shControl and HepG2-shBmi1 cells induced
palpable tumors by 8 weeks after the injection, the HepG2-shBmi1
cells developed smaller tumors, with an average size of 678
mm3 and an average net weight of 0.77 g, than those
derived from the HepG2-shControl cells (1,492 mm3/1.24
g, Fig. 4A–C). Similar data were
obtained from the MHCC97-shControl and MHCC97-shBmi1 cells.
Collectively, these data demonstrate that the knockdown of Bmi1
inhibits cell proliferation and tumorigenicity in vivo.
We then examined the expression of the Bmi1 and Ki67
proteins by immunohistochemistry in all the xenograft tumor tissues
formed by the HepG2-shControl, HepG2-shBmi1, MHCC97-shControl and
MHCC97-shBmi1 cells (Fig. 4D). The
tumor tissues formed by HepG2-shBmi1 expressed lower levels of Ki67
and Bmi1 than those formed by the HepG2-shControl cells (Fig. 4E). Similar results were obtained
for the MHCC97-shControl and MHCC97-shBmi1 cells. These results
demonstrate that Bmi1 promotes tumor formation and the development
of HCC through accelerated cell proliferation.
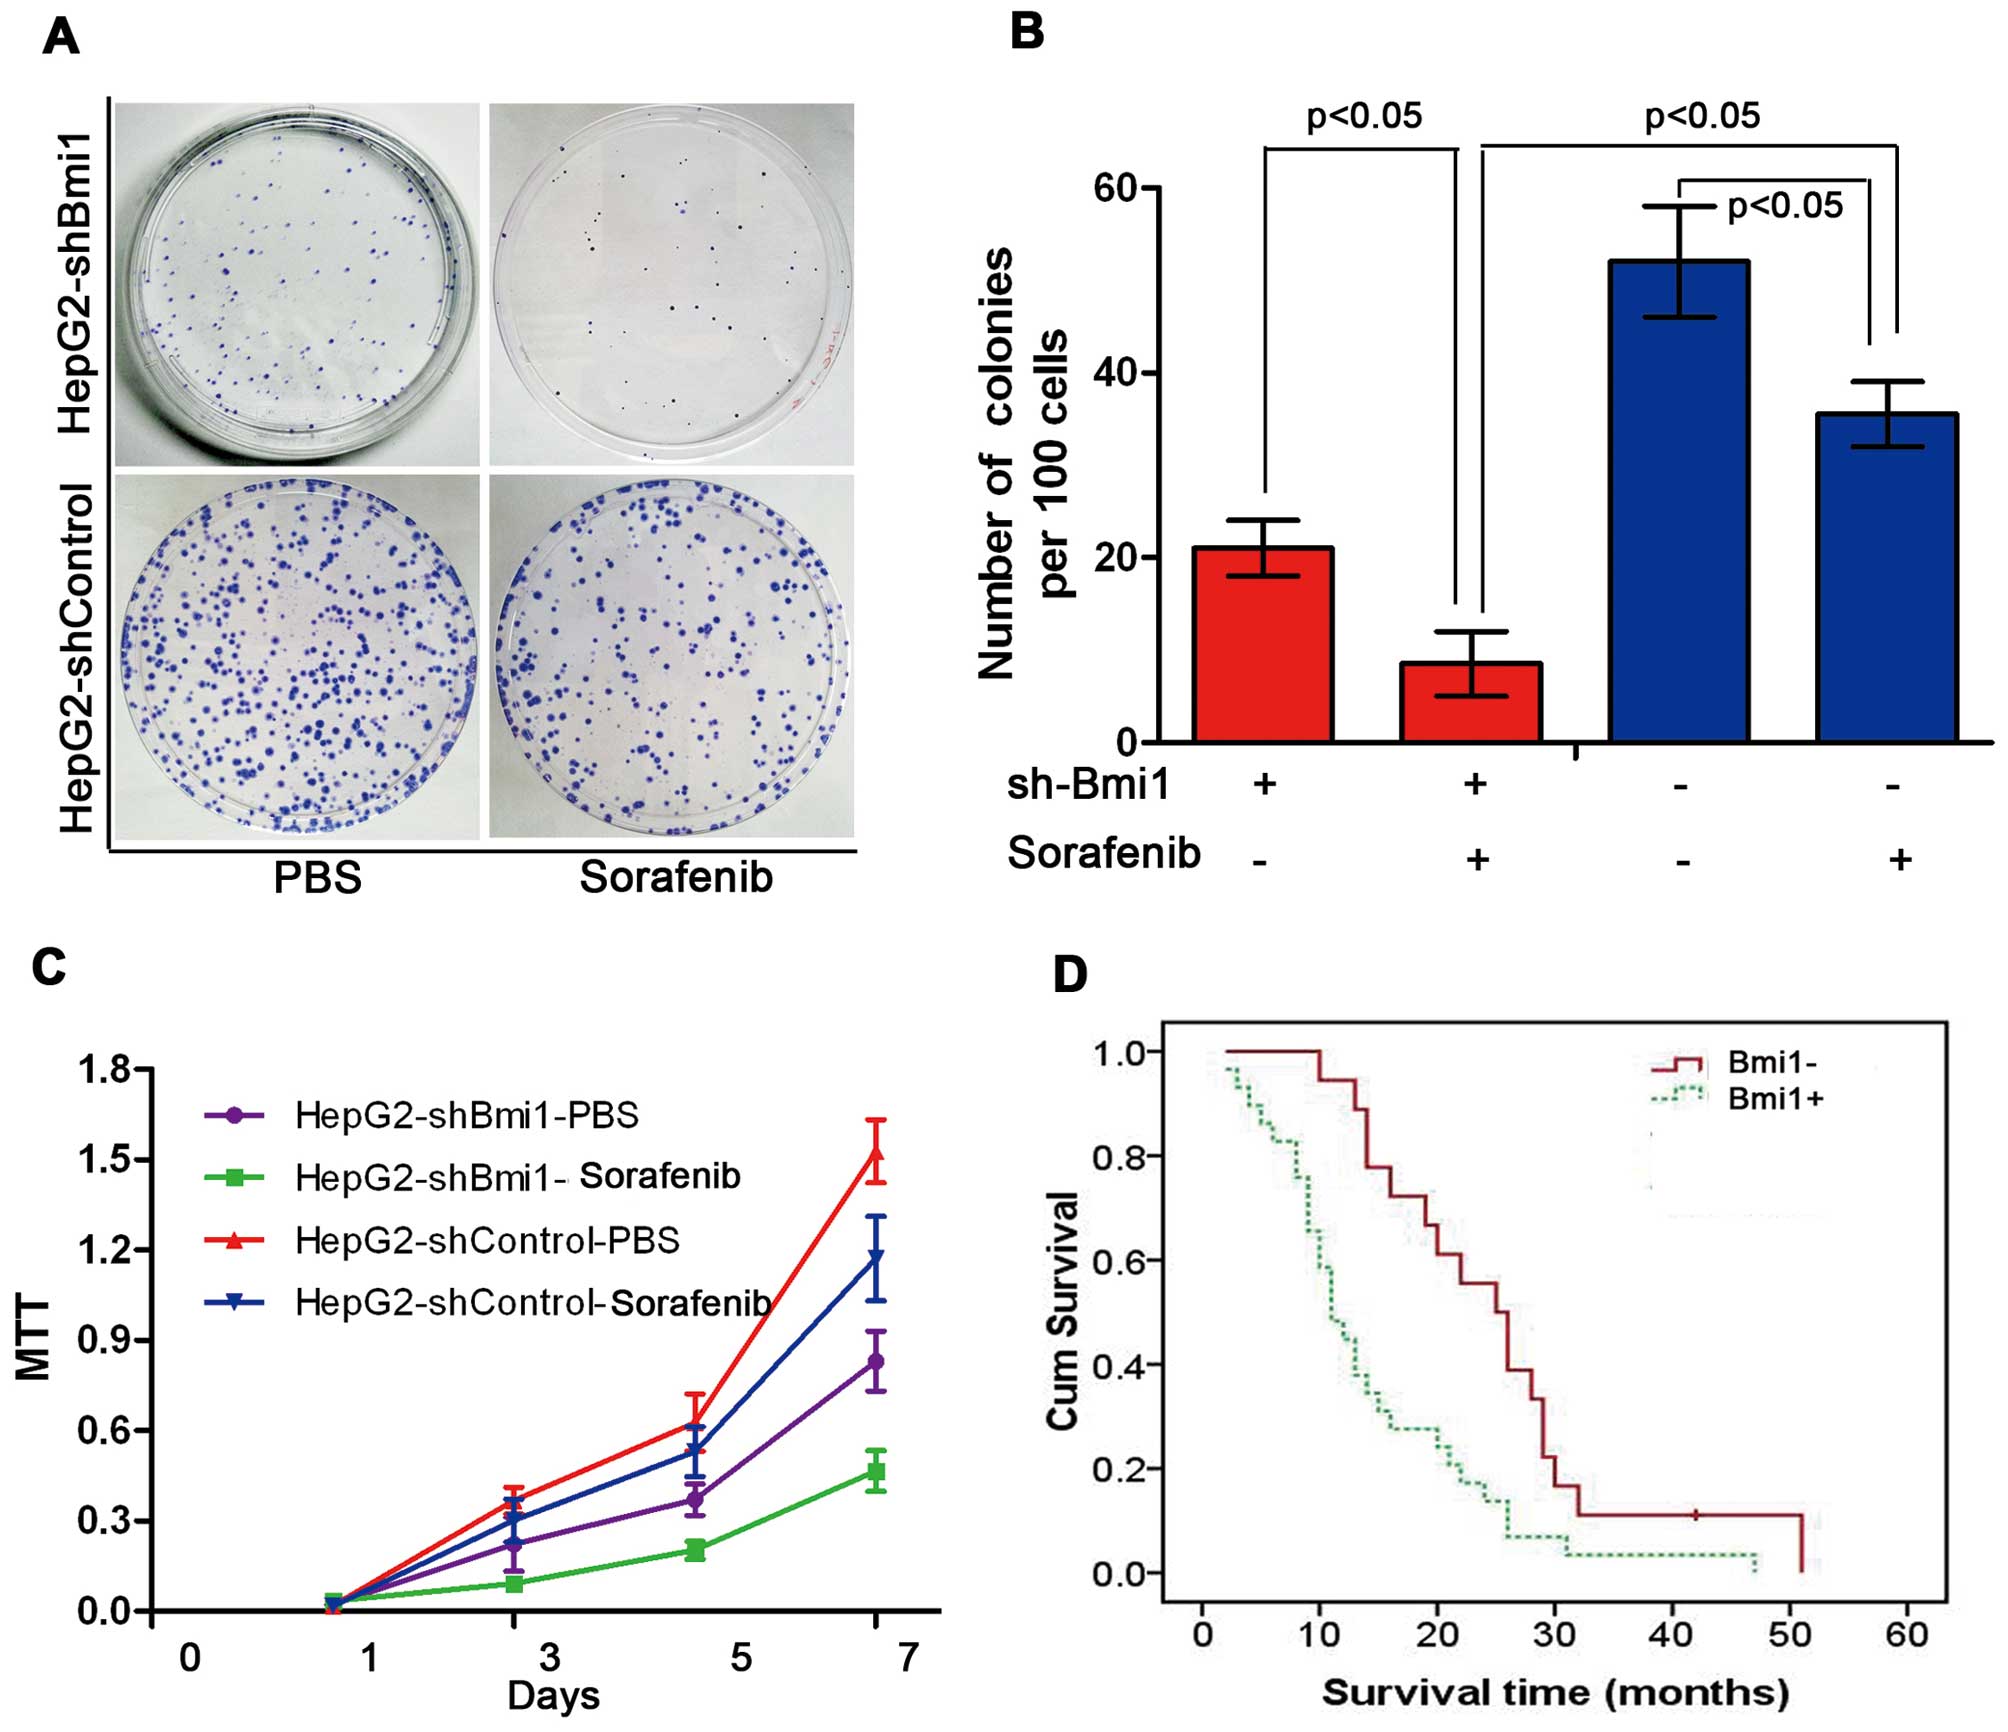
Bmi1 knockdown enhances the sensitivity
of human HCC cells to sorafenib
Sorafenib is currently the most promising molecular
targeted drug for human HCC. To investigate whether Bmi1 affects
the sensitivity of HCC cells to sorafenib, we treated HepG2-shBmi1
cells and HepG2-shControl cells with sorafenib at various
concentrations. In this figure, the results display the effects of
sorafenib at a concentration of 5 μM. As shown in Fig. 5A and B, the number of colonies
formed by the HepG2-shBmi1 cells was lower than that formed by the
HepG2-shControl cells. In addition to forming the least number of
colonies, the HepG2-shBmi1 cells, with or without sorafenib, all
showed a significantly lower proliferation rate than the control
cells throughout the experimental period, as measured by cell
viability assay (MTT assay) (P<0.05; Fig. 5C). We also observed that patients
(n=47) who showed negative Bmi1 expression had longer survival
times, as revealed by a Kaplan-Meier analysis (P<0.05; Fig. 5D).
Discussion
Bmi1 is widely expressed in a variety of human
tumors, including medulloblastomas (24), non-small cell lung (25), breast (26), prostate (27) and bladder cancer (28). Microarray analyses of multiple
types of cancer have also indicated that Bmi1 is a predictor of
metastasis and poor survival (29). In this study, we examined the
expression of Bmi1 in HCC, non-tumor liver tissues and normal liver
tissues, and observed that Bmi1 was overexpressed in HCC. To
determine the role of Bmi1 in the growth of HCC, we established
stable Bmi1-knockdown cells in the HepG2 and MHCC97 cell lines by
inducing the expression of an shRNA that targeted Bmi1-specific
mRNA in Balb/c-nude mice. We found that the knockdown of Bmi1
expression inhibited cell growth and colony formation by inducing
cell cycle arrest in the G0/G1 phase. We also observed that the
knockdown of Bmi1 expression attenuated the development and growth
of the implanted HCC cells. These observations demonsrtate that
Bmi1 promotes HCC cell tumor formation by accelerating cell growth.
Our results are in agreement with those from previous reports
showing that Bmi1 knockdown inhibits cell growth and reduces
metastasis in various types of cancer (17,30,31).
Ample evidence exists demonstrating the correlation
between Bmi1 expression and the self-renewal and pluripotency
maintenance of both normal and CSCs (18,32,33).
Bmi1 has been reported to be highly expressed in CD133+
murine liver CSCs and to play a role in the maintenance of hepatic
stem progenitor cells (18). This
finding is of great interest as the knockdown of Bmi1 expression
decreases the tumorsphere formation ability under the sphere
culture condition that allows the proliferation of only CSCs and
progenitor cells. Previous studies have shown that Bmi1 controls
self-renewal and the cell cycle by regulating the tumor suppressor
proteins, p16INK4a and p14ARF, in cells (34,35).
In the present study, we found that Bmi1 knockdown induced cell
cycle arrest at the cellular level. Therefore, Bmi1 may regulate
the growth of HCC by promoting the proliferation of both CSCs and
cancer cells. Furthermore, it would be of interest to examine the
reliable surface markers of HCC CSCs and to investigate the role of
Bmi1 in the proliferation and differentiation of HCC CSCs.
To date, sorafenib is the first and only drug that
has been shown to be beneficial for the overall survival of
patients with HCC. Preclinical studies have shown that sorafenib
potently decreases HCC proliferation. Animal studies as well as
clinical trials have shown that the co-administration of
therapeutic agents should be more beneficial than monotherapies
(36,37). Experiments in vivo and in
vitro have clearly established that Bmi1 is an oncogene that
plays critical roles in promoting CSC self-renewal and
tumorigenesis in HCC. We also assessed the sensitivity of
HepG2-shBmi1 and MHCC97-shBmi1 cells to sorafenib in terms of their
proliferation. We demonstrated that sorafenib had a more potent
inhibitory effect on shBmi1 cell proliferation than that of the
shControl cells. These results demonstrate that reduced Bmi1
protein levels inhibit hepatocarcinogenesis by targeting CSCs and
providing a potential therapeutic target for the future treatment
of HCC.
In conclusion, the results from our study showed
that Bmi1 was overexpressed in HCC compared with the adjacent
non-tumor tissues, as indicated by western blot analysis and
immunohistochemical staining. The knockdown of Bmi1 in the HCC cell
lines inhibited cell growth and colony formation by arresting the
cell cycle in the G0/G1 phase. Additionally, tumorsphere formation,
representing in vitro CSC self-renewal, was also repressed.
Furthermore, Bmi1 knockdown also enhanced the sensitivity of HCC
cells to the chemotherapeutic agent sorafenib. These results
support the idea that the suppression of Bim1 expression
significantly inhibits hepatocarcinogenesis.
References
|
1.
|
Parkin DM, Bray F, Ferlay J and Pisani P:
Estimating the world cancer burden: Globocan 2000. Int J Cancer.
94:153–156. 2001. View
Article : Google Scholar : PubMed/NCBI
|
|
2.
|
Bertolini G, Roz L, Perego P, et al:
Highly tumorigenic lung cancer CD133+ cells display
stem-like features and are spared by cisplatin treatment. Proc Natl
Acad Sci USA. 106:16281–16286. 2009.PubMed/NCBI
|
|
3.
|
Bonnet D and Dick JE: Human acute myeloid
leukemia is organized as a hierarchy that originates from a
primitive hematopoietic cell. Nat Med. 3:730–737. 1997. View Article : Google Scholar : PubMed/NCBI
|
|
4.
|
Uchida N, Buck DW, He D, et al: Direct
isolation of human central nervous system stem cells. Proc Natl
Acad Sci USA. 97:14720–14725. 2000. View Article : Google Scholar : PubMed/NCBI
|
|
5.
|
Al-Hajj M, Wicha MS, Benito-Hernandez A,
Morrison SJ and Clarke MF: Prospective identification of
tumorigenic breast cancer cells. Proc Natl Acad Sci USA.
100:3983–3988. 2003. View Article : Google Scholar : PubMed/NCBI
|
|
6.
|
Ricci-Vitiani L, Lombardi DG, Pilozzi E,
et al: Identification and expansion of human
colon-cancer-initiating cells. Nature. 445:111–115. 2007.
View Article : Google Scholar : PubMed/NCBI
|
|
7.
|
Rountree CB, Ding W, He L and Stiles B:
Expansion of CD133-expressing liver cancer stem cells in
liver-specific phosphatase and tensin homolog deleted on chromosome
10-deleted mice. Stem Cells. 27:290–299. 2009. View Article : Google Scholar : PubMed/NCBI
|
|
8.
|
Van der Lugt NM, Domen J, Linders K, et
al: Posterior transformation, neurological abnormalities, and
severe hematopoietic defects in mice with a targeted deletion of
the bmi-1 protooncogene. Genes Dev. 8:757–769. 1994.
|
|
9.
|
Pirrotta V: Polycombing the genome: PcG,
trxG, and chromatin silencing. Cell. 93:333–336. 1998. View Article : Google Scholar : PubMed/NCBI
|
|
10.
|
Kranc KR, Bamforth SD, Braganca J, Norbury
C, van Lohuizen M and Bhattacharya S: Transcriptional coactivator
Cited2 induces Bmi1 and Mel18 and controls fibroblast proliferation
via Ink4a/ARF. Mol Cell Biol. 23:7658–7666. 2003. View Article : Google Scholar : PubMed/NCBI
|
|
11.
|
Saito M, Handa K, Kiyono T, et al:
Immortalization of cementoblast progenitor cells with Bmi-1 and
TERT. J Bone Miner Res. 20:50–57. 2005. View Article : Google Scholar : PubMed/NCBI
|
|
12.
|
Kim JH, Yoon SY, Kim CN, et al: The Bmi-1
oncoprotein is overexpressed in human colorectal cancer and
correlates with the reduced p16INK4a/p14ARF proteins. Cancer Lett.
203:217–224. 2004. View Article : Google Scholar : PubMed/NCBI
|
|
13.
|
Sasaki M, Ikeda H, Itatsu K, et al: The
overexpression of polycomb group proteins Bmi1 and EZH2 is
associated with the progression and aggressive biological behavior
of hepatocellular carcinoma. Lab Invest. 88:873–882. 2008.
View Article : Google Scholar : PubMed/NCBI
|
|
14.
|
Vrzalikova K, Skarda J, Ehrmann J, et al:
Prognostic value of Bmi-1 oncoprotein expression in NSCLC patients:
a tissue microarray study. J Cancer Res Clin Oncol. 134:1037–1042.
2008. View Article : Google Scholar : PubMed/NCBI
|
|
15.
|
Park IK, Qian D, Kiel M, et al: Bmi-1 is
required for maintenance of adult self-renewing haematopoietic stem
cells. Nature. 423:302–305. 2003. View Article : Google Scholar : PubMed/NCBI
|
|
16.
|
Lessard J and Sauvageau G: Bmi-1
determines the proliferative capacity of normal and leukaemic stem
cells. Nature. 423:255–260. 2003. View Article : Google Scholar : PubMed/NCBI
|
|
17.
|
Liu S, Dontu G, Mantle ID, et al: Hedgehog
signaling and Bmi-1 regulate self-renewal of normal and malignant
human mammary stem cells. Cancer Res. 66:6063–6071. 2006.
View Article : Google Scholar : PubMed/NCBI
|
|
18.
|
Chiba T, Seki A, Aoki R, et al: Bmi1
promotes hepatic stem cell expansion and tumorigenicity in both
Ink4a/Arf-dependent and -independent manners in mice. Hepatology.
52:1111–1123. 2010. View Article : Google Scholar : PubMed/NCBI
|
|
19.
|
Glinsky GV: Stem cell origin of
death-from-cancer phenotypes of human prostate and breast cancers.
Stem Cell Rev. 3:79–93. 2007. View Article : Google Scholar : PubMed/NCBI
|
|
20.
|
Wang H, Pan K, Zhang HK, et al: Increased
polycomb-group oncogene Bmi-1 expression correlates with poor
prognosis in hepatocellular carcinoma. J Cancer Res Clin Oncol.
134:535–541. 2008. View Article : Google Scholar : PubMed/NCBI
|
|
21.
|
Zhang Y, Li B, Ji ZZ and Zheng PS: Notch1
regulates the growth of human colon cancers. Cancer. 116:5207–5218.
2010. View Article : Google Scholar : PubMed/NCBI
|
|
22.
|
Tomuleasa C, Soritau O, Rus-Ciuca D, et
al: Isolation and characterization of hepatic cancer cells with
stem-like properties from hepatocellular carcinoma. J
Gastrointestin Liver Dis. 19:61–67. 2010.PubMed/NCBI
|
|
23.
|
Zhu Z, Hao X, Yan MX, et al: Cancer
stem/progenitor cells are highly enriched in CD133+CD44+ population
in hepatocellular carcinoma. Int J Cancer. 126:2067–2078. 2010.
|
|
24.
|
Leung C, Lingbeek M, Shakhova O, et al:
Bmi1 is essential for cerebellar development and is overexpressed
in human medulloblastomas. Nature. 428:337–341. 2004. View Article : Google Scholar : PubMed/NCBI
|
|
25.
|
Vonlanthen S, Heighway J, Altermatt HJ, et
al: The bmi-1 oncoprotein is differentially expressed in non-small
cell lung cancer and correlates with INK4A-ARF locus expression. Br
J Cancer. 84:1372–1376. 2001. View Article : Google Scholar : PubMed/NCBI
|
|
26.
|
Kim JH, Yoon SY, Jeong SH, et al:
Overexpression of Bmi-1 oncoprotein correlates with axillary lymph
node metastases in invasive ductal breast cancer. Breast.
13:383–388. 2004. View Article : Google Scholar : PubMed/NCBI
|
|
27.
|
Berezovska OP, Glinskii AB, Yang Z, Li XM,
Hoffman RM and Glinsky GV: Essential role for activation of the
Polycomb group (PcG) protein chromatin silencing pathway in
metastatic prostate cancer. Cell Cycle. 5:1886–1901. 2006.
View Article : Google Scholar : PubMed/NCBI
|
|
28.
|
Qin ZK, Yang JA, Ye YL, et al: Expression
of Bmi-1 is a prognostic marker in bladder cancer. BMC Cancer.
9:612009. View Article : Google Scholar : PubMed/NCBI
|
|
29.
|
Glinsky GV, Berezovska O and Glinskii AB:
Microarray analysis identifies a death-from-cancer signature
predicting therapy failure in patients with multiple types of
cancer. J Clin Invest. 115:1503–1521. 2005. View Article : Google Scholar : PubMed/NCBI
|
|
30.
|
Chiba T, Miyagi S, Saraya A, et al: The
polycomb gene product BMI1 contributes to the maintenance of
tumor-initiating side population cells in hepatocellular carcinoma.
Cancer Res. 68:7742–7749. 2008. View Article : Google Scholar : PubMed/NCBI
|
|
31.
|
Cui H, Hu B, Li T, et al: Bmi-1 is
essential for the tumorigenicity of neuroblastoma cells. Am J
Pathol. 170:1370–1378. 2007. View Article : Google Scholar : PubMed/NCBI
|
|
32.
|
Bruggeman SW, Hulsman D, Tanger E, et al:
Bmi1 controls tumor development in an Ink4a/Arf-independent manner
in a mouse model for glioma. Cancer Cell. 12:328–341. 2007.
View Article : Google Scholar : PubMed/NCBI
|
|
33.
|
Yu CC, Lo WL, Chen YW, et al: Bmi-1
regulates Snail expression and promotes metastasis ability in head
and neck squamous cancer-derived ALDH1 positive cells. J Oncol.
2011:pii:. 6092592011.PubMed/NCBI
|
|
34.
|
Park IK, Morrison SJ and Clarke MF: Bmi1,
stem cells, and senescence regulation. J Clin Invest. 113:175–179.
2004. View Article : Google Scholar : PubMed/NCBI
|
|
35.
|
Dimri GP, Martinez JL, Jacobs JJ, et al:
The Bmi-1 oncogene induces telomerase activity and immortalizes
human mammary epithelial cells. Cancer Res. 62:4736–4745.
2002.PubMed/NCBI
|
|
36.
|
Jane EP, Premkumar DR and Pollack IF:
Coadministration of sorafenib with rottlerin potently inhibits cell
proliferation and migration in human malignant glioma cells. J
Pharmacol Exp Ther. 319:1070–1080. 2006. View Article : Google Scholar : PubMed/NCBI
|
|
37.
|
Yu C, Friday BB, Lai JP, et al: Cytotoxic
synergy between the multikinase inhibitor sorafenib and the
proteasome inhibitor bortezomib in vitro: induction of apoptosis
through Akt and c-Jun NH2-terminal kinase pathways. Mol Cancer
Ther. 5:2378–2387. 2006. View Article : Google Scholar
|