Introduction
Gastric cancer is one of the most common types of
solid tumors worldwide and is the second highest cause of
cancer-related deaths despite recent decreases in its incidence and
mortality rates (1). Despite
curative resection treatments, patients with gastric cancer who are
diagnosed with advanced disease display poor prognoses (2). Several clinical studies regarding the
use of adjuvant cytotoxic or radiation therapies following curative
resection for the treatment of advanced gastric cancer have
demonstrated that these procedures may be performed to increase
patient survival (3,4). However, patients with advanced-stage
disease also demonstrate a high frequency of recurrence despite
adjuvant treatment, and treatment outcomes can vary widely. Recent
molecular cancer research advances have led to the development of
new agents that target cancer-specific molecules, including those
related to cancer progression or prognosis. In this study, we
sought to discover new therapeutic targets with expression profiles
that could be correlated with cancer progression and prognosis in
patients with gastric cancer.
In contrast to healthy cells, which utilize
oxidative phosphorylation as an energy source, malignant cells
undergo increased rates of glycolysis for energy under hypoxic and
non-hypoxic conditions (5). The
measurement of this glycolytic metabolic change in cancer cells
using 2-fluoro-2-deoxy-D-glucose positron emission tomography
(FDG-PET) has become a widely accepted diagnostic tool for
assessing various cancers including gastric cancer (6). In addition, FDG-PET has been shown to
be useful for predicting the chemotherapeutic response (7,8).
Therefore, aberrant glucose metabolism in cancers can be used as a
selective target for cancer treatment. Several therapeutic agents
targeting glycolysis have been reported to have significant cancer
cell cytotoxicity in preclinical studies, and some of these
therapeutic agents have advanced into clinical studies (9). However, the use of therapeutic agents
targeting glycolysis for the treatment of gastric cancer has not
been reported.
Several studies have reported that the expression of
glucose transporter-1 (GLUT-1), which is involved in the glycolytic
pathway, is significantly associated with disease prognosis in
gastric carcinoma (10,11). However, many additional molecules,
including pyruvate dehydrogenase kinase-1 (PDK-1), are involved in
cancer cell-associated processes including active glycolysis,
mitochondrial dysfunction and glucose uptake (5,12).
To our knowledge, the use of various molecules associated with
aberrant glucose metabolism as prognostic biomarkers has not been
investigated in gastric cancer. Moreover, the therapeutic potential
of agents targeting glycolysis for the treatment of gastric cancer
has not been evaluated. Thus, the objectives of this study were to
evaluate whether the expression of various molecules involved in
glycolysis could be correlated with the prognosis of patients with
gastric cancer and to assess the effects of treatment with a
therapeutic agent targeting glucose metabolism in gastric cancer
cell lines.
Materials and methods
Patients and tissue microarray
This study was approved by the Ajou University
Hospital Institutional Review Board (AJOU-MED-KSP-10-375). Samples
from 152 patients, who were diagnosed with gastric adenocarcinoma
and underwent curative gastrectomy and proper lymphadenectomy
between September 2006 and April 2007, were collected in paraffin
blocks and used for a tissue array. The pathological stage of these
tissue blocks after resection was investigated using the
International Union against Cancer (6th edition) classification
criteria. All of the patients enrolled in this study were
reassessed for the recurrence of gastric cancer or death every 3–6
months using computed tomography, tumor marker expression and
physical examination. Patients who were pathologically diagnosed
with stage II, III or IV cancer were recommended to receive
adjuvant chemotherapy consisting of 5-fluorouracil (5-FU) for
approximately 1 year beginning 4–6 weeks after surgery.
Hematoxylin- and eosin-stained slides from the
primary tumors of the 152 patients were reviewed by a pathologist
(Y.B. Kim). Two formalin-fixed, paraffin-embedded cores (1 mm in
diameter) were removed from the central region of the primary tumor
specimens and arranged into tissue microarray (TMA) blocks.
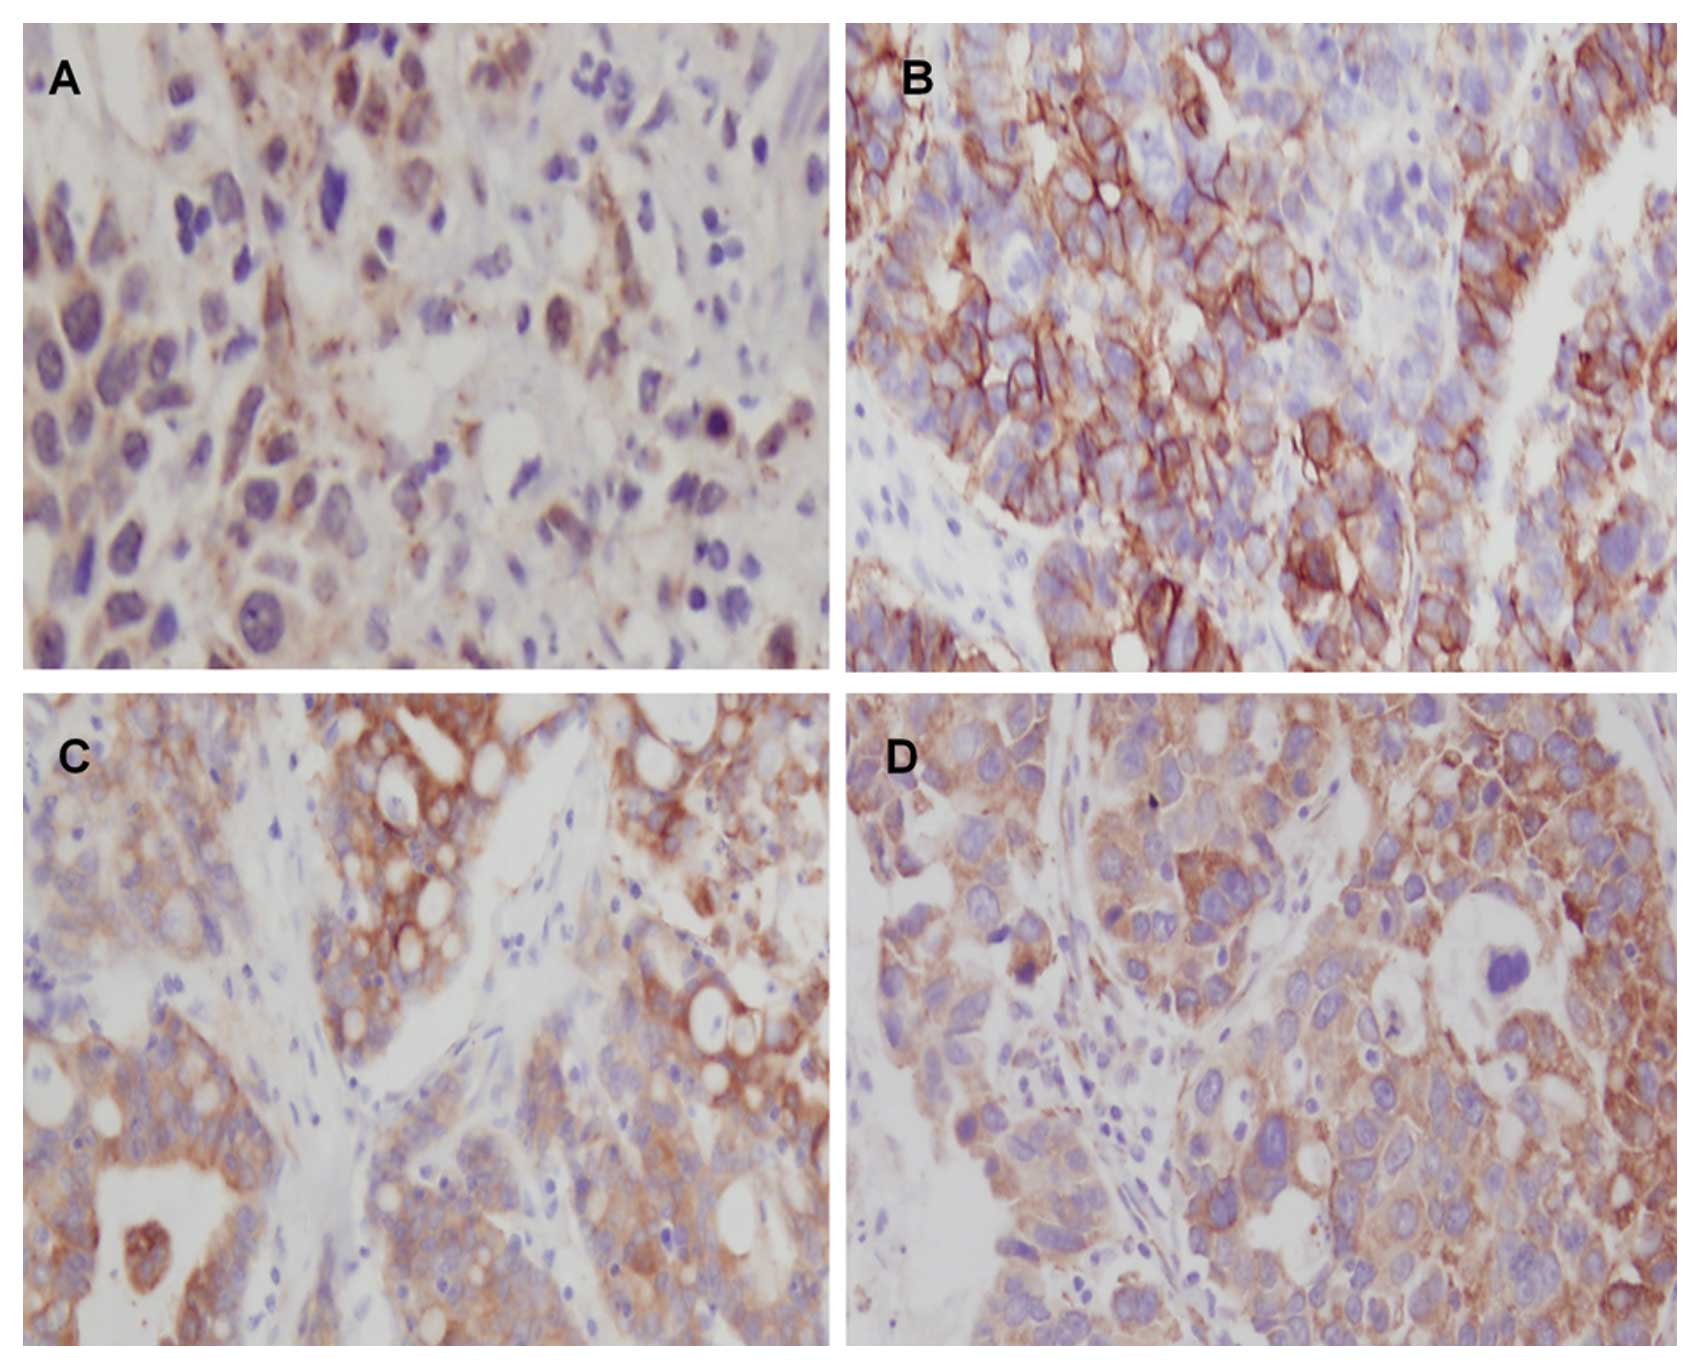
Immunohistochemical staining
Briefly, 4-mm-thick sections were cut from the TMA
blocks and deparaffinized. After immersion and blockade of
endogenous peroxidase activity, immunohistochemical staining was
performed using antibodies for hypoxia-inducible factor-1α (HIF-1α)
(1:50 dilution; Thermo Fisher Scientific, Fremont, CA), GLUT-1
(1:200 dilution; Thermo Fisher Scientific), hexokinase-2 (HK-2)
(1:50 dilution; Cell Signaling Inc., Danvers, MA, USA) and PDK-1
(1:400 dilution; Santa Cruz Biotech, Santa Cruz, CA, USA). The
HIF-1α and GLUT-1 expression patterns were determined based on the
nuclear, cytoplasmic (HIF-1α) and membrane (GLUT-1) staining. To
measure the HK-2 and PDK-1 expression, the staining results were
scored according to the number of tumor cells with positive
expression. The proportion of tumor cells demonstrating positive
staining was semi-quantitatively evaluated using the following
scoring system: negative staining (<5% positive staining); 1+
staining (5–30%); 2+ staining (30–60%); and 3+ staining (>60%).
A 2+ or 3+ expression level was considered positive expression. The
expression of all molecules was determined if both regions were
positively stained. All of the staining results were evaluated by
two pathologists who were blinded to the clinical outcomes
(Fig. 1).
Cell lines and chemotherapeutic
compound
The non-cancerous kidney cell line HEK293 and the
gastric carcinoma cell lines AGS, MKN45, SNU-216, SNU-484, SNU-601
and SNU-638 were purchased from the Korea Cell Line Bank (Seoul,
Korea). These cell lines were maintained in RPMI-1640 (Invitrogen
Corp., Carlsbad, CA, USA) containing 10% fetal bovine serum
(Equitech-Bio, Ingram, TX, USA), 100 U/ml penicillin G and 100
μg/ml streptomycin (Invitrogen). The cells were incubated at
37°C in a humidified atmosphere containing 20% O2 and 5%
CO2. 5-FU and dichloroacetate (DCA) were purchased from
Sigma-Aldrich (St. Louis, MO, USA) and dissolved in deionized water
to create 1 mol/l working solutions, which were filtered,
sterilized and subsequently diluted in growth medium prior to
treatment.
Western blotting for PDK-1
Whole-cell lysates from cultured cells were lysed in
a protein extraction solution (Intron Biotech., Sungnam, Korea).
The lysates were centrifuged at 13,000 rpm for 15 min at 4°C to
remove cellular debris. The protein concentrations were determined
using the Bradford assay (Bio-Rad Laboratories, Hercules, CA, USA).
In total, 25 μg of protein were separated by
SDS-polyacrylamide gel electrophoresis and transferred to a
nitrocellulose membrane. After blocking and incubation, the primary
antibodies used for western blot analysis, including anti-PDK-1
(1:1,000 dilution; Stressgen, Victoria, Canada) and anti-β-actin
(1:10,000 dilution; Abcam, Cambridge, MA, USA), were applied. After
incubating with the corresponding secondary antibodies, the signals
were developed using an Amersham™ ECL Plus Western Blotting
Detection System (GE Healthcare, Waukesha, WI, USA).
Cytotoxicity following dichloroacetate
and 5-FU treatment
HEK293, AGS and MKN45 gastric cancer cells were
seeded at 1×10⁵ cells per well in 96-well plates,
treated with different DCA concentrations (0, 10, 20, 30, 40 and 50
mM) and incubated for 24 h. Cell viability was measured using the
novel tetrazolium compound
3-(4,5-dimethylthiazol-2-yl)-5-(3-carboxymethoxyphenyl)-2-(4-sulfophenyl)-2H-tetrazolium,
inner salt [MTS(a)] assay kit (Promega, Madison, WI, USA). Next, 20
μl of the MTS solution was added per well, the cells were
incubated for 4 h, and the absorbance was measured by
spectrophotometry at 490 nm. Three independent experiments were
performed in triplicate.
To evaluate the synergic effects of DCA and 5-FU
treatment, cells were treated with 5-FU (0–1,600 μM) alone or in
combination with DCA (20 mM) and incubated for 24 h. The cell
viability was measured using the same method described above.
Glucose uptake assay
The glucose uptake assay was performed as previously
described with modifications (13). Briefly, cells were seeded at
1×10⁶ cells per well in a 6-well culture plate and
treated with DCA as described for the cytotoxicity assay. Following
24-h DCA treatment, the supernatant was discarded, and the cells
were washed in a glucose-free medium. The glucose uptake level
(without/with DCA treatment) was measured for each cell line using
the Amplex Red Glucose/Glucose Oxidase Assay Kit (Invitrogen),
according to the manufacturer’s instructions.
Lactate production assay
After the cells were treated, the culture medium was
removed and placed in another plate, and the cell number was
calculated. Lactate assay components (Abcam) were then added to the
removed culture medium, and the lactate levels were measured by
spectrophotometry at 450 nm. The lactate concentration was
normalized to the sample cell number.
Statistical analysis
Statistical analysis was performed using the SPSS
software, version 13.0. Correlations between the expression of each
molecule and the clinicopathologic factors were evaluated using the
χ2 test. Univariate analysis for the disease-free and
overall survival rates and survival curve generation was performed
using the log-rank test and the Kaplan-Meier method, respectively.
A Cox proportional hazards model was used for the multivariate
analysis to determine the prognosis-predicting factors. The
difference in the mean values between two continuous variables was
evaluated using Student’s t-test. Comparisons involving three
variables were analyzed using a one-way ANOVA with the Scheffe
post hoc comparison.
Results
Patient characteristics
The mean age of the patients was 55.8±13.6 years,
and there were more male patients (63.2%) than female patients.
Adjuvant chemotherapy was provided for 97 patients; of these
patients, single-agent 5-FU was orally administered to 78 patients.
The other patient characteristics are listed in Table I.
 | Table I.The characteristics of the 152
patients enrolled in this study. |
Table I.
The characteristics of the 152
patients enrolled in this study.
| Characteristics | No. | Percentage (%) |
|---|
| Age | | |
| <65 | 99 | 65.1 |
| ≥65 | 53 | 34.9 |
| Gender | | |
| Male | 96 | 63.2 |
| Female | 56 | 36.8 |
| Approach | | |
| Open | 109 | 71.7 |
| Laparoscopy | 43 | 28.3 |
| Resection | | |
| Total
gastrectomy | 36 | 23.7 |
| Subtotal
gastrectomy | 116 | 76.4 |
| Reconstruction | | |
| Billroth-I | 79 | 52.0 |
| Billroth-II | 39 | 25.7 |
| Roux en Y | 34 | 22.3 |
| LN dissection | | |
| D1+ | 68 | 44.7 |
| D2 | 84 | 55.3 |
| Combined
resection | | |
| Yes | 23 | 15.1 |
| None | 129 | 84.9 |
| Helicobacter
pylori | | |
| Infection | 132 | 86.8 |
|
Non-infection | 20 | 13.2 |
| Adjuvant
treatment | | |
| Yes | 97 | 63.8 |
| None | 55 | 36.2 |
| Location | | |
| Upper | 27 | 17.8 |
| Middle | 43 | 28.3 |
| Lower | 82 | 53.9 |
| Tumor invasion | | |
| T1 | 42 | 27.6 |
| T2 | 31 | 20.4 |
| T3 | 37 | 24.3 |
| T4 | 42 | 27.6 |
| LN metastasis | | |
| N0 | 47 | 30.9 |
| N1 | 29 | 19.1 |
| N2 | 38 | 25.0 |
| N3 | 38 | 25.0 |
| Histology | | |
| Signet
ring/mucinous | 46 | 30.3 |
| Others | 106 | 69.7 |
Expression of molecules related to
glucose metabolism in human tissues
Positive HIF-1α staining was observed in 47 out of
the 152 patients (30.1%), and the staining was evident in the
nuclei of the cancer cells. GLUT-1-positive staining was observed
in 36 patients (23.6%), and the staining was localized to cellular
membranes. Positive HK-2 and PDK-1 staining was detected in 7
(4.1%) and 19 (12.5%) patients, respectively, and this staining was
evident in the cytoplasm. Positive staining for HIF-1α was
significantly correlated with positive PDK-1 expression (p=0.029)
(Table II).
| Table II.Correlation between hypoxia-inducible
factor-1α expression and other glycolysis-related enzymes. |
Table II.
Correlation between hypoxia-inducible
factor-1α expression and other glycolysis-related enzymes.
| HIF-1α
| |
|---|
| N (%) | Negative (n=105)
(%) | Positive (n=47)
(%) | P-value |
|---|
| GLUT-1 | | | |
| Negative
(n=116) | 77 (50.7) | 39 (25.7) | 0.196 |
| Positive
(n=36) | 28 (18.4) | 8 (5.3) | |
| HK-2 | | | |
| Negative
(n=145) | 99 (65.1) | 46 (30.3) | 0.437 |
| Positive
(n=7) | 6 (3.9) | 1 (0.7) | |
| PDK-1 | | | |
| Negative
(n=133) | 96 (63.2) | 37 (24.3) | 0.029 |
| Positive
(n=19) | 9 (5.9) | 10 (6.6) | |
The relationship between the clinicopathologic
factors and the IHC results are listed in Table III. Positive GLUT-1 staining was
significantly associated with tumor invasion (p=0.011) and lymph
node metastasis (p=0.011). The histological classification results
regarding the signet rings or mucinous cells were significantly
different (p=0.042) from the other pathologic findings for GLUT-1
staining. For HK-2 expression, the staining results were not
correlated with any of the clinicopathological features. However,
PDK-1 staining significantly correlated with tumor invasion
(p=0.020), the presence of a positive metastatic lymph node
(p=0.040) and larger tumor size (p=0.006).
| Table III.Correlation between GLUT-1, HK-2 and
PDK-1 expression and the presence of pathological features. |
Table III.
Correlation between GLUT-1, HK-2 and
PDK-1 expression and the presence of pathological features.
| | GLUT-1
| | HK-2
| | PDK-1
| |
|---|
|
Characteristics | N | Negative (n=116)
(%) | Positive (n=36)
(%) | P-value | Negative (n=145)
(%) | Positive (n=7)
(%) | P-value | Negative (n=133)
(%) | Positive (n=19)
(%) | P-value |
|---|
| Location | | | | | | | | | | |
| Upper | 27 | 18 (66.7) | 9 (33.3) | 0.149 | 25 (92.6) | 2 (7.4) | 0.226 | 21 (77.8) | 6 (22.2) | 0.170 |
| Middle | 43 | 37 (86.0) | 6 (14.0) | | 43 (100.0) | 0 (0.0) | | 40 (90.3) | 3 (7.0) | |
| Lower | 82 | 61 (74.4) | 21 (25.6) | | 77 (93.9) | 5 (6.1) | | 72 (87.8) | 10 (12.2) | |
| T stage | | | | | | | | | | |
| T1 | 42 | 38 (90.5) | 4 (9.5) | 0.011 | 40 (95.2) | 2 (4.8) | 0.955 | 41 (97.6) | 1 (2.4) | 0.020 |
| T2/T3/T4 | 110 | 78 (70.9) | 32 (29.1) | | 105 (95.5) | 5 (4.5) | | 92 (83.6) | 18 (16.4) | |
| N stage | | | | | | | | | | |
| N0 | 47 | 42 (89.4) | 5 (10.6) | 0.011 | 46 (97.9) | 1 (2.1) | 0.330 | 45 (95.7) | 2 (4.3) | 0.040 |
| N1/N2/N3 | 105 | 74 (70.5) | 31 (29.5) | | 99 (94.3) | 6 (5.7) | | 88 (83.8) | 17 (16.2) | |
| Size (cm) | | | | | | | | | | |
| <5 | 77 | 63 (81.8) | 14 (18.2) | 0.106 | 75 (97.4) | 2 (2.6) | 0.231 | 73 (94.8) | 4 (5.2) | 0.006 |
| ≥5 | 75 | 53 (70.7) | 22 (29.3) | | 70 (93.3) | 5 (6.7) | | 60 (80.0) | 15 (20.0) | |
| Lauren | | | | | | | | | | |
| Diffuse | 62 | 55 (88.7) | 7 (11.3) | 0.016 | 59 (95.2) | 3 (4.8) | 0.106 | 52 (83.9) | 10 (16.1) | 0.564 |
| Intestinal | 58 | 37 (63.8) | 21 (36.2) | | 57 (98.3) | 1 (1.7) | | 53 (91.4) | 5 (8.6) | |
| Mixed | 21 | 16 (76.2) | 5 (23.8) | | 18 (85.7) | 3 (14.3) | | 19 (90.5) | 2 (9.5) | |
| Unknown | 11 | 8 (72.7) | 3 (27.3) | | 11 (100.0) | 0 (0.0) | | 9 (81.8) | 2 (18.2) | |
| Histologic
type | | | | | | | | | | |
| SRC/mucinous | 46 | 40 (87.0) | 6 (13.0) | 0.042 | 44 (95.7) | 2 (4.7) | 0.921 | 38 (82.6) | 8 (17.4) | 0.230 |
| Others | 106 | 76 (71.7) | 30 (28.3) | | 101 (95.3) | 2 (4.3) | | 95 (89.6) | 11 (10.4) | |
| Helicobacter
pylori | | | | | | | | | | |
| Yes | 132 | 102 (77.3) | 30 (22.7) | 0.476 | 127 (96.2) | 5 (3.8) | 0.217 | 114 (86.4) | 18 (13.6) | 0.276 |
| No | 20 | 14 (70.0) | 6 (30.0) | | 18 (90.0) | 2 (10.0) | | 19 (95.0) | 1 (5.0) | |
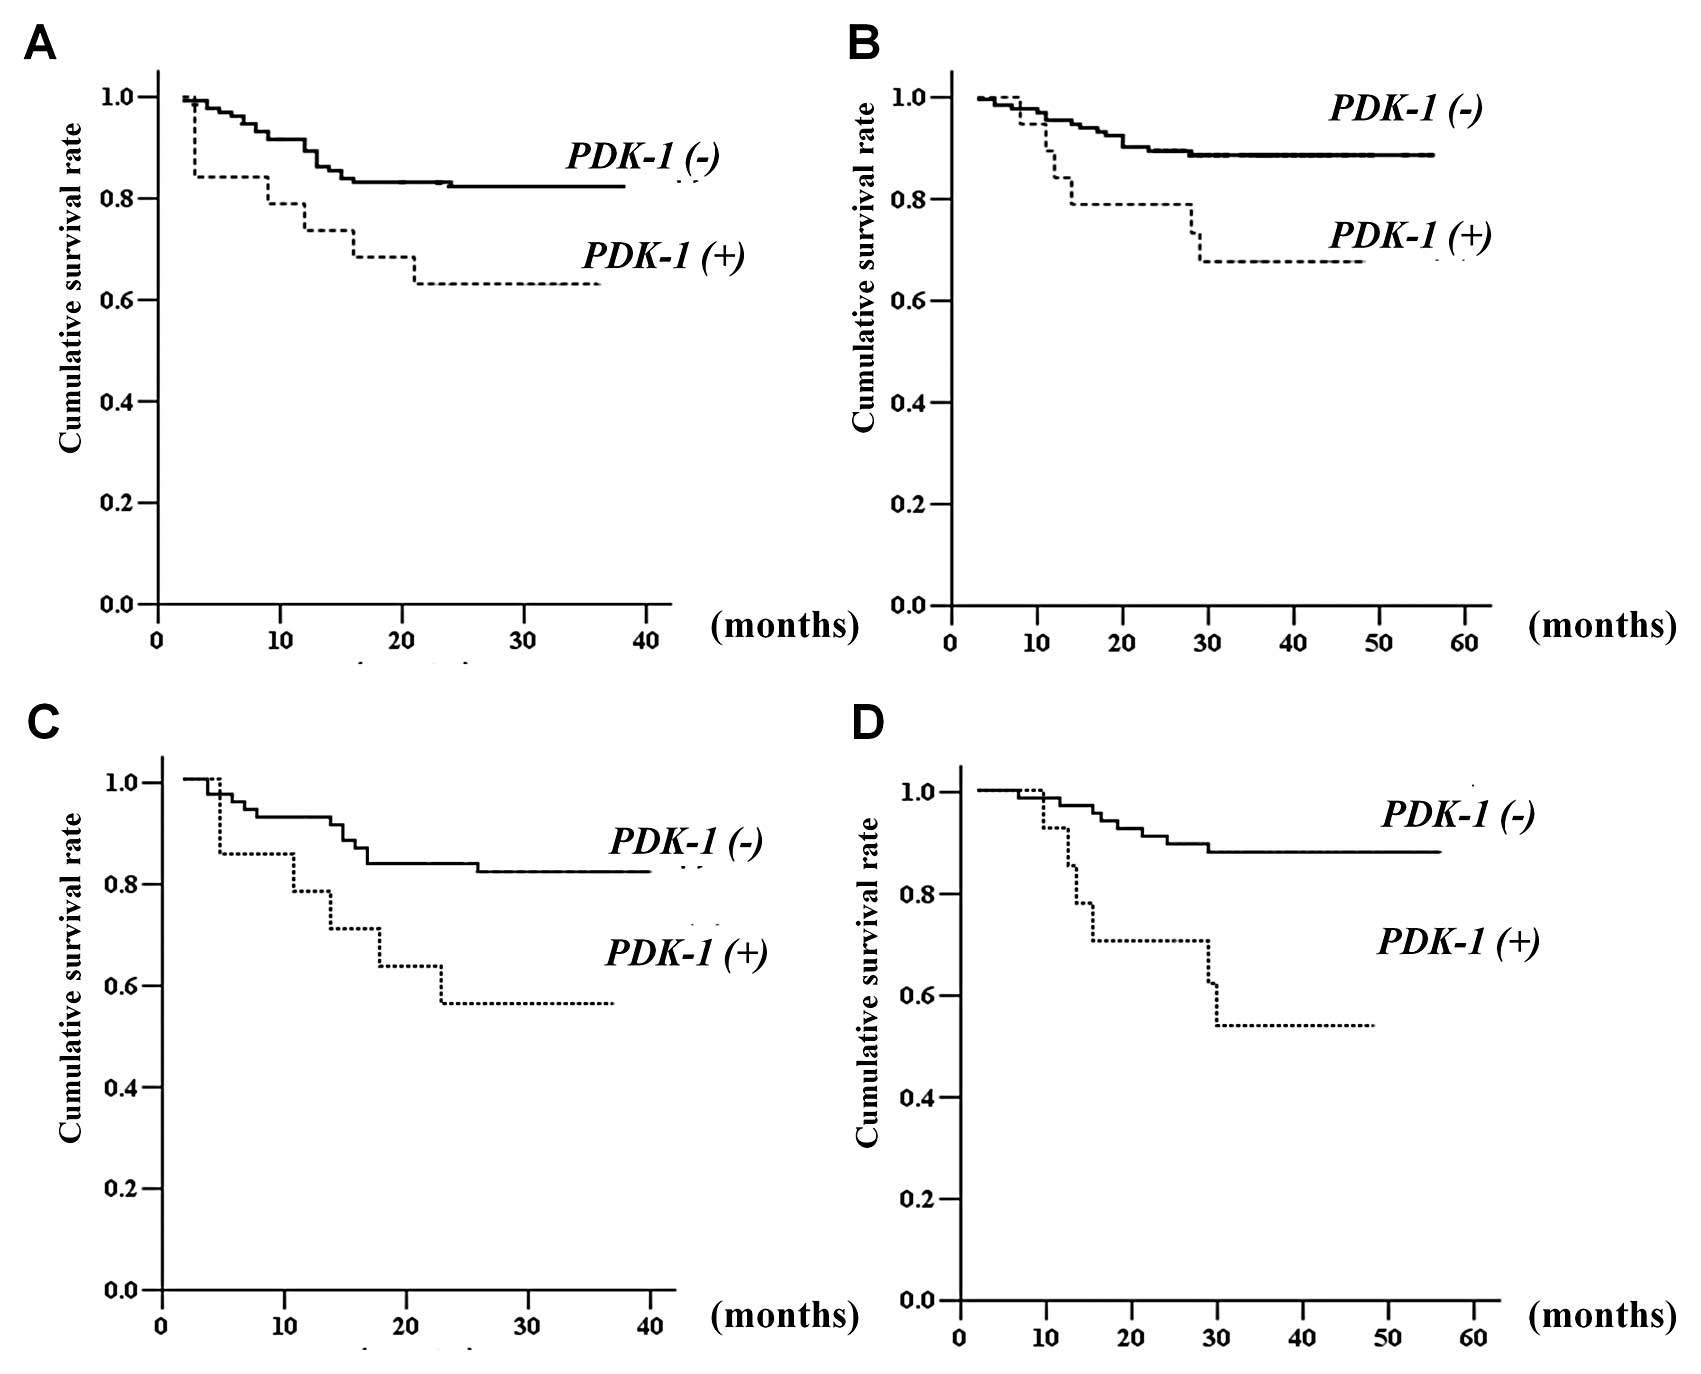
The disease-free and overall survival rates were
significantly associated with tumor size, the depth of invasion and
lymph node metastasis (Table IV).
With regards to the expression of these molecules, only PDK-1
expression was significantly correlated with the disease-free and
overall survival rates (Fig. 2A and
B). In 78 patients who were administered single-agent 5-FU as
adjuvant treatment (Table V),
patients with PDK-1 expression also demonstrated reduced
disease-free and overall survival rates (Fig. 2C and D).
| Table IV.The disease-free and overall survival
rates in relation to the clinicopathological features of the
patients. |
Table IV.
The disease-free and overall survival
rates in relation to the clinicopathological features of the
patients.
| | Disease-free
survival
| Overall survival
|
|---|
| Characters | N | Mean survival
(month) | 95% CI | P-value | Mean survival
(month) | 95% CI | P-value |
|---|
| Age | | | | | | | |
| <65 | 99 | 31.7 | 29.6–33.9 | 0.790 | 51.0 | 48.4–53.7 | 0.397 |
| ≥65 | 53 | 32.2 | 29.0–35.3 | | 49.0 | 44.8–53.2 | |
| Gender | | | | | | | |
| Male | 96 | 32.4 | 30.1–34.7 | 0.956 | 47.9 | 44.8–51.0 | 0.070 |
| Female | 56 | 31.7 | 28.8–34.6 | | 53.1 | 50.3–55.9 | |
| Size (cm) | | | | | | | |
| <5 | 77 | 34.6 | 32.5–36.7 | 0.012 | 50.1 | 48.5–52.7 | 0.007 |
| ≥5 | 75 | 29.5 | 26.7–32.3 | | 47.2 | 43.3–51.1 | |
| Tumor location | | | | | | | |
| Upper | 27 | 26.9 | 22.2–31.5 | 0.040 | 47.9 | 42.1–53.6 | 0.819 |
| Middle | 43 | 33.5 | 30.5–36.4 | | 52.1 | 48.4–55.8 | |
| Lower | 82 | 32.9 | 30.5–35.3 | | 50.0 | 46.8–53.2 | |
| Tumor invasion | | | | | | | |
| T1/T2/T3 | 110 | 33.5 | 31.7–35.2 | <0.001 | 51.9 | 49.5–54.2 | 0.023 |
| T4 | 42 | 27.6 | 23.4–31.7 | | 46.2 | 40.9–51.6 | |
| Lymph node | | | | | | | |
| N0/N1 | 76 | 36.9 | 35.6–38.1 | <0.001 | 54.4 | 52.6–56.2 | <0.001 |
| N2/N3 | 76 | 27.3 | 24.3–30.3 | | 43.9 | 40.2–47.7 | |
| Adjuvant | | | | | | | |
| No | 55 | 34.4 | 32.2–36.6 | 0.015 | 49.0 | 44.8–49.2 | 0.026 |
| Yes | 97 | 30.8 | 28.3–33.3 | | 48.4 | 45.2–51.6 | |
| Histologic
type | | | | | | | |
|
Differentiated | 49 | 35.00 | 32.5–37.5 | 0.052 | 43.9 | 40.7–47.1 | 0.701 |
|
Undifferentiated | 103 | 30.48 | 28.2–32.8 | | 50.1 | 47.3–52.9 | |
| Helicobacter
pylori | | | | | | | |
| Negative | 20 | 29.1 | 23.0–35.1 | 0.190 | 49.1 | 42.8–55.3 | 0.880 |
| Positive | 132 | 32.1 | 30.3–33.9 | | 50.4 | 48.0–52.8 | |
| HIF-1α | | | | | | | |
| Negative | 105 | 32.4 | 30.2–34.6 | 0.918 | 49.9 | 47.0–52.7 | 0.464 |
| Positive | 47 | 31.0 | 28.0–34.0 | | 50.5 | 46.8–54.3 | |
| GLUT-1 | | | | | | | |
| Negative | 116 | 32.3 | 30.5–34.2 | 0.255 | 50.9 | 48.5–53.4 | 0.502 |
| Positive | 36 | 30.2 | 25.7–34.6 | | 41.8 | 37.3–46.4 | |
| HK-2 | | | | | | | |
| Negative | 145 | 32.4 | 30.5–34.2 | 0.780 | 50.7 | 48.4–52.9 | 0.201 |
| Positive | 7 | 27.8 | 22.2–33.5 | | 37.1 | 25.4–48.9 | |
| PDK-1 | | | | | | | |
| Negative | 133 | 33.1 | 31.3–35.0 | 0.037 | 51.3 | 49.1–53.6 | 0.015 |
| Positive | 19 | 26.3 | 20.3–32.3 | | 38.1 | 31.2–44.9 | |
| Table V.The disease-free and overall survival
rates in 78 patients who were administered 5-fluorouracil as
adjuvant treatment. |
Table V.
The disease-free and overall survival
rates in 78 patients who were administered 5-fluorouracil as
adjuvant treatment.
| | Disease-free
survival
| Overall survival
|
|---|
| Characters | N | Mean survival
(month) | 95% CI | P-value | Mean survival
(month) | 95% CI | P-value |
|---|
| Age | | | | | | | |
| <65 | 43 | 30.5 | 27.2–33.8 | 0.621 | 50.4 | 46.2–54.7 | 0.313 |
| ≥65 | 35 | 31.0 | 26.9–35.0 | | 46.8 | 41.2–52.5 | |
| Gender | | | | | | | |
| Male | 49 | 30.4 | 26.8–34.0 | 0.314 | 45.3 | 40.4–50.1 | 0.048 |
| Female | 29 | 32.7 | 29.1–36.3 | | 53.5 | 50.1–56.9 | |
| Size (cm) | | | | | | | |
| <5 | 29 | 31.7 | 27.2–36.3 | 0.733 | 48.3 | 43.9–52.7 | 0.421 |
| ≥5 | 49 | 30.8 | 27.6–34.0 | | 47.6 | 42.9–52.3 | |
| Tumor location | | | | | | | |
| Upper | 17 | 27.0 | 20.9–33.1 | 0.328 | 48.0 | 40.7–55.4 | 0.986 |
| Middle | 16 | 32.1 | 27.0–37.2 | | 47.7 | 39.2–56.2 | |
| Lower | 45 | 32.1 | 28.8–35.4 | | 49.2 | 44.9–53.5 | |
| Tumor invasion | | | | | | | |
| T1/T2/T3 | 54 | 32.0 | 29.1–34.9 | 0.162 | 50.3 | 46.6–54.0 | 0.236 |
| T4 | 24 | 29.0 | 23.7–34.3 | | 45.5 | 38.1–52.9 | |
| Lymph node | | | | | | | |
| N0/N1 | 29 | 35.9 | 33.1–38.7 | 0.014 | 51.7 | 47.1–56.3 | 0.172 |
| N2/N3 | 49 | 27.8 | 24.3–31.2 | | 44.7 | 40.3–49.1 | |
| Histologic
type | | | | | | | |
|
Differentiated | 23 | 31.6 | 26.6–36.6 | 0.938 | 41.2 | 35.7–46.6 | 0.609 |
|
Undifferentiated | 55 | 30.8 | 27.8–33.9 | | 49.4 | 45.4–53.4 | |
| Helicobacter
pylori | | | | | | | |
| Negative | 11 | 29.5 | 21.1–37.8 | 0.670 | 50.7 | 42.7–58.7 | 0.429 |
| Positive | 67 | 31.2 | 28.5–33.9 | | 48.3 | 44.5–52.1 | |
| HIF-1α | | | | | | | |
| Negative | 56 | 31.8 | 28.6–34.9 | 0.599 | 49.8 | 46.0–53.5 | 0.453 |
| Positive | 22 | 29.4 | 24.6–34.1 | | 45.4 | 37.9–52.9 | |
| GLUT-1 | | | | | | | |
| Negative | 59 | 31.6 | 28.4–34.7 | 0.818 | 49.0 | 45.0–53.0 | 0.738 |
| Positive | 19 | 30.2 | 25.6–34.8 | | 45.9 | 39.6–52.2 | |
| HK-2 | | | | | | | |
| Negative | 75 | Not evaluable | 0.361 | Not evaluable | 0.433 |
| Positive | 3 | | | | | | |
| PDK-1 | | | | | | | |
| Negative | 65 | 32.8 | 30.1–35.6 | 0.026 | 51.1 | 47.9–54.3 | 0.002 |
| Positive | 13 | 23.8 | 16.7–30.8 | | 33.3 | 24.3–42.3 | |
In the multivariate analysis, PDK-1 expression was
one of the predictive factors for the overall survival rate (OR
2.890; 95% CI 1.108–7.536). For patients treated with single-agent
5-FU as adjuvant treatment, PDK-1 expression was one of the
prognostic factors for early recurrence (OR 3.709; 95% CI
1.377–9,991) and short survival time (OR 5.132; 95% CI
1.699–15.503) (Table VI).
| Table VI.Factors predicting prognosis in the
multivariable analysis. |
Table VI.
Factors predicting prognosis in the
multivariable analysis.
| All patients
| Patients using
single-agent 5-flurouracil adjuvant treatment
|
|---|
| Characters | P-value | β | OR | 95% CI | P-value | β | OR | 95% CI |
|---|
| Disease-free
survival | | | | | | | | |
| Lymph node | | | | | | | | |
| N0/N1 vs.
N2/N3 | <0.001 | 2.186 | 8.897 | 2.640–29.986 | 0.015 | 1.831 | 6.238 | 1.418–27.438 |
| PDK-1 | | | | | | | | |
| Negative vs.
positive | | | | | 0.010 | 1.311 | 3.709 | 1.377–9.991 |
| Overall
survival | | | | | | | | |
| Lymph node | | | | | | | | |
| N0/N1 vs.
N2/N3 | 0.003 | 1.828 | 6.224 | 1.826–21.219 | 0.049 | 1.440 | 4.220 | 1.005–17.725 |
| PDK-1 | | | | | | | | |
| Negative vs.
positive | 0.030 | 1.061 | 2.890 | 1.108–7.536 | 0.004 | 1.635 | 5.132 | 1.699–15.503 |
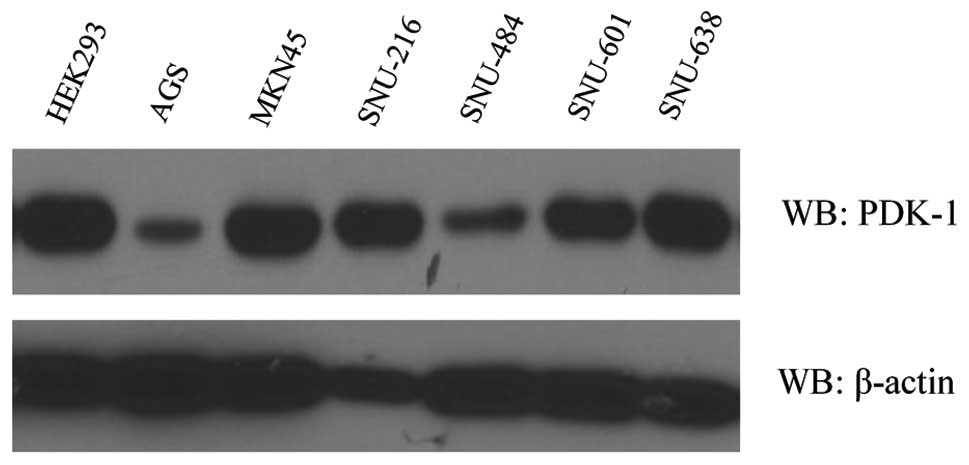
Expression of PDK-1 and the cell line
metabolic status
As demonstrated by western blotting, PDK-1 was
expressed in all of the gastric cancer cell lines as well as the
HEK293 cells (Fig. 3). The PDK-1
expression level was lower in the AGS cell line in comparison to
the other gastric cancer cell lines and the HEK293 cells.
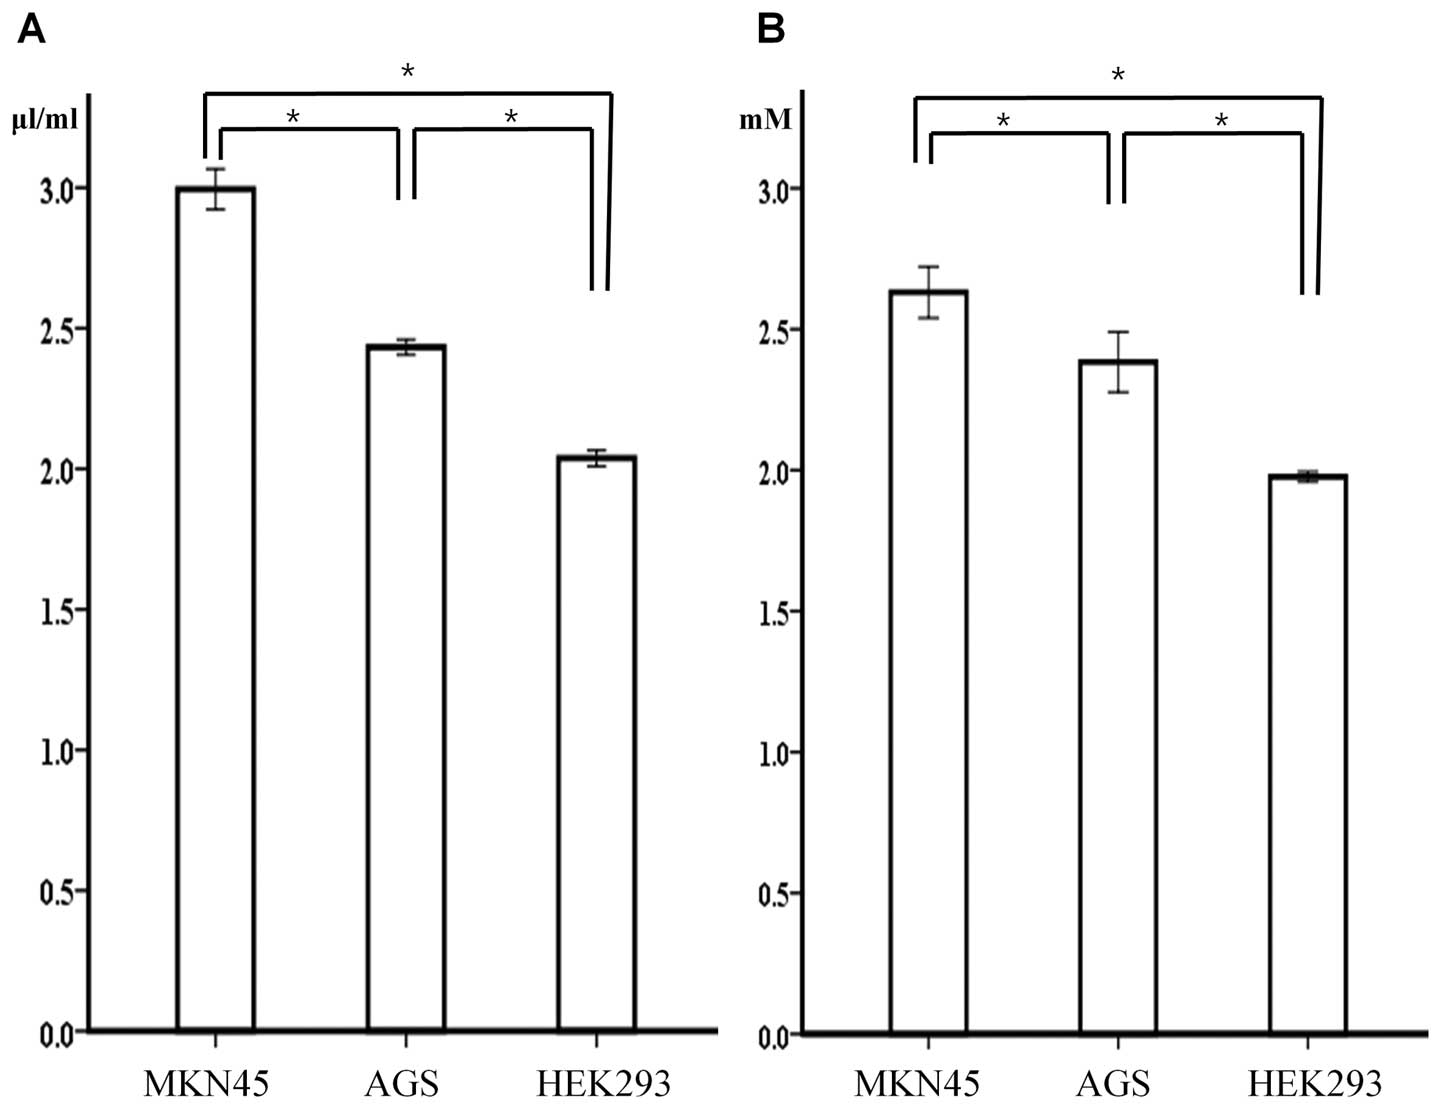
Of the gastric cancer cell lines, the glucose uptake
and lactate production levels were significantly higher in the
MKN45 cell line, which expressed a higher PDK-1 level in comparison
to the AGS cell line, which expressed a lower level of PDK-1
(p<0.001). In addition, the non-cancerous HEK293 cells
demonstrated a significantly lower level of glucose uptake and
lactate production despite a higher level of PDK-1 expression when
compared to MKN45 and AGS cells (Fig.
4).
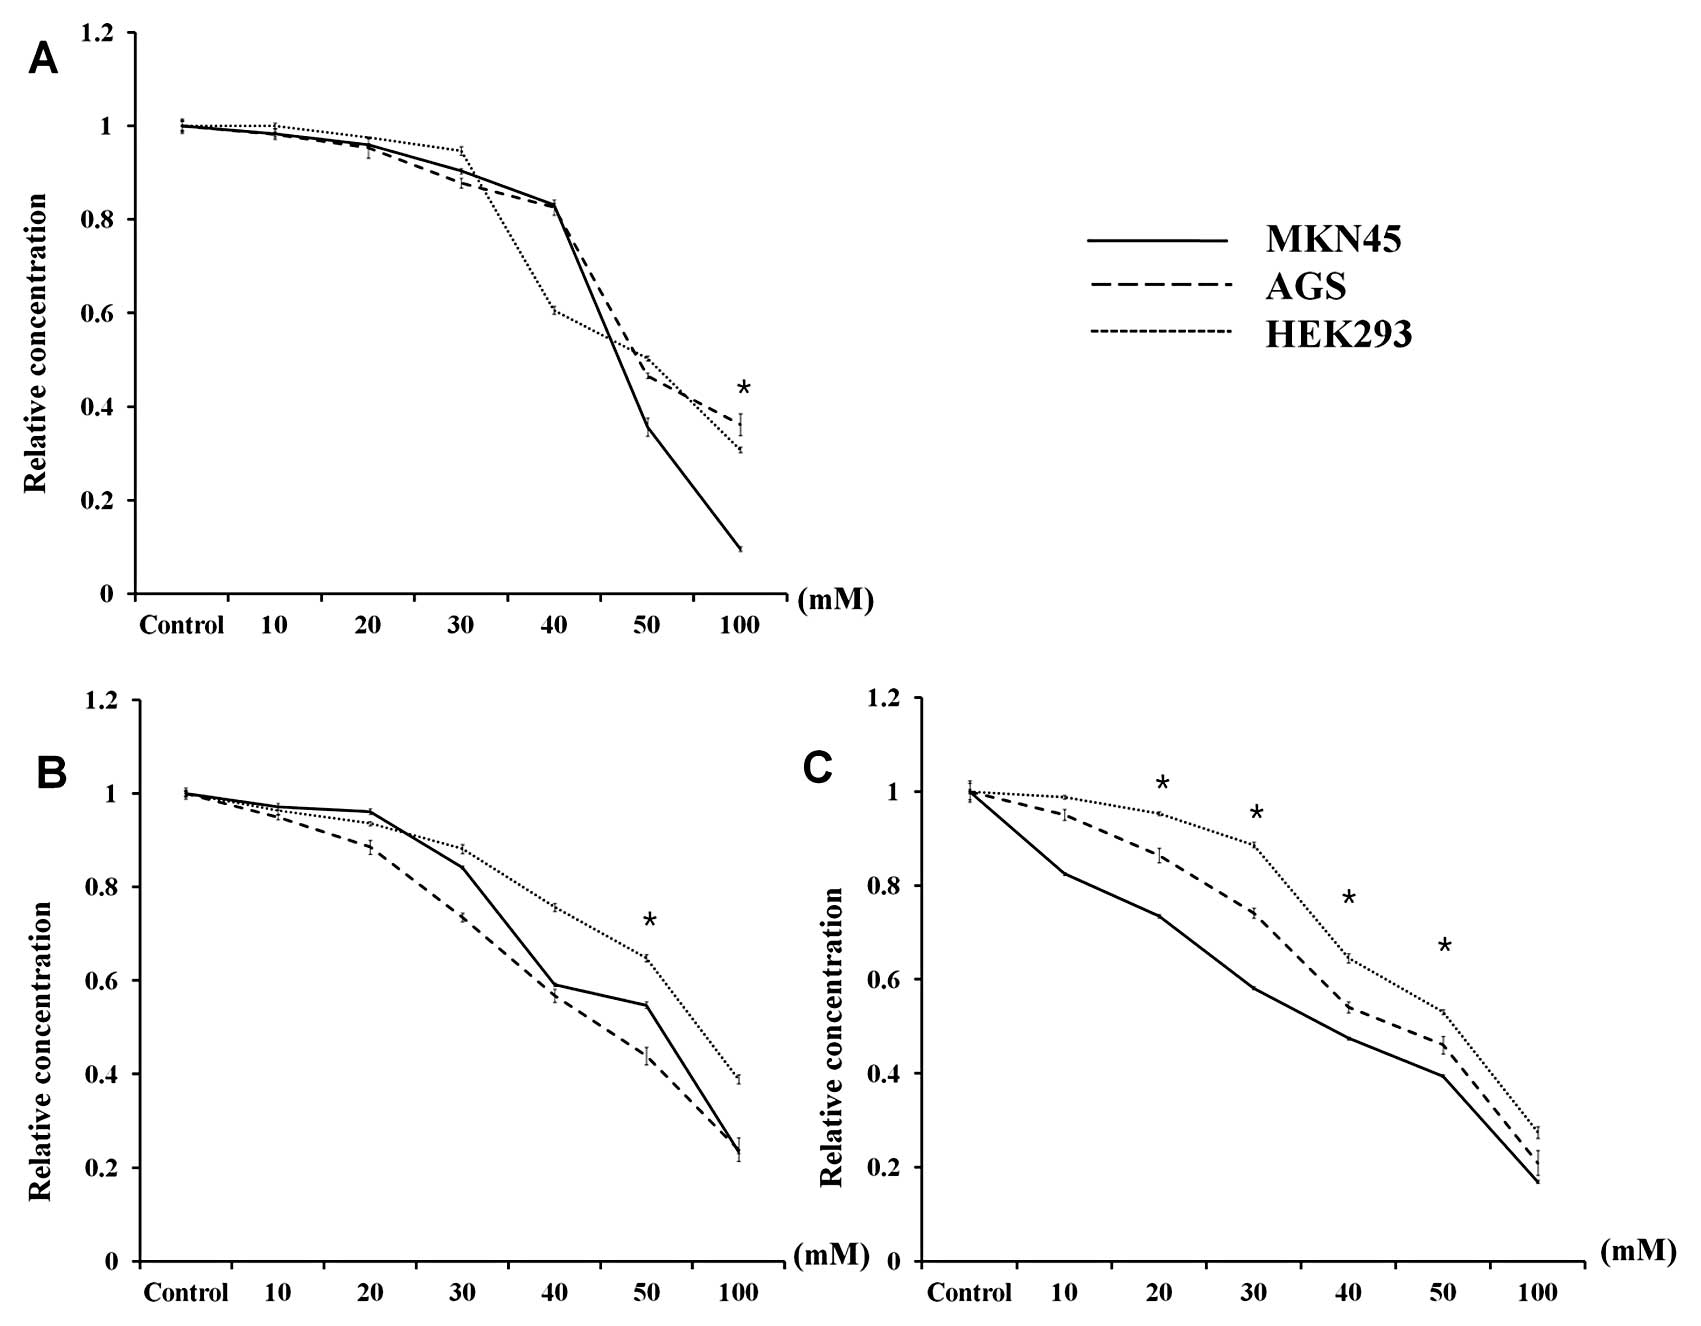
Effects of DCA and 5-FU on metabolism and
viability
Following DCA treatment, the viability of each cell
line was similar, with the exception of the highest DCA
concentration (100 mM) (Fig. 5A).
In addition, glucose uptake demonstrated a pattern similar to that
observed for cell viability, although the change was the least
pronounced in the non-cancerous cell line HEK293 (Fig. 5B). However, the lactate production
in all three cell lines was significantly different when the cells
were treated with 20–50 mM DCA (p<0.001). In particular, the
lactate production in MKN45 cells, which demonstrated the highest
level of PDK-1 expression by western blotting, demonstrated the
largest decline after DCA treatment. In contrast, the effect of DCA
on the decrease in lactate production was lowest in HEK293 cells
(Fig. 5C).
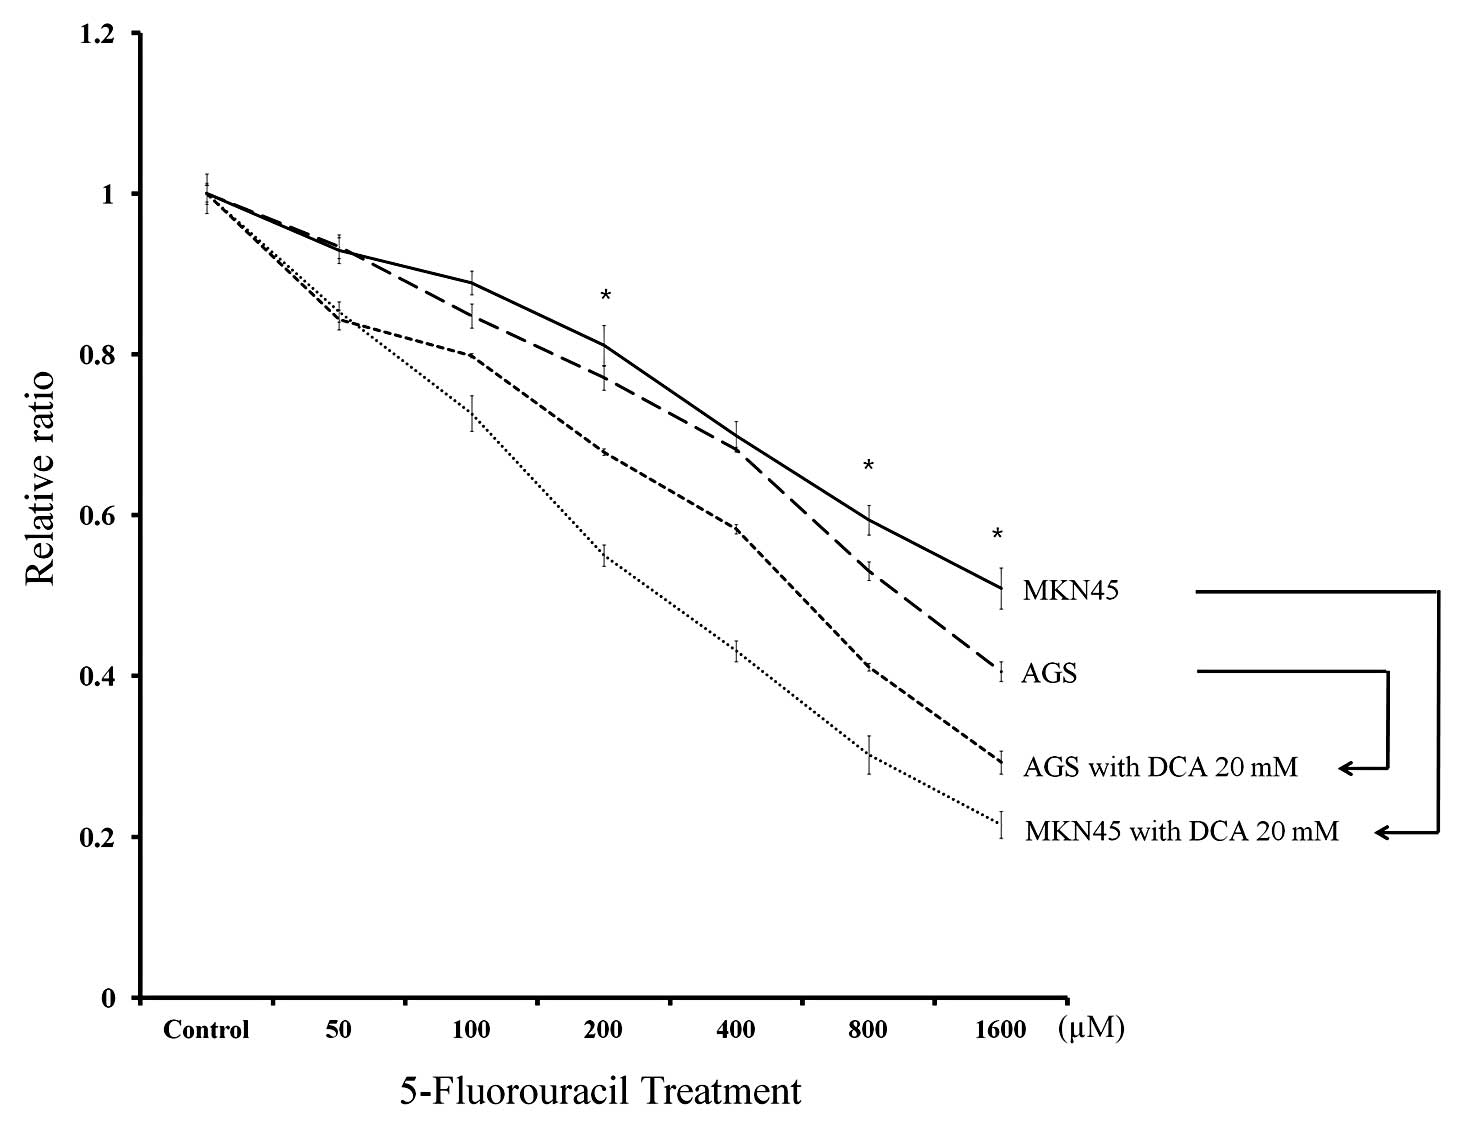
We next evaluated the responsiveness of the cancer
cell lines to 5-FU treatment alone or in combination with 20 mM DCA
(Fig. 6). MKN45 cells demonstrated
decreased responsiveness to 5-FU treatment compared to AGS cells
following treatment with 200, 800 and 1,000 μM 5-FU (p<0.001).
However, the synergic effect of DCA treatment was more pronounced
in MKN45 cells. The mean relative ratio of cell viability following
1,000 μM 5-FU plus DCA treatment was reduced to 42.3% in MKN45
cells compared to 72.1% in AGS cells.
Discussion
As suggested by Warburg, the level of aerobic
glycolysis is a significant phenotype representing the metabolic
changes that occur in solid tumors (14). Warburg reported that most of the
cellular energy required for tumor survival and proliferation is
produced by glycolysis, whereas very little mitochondrial energy
production occurs in cancer cells. Due to the altered metabolism of
cancer cells, the hypoxic or acidic tumor microenvironment has been
evaluated in previous studies (15). In hypoxic conditions, solid tumors
can adapt their metabolic pathways to regulate oxygen demand
(16), and the expression of genes
associated with these conditions may be essential for the ability
of cancer cells to adapt to and survive in these microenvironments.
Therefore, the metabolic changes that occur in cancer cells may
represent a potential therapeutic target for enzymes capable of
inhibiting these survival mechanisms. This possibility is relevant
for patients with gastric cancer because these patients demonstrate
a relatively low sensitivity to conventional chemotherapeutic
agents compared to patients with other malignancies. In this study,
we first examined the expression of various molecules involved in
the human gastric cancer glycolytic pathway and then evaluated a
potential therapeutic target by correlating patient prognoses with
in vitro test results.
We evaluated the expression of principle molecules
related to the glycolytic pathway including HIF-1α, which is a
transcription factor that targets genes involved in extracellular
glucose import, GLUT-1, which is important for glycolysis and the
catabolism of intracellular glucose, and HK-2, which functions to
inhibit mitochondrial proteins such as PDK-1. The aggressiveness of
malignant tumors may be caused by aberrant glucose metabolism
induced by HIF-1α because several of the glycolytic enzymes are
important regulators of tumor cell death and apoptosis (5,17).
Thus, we aimed to verify the relationship between HIF-1α expression
and that of other enzymes involved in gastric cancer. The results
from our immunohistochemical analysis of human gastric cancer
tissues demonstrated that the expression of PDK-1, a gate-keeping
enzyme that regulates carbohydrate transport into the mitochondria,
was significantly correlated with HIF-1α expression.
Few studies have evaluated the correlation between
the expression of enzymes related to glycolysis and gastric cancer
prognosis; GLUT-1 is the only protein that has been evaluated
(10,11). Kawamura et al(10) reported that positive GLUT-1
expression progressively increased with more advanced stages of
cancer and was correlated with poor gastric cancer prognosis.
However, correlations between the expression of other enzymes, such
as HK-2 and PDK-1, and gastric cancer prognosis have not been
previously reported. In this study, we evaluated these potential
correlations and found that although the expression of GLUT-1 and
PDK-1 was frequently observed in samples from patients with more
advanced disease, poor prognosis was only associated with PDK-1
expression. With regard to the GLUT-1 results, we assumed that the
difference between this study and previous reports was due to
differences in the disease stage of the enrolled patients. The
percentage of patients who were diagnosed with advanced gastric
cancer in our study (72.4%) was higher than that reported in
previous studies, which may indicate that PDK-1 can serve as a more
specific prognostic marker for more advanced disease stages.
PDK-1 is a critical enzyme for attenuating the
production of mitochondrial reactive oxygen species and maintaining
ATP levels, and it is also a direct target of HIF-1α. PDK-1 can
inactivate the pyruvate dehydrogenase E1α subunit that converts
pyruvate to acetyl-CoA, which inhibits pyruvate metabolism via the
tricarboxylic acid cycle (18). To
date, four PDK-1 isoforms have been verified in human tissue, and
the expression of these isoforms was shown to be organ specific
(19,20). These PDK-1 isoforms have been
detected in the liver, muscle, and pancreas. With regard to
malignant cells, several studies have reported that PDK-1, which is
targeted by HIF-1α, can control the switch from aerobic oxidation
to glycolytic glucose metabolism. This metabolic switch is
advantageous to tumor growth because it reduces mitochondrial
oxygen consumption, which results in preventing the accumulation of
reactive oxygen species (21,22).
In this study, changes in the use of metabolic processes such as
glucose uptake and lactate production in gastric cancer cell lines
were dependent on PDK-1 expression. In addition, we assumed that
these metabolic changes were predominant in cancer cell lines
because HEK-293, a non-cancerous cell line, demonstrated little
metabolic change despite high PDK-1 expression.
In our in vivo study, PDK-1 expression
correlated with cancer progression and patient prognosis. Moreover,
the expression of PDK-1 was more meaningful as a prognostic marker
for patients who were administered single-agent 5-FU as adjuvant
treatment. Using an in vitro test, we confirmed that the
responsiveness of MKN45 cells, which expressed a high level of
PDK-1, to therapeutic 5-FU was lower than that of AGS cells. A
metabolic advantage, such as increased glycolysis or mitochondrial
dysfunction, may enhance the aggressiveness of tumors and increase
their resistance to chemotherapeutic agents (17). In addition, these changes can
negatively regulate the activities of pro-apoptotic molecules such
as Bax, Bak and Bad, which may lead to the prevention of cell death
triggered by chemotherapeutic agents. In cancer cells, PDK-1 is
required for the conversion of pyruvate into lactate rather than
acetyl-CoA, which occurs in the first step of the TCA cycle
(21,22). As a result, PDK-1 may represent a
target for additional treatment options that could be added to
conventional therapies.
DCA is a non-specific mitochondrial PDK-1 inhibitor.
By blocking the function of this enzyme, DCA decreases lactate
production by shifting pyruvate metabolism from glycolysis to
oxidative phosphorylation in the mitochondria. This relatively
nontoxic and inexpensive small molecule has been clinically
administered to treat patients with lactic acidosis caused by a
genetic disorder (23). Recently,
DCA has been considered as a potential cancer therapeutic agent for
several malignant tumors originating from the endometrium, breast
and brain (24–26). However, DCA has not yet been
considered a therapeutic option for the treatment of gastric
cancer. In our in vitro experiments, DCA treatment had a
similar effect on the viability of gastric cancer and normal kidney
cell lines. However, this treatment led to significant metabolic
changes in only the MKN45 cancer cell line, where it resulted in
increased lactate production and greater PDK-1 expression. In
addition, the metabolic changes associated with cancer cells may
contribute to an increased sensitivity to chemotherapy and
radiation therapy (27,28). Previous research has reported that
DCA treatment could induce apoptosis in malignant cells by causing
mitochondrial dysfunction and activating the NFAT-Kv1.5 pathway
(26,29). Moreover, this induction of
apoptosis is also responsible for cancer cell sensitivity to
conventional treatment. In this study, we evaluated the therapeutic
effects resulting from treatment with DCA, a PDK-1 inhibitor, and
the synergic effects of DCA and 5-FU treatment in a gastric cancer
cell line expressing a high level of PDK-1 and producing a high
level of glycolytic products. This is the first study to
demonstrate that low-dose DCA treatment provides a minimal effect
on cell survival but causes a metabolic shift in gastric cancer
cells expressing PDK-1. Therefore, our results suggest that DCA may
represent an additional agent that could be used in combination
with conventional chemotherapy for patients with a low
responsiveness to therapy and a poor prognosis.
In conclusion, PDK-1 overexpression in cancer
tissues was correlated with poor prognosis in patients with gastric
cancer. DCA, an inhibitor of PDK-1, led to metabolic changes in
gastric cancer and may therefore serve as an additional treatment
option for patients with gastric cancers expressing PDK-1 and for
those with a poor prognosis.
Acknowledgements
This study was supported by the Basic
Science Research Program of the National Research Foundation of
Korea (NRF), which is funded by the Ministry of Education, Science
and Technology (2012R1A1A1012602). The major content of this
manuscript was presented at the international session of the 84th
Annual Meeting of the Japanese Gastric Cancer Association in Osaka,
Japan, February 8, 2012.
References
|
1.
|
Jemal A, Siegel R, Ward E, Murray T, Xu J
and Thun MJ: Cancer statistics, 2007. CA Cancer J Clin. 57:43–66.
2007. View Article : Google Scholar
|
|
2.
|
An JY, Cheong JH, Hyung WJ and Noh SH:
Recent evolution of surgical treatment for gastric cancer in Korea.
J Gastric Cancer. 11:1–6. 2011. View Article : Google Scholar
|
|
3.
|
Macdonald JS, Smalley SR, Benedetti J, et
al: Chemoradiotherapy after surgery compared with surgery alone for
adenocarcinoma of the stomach or gastroesophageal junction. N Engl
J Med. 345:725–730. 2001. View Article : Google Scholar
|
|
4.
|
Sakuramoto S, Sasako M, Yamaguchi T, et
al: Adjuvant chemotherapy for gastric cancer with S-1, an oral
fluoropyrimidine. N Engl J Med. 357:1810–1820. 2007. View Article : Google Scholar : PubMed/NCBI
|
|
5.
|
Denko NC: Hypoxia, HIF1 and glucose
metabolism in the solid tumour. Nat Rev Cancer. 8:705–713. 2008.
View Article : Google Scholar : PubMed/NCBI
|
|
6.
|
Park MJ, Lee WJ, Lim HK, Park KW, Choi JY
and Kim BT: Detecting recurrence of gastric cancer: the value of
FDG PET/CT. Abdom Imaging. 34:441–447. 2009. View Article : Google Scholar : PubMed/NCBI
|
|
7.
|
Weber WA, Petersen V, Schmidt B, et al:
Positron emission tomography in non-small-cell lung cancer:
prediction of response to chemotherapy by quantitative assessment
of glucose use. J Clin Oncol. 21:2651–2657. 2003. View Article : Google Scholar : PubMed/NCBI
|
|
8.
|
Wieder HA, Brucher BL, Zimmermann F, et
al: Time course of tumor metabolic activity during
chemoradiotherapy of esophageal squamous cell carcinoma and
response to treatment. J Clin Oncol. 22:900–908. 2004. View Article : Google Scholar : PubMed/NCBI
|
|
9.
|
Madhok BM, Yeluri S, Perry SL, Hughes TA
and Jayne DG: Targeting glucose metabolism: an emerging concept for
anti-cancer therapy. Am J Clin Oncol. 34:628–635. 2011. View Article : Google Scholar : PubMed/NCBI
|
|
10.
|
Kawamura T, Kusakabe T, Sugino T, et al:
Expression of glucose transporter-1 in human gastric carcinoma:
association with tumor aggressiveness, metastasis, and patient
survival. Cancer. 92:634–641. 2001. View Article : Google Scholar : PubMed/NCBI
|
|
11.
|
Noguchi Y, Marat D, Saito A, et al:
Expression of facilitative glucose transporters in gastric tumors.
Hepatogastroenterology. 46:2683–2689. 1999.PubMed/NCBI
|
|
12.
|
Kaelin WG Jr and Thompson CB: Q&A:
cancer: clues from cell metabolism. Nature. 465:562–564. 2010.
|
|
13.
|
Egawa-Takata T, Endo H, Fujita M, et al:
Early reduction of glucose uptake after cisplatin treatment is a
marker of cisplatin sensitivity in ovarian cancer. Cancer Sci.
101:2171–2178. 2010. View Article : Google Scholar : PubMed/NCBI
|
|
14.
|
Warburg O: On respiratory impairment in
cancer cells. Science. 124:269–270. 1956.PubMed/NCBI
|
|
15.
|
Noske A, Kaszubiak A, Weichert W, et al:
Specific inhibition of AKT2 by RNA interference results in
reduction of ovarian cancer cell proliferation: increased
expression of AKT in advanced ovarian cancer. Cancer Lett.
246:190–200. 2007. View Article : Google Scholar : PubMed/NCBI
|
|
16.
|
Surowiak P, Materna V, Denkert C, et al:
Significance of cyclooxygenase 2 and MDR1/P-glycoprotein
coexpression in ovarian cancers. Cancer Lett. 235:272–280. 2006.
View Article : Google Scholar : PubMed/NCBI
|
|
17.
|
Kim JW and Dang CV: Multifaceted roles of
glycolytic enzymes. Trends Biochem Sci. 30:142–150. 2005.
View Article : Google Scholar : PubMed/NCBI
|
|
18.
|
Holness MJ and Sugden MC: Regulation of
pyruvate dehydrogenase complex activity by reversible
phosphorylation. Biochem Soc Trans. 31:1143–1151. 2003. View Article : Google Scholar : PubMed/NCBI
|
|
19.
|
Bowker-Kinley M and Popov KM: Evidence
that pyruvate dehydrogenase kinase belongs to the ATPase/kinase
superfamily. Biochem J. 344:47–53. 1999. View Article : Google Scholar : PubMed/NCBI
|
|
20.
|
Popov KM: Regulation of mammalian pyruvate
dehydrogenase kinase. FEBS Lett. 419:197–200. 1997. View Article : Google Scholar : PubMed/NCBI
|
|
21.
|
Papandreou I, Cairns RA, Fontana L, Lim AL
and Denko NC: HIF-1 mediates adaptation to hypoxia by actively
downregulating mitochondrial oxygen consumption. Cell Metab.
3:187–197. 2006. View Article : Google Scholar : PubMed/NCBI
|
|
22.
|
Kim JW, Tchernyshyov I, Semenza GL and
Dang CV: HIF-1-mediated expression of pyruvate dehydrogenase
kinase: a metabolic switch required for cellular adaptation to
hypoxia. Cell Metab. 3:177–185. 2006. View Article : Google Scholar : PubMed/NCBI
|
|
23.
|
Stacpoole PW: Review of the pharmacologic
and therapeutic effects of diisopropylammonium dichloroacetate
(DIPA). J Clin Pharmacol J New Drugs. 9:282–291. 1969.PubMed/NCBI
|
|
24.
|
Michelakis ED, Sutendra G, Dromparis P, et
al: Metabolic modulation of glioblastoma with dichloroacetate. Sci
Transl Med. 2:31ra342010. View Article : Google Scholar : PubMed/NCBI
|
|
25.
|
Sun RC, Fadia M, Dahlstrom JE, Parish CR,
Board PG and Blackburn AC: Reversal of the glycolytic phenotype by
dichloro-acetate inhibits metastatic breast cancer cell growth in
vitro and in vivo. Breast Cancer Res Treat. 120:253–260. 2010.
View Article : Google Scholar : PubMed/NCBI
|
|
26.
|
Wong JY, Huggins GS, Debidda M, Munshi NC
and De Vivo I: Dichloroacetate induces apoptosis in endometrial
cancer cells. Gynecol Oncol. 109:394–402. 2008. View Article : Google Scholar : PubMed/NCBI
|
|
27.
|
Cao W, Yacoub S, Shiverick KT, et al:
Dichloroacetate (DCA) sensitizes both wild-type and over expressing
Bcl-2 prostate cancer cells in vitro to radiation. Prostate.
68:1223–1231. 2008. View Article : Google Scholar : PubMed/NCBI
|
|
28.
|
Tong J, Xie G, He J, Li J, Pan F and Liang
H: Synergistic antitumor effect of dichloroacetate in combination
with 5-fluorouracil in colorectal cancer. J Biomed Biotechnol.
2011:7405642011. View Article : Google Scholar : PubMed/NCBI
|
|
29.
|
Bonnet S, Archer SL, Allalunis-Turner J,
et al: A mitochondria-K+ channel axis is suppressed in cancer and
its normalization promotes apoptosis and inhibits cancer growth.
Cancer Cell. 11:37–51. 2007.
|