Introduction
Basal cell carcinoma (BCC) is the most common
malignancy among Caucasians, with a rising estimated yearly
incidence of 2.75 million cases worldwide (1). BCC is more common among elderly men,
with a peak incidence after the age of eighty. Individuals with a
fair phenotype, including red or blonde hair and light eyes, are
particularly at risk. While BCC can develop on any skin surface,
the majority of lesions appear on the head and neck. Based on their
histological and clinical features, BCC can be classified into one
of several types including nodular, superficial, morpheaform,
nevoid, and pigmented (2). Nodular
BCC is the most common subtype, comprising 21% of all cases
(3). Although BCC is slow-growing
and rarely metastasize, it is locally invasive and thus may cause
extensive damage to surrounding tissue. Despite effective treatment
via local excision, tumor recurrence is relatively common at 1–10%
(4).
Despite its high prevalence, the etiopathogenesis of
BCC is still unclear. Previous studies have indicated a
multifactorial, polygenic basis for disease. The current model for
BCC pathogenesis maintains that UV radiation causes DNA damage in
exposed cells. If this damage goes unrepaired, the resulting
oncogene-activating or tumor suppressor-inactivating mutations
allow cells to bypass cell cycle regulation and thus undergo
uncontrolled proliferation. The role of UV damage in BCC
pathogenesis is further indicated by the predominant location of
BCC on sun-exposed surfaces, as well as the presence of ‘UV
signature’ mutations (i.e., T → C transversions) in affected cells
(5,6). Other exposures that can predispose to
carcinogenesis are those to arsenicals, polyaromatic hydrocarbons,
immunosuppression, and psoralen therapy (2).
Studies have identified several somatic mutations
associated with the development of BCC (2,5,7–9). Of
note, the presence of mutations in the Patched-1 (PTCH-1) gene has
helped elucidate the role of the sonic hedgehog (SHH) signaling
pathway in pathogenesis. PTCH-1 is an inhibitor of the protein
Smoothened (SMO), whose role is to activate the transcription of
cell cycle regulators like WNT5A. When PTCH-1 activity is lost, SMO
is constitutively activated, allowing uncontrolled cell
proliferation to take place (5). A
loss of function mutation in P53 has also frequently been
associated with BCC as well as many other cancers (6,10).
P53 encodes the protein p53, an established tumor suppressor. This
protein causes cell cycle arrest in the presence of DNA damage,
thereby preventing the replication of damaged genetic material and
allowing either DNA repair or apoptosis to take place.
Genome-wide association studies (GWAS) have been
instrumental in identifying several loci that confer susceptibility
to BCC. These studies report loci associated with BCC and
pigmentation genes (SLC45A2, TYR, MC1R, ASIP) as well as loci
associated with BCC alone (PADI6, RHOU, KLF14, KRT5, TERT/CLPTM1L).
These results support the conclusion that both
pigmentation-independent and pigmentation-dependent pathways exist
in the development of BCC. Although genomic studies and linkage
analyses provide a framework for identifying putative loci, they do
not address the gene expression that underlies disease
pathogenesis.
In this study, we employed microarray analysis to
determine a molecular profile for BCC which was then used to i)
classify samples based on phenotype via hierarchical clustering
methods, ii) identify significantly enriched pathways important to
BCC pathogenesis, and iii) integrate genetic information with our
transcriptional data in order to identify potential genetic risk
factors. Specifically, we obtained a list of differentially
expressed genes (DEGs) from a comparison of lesional vs.
site-matched non-lesional skin samples from patients with a
confirmed diagnosis of nodular basal cell carcinoma. Pathway
analysis of the resulting DEGs identified multiple dysregulated
functional pathways, including those involved in PPAR-γ signaling,
TGF-β signaling, and lipid metabolism. A comparison of our list of
DEGs to molecular profiles in published studies identified several
overlapping genes and pathways of interest in BCC. We further
compared the chromosomal locations of our list of DEGs with
reported genomic susceptibility loci to focus the search for genes
of pathogenetic significance. Furthermore, our analysis identified
potential transcriptional ‘hot spots’ in which there is an enhanced
correlation of significantly altered gene expression at particular
chromosomal locations, areas which may be of particular interest
for future genetic studies. By integrating transcriptional data
with genomic information, our study reveals potential
susceptibility loci/regions associated with BCC in terms of altered
gene expression. Detailed characterization of the genetic and
transcriptional alteration associated with BCC development may lead
to novel therapeutic modalities based on specific genomic and/or
transcriptional targets.
Materials and methods
Patient recruitment and tissue
handling
The study was approved by the Institutional Review
Board of Weill-Cornell Medical College of Cornell University/New
York Presbyterian Hospital (IRB # 0998-398). Subjects diagnosed
with BCC based on established clinical and histological criteria
were recruited through the dermatology outpatient clinic of New
York Presbyterian Hospital. Informed consent was obtained from all
study subjects before 6 mm punch biopsies were performed and
collected. In total, 8 biopsies (4 lesional and 4 site-matched
non-lesional) were used for gene expression analysis of skin from
BCC patients. Specimens were snap frozen in liquid nitrogen
immediately following sampling for subsequent RNA extraction.
Demographic information, duration of disease and treatment history
were obtained from each subject at the time of sampling (see
Table I for details on samples and
patients).
 | Table I.Demographic data for study
participants. |
Table I.
Demographic data for study
participants.
| Patient | Age | Gender | Ethnicity | Diagnosis | Duration |
Location-lesional |
Location-non-lesion |
|---|
| 1003 | 75 | M | Caucasian | BCC-nodular | 3 years | Right back | Right back |
| 1008 | 86 | M | Caucasian | BCC-nodular | 4 months | Left cheek | Left cheek |
| 1053 | 65 | M | Caucasian | BCC-nodular | Unknown | Left
periauricular | Left
periauricular |
| 1055 | Unknown | M | Caucasian | BCC-nodular | Unknown | Face | Face |
RNA extraction and cRNA production
Total RNA was isolated using TRIzol reagent
(Invitrogen Corp., Carlsbad, CA) following the manufacturer’s
protocol. RNA was subsequently purified using an RNeasy Mini Kit
(Qiagen Inc., Valencia, CA). A cDNA template was synthesized from
16 μg of total RNA from each sample, and then used for
biotinylated cRNA generation.
Microarray analysis
Fragmented cRNA was hybridized to Human Genome
U95Av2 microarrays (Affymetrix Inc., Santa Clara, CA) for 16 h at
45°C. The chips were then washed, stained and scanned according to
manufacturer’s protocol (Affymetrix Inc.). The U95Av2 chip contains
almost 63,000 probe sets representing approximately 54,000 UniGene
clusters and over 10,000 full-length genes (http://media.affymetrix.com/support/technical/datasheets/made_datasheet.pdf).
The resulting data were analysed using the
Bioconductor packages in the R statistical computing environment
for data processing (11). For
data quality control, we used the Simpleaffy package to remove
samples that failed in a variety of QC metrics for assessing the
RNA quality, sample preparation and hybridization (12). This led to 8 samples for further
microarray data analysis. The MAS5.0 function was used to generate
expression summary values, followed by trimmed mean global
normalization to bring the mean expression values of all eight
arrays to the same scale. Then, we filtered out the genes whose
expression-status was called absent (i.e., indistinguishable from
the background intensity) across >50% of both tumor and normal
groups. About 5,918 genes passed the quality filtering for
downstream analysis.
We then performed the comparisons between tumor
group and normal group. We used the Limma program in the
Bioconductor package to calculate the level of gene differential
expression (13). Briefly, a
linear model with paired design matrix was fit to the data. The
false discovery rate approach of Benjamini and Hochberg was used to
adjust multiple comparisons (14).
At the FDR of 0.1, we obtained the list of differentially expressed
genes (DEGs) with at least 2-fold changes.
Following single gene-based significance testing, we
used the expression value of DEGs to cluster the patients. Our
purpose was to determine whether the identified DEGs were able to
serve as a gene signature to classify samples into their
corresponding phenotype groups. A hierarchical clustering algorithm
based on the average linkage of Pearson Correlation was employed
(15). Pathway analysis was
performed using NIH DAVID Tools (16). The statistical significance was
calculated using the Hypergeometric test in which the null
hypothesis is that no difference exists between the number of genes
falling into a given pathway in the target DEG list and the genome
as a whole. A list of enriched KEGG pathways with p-values <0.05
and including at least 4 genes was kept.
Results
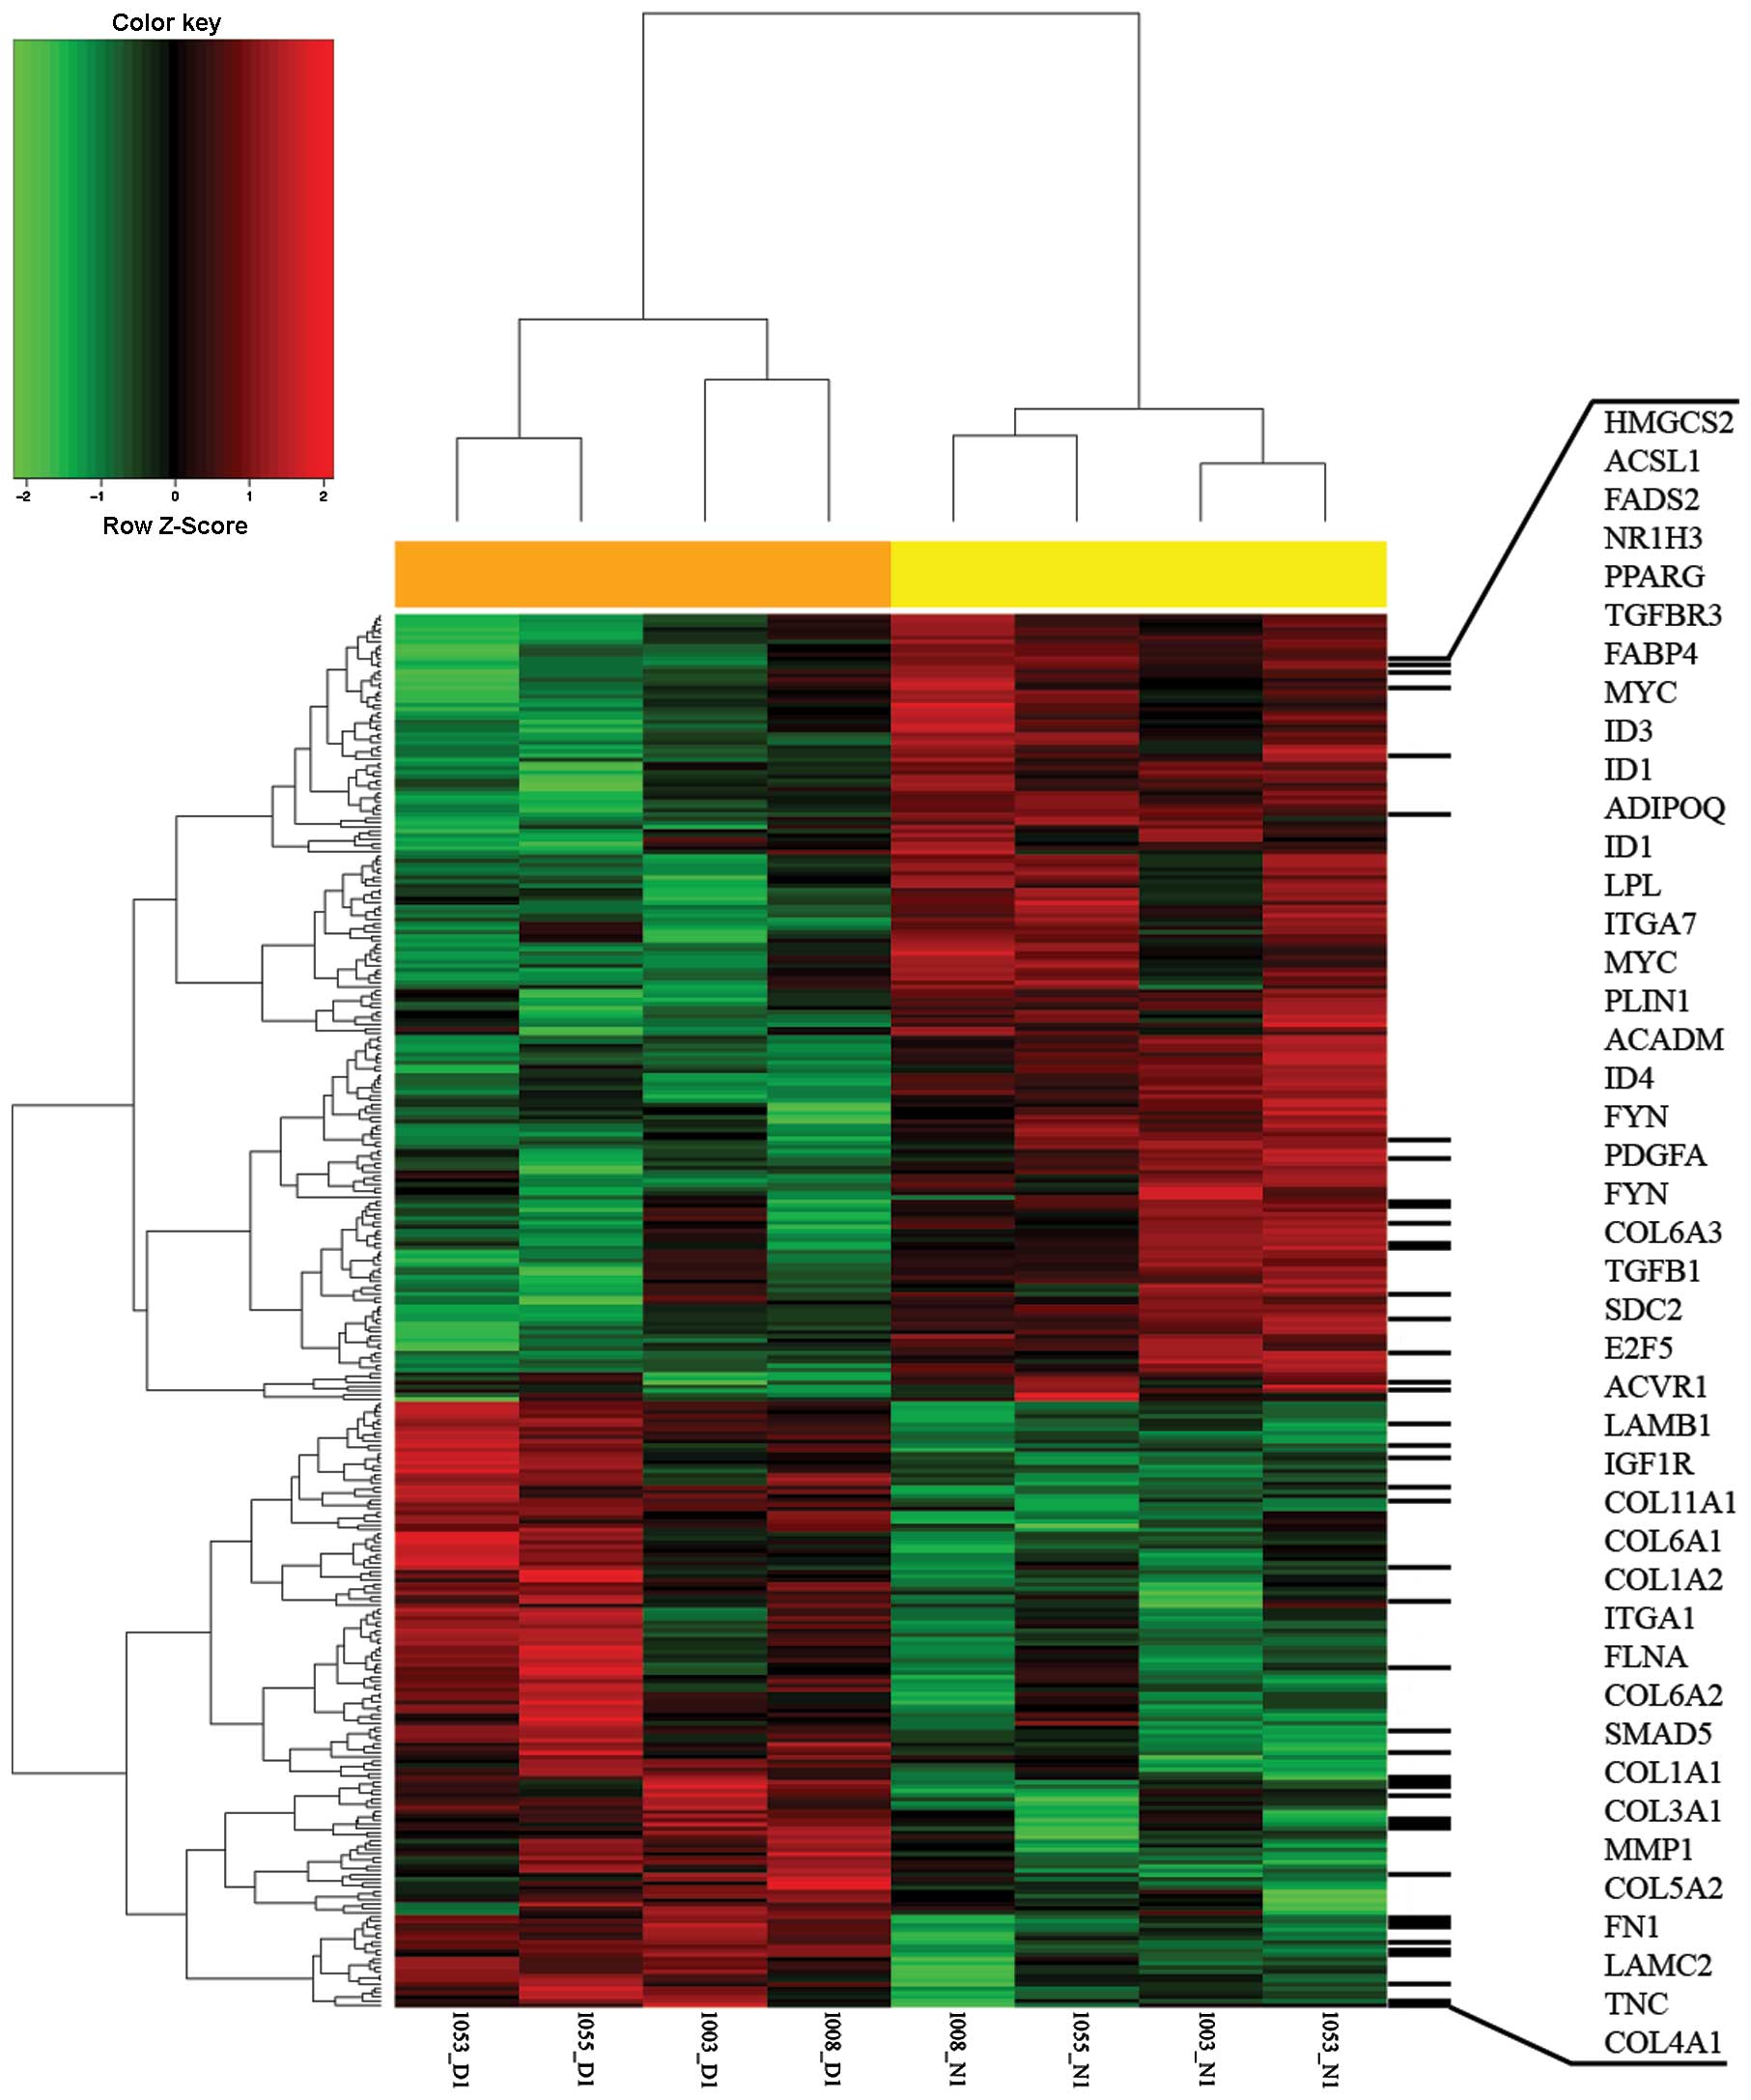
Hierarchical clustering separates samples
by disease status
A total of 8 skin biopsies from patients with
nodular BCC, lesional (n=4) and non-lesional (n=4), were analysed
using Affymetrix Human Genome U95A2 microarray chips (Affymetrix)
to generate gene expression profiles (see Table I for details on samples and
patients). We performed the comparison of expression profiles
between the tumor and normal groups. At the false discovery rate of
0.1, we identified a total of 331 differentially expressed genes
(DEGs) with at least 2-fold expression changes. 144 DEGs are
upregulated (fold changes ranging from +2.0 to +53.1) in the tumor
group while 187 genes are down-regulated (fold changes ranging from
−2.0 to −32.7). Hierarchical clustering of obtained DEGs was
performed, which separates the 8 samples into their corresponding
phenotype groups (Fig. 1).
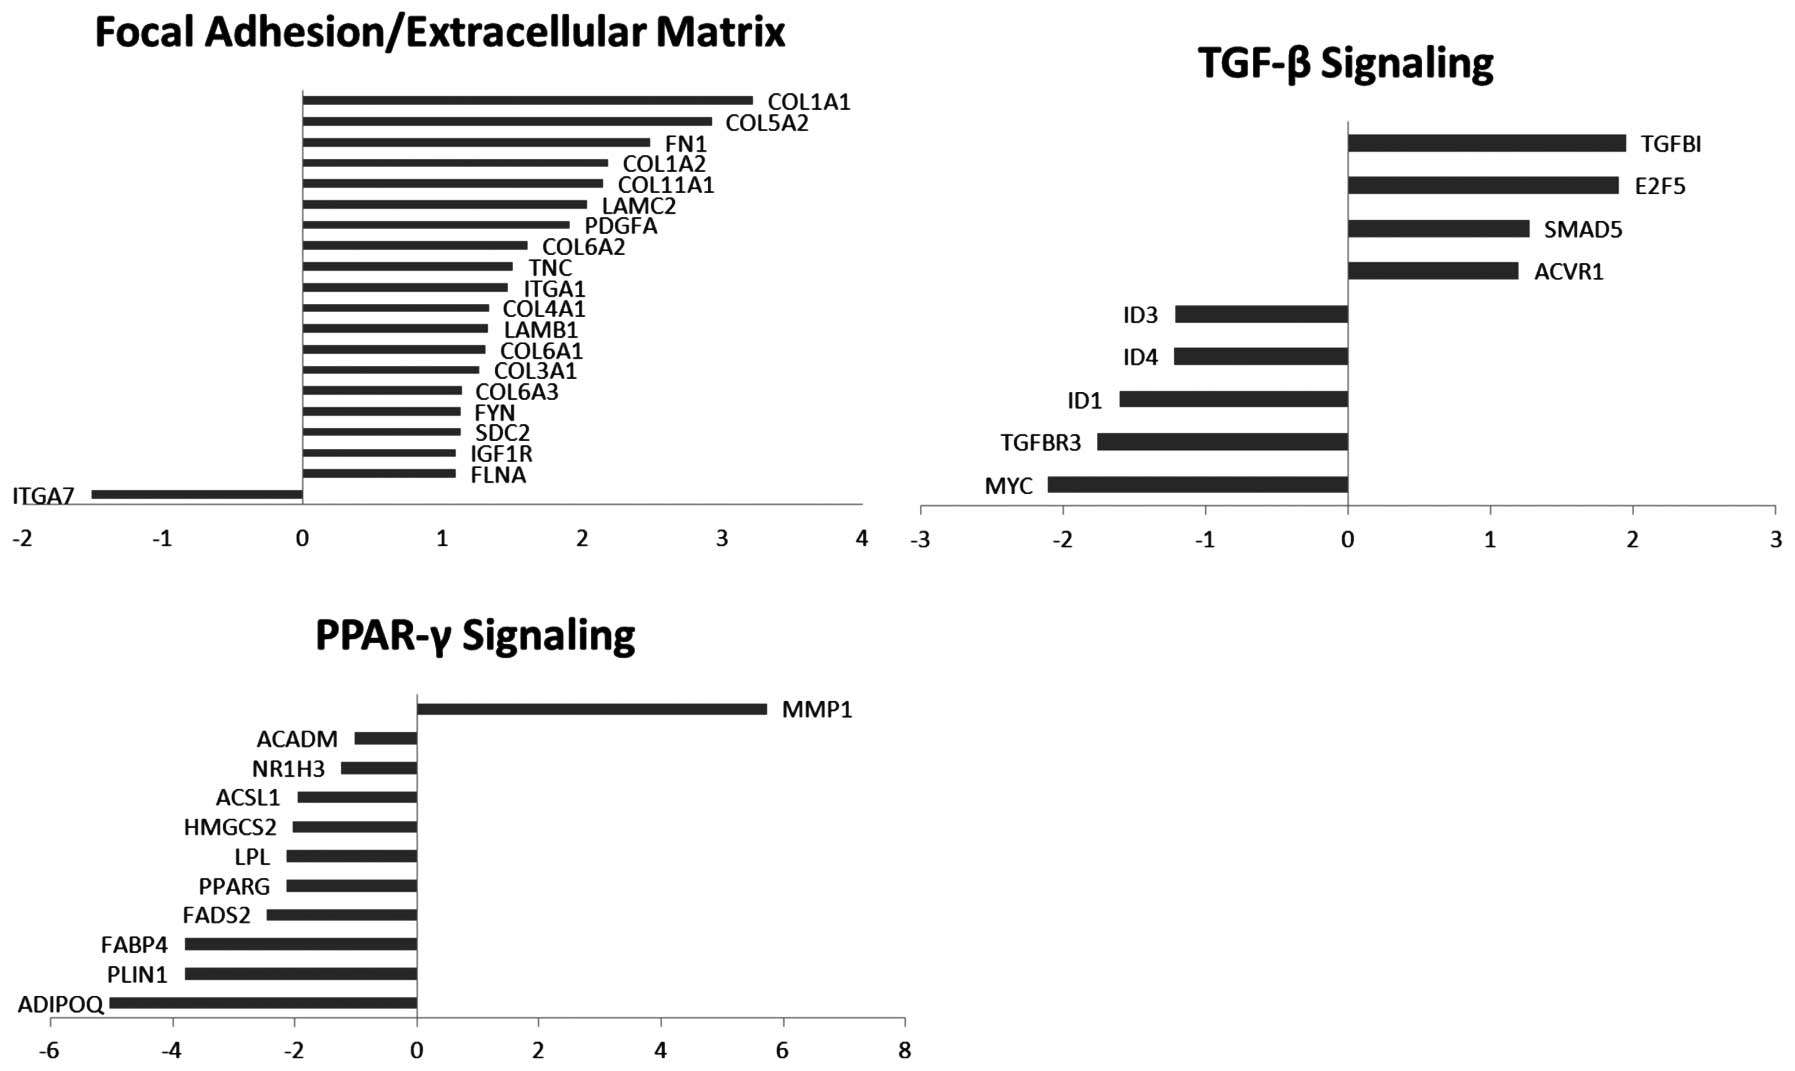
Functional analysis reveals dysregulation
of genes involved in multiple pathways
To explore the key biological processes altered in
the tumor vs non-tumor control samples, we performed enrichment
tests to identify the significantly overrepresented canonical
pathways among the differentially expressed genes. Functional
annotation and pathway analysis were performed using the database
for annotation, visualization, and integrated discovery (DAVID) and
Pubmed literature searches (Table
II). The pathways enriched in the differentially expressed
genes include cell-cell interactions such as focal adhesion (19
genes) and ECM-receptor interaction (16 genes), PPAR signaling
pathway (11 genes) and TGF-β signaling pathway (7 genes), terpenoid
backbone biosynthesis (6 genes), and fatty acid metabolism (5
genes). Our analysis revealed, with the exception of one gene
(MMP-1), the downregulation of DEGs falling within the PPAR-γ
signaling pathway. The downregulation was also seen in DEGs
involved in fatty acid metabolism, and terpenoid backbone
biosynthesis. Additionally, the DEGs pertaining to focal adhesion
and cell-cell interactions are mostly upregulated, with the
exception of one gene (ITGA7) (Fig.
2).
| Table II.Enriched canonical pathways in the
differentially expressed genes (DEGs) obtained from the comparison
of lesional versus site-matched, non-lesional samples using DAVID
and Pubmed literature searches. |
Table II.
Enriched canonical pathways in the
differentially expressed genes (DEGs) obtained from the comparison
of lesional versus site-matched, non-lesional samples using DAVID
and Pubmed literature searches.
| Pathway name | DEGs counts | P-value |
|---|
| hsa4510: focal
adhesionb | 19 | 0.000250723 |
| hsa4512:
ECM-receptor interactiona | 16 | 9.85082E-08 |
| hsa3320: PPAR
signaling pathway | 11 | 2.28729E-06 |
| hsa4350: TGF-beta
signaling pathway | 7 | 0.0415292 |
| hsa900: terpenoid
backbone biosynthesisb | 6 | 2.28729E-06 |
| hsa280: valine,
leucine and isoleucine degradation | 6 | 0.005172845 |
| hsa71: fatty acid
metabolism | 5 | 0.017984405 |
| hsa100: steroid
biosynthesisa | 5 | 0.000298256 |
| hsa1040:
biosynthesis of unsaturated fatty acids | 5 | 0.004048771 |
| hsa260: glycine,
serine, and threonine degradation | 4 | 0.068063005 |
| hsa650: butanoate
metabolism | 4 | 0.084866208 |
Comparison of DEGs across microarray
studies reveals overlapping genes/pathways of interest
To evaluate potential consensus genes associated
with BCC pathogenesis, we compared our list of DEGs to four
previously published microarray studies regarding gene expression
in BCC (17–20). In our analysis, we excluded Yu
et al due to significant methodological differences.
Specifically, the authors compared molecular profiles between
different BCC subtypes and not between tumor (without subtype
distinction) and normal skin. We first examined data from Howell
et al, as their study used site-matched non-lesional samples
as controls (Table III, second
left-most column). Comparing our data to a similarly conducted
study allowed us to minimize the presence of potentially
confounding experimental design and technical variances. Twenty-six
DEGs were found to overlap between our study and Howell et
al; 8 genes were upregulated in the same direction (MDK, LUM,
COL4A1, CDH11, DUSP10, COL5A2, STAT1, and SDC2), 14 genes were
downregulated in the same direction (NR4A1, CYB5A, APOC1, DHCR24,
PLA2G2A, FDPS, PPARG, ADH1B, HMGCR, DUSP1, PLA2G7, LPL, FABP4, and
ALDH1A1) and 4 genes were differentially expressed in opposite
directions (UBE2D1, KRT7, KRT18 and DAPK1). Pathway analysis
revealed genes that were differentially expressed in processes such
as PPAR-γ signaling, cell-cell interaction, terpenoid backbone
biosynthesis, and MAPK signaling.
| Table III.List of DEGs overlapping with at
least one other study. DEGs are organized by gene expression in the
same or opposite direction. |
Table III.
List of DEGs overlapping with at
least one other study. DEGs are organized by gene expression in the
same or opposite direction.
| Howell et
al(18) | O’Driscoll et
al(19) | Asplund et
al(17) | Total |
|---|
| Total no. of DEGs
investigated | 249 | 3922 | 361 | 4521 |
| No. of overlapping
DEGs (up, down, opposite directions) | 26 (8, 14, 4) | 149 (80, 66,
3) | 18 (12, 6, 0) | 193 (100, 86,
7) |
| Overlapping DEGs
upregulated in the same direction | MDK | HTRA1 | SFRS7 | GPR161 | |
| LUM | MDK | MYCN | SOX4 | |
| COL4A1 | MICAL2 | MYO1B | ACVR1 | |
| CDH11 | TSPAN4 | COL5A2 | BASP1 | |
| DUSP10 | SSPN | ACVR1 | CHST2 | |
| COL5A2 | RECQL | FN1 | DYRK2 | |
| STAT1 | DYRK2 | COL6A3 | LAMB1 | |
| SDC2 | ZFC3H1 | WNT5A | NFIB | |
| LUM | SLCO2A1 | SPARC | |
| PLXNC1 | CHST2 | SHOX2 | |
| COL4A1 | SHOX2 | SDC2 | |
| SLC7A8 | ADAMTS3 | TUSC3 | |
| DIO2 | BASP1 | | |
| CHGA | LPCAT1 | | |
| SH3GL3 | F2R | | |
| CSPG4 | TNPO1 | | |
| IGF1R | VCAN | | |
| CDH3 | C5orf13 | | |
| CDH11 | TGFBI | | |
| CDH13 | DBN1 | | |
| TOP2A | TRAM2 | | |
| VEZF1 | SOX4 | | |
| BPTF | AEBP1 | | |
| SLC16A3 | PDGFA | | |
| EMP3 | CALD1 | | |
| COL11A1 | SLC39A14 | | |
| LRP8 | LOXL2 | | |
| PHC2 | TUSC3 | | |
| MARCKSL1 | SDC2 | | |
| STMN1 | NFIB | | |
| MFAP2 | PTCH1 | | |
| GPR161 | TNC | | |
| LAMC2 | DAPK1 | | |
| DUSP10 | TRO | | |
| PARP1 | MAGED1 | | |
| NID1 | AP1S2 | | |
| CEP170 | HEPH | | |
| NINL | TMSB15A | | |
| COL6A2 | FLNA | | |
| MMP11 | BGN | | |
| Overlapping DEGs
down-regulated in the same direction | NR4A1 | AKR1C1 | | ABCC3 | |
| CYB5A | AKR1C2 | BTG2 | FCGBP | |
| APOC1 | AKR1C3 | CHI3L | ALOX15B | |
| DHCR24 | IDI1 | GNPAT | GHR | |
| PLA2G2A | C10orf116 | C2CD2 | MGST2 | |
| FDPS | ALDH3B2 | TST | NTRK2 | |
| PPARG | DHCR7 | HIBCH | | |
| ADH1B | GAL | TKT | | |
| HMGCR | EXPH5 | | | |
| DUSP1 | CRYAB | ABHD5 | | |
| PLA2G7 | ZBTB16 | MGST2 | | |
| LPL | ITGA7 | SC4MOL | | |
| FABP4 | ENDOU | ACSL1 | | |
| ALDH1A1 | METTL7A | HMGCS1 | | |
| EFNB2 | PAPD7 | | |
| CKB | SRD5A1 | | |
| CA12 | HMGCR | | |
| MEF2A | WWC1 | | |
| SHMT1 | ELOVL5 | | |
| ACADVL | CDKN1A | | |
| ALOX15B | PLA2G7 | | |
| TOB1 | FKBP5 | | |
| ABCC3 | ID4 | | |
| ABCA8 | GPR126 | | |
| OSBPL1A | COBL | | |
| CYB5A | AZGP1 | | |
| LDLR | INSIG1 | | |
| ECH1 | FABP4 | | |
| BLVRB | MYC | | |
| DHCR24 | PLIN2 | | |
| TGFBR3 | NTRK2 | | |
| PMVK | CRAT | | |
| FDPS | EBP | | |
| | MAOA | | |
| | NSDHL | | |
| Overlapping DEGs
expressed in opposite directions | UBE2D1 | FOSB | | | |
| KRT7 | CYR61 | | | |
| KRT18 | DICER1 | | | |
| DAPK1 | | | | |
We also compared our data more broadly with combined
data from Howell et al(18)
as well as with O’Driscoll et al(19), and Asplund et al(17), disregarding certain methodological
differences. A total of 1842 DEGs were compared and 193 genes were
found to overlap with at least one other study (Table III). 186 DEGs were dysregulated in
the same direction (100 upregulated and 86 downregulated) while 7
genes were differentially expressed in opposite directions (FOSB,
CYR61, DICER1, UBE2D1, KRT7, KRT18 and DAPK1). Pathway analysis of
these DEGs revealed a dysregulation of the genes involved in focal
adhesion, extracellular matrix-receptor interaction, terpenoid
backbone biosynthesis, and steroid biosynthesis, which overlapped
with a large number of pathways derived from analysis of our DEGs.
Thirteen DEGs overlapped across three studies, including our own
(Table IV). Functional annotation
and pathway analysis revealed that 5 of the 13 DEGs were involved
in either cell-cell interaction or terpenoid backbone
biosynthesis.
| Table IV.DEGs overlapping across 3 studies
[this study; Howell et al, 2005 (18); O’Driscoll et al, 2006
(19)]. |
Table IV.
DEGs overlapping across 3 studies
[this study; Howell et al, 2005 (18); O’Driscoll et al, 2006
(19)].
| Gene symbol | Entrez gene | Gene title | Chromosomal
location | Fold change |
|---|
| MDK | 4192 | Midkine (neurite
growth-promoting factor 2) | chr11p11.2 | 1.669 |
| LUM | 4060 | Lumican | chr12q21.3-q22 | 1.925 |
| COL4A1 | 1282 | Collagen, type IV,
alpha 1 | chr13q34 | 1.333 |
| CDH11 | 1009 | Cadherin 11, type
2, OB-cadherin (osteoblast) | chr16q22.1 | 1.740 |
| DUSP10 | 11221 | Dual specificity
phosphatase 10 | chr1q41 | 2.222 |
| COL5A2 | 1290 | Collagen, type V,
alpha 2 | chr2q14–q32 | 2.926 |
| SDC2 | 6383 | Syndecan 2 | chr8q22–q23 | 1.128 |
| DAPK1 | 1612 | Death-associated
protein kinase 1 | chr9q34.1 | 1.355 |
| DHCR24 | 1718 |
24-dehydrocholesterol reductase | chr1p33-p31.1 | −1.407 |
| FDPS | 2224 | Farnesyl
diphosphate synthase (farnesyl pyrophosphate synthetase,
dimethylallyltranstransferase, geranyltranstransferase) | chr1q22 | −1.460 |
| HMGCR | 3156 |
3-hydroxy-3-methylglutaryl-CoA
reductase | chr5q13.3–q14 | −1.063 |
| PLA2G7 | 7941 | Phospholipase A2,
group VII (platelet-activating factor acetylhydrolase, plasma) | chr6p21.2-p12 | −1.103 |
| FABP4 | 2167 | Fatty acid binding
protein 4, adipocyte | chr8q21 | −3.797 |
DEGs and transcriptional ‘hot spots’ map
to several genetic susceptibility loci/regions
We have mapped chromosomal locations for the top 20
upregulated and downregulated DEGs identified in our study
(Table V). We then compared
chromosomal locations of DEGs with putative BCC susceptibility loci
previously reported in genome-wide association and linkage studies,
as well as regions where somatic mutations, determined either in
human subjects or murine models, have been implicated in the
pathophysiology of BCC (Table VI).
A total of 62 DEGs, 25 upregulated and 37 downregulated, were
mapped to these regions.
| Table V.The 20 most A) upregulated and B)
downregulated genes. |
Table V.
The 20 most A) upregulated and B)
downregulated genes.
A)
|
|---|
| Gene symbol | Entrez gene | Gene title | Chromosomal
location | Fold change |
|---|
| MMP1 | 4312 | Matrix
metallopeptidase 1 (interstitial collagenase) | chr11q22.3 | 53.059 |
| CHGA | 1113 | Chromogranin A
(parathyroid secretory protein 1) | chr14q32 | 32.067 |
| MYCN | 4613 | v-myc
myelocytomatosis viral related oncogene, neuroblastoma derived
(avian) | chr2p24.1 | 16.000 |
| LRP8 | 7804 | Low density
lipoprotein receptor-related protein 8, apolipoprotein e
receptor | chr1p34 | 12.502 |
| ADAMTS3 | 9508 | ADAM
metallopeptidase with thrombospondin type 1 motif, 3 | chr4q13.3 | 12.369 |
| COL1A1 | 1277 | Collagen, type I,
alpha 1 | chr17q21.33 | 9.318 |
| MMP11 | 4320 | Matrix
metallopeptidase 11 (stromelysin 3) |
chr22q11.2
22q11.23 | 7.950 |
| COL5A2 | 1290 | Collagen, type V,
alpha 2 | chr2q14–q32 | 7.600 |
| VCAN | 1462 | Versican | chr5q14.3 | 6.544 |
| VCAN | 1462 | Versican | chr5q14.3 | 6.039 |
| FN1 | 2335 | Fibronectin 1 | chr2q34 | 5.588 |
| PTCH1 | 5727 | Patched homolog 1
(Drosophila) | chr9q22.3 | 5.506 |
| F2R | 2149 | Coagulation factor
II (thrombin) receptor | chr5q13 | 5.348 |
| MDK | 4192 | Midkine (neurite
growth-promoting factor 2) | chr11p11.2 | 5.273 |
| TMSB15A | 11013 | Thymosin beta
15a |
chrXq21.33–q22.3 | 5.202 |
| VCAN | 1462 | Versican | chr5q14.3 | 5.109 |
| GPR161 | 23432 | G protein-coupled
receptor 161 | chr1q24.2 | 5.091 |
| SH3GL3 | 6457 | SH3-domain
GRB2-like 3 | chr15q24 | 4.808 |
| FAP | 2191 | Fibroblast
activation protein, alpha | chr2q23 | 4.680 |
| SHOX2 | 6474 | Short stature
homeobox 2 | chr3q25–q26.1 | 4.665 |
B)
|
|---|
| Gene symbol | Entrez gene | Gene title | Chromosomal
location | Fold change |
|---|
| ADIPOQ | 9370 | Adiponectin, C1Q
and collagen domain containing | chr3q27 | 0.031 |
| NR4A1 | 3164 | Nuclear receptor
subfamily 4, group A, member 1 | chr12q13 | 0.048 |
| PLIN1 | 5346 | Perilipin 1 | chr15q26 | 0.072 |
| FABP4 | 2167 | Fatty acid binding
protein 4, adipocyte | chr8q21 | 0.072 |
| IL6 | 3569 | Interleukin 6
(interferon, beta 2) | chr7p21 | 0.07 |
| SCGB2A2 | 4250 | Secretoglobin,
family 2A, member 2 | chr11q13 | 0.076 |
| HSD3B1 | 3283 |
Hydroxy-delta-5-steroid dehydrogenase, 3
beta- and steroid delta-isomerase 1 | chr1p13.1 | 0.085 |
| ALOX15B | 247 | Arachidonate
15-lipoxygenase, type B | chr17p13.1 | 0.091 |
| MYH11 | 4629 | Myosin, heavy chain
11, smooth muscle | chr16p13.11 | 0.099 |
| ADH1B | 125 | Alcohol
dehydrogenase 1B (class I), beta polypeptide | chr4q21-q23 | 0.105 |
| G0S2 | 50486 | G0/G1switch 2 | chr1q32.2 | 0.108 |
| TCHH | 7062 | Trichohyalin | chr1q21.3 | 0.109 |
| TIMP4 | 7079 | TIMP
metallopeptidase inhibitor 4 | chr3p25 | 0.115 |
| MYH11 | 4629 | Myosin, heavy chain
11, smooth muscle | chr16p13.11 | 0.118 |
| GPD1 | 2819 |
Glycerol-3-phosphate dehydrogenase 1
(soluble) | chr12q12–q13 | 0.119 |
| ZBTB16 | 7704 | Zinc finger and BTB
domain containing 16 | chr11q23.1 | 0.119 |
| CA6 | 765 | Carbonic anhydrase
VI | chr1p36.2 | 0.121 |
| FOSB | 2354 | FBJ murine
osteosarcoma viral oncogene homolog B | chr19q13.32 | 0.122 |
| PDZK1 | 5174 | PDZ domain
containing 1 | chr1q21 | 0.138 |
| MYH11 | 4629 | Myosin, heavy chain
11, smooth muscle | chr16p13.11 | 0.142 |
| Table VI.Transcriptionally dysregulated genes
within A) putative BCC susceptibility loci, and B) within loci of
known causative somatic gene mutations in BCC. |
Table VI.
Transcriptionally dysregulated genes
within A) putative BCC susceptibility loci, and B) within loci of
known causative somatic gene mutations in BCC.
A)
|
|---|
| Chromosomal
locus | Refs. | Mapped genes |
|---|
| 1p36 | (61) | MFAP2, STMN1,
ID3, CA6 |
| 1q42 | (61) | PARP1,
GNPAT |
| 5p13.3 | (55,58,62,68) | GHR, HMGCS1 |
| 5p15.33 | (60,62) | PAPD7,
SRD5A1, BASP1, LPCAT1 |
| 7q32 | (60) | BPGM |
| 9p23 | (60) | ACO1 |
| 12q11–13 | (60) | KRT7, GPD1,
ITGA7, AQP5, KRT18, NR4A1, ENDOU, METTL7A, PPP1R1A |
| 13q32 | (59) | CLDN10 |
| 14q32 | (69) | CHGA, CKB,
DICER1 |
| 16q24.3 | (52,54,56,58,68,70,71) | CDH13 |
| 19q13 | (72,73) | BCAT2, FCGBP,
COX7A1, ECH1, ZFP36, BLVRB, PLD3, PPP1R15A, APOC1, APOE,
EMP3, FOSB, ZNF135 |
| 20q11.2–12 | (52,54,58,68,70,74) | ID1 |
B)
|
|---|
| Chromosomal
locus | Refs. | Mapped genes |
|---|
| 1p34-PTCH2 | (75,76) | LRP8, PHC2 |
| 2q14-Gli2 | (77) | MYO1B, COL5A2 |
| 5q13-RASA1 | (78) | F2R, TNPO1, AGGF1,
HMGCR |
| 9q22-PTCH1 | (79,80) | NFIL3,
NTRK2, PTCH1, FBP1 |
| 10q24-SUFU | (81) | IFIT3, PLAU,
PPP1R3C |
| 17p13-p53 | (82) | ACADVL, ALOX15B,
PER1, C17orf91 |
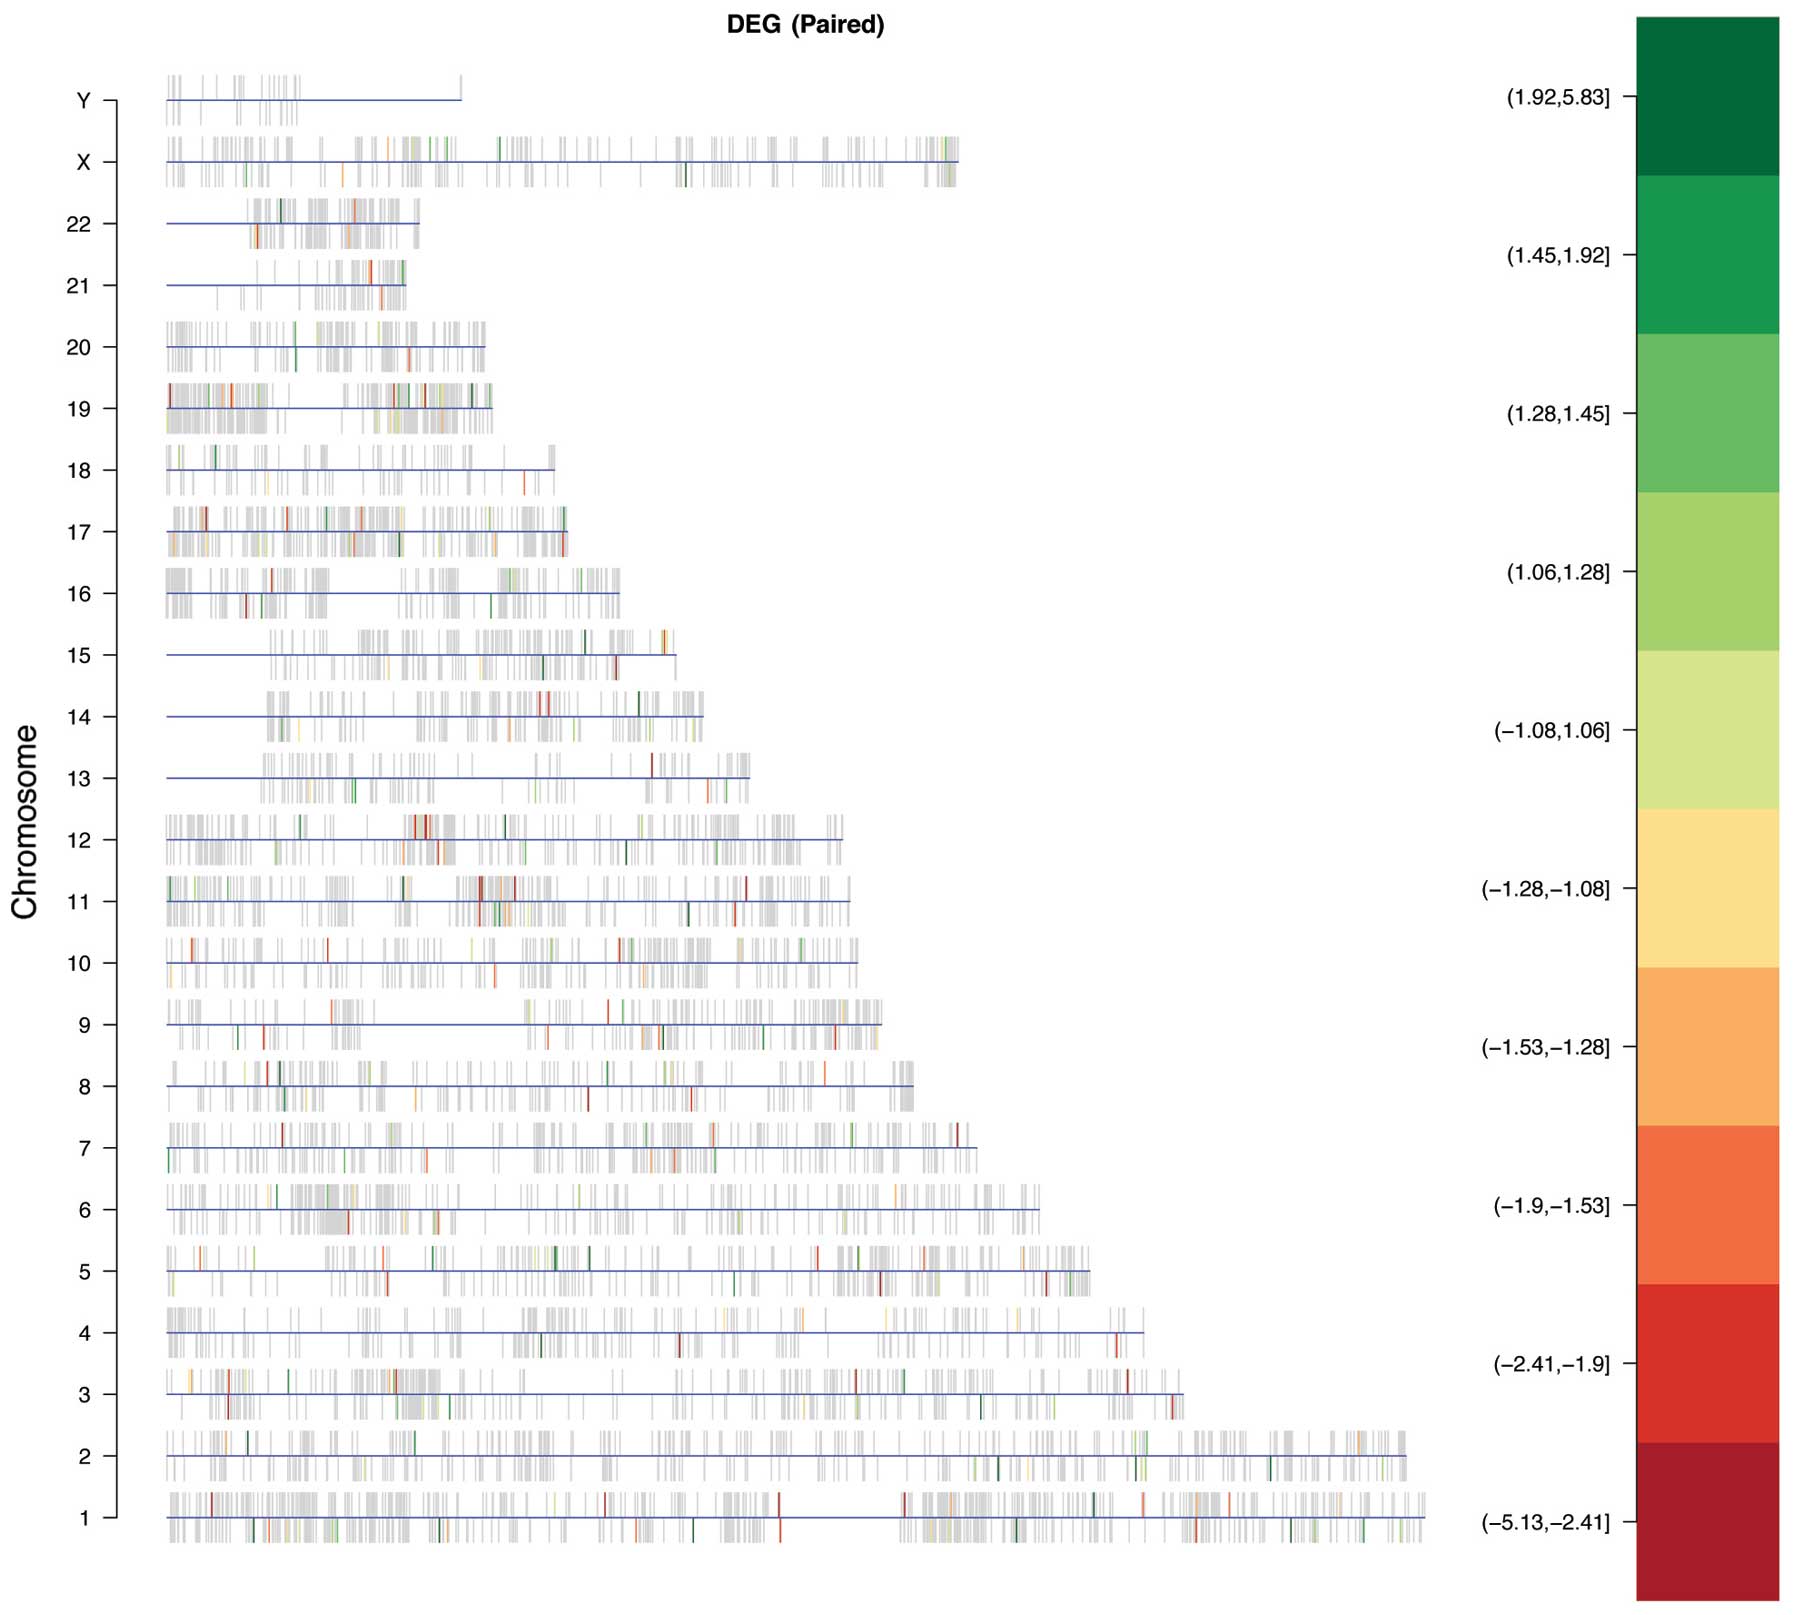
Next, we examined our gene expression data to
identify chromosomes with a significant enrichment of DEGs. A
statistically significant over-representation of DEGs was found on
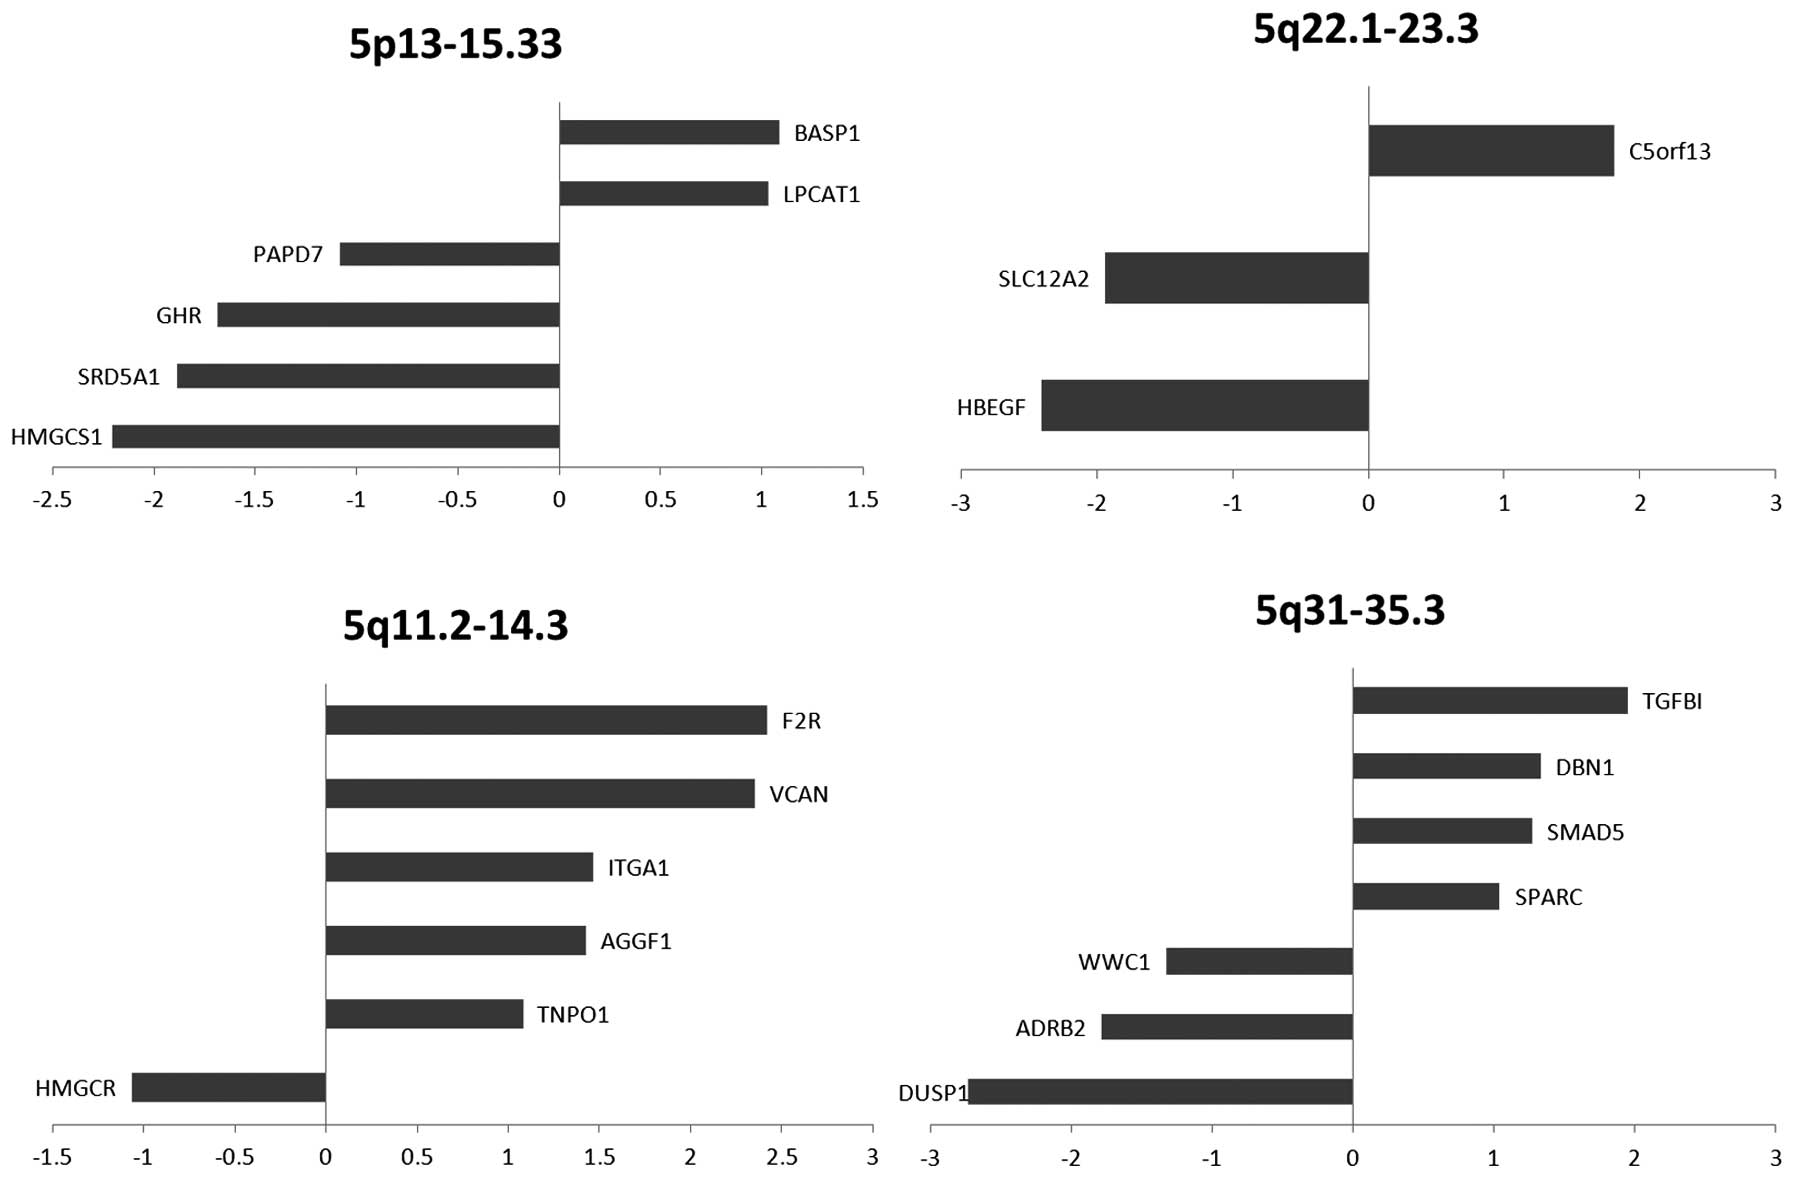
chromosome 5 (odds ratio=1.65, P=0.025) (Fig. 3). The location of DEGs within
chromosome 5 includes 5p13–15.33, 5q11.2–14.3, 5q22.1–23.3, and
5q31–35.3 (Fig. 4), which contain
22 DEGs (12 upregulated, 10 downregulated). The transcriptional
‘hot spots’ on 5p13 and 5p15 were also identified in recent BCC
genome-wide association studies. The 5q11.2–14.3, the 5q22.1–23.3
and the 5q31–35.3 regions represent novel chromosomal locations
with potential relevance to BCC that may warrant further genetic
investigation.
Discussion
Although BCC has been investigated at both the
genetic and transcriptional levels, many details related to
pathogenetic events remain unknown. To help elucidate the links
between the genetic factors and altered gene expression that impact
tumor development, we performed gene expression analysis to define
a BCC associated transcriptional profile.
Our analysis was conducted using 8 samples, with 4
lesional samples and 4 site-matched non-lesional controls. We
utilized a site-matched, pair-wise study design to eliminate
variance due to differences in gene expression between individuals.
This approach allowed us to focus directly on transcriptional
alterations between tumor and non-tumor tissues without the
aforementioned confounding variables. Further studies investigating
differences between non-lesional skin in patients with BCC and skin
of healthy individuals may provide additional insight into
underlying genetic contributions to BCC. While differences in
sample preparation, sample type, microarray platform, and
analytical software present complicating factors in comparative
analysis, our results do overlap with several DEGs reported in
three previous microarray studies (Tables III and IV).
Hierarchical clustering of obtained DEGs revealed
that samples could be distinguished by disease status, with disease
and control samples separating into discrete groups. The
establishment of a BCC tumor expression signature may be useful for
the development of molecular diagnostic modalities in BCC, and
extended transcriptional profiles could allow classification of
newly diagnosed BCC into specific subtypes (i.e. nodular,
morpheaform, and superficial) as an addition to standard clinical
and pathological criteria. In the future, it may be possible to
classify patients into subgroups according to predicted therapeutic
efficacy or risk of recurrence, thereby improving patient
outcomes.
Functional analysis of our data revealed
transcriptional dysregulation in multiple pathways affecting PPAR-γ
signaling, lipid metabolism, TGF-β signaling, cell-cell
interactions, as well as many others, with intriguing implications
regarding cancer pathogenesis and localizing potential therapeutic
targets. For example, recent research into the PPAR-γ signaling has
elucidated its role in a variety of cellular processes. PPAR-γ is a
receptor whose ligands include steroid, hormones, and retinoids
(21–23). Once activated, PPAR-γ dimerizes
with the retinoid X receptor to activate transcription of genes
involved in lipid metabolism and differentiation. In our study,
there was a downregulation of PPAR-γ as well as its transcriptional
target genes (ADIPOQ, FABP4, PLIN1, LPL, ACS, NR4A1, FADS2,
HMGCS1), indicating aberrant PPAR-γ signaling in our samples. Our
analysis also revealed transcriptional dysregulation in pathways
regarding lipid metabolism, unsaturated fatty acid biosynthesis,
steroid biosynthesis as well as terpenoid backbone biosynthesis.
Whether these processes are a cause or consequence of PPAR-γ
signaling dysregulation remains to be determined.
Interestingly, the PPAR-γ signaling pathway has been
implicated in a variety of cancers, including, but not limited to,
bladder cancers, colon cancers, squamous cell carcinomas and
melanomas (21,22,24–26).
PPAR-γ has been shown to be down-regulated in certain tumors
(27,28); however, other studies have shown an
upregulation of PPAR-γ in other malignancies (29–31).
These discrepancies warrant further investigation on the role of
PPAR-γ in specific tumors. PPAR-γ activation has been implicated in
reducing cell proliferation and/or inducing apoptosis in a wide
array of cancer cell lines. In vitro studies on lung cancer
cell lines have shown that PPAR-γ activation acts to reduce cell
growth by promoting differentiation (32). Some transcriptional target genes
have been identified as prognostic factors for certain tumors. Of
note, fatty acid binding protein 4 (FABP4) expression has been
shown to correlate with bladder cancer progression (33). FABP4 plays a role in signal
transduction, affects glucose and lipid metabolism, and potentiates
apoptosis (34). Decreased levels
of FABP4 denoted a worse prognosis in patients with bladder tumors.
Our study revealed a decreased expression of FABP4. Future studies
may indicate if transcriptional levels of FABP4 can be used as an
indicator of cancer progression in basal cell carcinoma.
Although transcriptional dysregulation of the PPAR
signaling pathway has been established in a variety of tumors, our
study represents aberrant signaling in basal cell carcinomas. The
PPAR-γ signaling pathway represents an intriguing therapeutic
target, as PPAR-γ activation via pharmaceuticals has been used in
studies to investigate cancer treatment. In vitro use of
thiazolidinediones (TZD), such as rosiglitazone and troglitazone,
demonstrated anti-proliferative, pro-apoptotic, and
differentiation-promoting effects (21,26).
Future experiments using PPAR-γ agonists on mouse models as well as
BCC cell lines may elucidate more clues on the pathogenesis of the
disease and help develop novel therapeutic options for patients
with basal cell carcinoma.
Our data confirm certain well-established genetic
mechanisms underlying BCC pathogenesis. The sonic hedgehog (Shh)
signaling pathway is often cited as an important player in disease
development (2,5,7,8).
Several genes in the Shh pathway can be found amongst the DEGs in
our list. Our analysis revealed the upregulation of PTCH-1, a
primary mediator of the Shh pathway. When not bound by Shh, PTCH-1
inhibits Smoothened, thus preventing signal transduction and
transcription of downstream target genes. Among these target genes
are PTCH-1 for negative feedback, GLI1 for positive feedback,
WNT5A, a gene involved in differentiation, and MYCN, a gene
associated with the development of neuroblastomas. When inhibition
of Smoothened is lost due to mutation, transcription of target
genes can occur constitutively and therefore promote disease
initiation and progression (35).
Given that our results reveal upregulation of PTCH1, WNT5A, and
MYCN, this constitutive activation seems likely. Additionally,
several DEGs share the same chromosomal locations as established
genes of interest in BCC pathogenesis such as PTCH1, SUFU, PTCH2,
and Gli2 (Table VI), thus
reinforcing their putative role as genetic susceptibility loci.
P53, a tumor suppressor protein responsible for cell
cycle arrest in the presence of DNA damage has been implicated in a
multitude of cancers, including BCC (9,10,36,37).
Our results show that four downregulated DEGs share the same
chromosomal location as p53 (Table
VI), indicating that 17p13 may in fact be an important
susceptibility locus for BCC. Additionally, two other DEGs confirm
the importance of p53 in BCC pathogenesis. The first, CDKN1A,
encodes p21, a cyclin dependent kinase inhibitor and major mediator
of the p53 pathway. Because p21 is tightly regulated by p53, the
downregulation of CDKN1A may indicate the presence of a mutation in
the tumor suppressor gene (38).
P53 also plays an important role in the regulation of MMP1, a
degradative enzyme family member that breaks down the extracellular
matrix during tissue development, remodeling, and repair (37). In our list of DEGs, MMP1 was
upregulated. Given that p53 downregulates MMP1, this may again
reflect a gene mutation. MMP1 is also important in tumor
progression through its role in the stimulation of tumor-induced
angiogenesis and local tissue invasion. The concomitant
downregulation of TIMP4, a family member of MMP inhibitors whose
down-regulation has been associated with excessive ECM degradation
(39), may also contribute to
tumor growth and invasion.
Several physiological mechanisms appear to be
activated in order to counteract the pathological state in BCC. Our
analysis reveals an upregulation of DAPK1 (DAPK1), a candidate
tumor suppressor whose mechanism includes inhibition of ERK. This
upregulation affects both the Ras-MAPK and TGF-β pathways that may
support tumor suppressive changes. The Ras-MAPK pathway plays an
important role in many cellular functions, including proliferation,
differentiation, migration and cell survival (40). Constitutive activation of this
pathway, either via mutation or dysregulation, is associated with
many cancers, including melanoma, breast, pancreatic, head and
neck, and colon cancers (41–45).
In this tightly regulated pathway, the inhibition of ERK by DAPK1
results in the downregulation of FOS and MYC, two oncogenes
associated with uncontrolled proliferation and thus tumorigenesis.
The TGF-β pathway is similarly involved in proliferation,
differentiation, growth and cell death (46). Inhibition of ERK in this pathway
allows for the upregulation of the transcription factor E2F5
(E2F5). E2F5 has an established role in the inhibition of MYC
(47), therefore its upregulation
may be another mechanism for tumor suppression. Further study on
the role of E2F5 in BCC is warranted given recent evidence
suggesting that E2F5 may contribute to tumorigenesis (48,49).
A recently published meta-analysis from our lab
revealed overlapping DEGs across no more than 2 BCC microarray
studies (50). We extended this
analysis here with the most currently available literature and
discovered that 13 DEGs overlapped across 3 studies (Table IV). Functional annotation of these
genes revealed transcriptional dysregulation of processes involved
in lipid/steroid metabolism and of components of the extracellular
matrix. The dysregulated genes involved in lipid metabolism may
point to underlying aberrations leading to BCC tumorigenesis and
represent potential biomarkers for the development of BCC. To
understand if transcriptional dysregulation of lipid metabolism can
act as a diagnostic indicator, future studies may include linking
fine-tuned time-course measurements with changes in gene
expression. Also, we noted an upregulation in extracellular
matrix-related genes. Previous studies have indicated that BCC
samples that were less invasive typically contained a dense matrix
surrounding the cells (51). It
has been postulated that this stroma precludes cellular
proliferation and tumor metastasis by introducing a physical
barrier to migrating cells and helps explain the slow-growing
properties of BCC.
Numerous genome-wide association studies have
identified putative susceptibility loci that are associated with
basal cell carcinoma (52–62). However, consensus risk loci have
not been established and these studies do not shed light on the
causal relationships between genes and phenotype. Here, we combined
information from established genetic linkage studies on BCC
susceptibility with gene expression data from our microarray
analysis to draw insights on the development of basal cell
carcinoma. We expect that subsets of genes differentially expressed
in BCC are due to genetic alterations. Thus, disease associated
DEGs are likely to represent an enriched pool of candidate risk
genes. Moreover, we found 26 BCC associated DEGs that mapped to
eight previously reported BCC susceptibility identified loci
(Table VI). Four DEGs mapped to
locations previously associated with BCC and pigmentation genes
related to eye color, hair color, and/or skin color. The remaining
DEGs mapped to putative susceptibility loci that were associated
with BCC only and not pigmentation. It should be noted that none of
the 26 DEGs that mapped to loci were related to pigmentation alone,
indicating that any primary genetic associations are likely to be
linked to tumor development.
A recent GWAS identified KRT5 as a gene of interest
associated with BCC at the 12q11–13 locus (61). Our analysis revealed 9
downregulated DEGs that mapped to the 12q13 region. This pool of 9
DEGs at 12q13 warrant further study to investigate which of these
represent true risk loci. Thus, the strategy of merging genetics
and transcriptional datasets can be leveraged to refine the search
for susceptibility loci, particularly those with functional
consequence.
Our study identified chromosome 5 as a chromosome
with significantly enriched DEGs. We further found four regions on
chromosome 5 that might serve as transcriptional ‘hot spots’ for
BCC. In particular, the 5p13–15.33 region overlapped with two
susceptibility loci (5p13 and 5p15) that were previously identified
in GWAS and linkage studies. Our study also revealed novel
chromosomal locations at the 5q11.2–14.3, 5q22.1–23.3 and 5q31–35.3
regions. 5q11 was recently identified in a GWAS as a susceptibility
locus in patients with esophageal squamous cell carcinoma (63). The 5q35 region was previously
associated with prostate cancer development, however, the causal
genes at play were not identified (64,65).
In genome-wide association and linkage studies, 5q21.1 and 5q31–33
loci were associated with atopic dermatitis (66,67).
These results underscore the potential pathogenetic significance of
the identified chromosomal locations, suggesting regions that may
be prioritized for rigorous genetic association studies.
We expect our approach of integrating available
genetic information with transcriptional data will facilitate
future investigations to pinpoint susceptibility loci with greater
precision to better illuminate the causative links between genetic
alteration, transcriptional dysregulation, and disease initiation
and progression in BCC. Taken together, such information could be
used to improve on current diagnostic and prognostic modalities,
and further our understanding of disease mechanisms in order to
develop enriched targets for therapy.
Acknowledgements
We thank the housestaff at the
Department of Dermatology, Weill-Cornell Medical College, and New
York Presbyterian Hospital for help with procurement of tissue
samples.
References
|
1.
|
Armstrong BK and Kricker A: Skin cancer.
Dermatol Clin. 13:583–594. 1995.
|
|
2.
|
Rubin AI, Chen EH and Ratner D: Basal-cell
carcinoma. N Engl J Med. 353:2262–2269. 2005. View Article : Google Scholar : PubMed/NCBI
|
|
3.
|
Sexton M, Jones DB and Maloney ME:
Histologic pattern analysis of basal cell carcinoma. Study of a
series of 1039 consecutive neoplasms. J Am Acad Dermatol.
23:1118–1126. 1990. View Article : Google Scholar : PubMed/NCBI
|
|
4.
|
Diepgen TL and Mahler V: The epidemiology
of skin cancer. Br J Dermatol. 146(Suppl. 61): S1–S6. 2002.
View Article : Google Scholar
|
|
5.
|
Reifenberger J, Wolter M, Knobbe CB, et
al: Somatic mutations in the PTCH, SMOH, SUFUH and TP53 genes in
sporadic basal cell carcinomas. Br J Dermatol. 152:43–51. 2005.
View Article : Google Scholar : PubMed/NCBI
|
|
6.
|
Benjamin CL, Melnikova VO and Ananthaswamy
HN: P53 protein and pathogenesis of melanoma and nonmelanoma skin
cancer. Adv Exp Med Biol. 624:265–282. 2008. View Article : Google Scholar : PubMed/NCBI
|
|
7.
|
De Zwaan SE and Haass NK: Genetics of
basal cell carcinoma. Australas J Dermatol. 51:81–93. 2010.
|
|
8.
|
Iwasaki JK, Srivastava D, Moy RL, Lin HJ
and Kouba DJ: The molecular genetics underlying basal cell
carcinoma pathogenesis and links to targeted therapeutics. J Am
Acad Dermatol. 66:E167–E168. 2012. View Article : Google Scholar : PubMed/NCBI
|
|
9.
|
Lacour JP: Carcinogenesis of basal cell
carcinomas: genetics and molecular mechanisms. Br J Dermatol.
146(Suppl 61): S17–S19. 2002. View Article : Google Scholar : PubMed/NCBI
|
|
10.
|
Muller PA, Vousden KH and Norman JC: p53
and its mutants in tumor cell migration and invasion. J Cell Biol.
192:209–218. 2011. View Article : Google Scholar : PubMed/NCBI
|
|
11.
|
Gentleman RC, Carey VJ, Bates DM, et al:
Bioconductor: open software development for computational biology
and bioinformatics. Genome Biol. 5:R802004. View Article : Google Scholar : PubMed/NCBI
|
|
12.
|
Wilson CL and Miller CJ: Simpleaffy: a
BioConductor package for Affymetrix Quality Control and data
analysis. Bioinformatics. 21:3683–3685. 2005. View Article : Google Scholar : PubMed/NCBI
|
|
13.
|
Smyth GK: Linear models and empirical
bayes methods for assessing differential expression in microarray
experiments. Stat Appl Genet Mol Biol. 3:Article 3. 2004.PubMed/NCBI
|
|
14.
|
Benjamini Y: Controlling the false
discovery rate: a practical and powerful approach to multiple
testing. J R Stat Soc Series B. 57:289–300. 1995.
|
|
15.
|
Eisen MB, Spellman PT, Brown PO and
Botstein D: Cluster analysis and display of genome-wide expression
patterns. Proc Natl Acad Sci USA. 95:14863–14868. 1998. View Article : Google Scholar : PubMed/NCBI
|
|
16.
|
Huang da W, Sherman BT, Tan Q, et al:
DAVID Bioinformatics Resources: expanded annotation database and
novel algorithms to better extract biology from large gene lists.
Nucleic Acids Res. 35:W169–W175. 2007.PubMed/NCBI
|
|
17.
|
Asplund A, Gry Bjorklund M, Sundquist C,
et al: Expression profiling of microdissected cell populations
selected from basal cells in normal epidermis and basal cell
carcinoma. Br J Dermatol. 158:527–538. 2008. View Article : Google Scholar : PubMed/NCBI
|
|
18.
|
Howell BG, Solish N, Lu C, et al:
Microarray profiles of human basal cell carcinoma: insights into
tumor growth and behavior. J Dermatol Sci. 39:39–51. 2005.
View Article : Google Scholar : PubMed/NCBI
|
|
19.
|
O’Driscoll L, McMorrow J, Doolan P, et al:
Investigation of the molecular profile of basal cell carcinoma
using whole genome microarrays. Mol Cancer. 5:742006.PubMed/NCBI
|
|
20.
|
Yu M, Zloty D, Cowan B, et al:
Superficial, nodular, and morpheiform basal-cell carcinomas exhibit
distinct gene expression profiles. J Invest Dermatol.
128:1797–1805. 2008. View Article : Google Scholar : PubMed/NCBI
|
|
21.
|
Nijsten T, Geluyckens E, Colpaert C and
Lambert J: Peroxisome proliferator-activated receptors in squamous
cell carcinoma and its precursors. J Cutan Pathol. 32:340–347.
2005. View Article : Google Scholar : PubMed/NCBI
|
|
22.
|
Tachibana K, Yamasaki D, Ishimoto K and
Doi T: The role of PPARs in cancer. PPAR Res. 2008:1027372008.
View Article : Google Scholar : PubMed/NCBI
|
|
23.
|
Reka AK, Goswami MT, Krishnapuram R,
Standiford TJ and Keshamouni VG: Molecular cross-regulation between
PPAR-gamma and other signaling pathways: implications for lung
cancer therapy. Lung Cancer. 72:154–159. 2011. View Article : Google Scholar : PubMed/NCBI
|
|
24.
|
Sarraf P, Mueller E, Jones D, et al:
Differentiation and reversal of malignant changes in colon cancer
through PPARgamma. Nat Med. 4:1046–1052. 1998. View Article : Google Scholar : PubMed/NCBI
|
|
25.
|
Guan YF, Zhang YH, Breyer RM, Davis L and
Breyer MD: Expression of peroxisome proliferator-activated receptor
gamma (PPARgamma) in human transitional bladder cancer and its role
in inducing cell death. Neoplasia. 1:330–339. 1999. View Article : Google Scholar : PubMed/NCBI
|
|
26.
|
Mossner R, Schulz U, Kruger U, et al:
Agonists of peroxisome proliferator-activated receptor gamma
inhibit cell growth in malignant melanoma. J Invest Dermatol.
119:576–582. 2002. View Article : Google Scholar : PubMed/NCBI
|
|
27.
|
Petta E, Sotiropoulou-Bonikou G, Kourelis
K, Melachrinou M and Bonikos DS: Differential expression and
cross-talk of peroxisome proliferator-activated receptor gamma and
retinoid-X receptor alpha in urothelial carcinomas of the bladder.
J BUON. 15:740–745. 2010.
|
|
28.
|
Pancione M, Forte N, Sabatino L, et al:
Reduced beta-catenin and peroxisome proliferator-activated
receptor-gamma expression levels are associated with colorectal
cancer metastatic progression: correlation with tumor-associated
macrophages, cyclooxygenase 2, and patient outcome. Hum Pathol.
40:714–725. 2009. View Article : Google Scholar
|
|
29.
|
Mueller E, Sarraf P, Tontonoz P, et al:
Terminal differentiation of human breast cancer through PPAR gamma.
Mol Cell. 1:465–470. 1998. View Article : Google Scholar : PubMed/NCBI
|
|
30.
|
Yao L, Liu F, Sun L, et al: Upregulation
of PPARgamma in tissue with gastric carcinoma. Hybridoma (Larchmt).
29:341–343. 2010. View Article : Google Scholar : PubMed/NCBI
|
|
31.
|
Wang W, Wang R, Zhang Z, Li D and Yut Y:
Enhanced PPAR-gamma expression may correlate with the development
of Barrett’s esophagus and esophageal adenocarcinoma. Oncol Res.
19:141–147. 2011.PubMed/NCBI
|
|
32.
|
Li M, Lee TW, Mok TS, Warner TD, Yim AP
and Chen GG: Activation of peroxisome proliferator-activated
receptor-gamma by troglitazone (TGZ) inhibits human lung cell
growth. J Cell Biochem. 96:760–774. 2005. View Article : Google Scholar : PubMed/NCBI
|
|
33.
|
Boiteux G, Lascombe I, Roche E, et al:
A-FABP, a candidate progression marker of human transitional cell
carcinoma of the bladder, is differentially regulated by PPAR in
urothelial cancer cells. Int J Cancer. 124:1820–1828. 2009.
View Article : Google Scholar : PubMed/NCBI
|
|
34.
|
Storch J and Thumser AE: Tissue-specific
functions in the fatty acid-binding protein family. J Biol Chem.
285:32679–32683. 2010. View Article : Google Scholar : PubMed/NCBI
|
|
35.
|
Wetmore C: Sonic hedgehog in normal and
neoplastic proliferation: insight gained from human tumors and
animal models. Curr Opin Genet Dev. 13:34–42. 2003. View Article : Google Scholar : PubMed/NCBI
|
|
36.
|
Green DR and Kroemer G: Cytoplasmic
functions of the tumour suppressor p53. Nature. 458:1127–1130.
2009. View Article : Google Scholar : PubMed/NCBI
|
|
37.
|
Sun Y, Zeng XR, Wenger L, Firestein GS and
Cheung HS: P53 down-regulates matrix metalloproteinase-1 by
targeting the communications between AP-1 and the basal
transcription complex. J Cell Biochem. 92:258–269. 2004. View Article : Google Scholar : PubMed/NCBI
|
|
38.
|
Jung YS, Qian Y and Chen X: Examination of
the expanding pathways for the regulation of p21 expression and
activity. Cell Signal. 22:1003–1012. 2010. View Article : Google Scholar : PubMed/NCBI
|
|
39.
|
Tanaka K, Iwamoto Y, Ito Y, et al: Cyclic
AMP-regulated synthesis of the tissue inhibitors of
metalloproteinases suppresses the invasive potential of the human
fibrosarcoma cell line HT1080. Cancer Res. 55:2927–2935.
1995.PubMed/NCBI
|
|
40.
|
Tartaglia M and Gelb BD: Disorders of
dysregulated signal traffic through the RAS-MAPK pathway:
phenotypic spectrum and molecular mechanisms. Ann N Y Acad Sci.
1214:99–121. 2010. View Article : Google Scholar : PubMed/NCBI
|
|
41.
|
Dunn KL, Espino PS, Drobic B, He S and
Davie JR: The Ras-MAPK signal transduction pathway, cancer and
chromatin remodeling. Biochem Cell Biol. 83:1–14. 2005. View Article : Google Scholar : PubMed/NCBI
|
|
42.
|
Yang D, Tao J, Li L, et al: RasGRP3, a Ras
activator, contributes to signaling and the tumorigenic phenotype
in human melanoma. Oncogene. 30:4590–600. 2011. View Article : Google Scholar : PubMed/NCBI
|
|
43.
|
Mathiasen DP, Egebjerg C, Andersen SH, et
al: Identification of a c-Jun N-terminal kinase-2-dependent signal
amplification cascade that regulates c-Myc levels in ras
transformation. Oncogene. 31:390–401. 2012. View Article : Google Scholar : PubMed/NCBI
|
|
44.
|
Shi XH, Liang ZY, Ren XY and Liu TH:
Combined silencing of K-ras and Akt2 oncogenes achieves synergistic
effects in inhibiting pancreatic cancer cell growth in vitro and in
vivo. Cancer Gene Ther. 16:227–236. 2009.PubMed/NCBI
|
|
45.
|
Rauch J, Moran-Jones K, Albrecht V, et al:
c-Myc regulates RNA splicing of the A-Raf kinase and its activation
of the ERK pathway. Cancer Res. 71:4664–4674. 2011. View Article : Google Scholar : PubMed/NCBI
|
|
46.
|
Su E, Han X and Jiang G: The transforming
growth factor beta 1/SMAD signaling pathway involved in human
chronic myeloid leukemia. Tumori. 96:659–666. 2010.PubMed/NCBI
|
|
47.
|
Chen CR, Kang Y, Siegel PM and Massague J:
E2F4/5 and p107 as Smad cofactors linking the TGFbeta receptor to
c-myc repression. Cell. 110:19–32. 2002. View Article : Google Scholar : PubMed/NCBI
|
|
48.
|
Jiang Y, Yim SH, Xu HD, et al: A potential
oncogenic role of the commonly observed E2F5 overexpression in
hepatocellular carcinoma. World J Gastroenterol. 17:470–477. 2011.
View Article : Google Scholar : PubMed/NCBI
|
|
49.
|
Polanowska J, Le Cam L, Orsetti B, et al:
Human E2F5 gene is oncogenic in primary rodent cells and is
amplified in human breast tumors. Genes Chromosomes Cancer.
28:126–130. 2000. View Article : Google Scholar : PubMed/NCBI
|
|
50.
|
Van Haren R, Feldman D and Sinha AA:
Systematic comparison of nonmelanoma skin cancer microarray
datasets reveals lack of consensus genes. Br J Dermatol.
161:1278–1287. 2009.PubMed/NCBI
|
|
51.
|
Tanaka K, Iyama K, Kitaoka M, et al:
Differential expression of alpha 1(IV), alpha 2(IV), alpha 5(IV)
and alpha 6(IV) collagen chains in the basement membrane of basal
cell carcinoma. Histochem J. 29:563–570. 1997. View Article : Google Scholar : PubMed/NCBI
|
|
52.
|
Bishop DT, Demenais F, Iles MM, et al:
Genome-wide association study identifies three loci associated with
melanoma risk. Nat Genet. 41:920–925. 2009. View Article : Google Scholar : PubMed/NCBI
|
|
53.
|
Gerstenblith MR, Shi J and Landi MT:
Genome-wide association studies of pigmentation and skin cancer: a
review and meta-analysis. Pigment Cell Melanoma Res. 23:587–606.
2010. View Article : Google Scholar : PubMed/NCBI
|
|
54.
|
Gudbjartsson DF, Sulem P, Stacey SN, et
al: ASIP and TYR pigmentation variants associate with cutaneous
melanoma and basal cell carcinoma. Nat Genet. 40:886–891. 2008.
View Article : Google Scholar : PubMed/NCBI
|
|
55.
|
Han J, Kraft P, Nan H, et al: A
genome-wide association study identifies novel alleles associated
with hair color and skin pigmentation. PLoS Genet. 4:e10000742008.
View Article : Google Scholar : PubMed/NCBI
|
|
56.
|
Han J, Qureshi AA, Prescott J, et al: A
prospective study of telomere length and the risk of skin cancer. J
Invest Dermatol. 129:415–421. 2009. View Article : Google Scholar : PubMed/NCBI
|
|
57.
|
Liboutet M, Portela M, Delestaing G, et
al: MC1R and PTCH gene polymorphism in French patients with basal
cell carcinomas. J Invest Dermatol. 126:1510–1517. 2006. View Article : Google Scholar : PubMed/NCBI
|
|
58.
|
Nan H, Kraft P, Hunter DJ and Han J:
Genetic variants in pigmentation genes, pigmentary phenotypes, and
risk of skin cancer in Caucasians. Int J Cancer. 125:909–917. 2009.
View Article : Google Scholar : PubMed/NCBI
|
|
59.
|
Nan H, Xu M, Kraft P, et al: Genome-wide
association study identifies novel alleles associated with risk of
cutaneous basal cell carcinoma and squamous cell carcinoma. Hum Mol
Genet. 20:3718–3724. 2011. View Article : Google Scholar : PubMed/NCBI
|
|
60.
|
Rafnar T, Sulem P, Stacey SN, et al:
Sequence variants at the TERT-CLPTM1L locus associate with many
cancer types. Nat Genet. 41:221–227. 2009. View Article : Google Scholar : PubMed/NCBI
|
|
61.
|
Stacey SN, Gudbjartsson DF, Sulem P, et
al: Common variants on 1p36 and 1q42 are associated with cutaneous
basal cell carcinoma but not with melanoma or pigmentation traits.
Nat Genet. 40:1313–1318. 2008. View
Article : Google Scholar : PubMed/NCBI
|
|
62.
|
Stacey SN, Sulem P, Masson G, et al: New
common variants affecting susceptibility to basal cell carcinoma.
Nat Genet. 41:909–914. 2009. View
Article : Google Scholar : PubMed/NCBI
|
|
63.
|
Wu C, Hu Z, He Z, et al: Genome-wide
association study identifies three new susceptibility loci for
esophageal squamous-cell carcinoma in Chinese populations. Nat
Genet. 43:679–684. 2011. View
Article : Google Scholar : PubMed/NCBI
|
|
64.
|
Christensen GB, Baffoe-Bonnie AB, George
A, et al: Genome-wide linkage analysis of 1,233 prostate cancer
pedigrees from the International Consortium for Prostate Cancer
Genetics using novel sumLINK and sumLOD analyses. Prostate.
70:735–744. 2010.
|
|
65.
|
Xu J, Dimitrov L, Chang BL, et al: A
combined genomewide linkage scan of 1,233 families for prostate
cancer-susceptibility genes conducted by the international
consortium for prostate cancer genetics. Am J Hum Genet.
77:219–229. 2005. View
Article : Google Scholar
|
|
66.
|
Sun LD, Xiao FL, Li Y, et al: Genome-wide
association study identifies two new susceptibility loci for atopic
dermatitis in the Chinese Han population. Nat Genet. 43:690–694.
2011. View
Article : Google Scholar : PubMed/NCBI
|
|
67.
|
Beyer K, Nickel R, Freidhoff L, et al:
Association and linkage of atopic dermatitis with chromosome
13q12–14 and 5q31–33 markers. J Invest Dermatol. 115:906–908.
2000.
|
|
68.
|
Duffy DL, Zhao ZZ, Sturm RA, Hayward NK,
Martin NG and Montgomery GW: Multiple pigmentation gene
polymorphisms account for a substantial proportion of risk of
cutaneous malignant melanoma. J Invest Dermatol. 130:520–528. 2010.
View Article : Google Scholar : PubMed/NCBI
|
|
69.
|
Han J, Colditz GA, Samson LD and Hunter
DJ: Polymorphisms in DNA double-strand break repair genes and skin
cancer risk. Cancer Res. 64:3009–3013. 2004. View Article : Google Scholar : PubMed/NCBI
|
|
70.
|
Sulem P, Gudbjartsson DF, Stacey SN, et
al: Two newly identified genetic determinants of pigmentation in
Europeans. Nat Genet. 40:835–837. 2008. View Article : Google Scholar : PubMed/NCBI
|
|
71.
|
Sulem P, Gudbjartsson DF, Stacey SN, et
al: Genetic determinants of hair, eye and skin pigmentation in
Europeans. Nat Genet. 39:1443–1452. 2007. View Article : Google Scholar : PubMed/NCBI
|
|
72.
|
Han J, Hankinson SE, Colditz GA and Hunter
DJ: Genetic variation in XRCC1, sun exposure, and risk of skin
cancer. Br J Cancer. 91:1604–1609. 2004.PubMed/NCBI
|
|
73.
|
Kang SY, Lee KG, Lee W, et al:
Polymorphisms in the DNA repair gene XRCC1 associated with basal
cell carcinoma and squamous cell carcinoma of the skin in a Korean
population. Cancer Sci. 98:716–720. 2007. View Article : Google Scholar : PubMed/NCBI
|
|
74.
|
Brown KM, Macgregor S, Montgomery GW, et
al: Common sequence variants on 20q11.22 confer melanoma
susceptibility. Nat Genet. 40:838–840. 2008. View Article : Google Scholar : PubMed/NCBI
|
|
75.
|
Smyth I, Narang MA, Evans T, et al:
Isolation and characterization of human patched 2 (PTCH2), a
putative tumour suppressor gene inbasal cell carcinoma and
medulloblastoma on chromosome 1p32. Hum Mol Genet. 8:291–297. 1999.
View Article : Google Scholar : PubMed/NCBI
|
|
76.
|
Fan Z, Li J, Du J, et al: A missense
mutation in PTCH2 underlies dominantly inherited NBCCS in a Chinese
family. J Med Genet. 45:303–308. 2008. View Article : Google Scholar : PubMed/NCBI
|
|
77.
|
Grachtchouk M, Mo R, Yu S, et al: Basal
cell carcinomas in mice overexpressing Gli2 in skin. Nat Genet.
24:216–217. 2000. View
Article : Google Scholar : PubMed/NCBI
|
|
78.
|
Friedman E, Gejman PV, Martin GA and
McCormick F: Non-sense mutations in the C-terminal SH2 region of
the GTPase activating protein (GAP) gene in human tumours. Nat
Genet. 5:242–247. 1993. View Article : Google Scholar : PubMed/NCBI
|
|
79.
|
Hahn H, Wicking C, Zaphiropoulous PG, et
al: Mutations of the human homolog of Drosophila patched in the
nevoid basal cell carcinoma syndrome. Cell. 85:841–851. 1996.
View Article : Google Scholar : PubMed/NCBI
|
|
80.
|
Aszterbaum M, Epstein J, Oro A, et al:
Ultraviolet and ionizing radiation enhance the growth of BCCs and
trichoblastomas in patched heterozygous knockout mice. Nat Med.
5:1285–1291. 1999. View
Article : Google Scholar : PubMed/NCBI
|
|
81.
|
Svard J, Heby-Henricson K, Persson-Lek M,
et al: Genetic elimination of Suppressor of fused reveals an
essential repressor function in the mammalian Hedgehog signaling
pathway. Dev Cell. 10:187–197. 2006. View Article : Google Scholar : PubMed/NCBI
|
|
82.
|
Ling G, Ahmadian A, Persson A, et al:
PATCHED and p53 gene alterations in sporadic and hereditary basal
cell cancer. Oncogene. 20:7770–7778. 2001. View Article : Google Scholar : PubMed/NCBI
|