Introduction
Ovarian cancer is the most frequent cause of death
from gynecologic neoplasm in the Western World, mainly due to lack
of early detection and understanding of its etiology (1). Most ovarian malignancies have
epithelial origin and are often derived from ovarian surface
epithelial (OSE) cells (2). Thus,
understanding the molecular mechanisms that control OSE cell
proliferation and differentiation may lead to the design of novel
targeted therapies. Normal human OSE cells are capable of
steroidogenesis (3–5) and in epithelial ovarian cancer (EOC),
intratumoral steroid biosynthesis is closely linked with
carcinogenesis (2,5,6).
Several studies support a role for SF-1 as a
suppressor of ovarian cancer: i) ectopic expression of SF-1
inhibits rat ovarian epithelial cell proliferation, causing cell
cycle arrest and promoting apoptosis (7); ii) the tumor suppressor Rb1
synergizes with steroid receptor co-activator-2 (SRC-2) to enhance
the activity of SF-1 as well as nuclear receptors ERα and ERβ
(8); Rb1 may thus promote the
transcription of target genes linked to cell differentiation; iii)
SF-1 promotes differentiation of human and rat granulosa cells
associated with the developing oocytes (9).
It is well established that OSE cell proliferation
and ovarian steroidogenesis are closely linked (2,5,6).
Specifically, both cell culture and epidemiologic data support a
protective role for progesterone against ovarian cancer (10,11).
In addition to upregulating steroidogenic enzymes p450scc and
3β-HSD II, SF 1 stimulates expression of the human StAR gene
(12). The expression and
functional integrity of the StAR protein and enzymes p450scc and
3β-HSD II are particularly important for progesterone biosynthesis
(13).
We have previously shown that while human SF-1 and
StAR are expressed in normal OSE cells, ovarian cancer cell lines
SKOV-3, OVCar3 and BG1 do not show SF-1 or StAR expression
(14). We then utilized
immunohistochemistry to demonstrate that the vast majority of the
human ovarian tumor tissues examined do not express SF-1 protein
(unpublished data). In addition, real-time PCR studies on
epithelial ovarian cancers suggest that StAR mediated progesterone
biosynthesis may inhibit OSE tumor cell proliferation (15). Collectively these studies support
the hypothesis that loss of SF-1 protein may contribute to
carcinogenesis in ovarian epithelial cells, in part, through
decreased progesterone biosynthesis.
It is noteworthy that the human NR5A1 gene
has been mapped to chromosome 9 at position 9q33 (16), a region that shows genetic
alterations (LOH, microsatellite instability, and amplification) in
more than half of ovarian tumors (17). Particularly significant is the
observation that nearly all of the tumors that show genetic
alterations at 9q include the subchromosomal region 9q32–34,
suggesting that a candidate tumor suppressor gene may reside in
this region (17). The location of
human SF-1 in the region of 9q33 supports our hypothesis that SF-1
is a candidate tumor suppressor gene in the ovary and that
abolished or aberrant SF-1 expression in OSE cells may promote
tumor growth. We thus decided to examine the degree of LOH in
ovarian tumors, specifically at the NR5A1 locus and report LOH in
44% of the tumors.
Methylation controls the time and cell-type specific
NR5A1 gene expression in the endocrine system (18). Thus we examined the methylation
status of the NR5A1 gene promoter in ovarian tumors, and report
significantly higher prevalence of NR5A1 gene methylation in
ovarian tumors compared to normal (i.e. non-tumor) ovaries. These
data suggest that LOH and methylation may contribute to the loss of
SF-1 protein in ovarian tumors, which in turn may result in ovarian
carcinogenesis.
Materials and methods
Samples
Following approval of a research protocol by the
Institutional Review Board Committees of Tulane University and
Louisiana State University in New Orleans, 66 archival
formalin-fixed paraffin-embedded (FFPE) tissue blocks of ovarian
tissue were obtained from the Departments of Pathology at the
Tulane University Health Sciences Center and from the Interim LSU
Hospital. Sixteen samples were representative of normal ovaries
from women who had undergone gynecological surgeries for
non-ovarian related causes. The rest of the 50 samples consisted of
3 benign ovarian tumors, 7 tumors of low malignancy potential and
40 cases of ovarian carcinoma. Each case of ovarian tumor was
matched with corresponding benign tissue control. All FFPE tissue
blocks were sectioned and stained with hematoxylin and eosin for
histological assessment.
DNA extraction
FFPE tissue blocks
Tissue (1.5–2 mg) was excised from each normal and
tumor FFPE tissue block using a sterile scalpel and placed in an
autoclaved 1.5 ml centrifuge tube. Samples were deparafinized with
1 ml of xylene followed by vortexing at top speed for 2 min. The
tissue was then centrifuged at 10,000 x g for 3 min using
Microcentrifuge 16 from Beckman Coulter Inc. (Brea, CA, USA) and
the supernatant was pipetted out. To remove any residual xylene and
facilitate pelleting, 1 ml 100% ethanol was added to the tissue
sample, followed by spinning at 10,000 × g. The supernatant was
decanted and tissue pellets were allowed to air-dry at room
temperature. Subsequently, pellets were subjected to protease
digestion by 100 μl/ml proteinase K in Digestion Buffer [10
mM Tris-HCl (pH 8.0), 1 mM ethylenediaminetetraacetic acid (EDTA)]
at 52°C for 16 h. Following the digestion, DNA was isolated using
the Qiagen (Valencia, CA, USA) DNeasy for FFPE kit, following the
manufacturer’s recommended protocol.
Normal ovarian tissue samples
Ovarian surface epithelial cells from normal ovarian
FFPE tissue samples were dissected using the PALM® Robot
Microbeam laser microdissection system (PALM GmbH, Bernried,
Germany) at the Louisiana State University Morphology and Imaging
core facility. DNA was then extracted from the epithelial cells
using the proteinase K DNA extraction Solution and incubation at
65°C for 16 h, as suggested by the manufacturer
(Arcturus®, Applied Biosystems, Life Technologies
Corporation, Carlsbad, CA, USA).
Genotyping
Both tumor and normal DNA samples were genotyped for
SNPs: rs2279605, rs10120967, rs7851737 using Applied Biosystems
TaqMan probes, with IQ power mix (Bio-Rad, Hercules, CA, USA) or
Amplitaq Gold, 25 mM MgCl2 and 10X PCR Gold buffer from
Applied Biosystems and dNTPs from VWR International (Radnor, PA,
USA). Applied Biosystems Taq Man probes are labeled with Fam and
Vic dyes. A total of 20 μl PCR reactions were set up in a
96-well plate which was covered with Microseal ‘B’ film from
Bio-Rad. Bio-Rad Thermal cycler IQ5 was used to run the real-time
PCR and Image Quant 5 software from Bio-Rad used for plate read
document and analysis of the real-time data post PCR. All
genotyping assays were done in triplicates and when the three
independent assays yielded ambiguous results, were repeated
again.
Digestion of genomic DNA for
methylation study
DNA (0.5 μg) from each sample (tumor and
normal from the same patient) was digested using 5 units of Afe1
enzyme (New England Bioscience, Ipswich, MA, USA) in a total
reaction volume of 50 μl. The digestion was performed in 1X
NEBuffer (New England Bioscience); 1X NE buffer contains: 20 mM
Tris-acetate, 50 mM potassium acetate, 10 mM magnesium acetate, 1
mM dithiothreitol (pH 7.9 at 25°C). The samples were incubated with
the enzyme for 1 h at 37°C to allow digestion of DNA, following
which Afe1 was inactivated by incubating the samples at 65°C for 20
min. Alternatively, digestion was performed overnight.
PCR amplification for methylation
study
All samples were simultaneously PCR-amplified for
the promoter region of the β-actin gene and NR5A1 gene in
200 μl tubes. For each 50 μl reaction, 2 μl of
DNA was used and reagent concentrations were optimized at: 5 mM for
MgCl2 from Applied Biosystems, 2 mM for each dNTP from
VWR; 5 mM for primers (β-actin, forward primer: 5′-TGC AAA GAA CAC
GGC TAA GTG TGC-3′, β-actin, reverse primer: 5′TCT AAG ACA GTG TTG
TGG GTG TAG GTs-3′, NR5A1 gene, forward primer: 5′-AAC ACC
AAC AAA GAA GGC GAG AGG-3′, NR5A1 gene, reverse primer:
5′-TCA CTT ACG AAG CGG AAG CAGC-3′) from IDT DNA (Coralville, IA,
USA) in 10X PCR buffer II [final concentration: 50 mM potassium
chloride and 10 mM Tris-HCl (pH 8.3 at room temperature) from
Applied Biosystems] along with 1.25 units AmpliTaq® DNA
polymerase per 50 μl of reaction. PCR amplification was
performed on a PTC-100™ programmable thermocycler from MJ Research
Inc. (Quebec, Canada) allowing initial denaturation at 95°C for 20
min followed by 40 cycles of 95°C for 1 min, 62°C for 1 min, 72°C
for 1 min and completing the terminal extension with 10 min at
72°C.
Gel electrophoresis
A total of 8 μl of PCR product was added to 2
μl of loading dye (2% xylene cyanol, 40% glycerol in DDi
H2O) from Boston Bioproducts (Ashland, MA, USA). For
sizing 1 kb plus DNA ladder (Invitrogen, Life Technologies
Corporation, Carlsbad, CA, USA) was loaded on a 2% agarose gel
containing 1X Tris-acetate-EDTA buffer (40 mM Tris acetate and 1 mM
EDTA) and 5 μg of ethidium bromide for staining. The gel was
run on a horizontal system for Gel electrophoresis from Bethesda
Research Laboratories Inc. (Gaithersburg, MD, USA) at 100 V for 60
min. Following the gel electrophoresis the amplified fragments were
visualized on Molecular Imager® Gel Doc™ using Image
Lab™ software from Bio-Rad.
Methylation analysis
Electrophoretic images were analyzed for relative
(NR5A1/β-actin) band intensity using Image Quant 5.1 software from
GE Healthcare (Piscataway, NJ, USA). Relative intensities were
categorized in quartiles as follows: −, 1st; + 2nd; ++ 3rd; +++ 4th
quartile. All experiments were done at least twice and the relative
intensities were averaged.
Clinical application
A retrospective chart review was performed gathering
clinical data on the patients for whom we had malignant ovarian
tissue. Characteristics examined were: age, race/ethnicity, date of
diagnosis, years survived since diagnosis, stage of ovarian cancer,
histologic grade, date of debulking surgery and treatment with
chemotherapy or radiation.
Statistics
For most statistical calculations, two-tailed
p-values were obtained using Fisher’s exact test. The log-rank test
was used for calculating p-values for potential differences in
survival.
Results
Samples
The clinical characteristics of the ovarian tumor
samples examined are shown on Table
I.
 | Table I.Clinical characteristics of ovarian
tumors studied. |
Table I.
Clinical characteristics of ovarian
tumors studied.
| Age | Race | Date of Dx | Study no. | Years survived
since Dx | Stage | Histological
grade | Surgery | Chemo | Radiation |
|---|
| 53 | Black | 6/13/07 | T23 | Unknown | 3C | 3 | 6/13/07 | Yes | No |
| 62 | White | 6/19/07 | T24 | <1 year | 3C | 3 | 6/19/07 | No | No |
| 32 | White | 4/19/07 | T25 | <1 year | 4 | 3 | 8/23/07 | No | No |
| 54 | Black | 12/12/07 | T26 | Living | 0 | Borderline | 12/12/07 | No | No |
| 31 | White | 1/15/08 | T27 | Living | 0 | Borderline | 1/15/08 | No | No |
| 26 | Black | 2/18/08 | T28 | Living | 3B | 1 | 2/18/08 | No | No |
| 45 | Hispanic | 4/28/08 | T29 | Living | 0 | 2 | 4/29/08 | No | No |
| 64 | White | 5/8/08 | T30 | Living | 0 | Borderline | 5/18/08 | No | No |
| 60 | White | 8/13/08 | T31 | Living | 3C | 3 | 8/13/08 | Yes | No |
| 47 | Black | 10/8/08 | T32 | Living | 0 | Borderline | 10/8/08 | No | No |
| 55 | White | 10/9/08 | T33 | 1 year | 3C | 2 | 10/9/08 | No | No |
| 72 | Unknown | 10/27/08 | T34 | Living | 3C | 3 | 10/27/08 | Yes | No |
| 57 | White | 12/7/08 | T35 | <1 year | 3C | Borderline | 12/7/08 | Unknown | Unknown |
| 74 | Hispanic | 12/11/08 | T36 | Unknown | 3C | 3 | 12/11/08 | Yes | No |
| 50 | Black | 1/29/09 | T37 | <1 year | 4 | 2 | 1/29/09 | No | No |
| 49 | Black | 5/11/09 | T38 | Living | 0 | Borderline | 5/11/09 | No | No |
| 56 | Black | 9/28/09 | T39 | Living | 3A | 2 | 9/28/09 | Yes | Yes |
| 70 | Unknown | 10/1/09 | T40 | Living | 3C | 3 | 10/1/09 | Yes | No |
| 46 | Black | 3/2/07 | T21 | Unknown | 3C | 3 | 3/3/07 | Yes | No |
| 41 | Black | 6/12/07 | T22 | 1 year | 3C | 3 | 6/11/07 | Yes | No |
| 73 | White | 4/24/97 | T10 | 1 month | 3B | 3 | 11/24/97 | No | No |
| 41 | Black | 7/21/98 | T8 | 2 years | 4 | 3 | 7/21/98 | Yes | No |
| 69 | White | 4/5/99 | T13 | 6 years | 4 | 3 | 4/5/99 | Yes | No |
| 63 | Black | 3/5/00 | T9 | 2 years | 3C | 2 | 3/5/00 | Yes | No |
| 47 | White | 5/31/00 | T14 | Living | 3B | 3 | 5/31/00 | Yes | No |
| 26 | White | 5/21/99 | T15 | 3 years | 3C | 3 | 5/21/99 | Yes | Yes |
| 61 | Black | 3/5/02 | T49 | <1 year | 4B | 2 | 3/5/02 | Yes | No |
| 36 | White | 5/29/02 | T50 | Living | 0 | Borderline | 5/29/02 | No | No |
| 60 | White | 6/28/02 | T11 | Unknown | 3C | 2 | 6/28/02 | Unknown | Unknown |
| 83 | White | 8/9/02 | T51 | <1 year | 3C | 3 | 8/9/02 | No | Yes |
| 77 | Hispanic | 3/28/03 | T52 | <1 year | 4B | 3 | 6/13/03 | Yes | No |
| 67 | Black | 9/24/03 | T53 | 3 years | 3C | 3 | 9/26/03 | Yes | No |
| 43 | White | 6/18/01 | T54 | 2 years | NA | 3a colon
primary | 6/18/01 | Yes | No |
| 47 | White | 12/19/03 | T17 | Living | 3A | 3 | 12/19/03 | Yes | No |
| 68 | Black | 2/16/04 | T55 | <1 year | 4 | 3 | 2/16/04 | No | No |
| 75 | White | 6/20/03 | T1 | 2 years | 4 | 3 | 6/20/03 | Yes | No |
| 35 | Hispanic | 5/25/05 | T41 | <1 year | 3C | 2 | 5/25/05 | Yes | No |
| 76 | White | 7/20/06 | T42 | 2 years | 3C | 3 | 10/24/06 | Yes | No |
| 45 | White | 10/21/02 | T12 | 4 years | 2A | | 10/21/02 | No | No |
| 60 | NA | 2/10/02 | T4 | <1 year | 4 | 3 | 3/5/02 | Yes | No |
| 51 | White | 3/13/07 | T3 | Living | 3C | 3 | 3/13/07 | Yes | No |
| 70 | Indian | 3/16/07 | T2 | Unknown | 4 | 3 | 3/16/07 | Unknown | Unknown |
| 65 | White | 6/8/07 | T44 | <1 year | 4 | 3 | 6/12/07 | No | No |
| 68 | Black | 8/17/07 | T45 | Living | 4 | 3a
endometrial cancer | 8/17/07 | No | Yes |
| 64 | White | 6/23/08 | T56 | Living | 3C | 3 | 7/9/08 | Yes | No |
| 49 | White | 6/25/09 | T46 | Living | 2B | Unknown | 6/25/09 | No | No |
| 66 | Hispanic | 7/16/09 | T47 | Living | 3C | 3 | 7/16/09 | Yes | No |
| 51 | White | 8/8/09 | T48 | Living | 1A | 1 | 8/5/09 | No | No |
| 30 | White | 8/5/09 | T57 | Living | 1A | Borderline | 8/5/09 | No | No |
LOH at the NR5A1 locus in ovarian
tumors
In the current study, we considered two molecular
hypotheses of SF-1 protein loss in ovarian tumors: LOH and
increased methylation. To probe for the prevalence of LOH at the
NR5A1 locus, we genotyped matched ovarian tumor and normal
FFPE tissue DNA samples from the same ovarian cancer patient, for
three NR5A1 gene SNPs: rs2279605, rs10120967 and rs7851737.
SNPs were selected based on the following criteria: i) high
(>30%) frequency of heterozygosity in the racial/ethnic groups
present in our study population (based on available data at dbSNP:
http://www.ncbi.nlm.nih.gov/projects/SNP/); ii)
availability of a preoptimized Taqman SNP Genotyping Assay for each
SNP. Genotyping was performed by Taqman SNP Genotyping Assays using
real-time PCR. Assays were performed in triplicates and repeated
again, if the genotyping results were ambiguous. All three
genotyped SNPs were in Hardy-Weinberg equilibrium in normal samples
(data not shown).
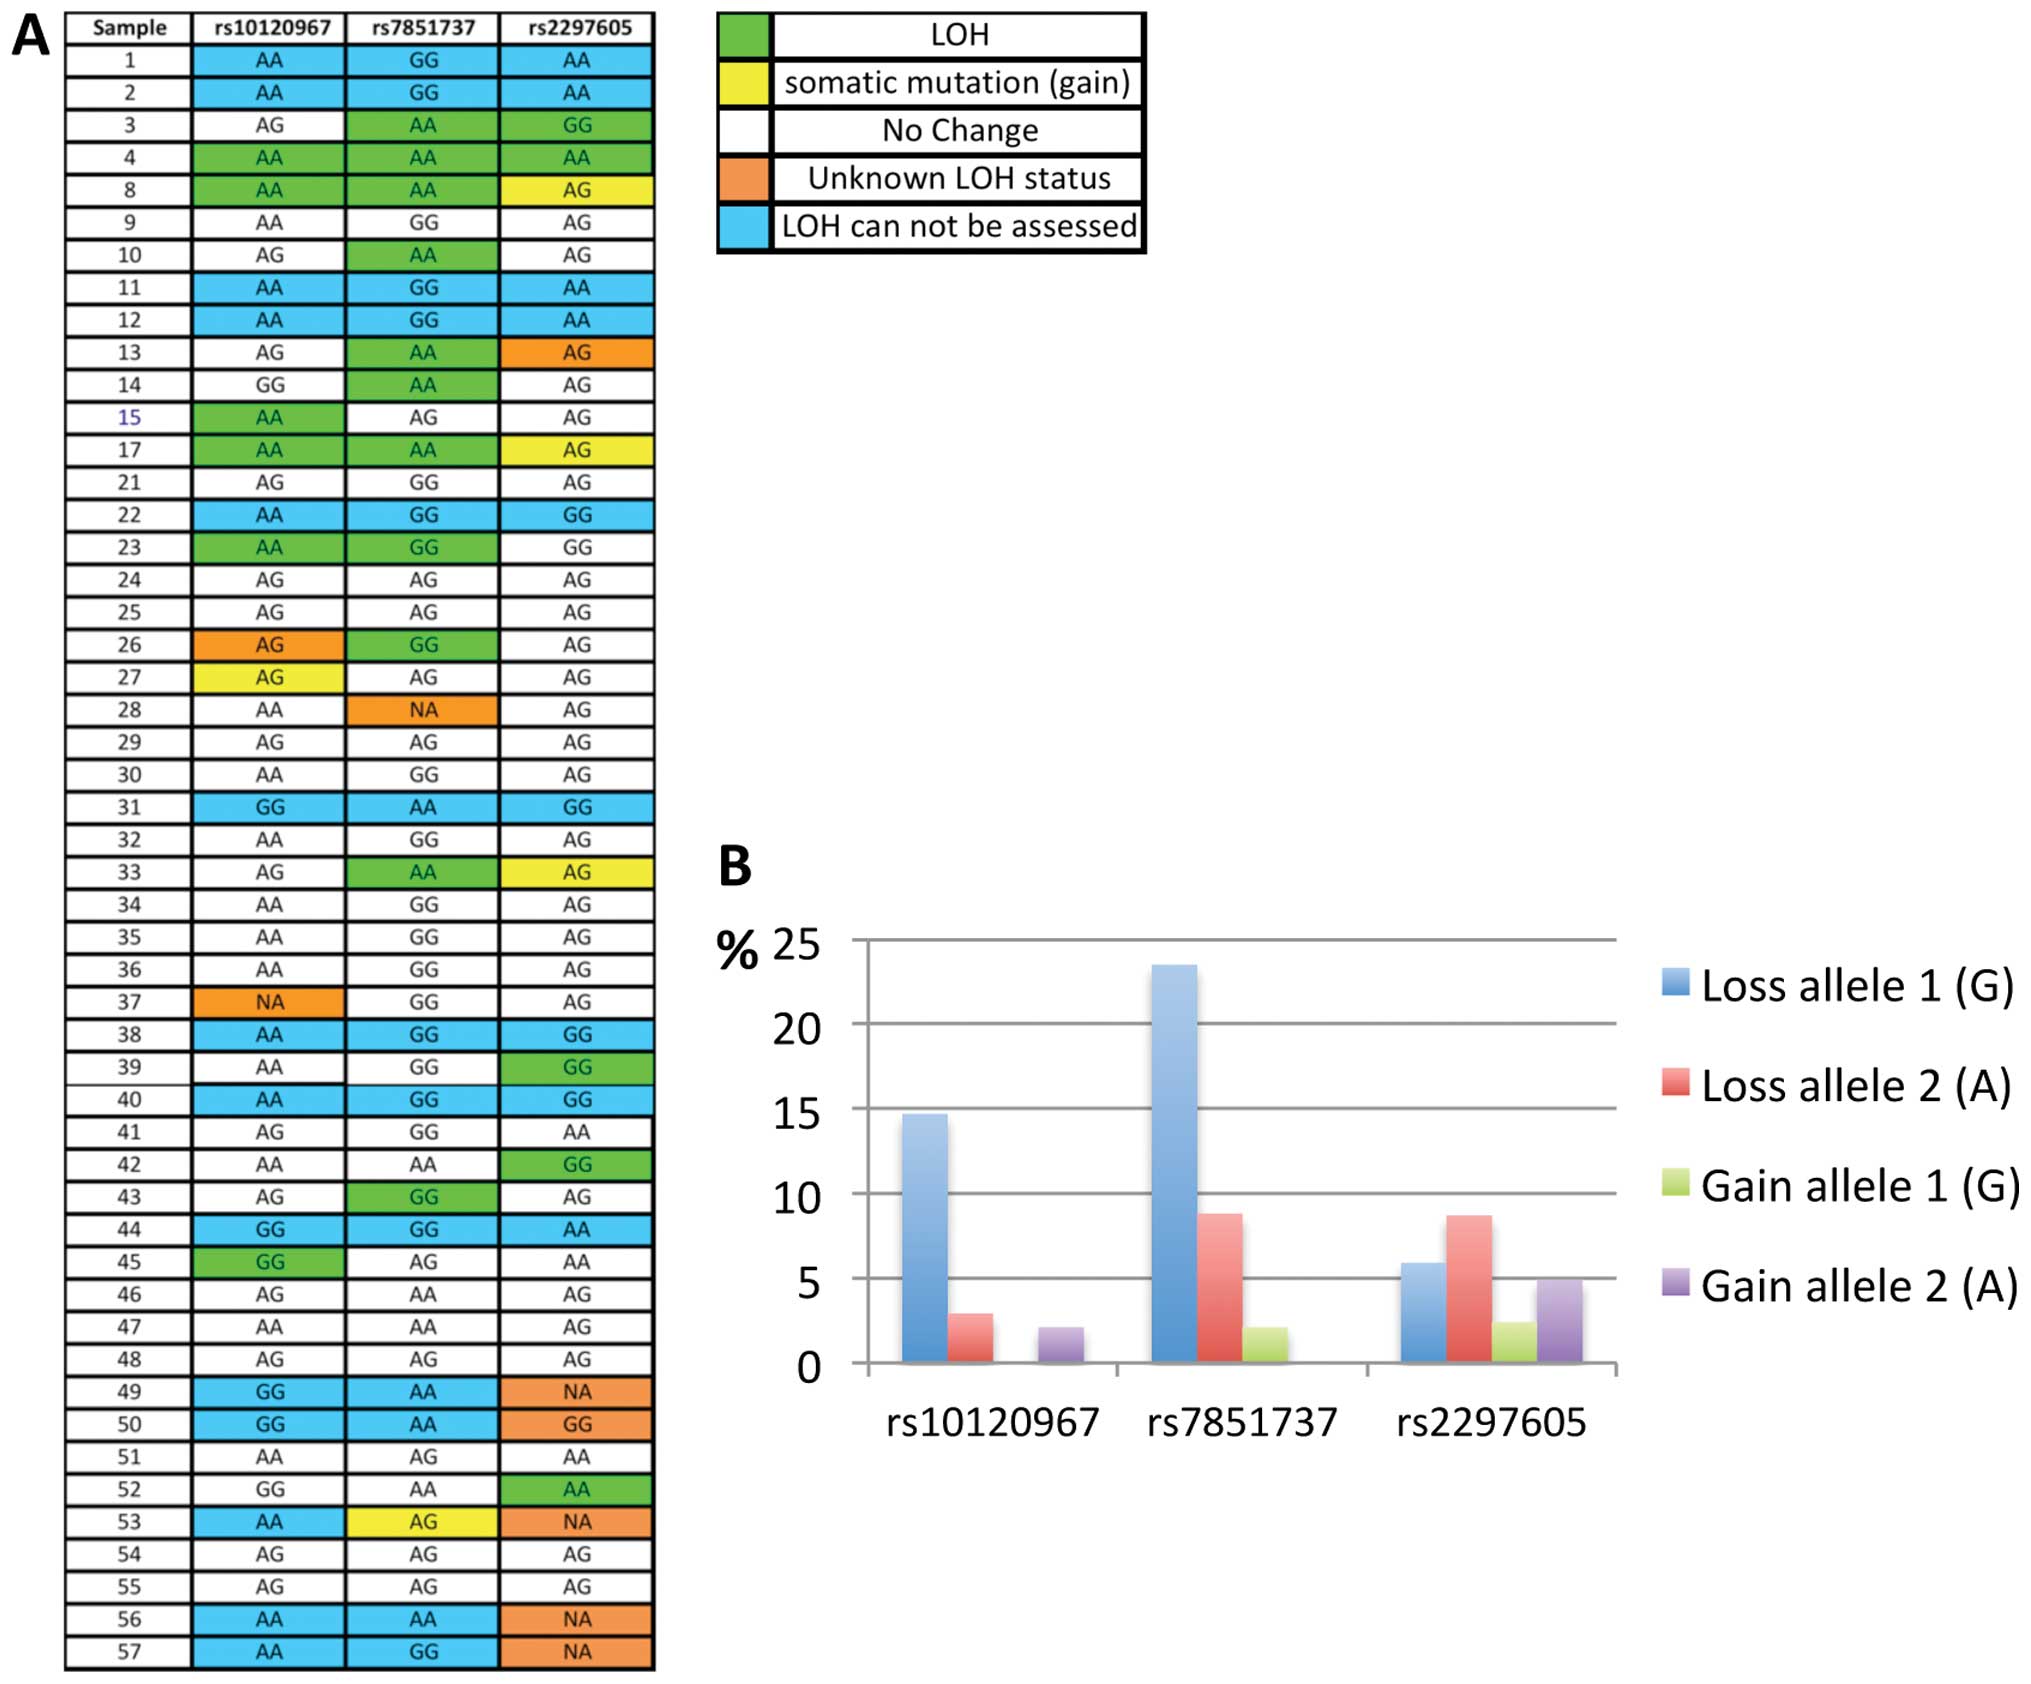
The genotyping results for the ovarian tumors and
the LOH data for each sample, are shown in Fig. 1A. These data show that out of the
36 ovarian tumor tissues that were heterozygous for at least one of
the three NR5A1 gene SNPs, 16 (44%) had LOH (Figs. 1A and 2). The majority of the ovarian tumors had
a single LOH event at the NR5A1 locus (out of maximum three
possible), but 5 tumors (14%) showed multiple LOH events (Fig. 1A). Also, each SNP showed LOH in
multiple tumors, with rs7851737 showing most losses (Fig. 1B). Thus, LOH occurs frequently at
the NR5A1 locus in ovarian tumors.
With regards to the type of observed loss, LOH
events at rs2297605 were equally distributed between the two
alleles, while the other two SNPs showed bias in the LOH events
towards one of the two alleles (Fig.
1B). The significance of this finding is unclear, since these
are non-coding SNPs. Interestingly, the genotyping results
(Fig. 1A) also uncovered somatic
mutations other than LOH in the tumors, manifested as allele gains;
base substitutions turning a homozygous genotype (normal DNA) into
a heterozygote genotype in the tumor, hence called ‘gain of
allele’; Fig. 1B. These somatic
NR5A1 substitutions were present in 10% of ovarian tumors
(Fig. 2). Thus the genotyping data
show frequent genetic (LOH/substitution) events at the NR5A1
locus in ovarian tumors.
Methylation of the NR5A1 gene in
ovarian tumors
A methylation-sensitive restriction enzyme (Afe1)
method (e.g. 19) was used to quantify site-specific methylation at
−30 bp (compared to translation start) of the NR5A1 gene
promoter in ovarian tumor tissue from patients with ovarian cancer
and in matched normal tissue from the same patients (when
available).
Afe1 cleaves genomic DNA at 5′-AGC/GCT-3′, but
cleavage is blocked by methylation (http://www.neb.com/nebecomm/products/productr0652.asp).
Since the Afe1 enzyme cleaves the un-methylated CpG’s, only
methylated CpG’s can be amplified and quantified following gel
electrophoresis. Complete DNA digestion was confirmed by prolonged
(overnight) Afe1 digestion, which yielded similar results (data not
shown). To control for differences in DNA level and/or quality
between tumor samples, we also amplified β-actin as an internal
control. The primers used for the β-actin gene were selected to
amplify a region that lacks an Afe1 cleavage site. Therefore,
β-actin is amplified regardless of methylation status, and relative
band intensity (NR5A1/β-actin) was used as a function of
NR5A1 gene methylation (see Materials and methods for
details). This analysis indicated that 36 out of 46 (78%) ovarian
tumors had appreciable NR5A1 methylation (2nd, 3rd and 4th
quartile of methylation levels), and 17/46 (37%) had high levels of
NR5A1 methylation (3rd and 4th quartile of methylation levels;
Table II). Thus the NR5A1
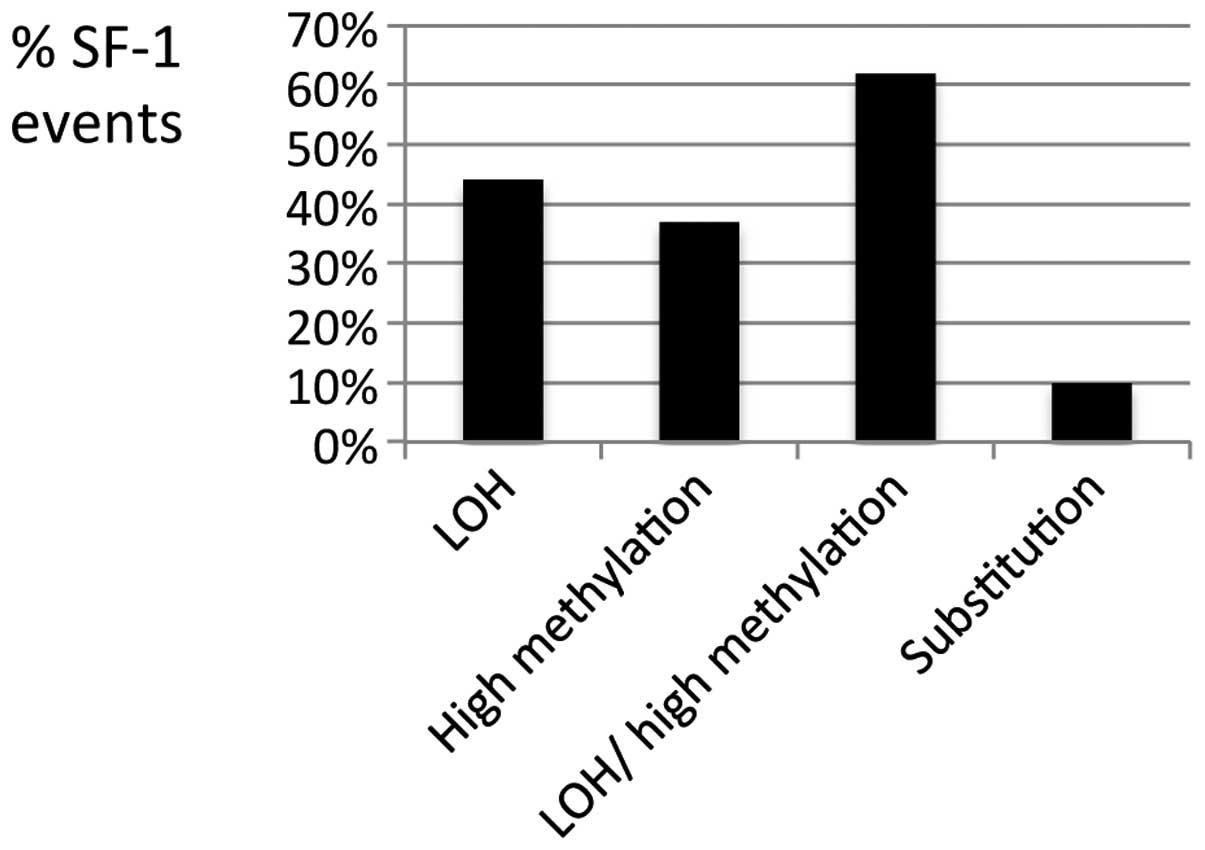
gene is methylated in most ovarian tumors. Furthermore, we detected
both a high level of NR5A1 gene methylation and LOH in 21%
of the ovarian tumors that we analyzed (Fig. 1 and Table II). The cumulative data also
demonstrate that 62% of the ovarian tumors have LOH, high level of
methylation, or both (Fig. 2) at
the NR5A1 locus.
| Table II.NR5A1 gene methylation in ovarian
tumors. |
Table II.
NR5A1 gene methylation in ovarian
tumors.
| Samples | Relative
intensity | Methylation
level |
|---|
| T1 | 0.24 | − |
| T2 | 0.81 | ++ |
| T3 | 1.14 | +++ |
| T4 | 0.78 | ++ |
| T8 | 0.35 | + |
| T9 | 0.72 | ++ |
| T10 | 0.02 | − |
| T11 | 0.34 | + |
| T12 | 0.40 | + |
| T13 | 0.77 | ++ |
| T14 | 0.48 | + |
| T15 | 0.54 | + |
| T17 | 0.40 | + |
| T21 | 0.45 | + |
| T22 | 0.62 | ++ |
| T23 | 0.58 | ++ |
| T24 | 0.56 | + |
| T25 | 0.68 | ++ |
| T26 | 0.37 | + |
| T27 | 0.87 | +++ |
| T28 | 0.55 | + |
| T29 | 0.78 | ++ |
| T30 | 0.83 | ++ |
| T31 | 0.58 | ++ |
| T32 | 0.09 | − |
| T33 | 0.57 | + |
| T34 | 0.32 | + |
| T35 | 0.17 | − |
| T36 | 0.53 | + |
| T37 | 0.43 | + |
| T38 | 0.54 | + |
| T39 | 0.57 | ++ |
| T40 | 0.42 | + |
| T41 | NA | NA |
| T42 | 0.75 | ++ |
| T43 | NA | NA |
| T44 | 0.14 | − |
| T45 | 0.00 | − |
| T46 | 1.14 | +++ |
| T47 | NA | NA |
| T48 | NA | NA |
| T49 | 0.10 | − |
| T50 | 0.11 | − |
| T51 | 0.79 | ++ |
| T52 | 0.53 | + |
| T53 | 1.07 | +++ |
| T54 | 0.00 | − |
| T55 | 0.00 | − |
| T56 | 0.54 | + |
| T57 | 0.30 | + |
As indicated by Table
I, most ovarian tumors are diagnosed at an advanced stage,
reducing the ability to obtain normal ovarian tissue from most
patients. In the absence of an adequate number of matched normal
ovaries available for study, 16 non-tumor ovaries were analyzed
(from unrelated individuals) to evaluate the relative methylation
of the promoter region of the NR5A1 gene in normal ovarian
tissue, with the same methylation-sensitive restriction enzyme
method used above. Since human ovarian tumors have epithelial
origin (2,20), we obtained OSE cells from these
ovarian tissues (by laser-capture microdissection) and analyzed
them following DNA extraction. β-actin was again amplified from
each sample as an internal control. These data show that only one
out of the 11 (9%) normal ovaries that were successfully evaluated
(i.e. that had β-actin amplification) showed appreciable
NR5A1 methylation (Table
III). This difference between the prevalence of NR5A1
methylation in tumor versus normal ovaries is statistically
significant (p<0.0001). Thus, ovarian tumor tissues display
significantly more frequent NR5A1 gene methylation than
normal ovarian epithelial tissues.
| Table III.NR5A1 gene methylation in normal
ovaries. |
Table III.
NR5A1 gene methylation in normal
ovaries.
| Samples | Relative
intensity | Methylation
level |
|---|
| N41 | 0 | − |
| N61 | 1.5 | +++ |
| N44 | 0.1 | − |
| N34 | NA | NA |
| N45 | 0.16 | − |
| N60 | 0 | − |
| N42 | 0 | − |
| N59 | 0 | − |
| N52 | 0 | − |
| N29 | NA | NA |
| N51 | 0 | − |
| N38 | 0 | − |
| N54 | NA | NA |
| N53 | 0.21 | − |
| N57 | NA | NA |
| N27 | NA | NA |
Clinical correlation
Retrospective analysis of the clinical data suggest
that presenting stage and histologic grade of ovarian tumors are
not significantly affected by the presence of somatic NR5A1
gene alterations (Table I and data
not shown). Furthermore, Kaplan-Meier survival curves were similar
for both ovarian tumors with and without NR5A1 gene
alteration (LOH/methylation; data not shown). Likewise, the
presence of NR5A1 gene alteration did not correlate with
race/ethnicity or treatment, such as radiation and chemotherapy
(Table I and data not shown).
Discussion
A common feature of many tumor suppressor genes is
their inactivation in cancer tissue through LOH and other somatic
mutations. In ovarian tumors, LOH and somatic mutations have been
documented for tumor suppressors such as TP53, BRCA1,
BRCA2 and PTEN(21).
The data presented herein support such a role for human SF-1, and
may provide a molecular mechanism to partially explain the loss of
SF-1 protein reported in both ovarian tumors and ovarian cancer
cell lines. Specifically, the data demonstrate that most ovarian
tumors contain genetic and/or epigenetic alterations at the
NR5A1 locus, significantly more frequently compared to
normal ovaries. These somatic alterations include LOH, base
substitution, and methylation of the NR5A1 gene promoter.
The absence of correlation between the presence of somatic
NR5A1 gene alteration and disease treatment
(radiation/chemotherapy) suggests that these somatic events are not
the result of cancer treatment. These data suggest the need for
scanning the NR5A1 gene for somatic mutations in larger
datasets, with diverse racial/ethnic groups, and perhaps in other
types of tumor tissues controlled by SF-1.
Given the prevalence of somatic events at the
NR5A1 locus, we attempted to examine the contribution of
these molecular events on clinical endpoints, such as disease
progression and survival. Interestingly, genetic and epigenetic
NR5A1 alterations do not correlate with markers of tumor
progression (grade/stage) or survival. This finding suggests that
somatic NR5A1 alterations may be early events in ovarian
carcinogenesis. Analysis of the early stage/grade tumors in our
dataset suggests a similar prevalence of somatic NR5A1
alterations in advanced and non-advanced tumors (data not shown).
However, this interpretation is tempered by the existence of low
numbers of non-advanced tumors in our dataset (Table I). Examination of larger numbers of
non-advanced and/or benign tumors for somatic NR5A1
alterations, may help confirming this concept.
The finding of somatic NR5A1 gene mutations
(gain of allele substitutions) in 10% of the ovarian tumors
(Fig. 2) is striking, given the
fact that we interrogated only three base pairs of the NR5A1
gene in these assays (the three SNP positions). This fact together
with the finding of LOH at this locus in 44% of the ovarian tumors
(Fig. 2), strongly suggest a high
somatic mutation frequency of the NR5A1 gene in ovarian
cancer. Thus, the NR5A1 gene should be screened for somatic
mutations by a more comprehensive method (such as sequencing) in
both advanced and benign ovarian tumors, especially tumors that
show LOH. This analysis should include the NR5A1 gene
promoter, since SF-1 protein expression is lost in both human
ovarian tumors and tumor cell lines. Identification of a somatic
mutation and/or methylation together with LOH in the same tumor,
may explain the loss of SF-1 protein reported in ovarian tumor
tissue. To that effect, the detection of both a high level of
NR5A1 gene methylation and LOH in 21% of the ovarian tumors
that we analyzed (Fig. 1 and
Table II), may partially explain
this loss.
LOH can be caused by two different mechanisms in
tumor cells: i) deletion (loss of allele/gene) or ii) base
substitution (which includes gene conversion). Although 14% of the
tumors had multiple LOH events (Fig.
1) suggesting a deletion at the NR5A1 locus, the
majority of LOH events involved only one (out of three possible)
SNPs at the NR5A1 locus (Fig.
1), suggesting no extensive NR5A1 deletion, at least
around the three interrogated SNPs. However, even a microdeletion
involving only the genomic area around a single NR5A1 SNP
can affect SF-1 protein expression. Also, gene conversion involves
recombination (22), which may
cause deletions, rearrangements and other functionally important
(for SF-1 expression) genetic events upstream or downstream from
the interrogated SNPs (undetected by our assay). Furthermore, both
molecular heterogeneity within the same tumor and contamination
with normal cells can result in underestimation of the extent of
LOH, or confinement of the observed LOH in a smaller genetic
region. In addition, the high somatic mutation frequency observed
at the NR5A1 locus may have functional effects. Therefore,
the frequently observed genetic (LOH/substitution) events at the
NR5A1 locus may significantly contribute to the reported
loss of SF-1 protein in ovarian tumor tissue.
A limitation of the methylation-sensitive
restriction enzyme method utilized here is that the use of PCR,
which exponentially amplifies the target DNA, makes the method less
quantitative. For this reason, we included β-actin as an internal
control, and also focused our methylation analysis on quartiles of
methylation rather than absolute levels. The significant difference
observed in the frequency of appreciable methylation (2nd quartile
or higher) between tumor and normal ovarian tissue (Tables II and III) suggests that NR5A1
methylation is much more prevalent in tumors. The exact degree of
methylation, and the subsequent reduction of SF-1 protein, is hard
to estimate from these data. However, the fact that the 37% of the
ovarian tumors that show high methylation (++ or higher methylation
level; Fig. 2) display >57% of
the band intensity of β-actin (Table
II), suggests that a significant proportion of the NR5A1 gene
is methylated in these ovarian tumors in vivo. Thus methylation may
be a major molecular mechanism leading to the reported loss of SF-1
protein in ovarian tumors.
Interestingly, hypomethylation and subsequent
transcriptional activation of SF-1 has been reported in
endometriosis, an estrogen dependent disease (23). In contrast, hypermethylation
leading to silencing of gene expression has been reported in
ovarian tumors for multiple key tumor suppressor genes including
BRCA1, BRCA2, WT1, APC, CDKN2A
and MLH1(24,25).
In conclusion, we report frequent somatic
alterations of the NR5A1 locus in ovarian tumors, including LOH,
base substitution, and methylation of the NR5A1 gene promoter.
These molecular abnormalities may partially explain the loss of
SF-1 protein, and contribute to the model of SF-1 as an ovarian
tumor suppressor. The existence of both genetic and epigenetic
NR5A1 gene abnormalities in ovarian tumors further suggest that
SF-1 is a common and important target in ovarian
carcinogenesis.
Abbreviations:
|
SF-1
|
steroidogenic factor-1
|
|
StAR
|
steroidogenic acute regulatory
protein
|
|
OSE
|
ovarian surface epithelial
|
|
ERα
|
estrogen receptor α
|
|
ERβ
|
estrogen receptor β
|
|
EOC
|
epithelial ovarian cancer
|
|
Rb1
|
retinoblastoma 1
|
|
SNP
|
single nucleotide polymorphism
|
Acknowledgements
NMM is supported by grants
P20GM103518, from the National Institutes of Health and PC094628,
from the Department of Defense.
References
|
1.
|
Ozols RF: Treatment goals in ovarian
cancer. Int J Gynecol Cancer. 15(Suppl 1): 3–11. 2005. View Article : Google Scholar : PubMed/NCBI
|
|
2.
|
Leung PC and Choi JH: Endocrine signaling
in ovarian surface epithelium and cancer. Hum Reprod Update.
13:143–162. 2007. View Article : Google Scholar : PubMed/NCBI
|
|
3.
|
Rae MT, Niven D, Ross A, Forster T, Lathe
R, Critchley HOD, Ghazal P and Hillier SG: Steroid signalling in
human ovarian surface epithelial cells: the response to
interleukin-1alpha determined by microarray analysis. J Endocrinol.
183:19–28. 2004. View Article : Google Scholar : PubMed/NCBI
|
|
4.
|
Papacleovoulou G, Hogg K, Fegan KS,
Critchley HO, Hillier SG and Mason JI: Regulation of
3beta-hydroxysteroid dehydrogenase type 1 and type 2 gene
expression and function in the human ovarian surface epithelium by
cytokines. Mol Hum Reprod. 15:379–392. 2009. View Article : Google Scholar : PubMed/NCBI
|
|
5.
|
Ivarsson K, Sundfeldt K, Brannstrom M and
Janson PO: Production of steroids by human ovarian surface
epithelial cells in culture: possible role of progesterone as
growth inhibitor. Gynecol Oncol. 82:116–121. 2001. View Article : Google Scholar : PubMed/NCBI
|
|
6.
|
Okamura H, Katabuchi H and Ohba T: What we
have learned from isolated cells from human ovary? Mol Cell
Endocrinol. 202:37–45. 2003. View Article : Google Scholar : PubMed/NCBI
|
|
7.
|
Nash DM, Hess SA, White BA and Peluso JJ:
Steroidogenic factor-1 regulates the rate of proliferation of
normal and neoplastic rat ovarian surface epithelial cells in
vitro. Endocrinology. 139:4663–4671. 1998.PubMed/NCBI
|
|
8.
|
Batsche E, Desroches J, Bilodeau S,
Gauthier Y and Drouin J: Rb enhances p160/SRC coactivator-dependent
activity of nuclear receptors and hormone responsiveness. J Biol
Chem. 280:19746–19756. 2005. View Article : Google Scholar : PubMed/NCBI
|
|
9.
|
Tran PV, Akana SF, Malkovska I, Dallman
MF, Parada LF and Ingraham HA: Diminished hypothalamic bdnf
expression and impaired VMH function are associated with reduced
SF-1 gene dosage. J Comp Neurol. 498:637–648. 2006. View Article : Google Scholar : PubMed/NCBI
|
|
10.
|
Syed V, Ulinski G, Mok SC, Yiu GK and Ho
SM: Expression of gonadotropin receptor and growth responses to key
reproductive hormones in normal and malignant human ovarian surface
epithelial cells. Cancer Res. 61:6768–6776. 2001.
|
|
11.
|
Hinkula M, Pukkala E, Kyyrönen P and
Kauppila A: Incidence of ovarian cancer of grand multiparous women
- A population-based study in Finland. Gynecol Oncol. 103:207–211.
2006. View Article : Google Scholar : PubMed/NCBI
|
|
12.
|
Sugawara T, Kiriakidou M, McAllister JM,
Holt JA, Arakane F and Strauss JF III: Regulation of expression of
the steroidogenic acute regulatory protein (StAR) gene: a central
role for steroidogenic factor 1. Steroids. 62:5–9. 1997. View Article : Google Scholar : PubMed/NCBI
|
|
13.
|
Fujieda K, Tajima T, Nakae J, Sageshima S,
Tachibana K, Suwa S, Sugawara T and Strauss JF III: Spontaneous
puberty in 46,XX subjects with congenital lipoid adrenal
hyperplasia. Ovarian steroidogenesis is spared to some extent
despite inactivating mutations in the steroidogenic acute
regulatory protein (StAR) gene. J Clin Invest. 99:1265–1271. 1997.
View Article : Google Scholar
|
|
14.
|
Ramayya MS, Sheng M, Moroz K, Hill SM and
Rowan BG: Human steroidogenic factor-1 (hSF-1) regulates
progesterone biosynthesis and growth of ovarian surface epithelial
cancer cells. J Steroid Biochem Mol Biol. 119:14–25. 2010.
View Article : Google Scholar
|
|
15.
|
Abd-Elaziz M, Moriya T, Akahira J, Suzuki
T and Sasano H: StAR and progesterone producing enzymes
(3beta-hydroxysteroid dehydrogenase and cholesterol side-chain
cleavage cytochromes P450) in human epithelial ovarian carcinoma:
immunohistochemical and real-time PCR studies. Cancer Sci.
96:232–239. 2005. View Article : Google Scholar
|
|
16.
|
Taketo M, Parker KL, Howard TA, Tsukiyama
T, Wong M, Niwa O, Morton CC, Miron PM and Seldin MF: Homologs of
Drosophila Fushi-Tarazu factor 1 map to mouse chromosome 2
and human chromosome 9q33. Genomics. 25:565–567. 1995.
|
|
17.
|
Schultz DC, Vanderveer L, Buetow KH,
Boente MP, Ozols RF, Hamilton TC and Godwin AK: Characterization of
chromo-some 9 in human ovarian neoplasia identifies frequent
genetic imbalance on 9q and rare alterations involving 9p,
including CDKN2. Cancer Res. 55:2150–2157. 1995.
|
|
18.
|
Hoivik EA, Aumo L, Aesoy R, Lillefosse H,
Lewis AE, Perrett RM, Stallings NR, Hanley NA and Bakke M:
Deoxyribonucleic acid methylation controls cell type-specific
expression of steroidogenic factor 1. Endocrinology. 149:5599–5609.
2008. View Article : Google Scholar : PubMed/NCBI
|
|
19.
|
Nakamura J, Kitajima Y, Kai K, Hashiguchi
K, Hiraki M, Noshiro H and Miyazaki K: Expression of hypoxic marker
CA IX is regulated by site-specific DNA methylation and is
associated with the histology of gastric cancer. Am J Pathol.
178:515–524. 2011. View Article : Google Scholar : PubMed/NCBI
|
|
20.
|
Seidman JD, Russell P and Kurman RJ:
Surface epithelial tumors of the ovary. Blausten’s pathology of the
female genital tract. Kurman RJ: 5th ed. Springer; New York: pp.
791–904. 2002
|
|
21.
|
Despierre E, Lambrechts D, Neven P, Amant
F, Lambrechts S and Vergote I: The molecular genetic basis of
ovarian cancer and its roadmap towards a better treatment. Gynecol
Oncol. 117:358–365. 2010. View Article : Google Scholar : PubMed/NCBI
|
|
22.
|
Chen JM, Cooper DN, Chuzhanova N, Férec C
and Patrinos GP: Gene conversion: mechanisms, evolution and human
disease. Nat Rev Genet. 8:762–775. 2007. View Article : Google Scholar : PubMed/NCBI
|
|
23.
|
Xue Q, Lin Z, Yin P, Milad MP, Cheng YH,
Confino E, Reierstad S and Bulun SE: Transcriptional activation of
steroidogenic factor-1 by hypomethylation of the 5′ CpG island in
endometriosis. J Clin Endocrinol Metab. 92:3261–3267.
2007.PubMed/NCBI
|
|
24.
|
Balch C, Fang F, Matei DE, Huang TH and
Nephew KP: Minireview: epigenetic changes in ovarian cancer.
Endocrinology. 150:4003–4011. 2009. View Article : Google Scholar : PubMed/NCBI
|
|
25.
|
Barton CA, Hacker NF, Clark SJ and O’Brien
PM: DNA methylation changes in ovarian cancer: implications for
early diagnosis, prognosis and treatment. Gynecol Oncol.
109:129–139. 2008. View Article : Google Scholar : PubMed/NCBI
|