Introduction
Although the incidence and mortality of gastric
cancer (GC) has gradually decreased in East Asia, the disease
remains the second most frequent cause of death in Korea (1). GC is the fourth most common type of
cancer and the second leading cause of death worldwide. Nearly one
million new cases are diagnosed each year (2). Surgery is an effective treatment for
GC, and recent research has shown that chemotherapy is an effective
adjuvant therapy for East Asian patients following radical surgery
(3).
Recent attempts have been made to identify
biomarkers predicting survival or recurrence in GC. Human epidermal
growth factor receptor 2 (Her2) is associated with aggressive
behavior in 15–25% of breast cancer cases and approximately 10% of
GC cases. Combined therapy with trastuzumab (a monoclonal antibody
against HER2) and conventional chemotherapy is superior to
conventional chemotherapy alone in the treatment of GC (4). Despite advances in the understanding
of GC at the molecular level and the emergence of targeted therapy
in GC, predictive biomarkers have remained elusive (5–7).
We previously conducted a proteomic analysis of 152
human gastric cancer clinical specimens to identify proteins
differentially expressed in gastric tumor tissues compared to
normal tissues. Out of 430 proteins, the analysis identified
F-actin capping protein α1 subunit (CAPZA1) (8). Capping protein (CP) is a heterodimer
composed of α and β subunits. Each subunit has a mass of ∼30 kDa.
Lower organisms, including Saccharomyces cerevisiae,
Caenorhabditis elegans and Drosophila melanogaster,
have one gene and one isoform for each of the CP α and β subunits
(9–11). Vertebrates have three α subunit
isoforms encoded by three different genes. Two very similar
isoforms for the CP α subunit, α1 and α2, have been identified in
chickens, mice and humans (12–14).
The α3 subunit is only expressed in mouse testicular germ cells and
has a different amino acid sequence than α1 and α2 (15). In contrast, three β subunit
isoforms (β1, β2 and β3) are produced from one gene by alternative
splicing (16–18).
CP has been identified in platelets and its
interaction with cytoskeletal actin has been characterized. One
study (19) reported CP release
from activated platelet cytoskeleton 5 to 15 sec following
activation with thrombin; however, another study reported that CP
plays an important role in maintaining the resting form of
platelets by binding to available barbed ends (20).
The aim of the present study was to determine
whether CAPZA1 may be used as a prognostic marker in GC. The
potential association between CAPZA1 overexpression, assessed by
immunohistochemistry and clinicopathological features, including
survival, was evaluated. Results showed that CAPZA1 overexpression
in GC is associated with well differentiated histology, smaller
tumor size, lower T stage, absence of lymph node (LN) metastasis,
lower TNM stage, lower recurrence rate and longer survival time,
compared to CAPZA1 underexpression.
Materials and methods
Stomach tissue samples
GC tissue specimens were surgically resected from
327 patients who underwent gastrectomy at Gyeongsang National
University Hospital between January 1, 2004 and December 31, 2007.
Medical charts and pathological reports were reviewed to assess
clinicopathological parameters such as age, gender, histological
subtype, presence of lymphatic invasion, invasion depth, presence
of LN or distant metastasis and pathological TNM stage (AJCC, 7th
edition). In cases of death, the cause of death was identified by
consulting the National Statistical Office of the Republic of
Korea. Among the 327 patients, 98.8% had undergone curative
resection (R0) according to the guidelines of the International
Union Against Cancer. Clinical outcome was evaluated during the
time period extending from the date of surgery to death or January
31, 2010. Cases lost to follow-up and non-GC-related deaths were
regarded as censored data in the survival analysis. The study was
approved by the Institutional Review Board of Gyeongsang National
University Hospital (GNUHIRB 2009-54).
Tissue microarrays (TMA)
Core tissue biopsy specimens (2 mm in diameter) were
obtained from individual formalin-fixed and paraffin-embedded
archival tissue (donor blocks). These were arranged in new
recipient paraffin blocks using a trephine apparatus (Quick-RAY™,
Unitma, Seoul, Korea). One tissue core from the area near the
invasive front was analyzed. TMA blocks were constructed for all
327 cases.
Immunohistochemistry
Immunohistochemical staining was performed using 4
μm-thick tissue sections. Briefly, the tissue section was
deparaffinized and rehydrated. To reduce non-specific background
staining due to endogenous peroxidase, the slide was incubated in
3% H2O2 for 10 min. For epitope retrieval,
the specimen was heated for 20 min in 10 mmol/l citrate buffer (pH
6.0) in a microwave oven (700 W). After incubation with Ultra V
Block (Lab Vision Corporation, Fremont, CA, USA) for 7 min at room
temperature to block background staining, the slide was incubated
at room temperature for 1 h with a rabbit polyclonal antibody
specific for CAPZ (ProteinTech Group, Chicago, IL, USA; dilution
1:50). Antibody binding was detected using the UltraVision LP
detection system (Lab Vision Corporation) in accordance with the
manufacturer’s recommendations. Color development was performed
with 3-3′-diaminobenzidine and the slides were then counterstained
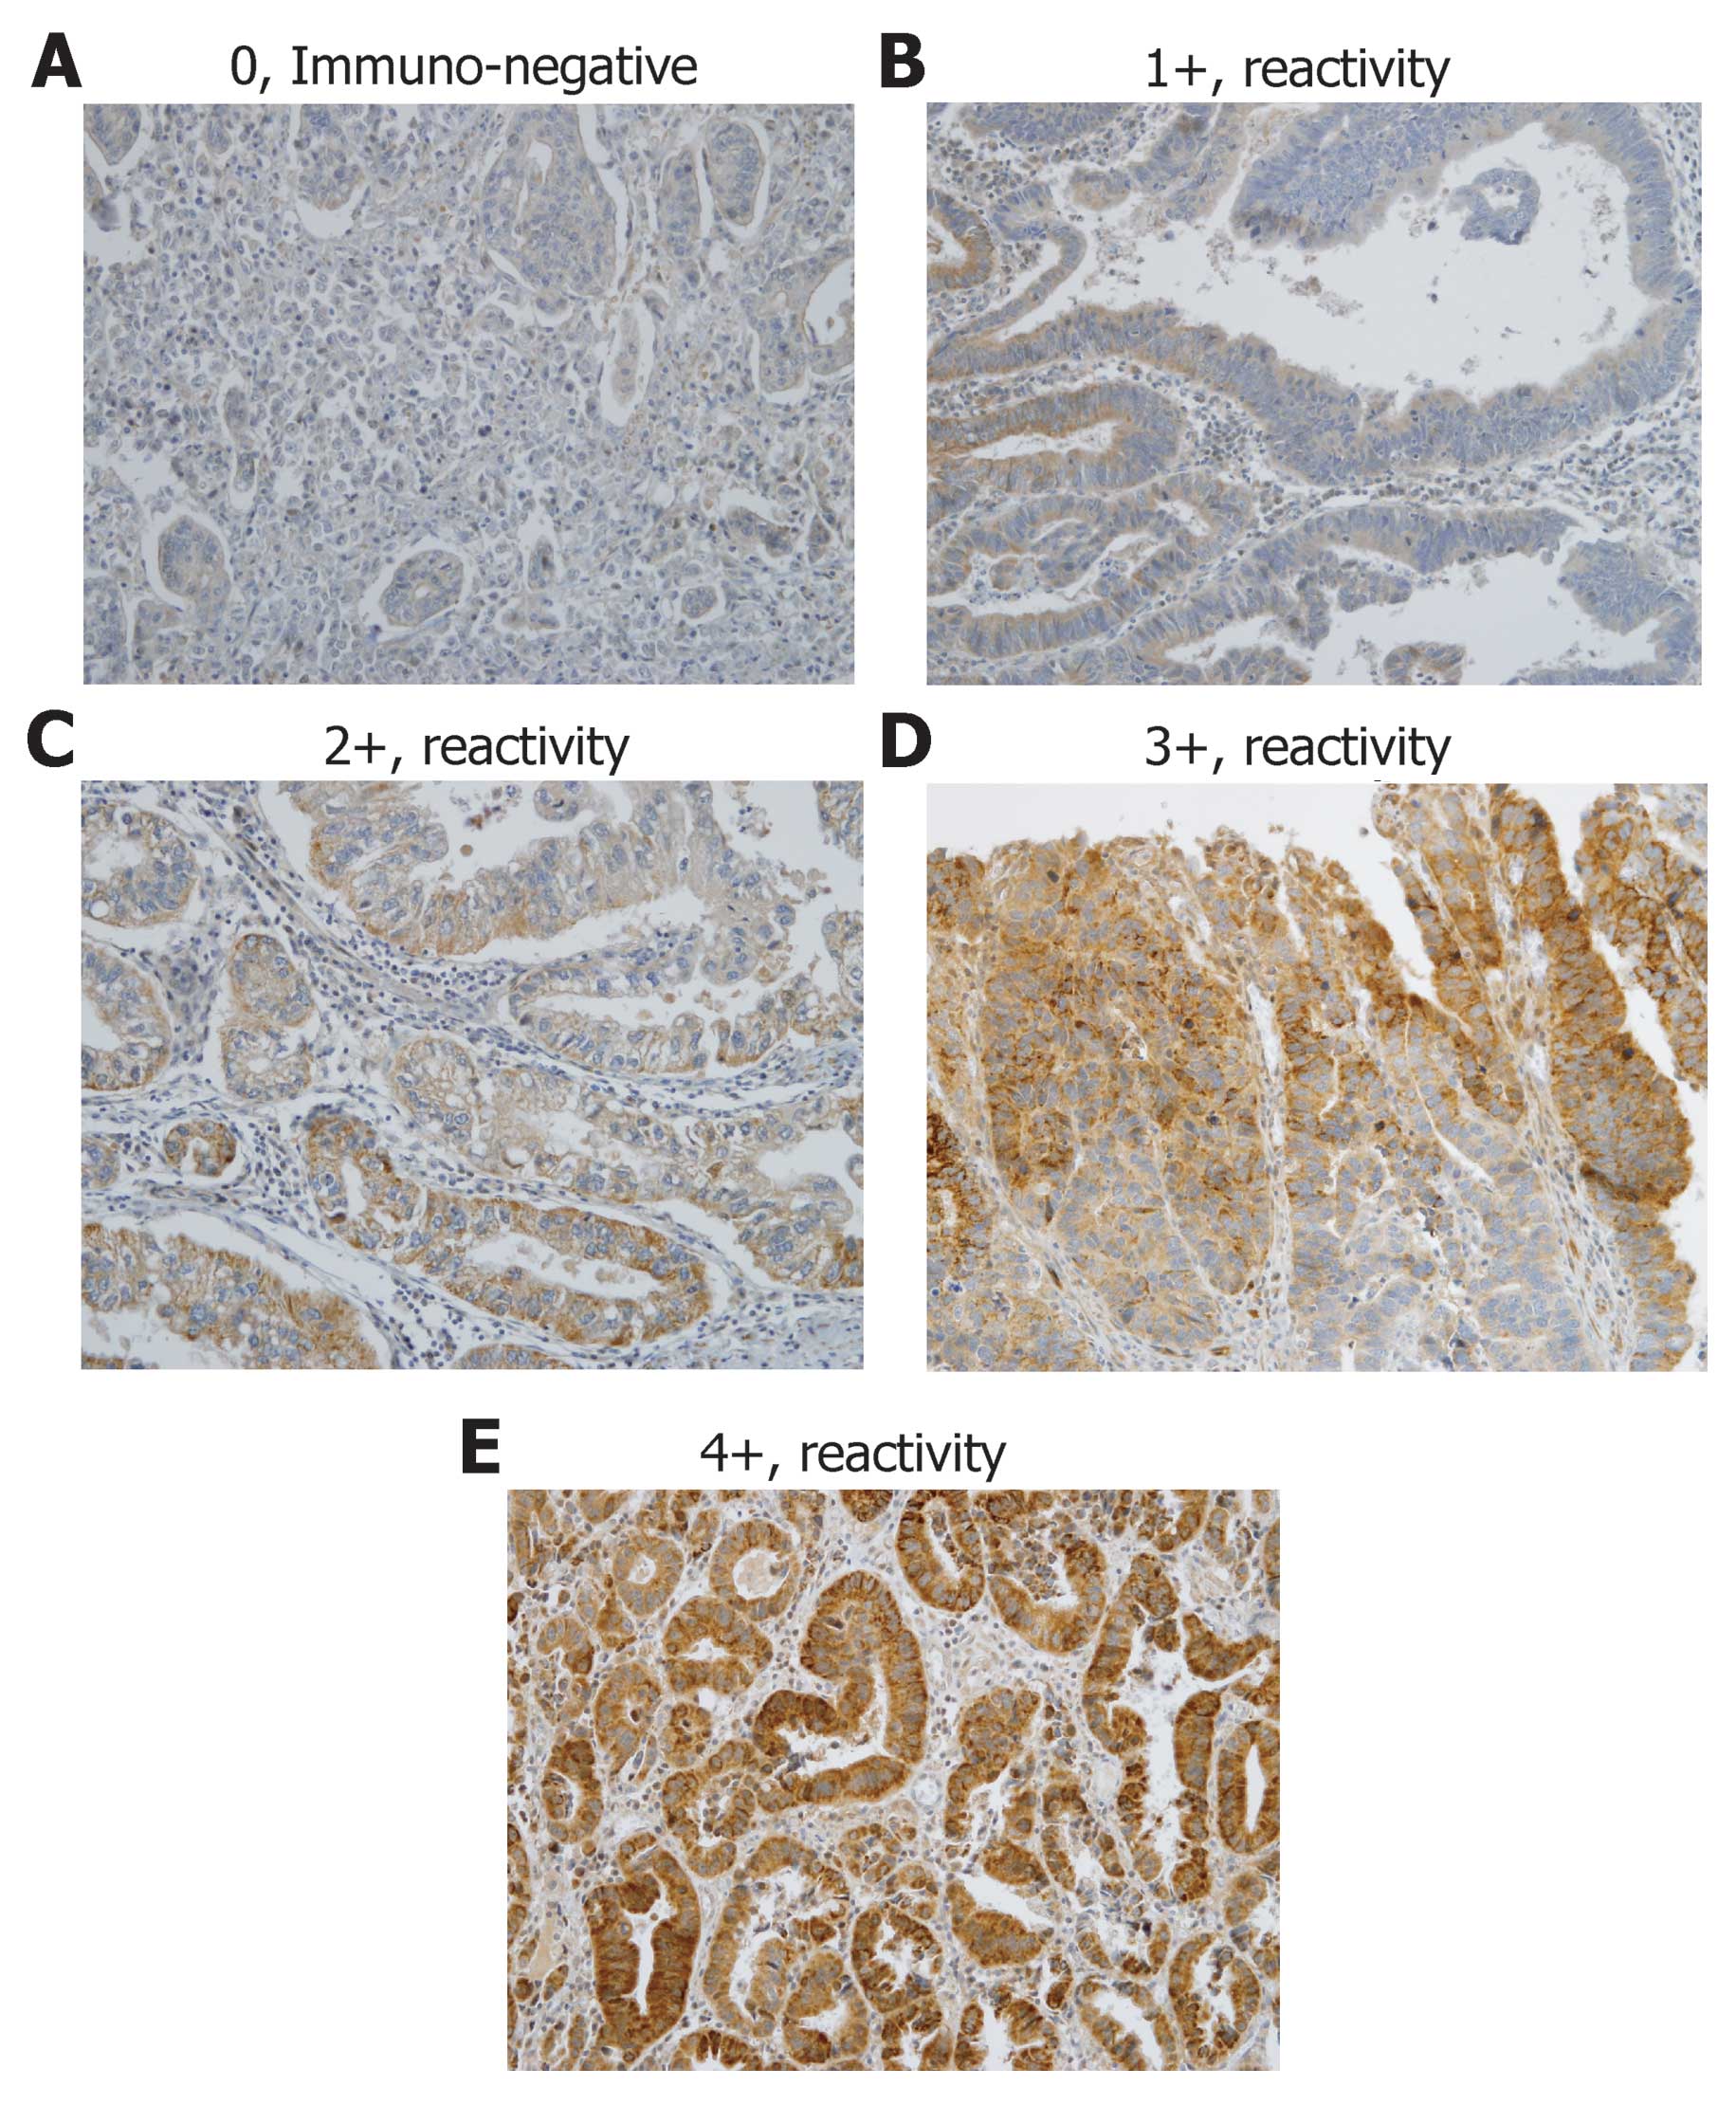
with hematoxylin. The expression of CAPZ was scored by a
pathologist who was blinded to the clinicopathological data.
Cytoplasmic immunoreactivity was scored from 1 to 4 according to
the percentage of cells positive for CAPZ: 1+ (1–24%), 2+ (25–49%),
3+ (50–74%) or 4+ (75–100%) (Fig.
1) (21).
RNA interference
Two different siRNA oligonucleotide duplexes
targeting CAPZA1 genes (designated siCAPZA1-A and siCAPZA1-B) were
purchased from Samchully (Seoul, Korea). The sequences were 5′-CUG
UGA AGA UAG AAG GAU A-3′ (siCAPZA1-A) and 5′-GGA ACA AGA UAC UCA
GCU A-3′ (siCAPZA1-B). Transient transfection of each siRNA duplex
was achieved using the siLentiFect™ Reagent (Bio-Rad) in accordance
with the manufacturer’s instructions. After 24 h of incubation, the
cells were harvested. The efficiency of each siRNA duplex was
confirmed by western blot analysis using anti-CAPZA1 antibody.
Construction of the CAPZA1 expression
plasmid and transfection
Human CAPZA1 cDNA was amplified by polymerase chain
reaction (PCR) using the following two sets of primers:
5′-AGCTAAGCTTCCACCATGGCCGACTTCGATGAT-3′ and
5′-AATTGAATTCTTAAGCATTCTGCATTTCTTT-3′. The PCR products were cloned
into the expression vector, pCMV-Tag2B/G418 (Invitrogen). MKN-45
cells were transfected with CAPZA1-encoding plasmid using the
TerboFect™ reagent (Fermentas, Glen Burnie, MD, USA) in accordance
with the manufacturer’s instructions. After 48 h of incubation, the
cells were exposed to neomycin for selection. CAPZA1 expression in
neomycin-resistant clones was assessed by western blot analysis.
The pCMV-Tag2B/G418 empty vector was used to generate control cells
resistant to neomycin.
Invasion and migration assays
Invasion across an ECMatrix-coated membrane was
assayed using the QCM™ 24-Well Cell Invasion Assay (Millipore)
(6). Migration across the membrane
was assayed using the QCM 24-Well Cell Migration Assay (Millipore).
Both assays were used in accordance with the manufacturer’s
instructions. The following steps were applied to both assays.
Cells were grown in 6-well plates to 70% confluence. Cells were
serum-starved for 18 h. Serum-starved cells were harvested and
resuspended in 1 ml of serum-free medium. A 250 μl volume of
cell suspension (1×10⁶ cells/ml) was added to each
insert and 500 μl of appropriate medium containing 20% FBS
(chemoattractant) was added to the lower chamber. The chambers were
incubated for 20 h at 37°C in a 5% CO2 atmosphere. All
cells and medium remaining in the insert were removed by pipetting.
The invasion chamber insert was transferred into a clean well
containing 225 μl of pre-warmed Cell Detachment Solution and
incubated for 30 min at 37°C. The insert was then removed from the
well. A 75 μl volume of lysis buffer/dye solution (CyQuant
GR Dye, 1:75 with 4X lysis buffer) was added to each well, which
already contained 225 μl of Cell Detachment Solution and the
cells that invaded or migrated. After 15 min at room temperature, a
200 μl volume of the mixture was transferred to a 96-well
plate and fluorescence was assessed using a fluorescence plate
reader and a 480/520 nm filter set.
Proliferation assay
The cells were placed in a 24-well plate at a
concentration of 5×10⁵ cells/well. After 1 to 4 days of
incubation at 37°C in an atmosphere of 5% CO2, the cells
were trypsinized and resuspended in 3 ml of appropriate medium.
Cell suspensions were centrifuged at 1,000 rpm for 5 min. Cell
pellets were resuspended in 1 ml of appropriate medium. The cells
were stained with trypan blue and viable cells were counted using a
hemocytometer.
Statistical analysis
Statistical analysis was performed using the PASW
Statistics 18.0 software (IBM Corporation, Somers, NY, USA). The
data are presented as means ± SD. Significance was assessed using
the χ2 test, Student’s t-test, binary logistic
regression test, and the Kaplan-Meier method. All statistical tests
were two-sided and a p-value of <0.05 was considered to be
statistically significant.
Results
Patient demographics
The average age of the patients was 62.1 years. The
male to female ratio was 1.8 to 1. The mean tumor size was 4.2±2.7
cm and the mean number of metastatic LN was 2.3±5.4. The number of
tumors for each TNM stage was as follows: stage I, 69.4% (n=227);
stage II, 13.1% (n=43); stage III, 13.5% (n=43); and stage IV, 4.0%
(n=13). With regard to surgery type, subtotal, total and proximal
gastrectomy were performed in 231, 74 and 22 patients,
respectively. The LN dissections performed were D1+ (115, 35%) and
D2 (212, 65%). The mean period of follow-up was 55.3±23.2 months.
Recurrence occurred in 18.3% of the cases (n=60) and cancer-related
deaths occurred in 15% of the cases (n=49) (Table I).
 | Table IClinicopathological data from
patients in the tissue microarray experiment. |
Table I
Clinicopathological data from
patients in the tissue microarray experiment.
| Pathologic
variables | No. of
patients |
|---|
| WHO
classification | |
| WD | 66 |
| MD | 114 |
| PD | 99 |
| Mucinous | 8 |
| SRC | 33 |
| Lauren
classification | |
| Intestinal | 181 |
| Diffuse | 61 |
| Mixed | 7 |
| Tumor size and T
stages | |
| Mean tumor
size | 4.2±2.6 |
| Stage T1 | 176 |
| Stage T2 | 38 |
| Stage T3 | 185 |
| Stage T4 | 28 |
| Lymph node
metastasis | |
| Mean no. of
involved LN | 2.2±5.4 |
| Stage N0 | 218 |
| Stage N1 | 36 |
| Stage N2 | 34 |
| Stage N3 | 39 |
| TNM stage | |
| Stage I | 198 |
| Stage II | 58 |
| Stage III | 70 |
| Stage IV | 1 |
| Operation | |
| Subtotal
gastrectomy | 231 |
| Total | 74 |
| Proximal | 22 |
| Lymph node
dissection | |
| D1+ | 115 |
| D2 | 212 |
| Adjuvant
chemotherapy | |
| No | 136 |
| Yes | 191 |
| CAPZA1 expression
status | |
| Score: missing
value | 3 |
| 0 | 56 |
| 1 | 73 |
| 2 | 82 |
| 3 | 63 |
| 4 | 50 |
CAPZA1 protein expression was detected by
immunohistochemistry (IHC) in all 327 GC tissue specimens. The
intensity of CAPZ expression in the cytoplasm of cancer cells
varied. Of the 327 cases, 17.4% cases (57) scored 0, 22.3% (73)
scored 1+, 25.1% (82) scored 2+, 19.6% (64) scored 3+, and 4.0%
(13) scored 4+. Scores of 0 and
1+ were considered negative for CAPZA1 protein overexpression and
scores of 2+, 3+ and 4+ were considered positive. Normal and
metaplastic epithelial cells, smooth muscle cells, vascular
endothelial cells and plasma cells were weakly positive (Fig. 1).
Univariate and multivariate analysis of
risk factors for cancer-related death in GC
Differentiation was assessed according to the World
Health Organization (WHO) classification. Univariate analysis
revealed that poor differentiation (24.2%) was associated with
cancer-related death to a greater extent than well differentiated
histology (6.1%) or moderate differentiation (13.2%) (p= 0.04).
Advanced T stage, high LN stage, high TNM stage, D2 lymph node
dissection, adjuvant chemotherapy and CAPZA1 underexpression were
significantly associated with cancer-related death (Table II, p<0.05); however, when a
multivariate analysis was performed, only high TNM stage remained
significantly associated with cancer-related death (p<0.01).
| Table IIUnivarate analysis of risk factors
for cancer related death in gastric cancer. |
Table II
Univarate analysis of risk factors
for cancer related death in gastric cancer.
| Cancer related
death/total patients (%) | Univariate
analysis |
|---|
| WHO
classification | | 0.04 |
| WD | 4/66 (6.1) | |
| MD | 15/114 (13.2) | |
| PD | 24/99 (24.2) | |
| Mucinous | 1/8 (12.5) | |
| SRC | 4/33 (12.1) | |
| Pathologic tumor
stage | | <0.01 |
| T1 (mucosa) | 4/176 (2.3) | |
| T2
(submucosa) | 2/38 (5.3) | |
| T3
(subserosa) | 28/85 (32.9) | |
| T4 (serosa
invasion) | 15/28 (53.6) | |
| Pathologic lymph
node stage | | <0.01 |
| N0 | 7/218 (3.2) | |
| N1 (1,2) | 6/36 (16.7) | |
| N2 (3–6) | 15/34 (44.1) | |
| N3 (7-) | 21/39 (53.8) | |
| Pathologic TNM
stage | | <0.00 |
| I | 3/198 (1.5) | |
| II | 9/58 (15.5) | |
| III–IV | 37/71 (52.1) | |
| Operation | | 0.09 |
| Subtotal
gastrectomy | 29/231 (12.6) | |
| Total
gastrectomy | 17/74 (23) | |
| Proximal
gastrectomy | 3/22 (13.6) | |
| Lymph node
dissection | | <0.01 |
| D1+ | 3/115 (2.6) | |
| D2 | 46/212 (21.7) | |
| Adjuvant
chemotherapy | | <0.01 |
| No | 8/136 (5.9) | |
| Yes | 41/191 (21.5) | |
| CAPZA1 expression
status | | 0.01 |
| Underexpression
(0,1) | 28/129 (21.7) | |
| Overexpression
(2–4) | 21/195 (10.8) | |
CAPZA1 overexpression is associated with
a lower rate of tumor invasion, LN metastasis and recurrence
Based on the immunohistochemical staining of CAPZA1
in TMAs, patients were divided into two groups: CAPZA1
overexpression (CAZA1-OE) and CAPZA1 underexpression (CAPZA1-UE).
CAPZA1-OE was associated with well differentiated,
moderately-differentiated or mucinous histology, according to the
classification of the WHO (p<0.01); however, there was no
statistically difference in terms of intestinal and diffuse types
according to the Lauren classification (p=0.37). CAPZA1-OE
correlated with smaller tumor size (3.7 cm) compared to CAPZA1-UE
(4.8 cm) (p<0.01). CAPZA1-OE showed a significantly higher rate
of T1- and T2-stage cancer (62.1 vs. 14.4%) than CAPZA1-UE (40.3
vs. 7.8%), and a lower rate of T3- and T4-stage cancer (41.9 vs.
15.9% and 10.1 vs. 7.7%, respectively) (p<0.01). In addition,
the absence of LN metastasis in CAPZA1-OE (72.8%) was significantly
higher than in CPAZA1-UE (56.6%) (p=0.01). In terms of TNM stage,
the proportion of patients with TNM stage I in CAPZA1-OE was higher
than that in CAPZA1-UE (70.8 vs. 44.2%); however, the proportion of
patients with TNM stage II and III–IV in CAPZA1-UE was higher than
that in CAPZA1-OE (II, 27.9 vs. 11.3%, III–IV, 27.9 vs. 17.9%). D2
LN dissection was higher in CAPZA1UE (73.6%) than CAPZA1OE (59.5%),
and treatment with adjuvant chemotherapy was also higher in
CAPZA1UE (65.9%) than CAPZA1OE (53.8%); however, the recurrence
rate of CAPZA1-UE was significantly higher than that of CAPZA1-OE
(25.6 vs. 13.8%), as was the rate of cancer-related death (21.7 vs.
10.8%) (Table III).
| Table IIIComparison of the clinicopathological
features in the CAPZA1 underexpression and overexpression
groups. |
Table III
Comparison of the clinicopathological
features in the CAPZA1 underexpression and overexpression
groups.
| Levels of CAPZA1
expression
| |
|---|
| Underexpression 0,
1+ (%) | Overexpression 2+,
3+, 4+ (%) | P-value |
|---|
| WHO
classification | | | <0.01 |
| WD | 16 (12.6) | 49 (25.7) | |
| MD | 44 (34.6) | 69 (36.1) | |
| PD | 54 (42.5) | 44 (23) | |
| Mucinous | 1 (0.8) | 7 (3.7) | |
| SRC | 12 (9.4) | 21 (11) | |
| Lauren
classification | | | 0.37 |
| Intestinal | 69 (53.5) | 110 (56.4) | |
| Diffuse | 30 (23.3) | 31 (15.9) | |
| Mixed | 3 (2.3) | 4 (2.1) | |
| Mean tumor
size | 4.8±2.8 | 3.7±2.4 | <0.01 |
| Pathologic tumor
stage | | | <0.01 |
| T1 (mucosa) | 52 (40.3) | 121 (62.1) | |
| T2
(submucosa) | 10 (7.8) | 28 (14.4) | |
| T3
(subserosa) | 54 (41.9) | 31 (15.9) | |
| T4 (serosa
invasion) | 13 (10.1) | 15 (7.7) | |
| Pathologic lymph
node stage | | | 0.01 |
| N0 | 73 (56.6) | 141 (72.8) | |
| N1 (1,2) | 17 (13.2) | 19 (9.7) | |
| N2 (3–6) | 16 (12.4) | 18 (9.2) | |
| N3 (7-) | 23 (17.8) | 16 (8.2) | |
| Pathologic TNM
stage | | | <0.01 |
| Stage I | 57 (44.2) | 138 (70.8) | |
| Stage II | 36 (27.9) | 22 (11.3) | |
| Stages
III–IV | 36 (27.9) | 35 (17.9) | |
| Lymph node
dissection | | | <0.01 |
| D1+ | 34 (26.4) | 79 (40.5) | |
| D2 | 95 (73.6) | 116 (59.5) | |
| Adjuvant
chemotherapy | 85/129 (65.9) | 105/195 (53.8) | 0.03 |
| Recurrence | 33/129 (25.6) | 27/195 (13.8) | <0.01 |
| Cancer related
death | 28/129 (21.7) | 21/195 (10.8) | 0.01 |
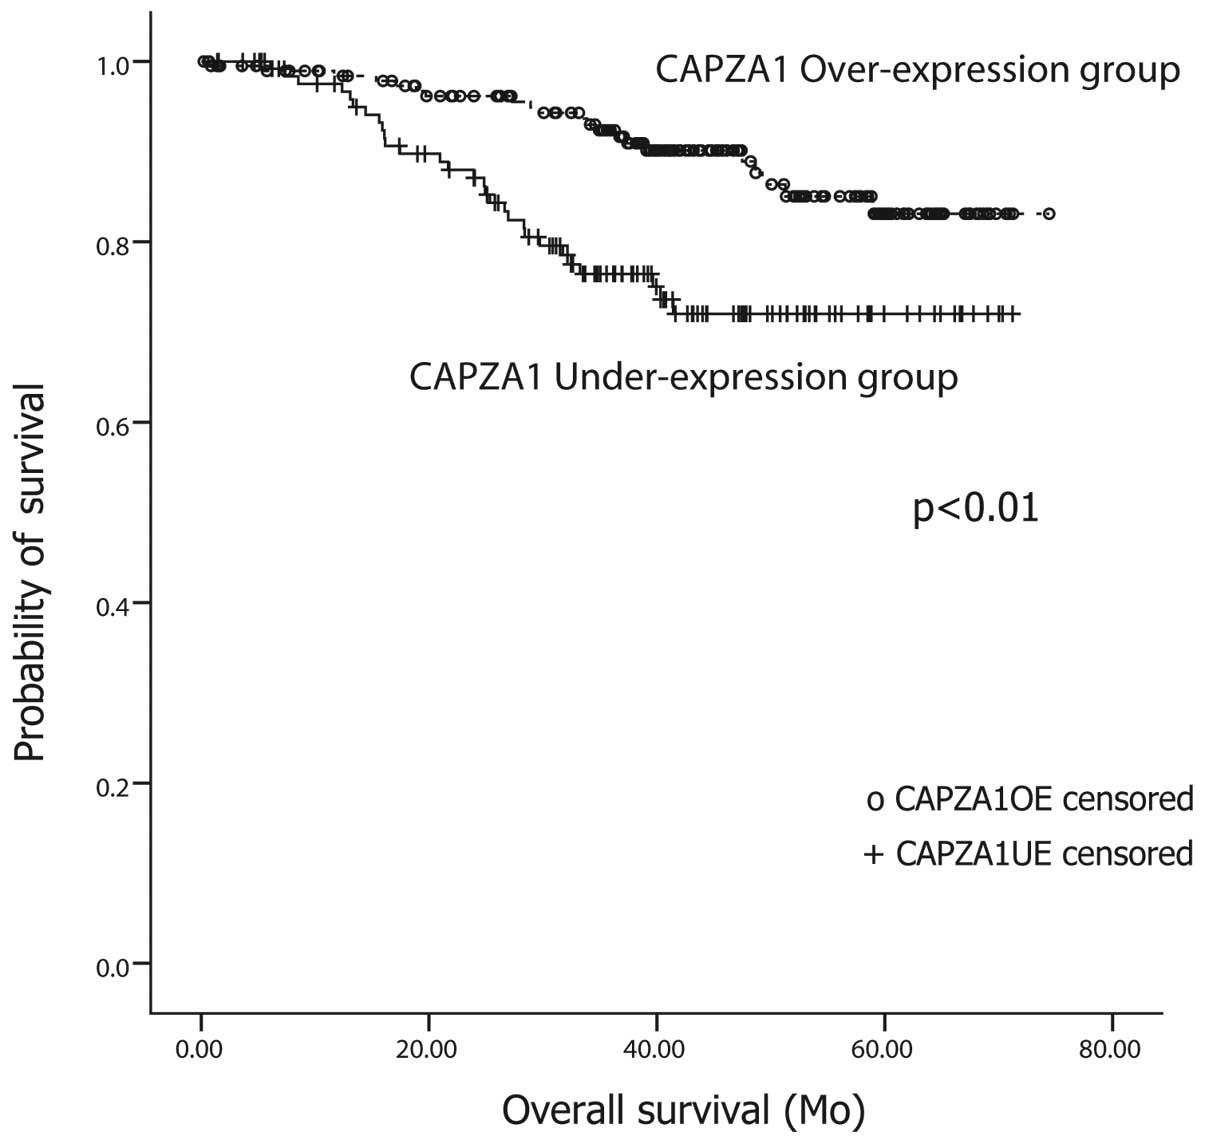
CAPZA1 overexpression is associated with
longer survival time than CAPZA1 underexpression
Among the 327 patients, 77 (23.6%) have died, of
whom, 50 died of cancer recurrence. A Kaplan-Meier survival
analysis was performed to compare the outcome of patients in the
CAPZA1-UE group to that of patients in the CAPZA1-OE group.
Patients with CAPZA-1 overexpression showed a longer survival time
(68±1.3 months) than patients with CAPZA-1 underexpression (58±2.1
months). The difference between the two groups was significant
(log-rank test, p<0.01) (Fig.
2).
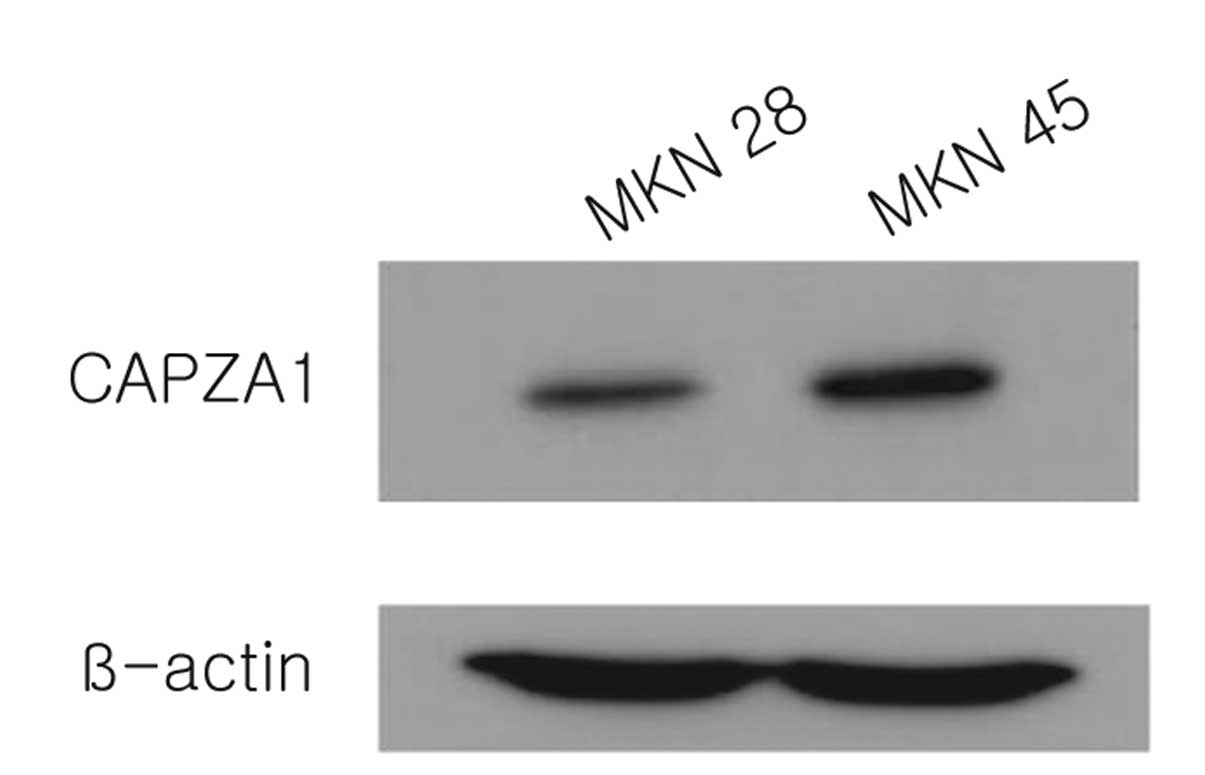
CAPZA1 expression in GC cell lines
To assess the mechanisms underlying the association
of CAPZA1 with good prognosis, the expression of CAPZA1 protein was
assessed in two different human GC cell lines. Interestingly,
CAPZA1 overexpression was observed in MKN-45, a poorly invasive GC
cell line, whereas CAPZA1 underexpression was observed in MKN-28, a
highly invasive cell line (Fig. 3)
(22).
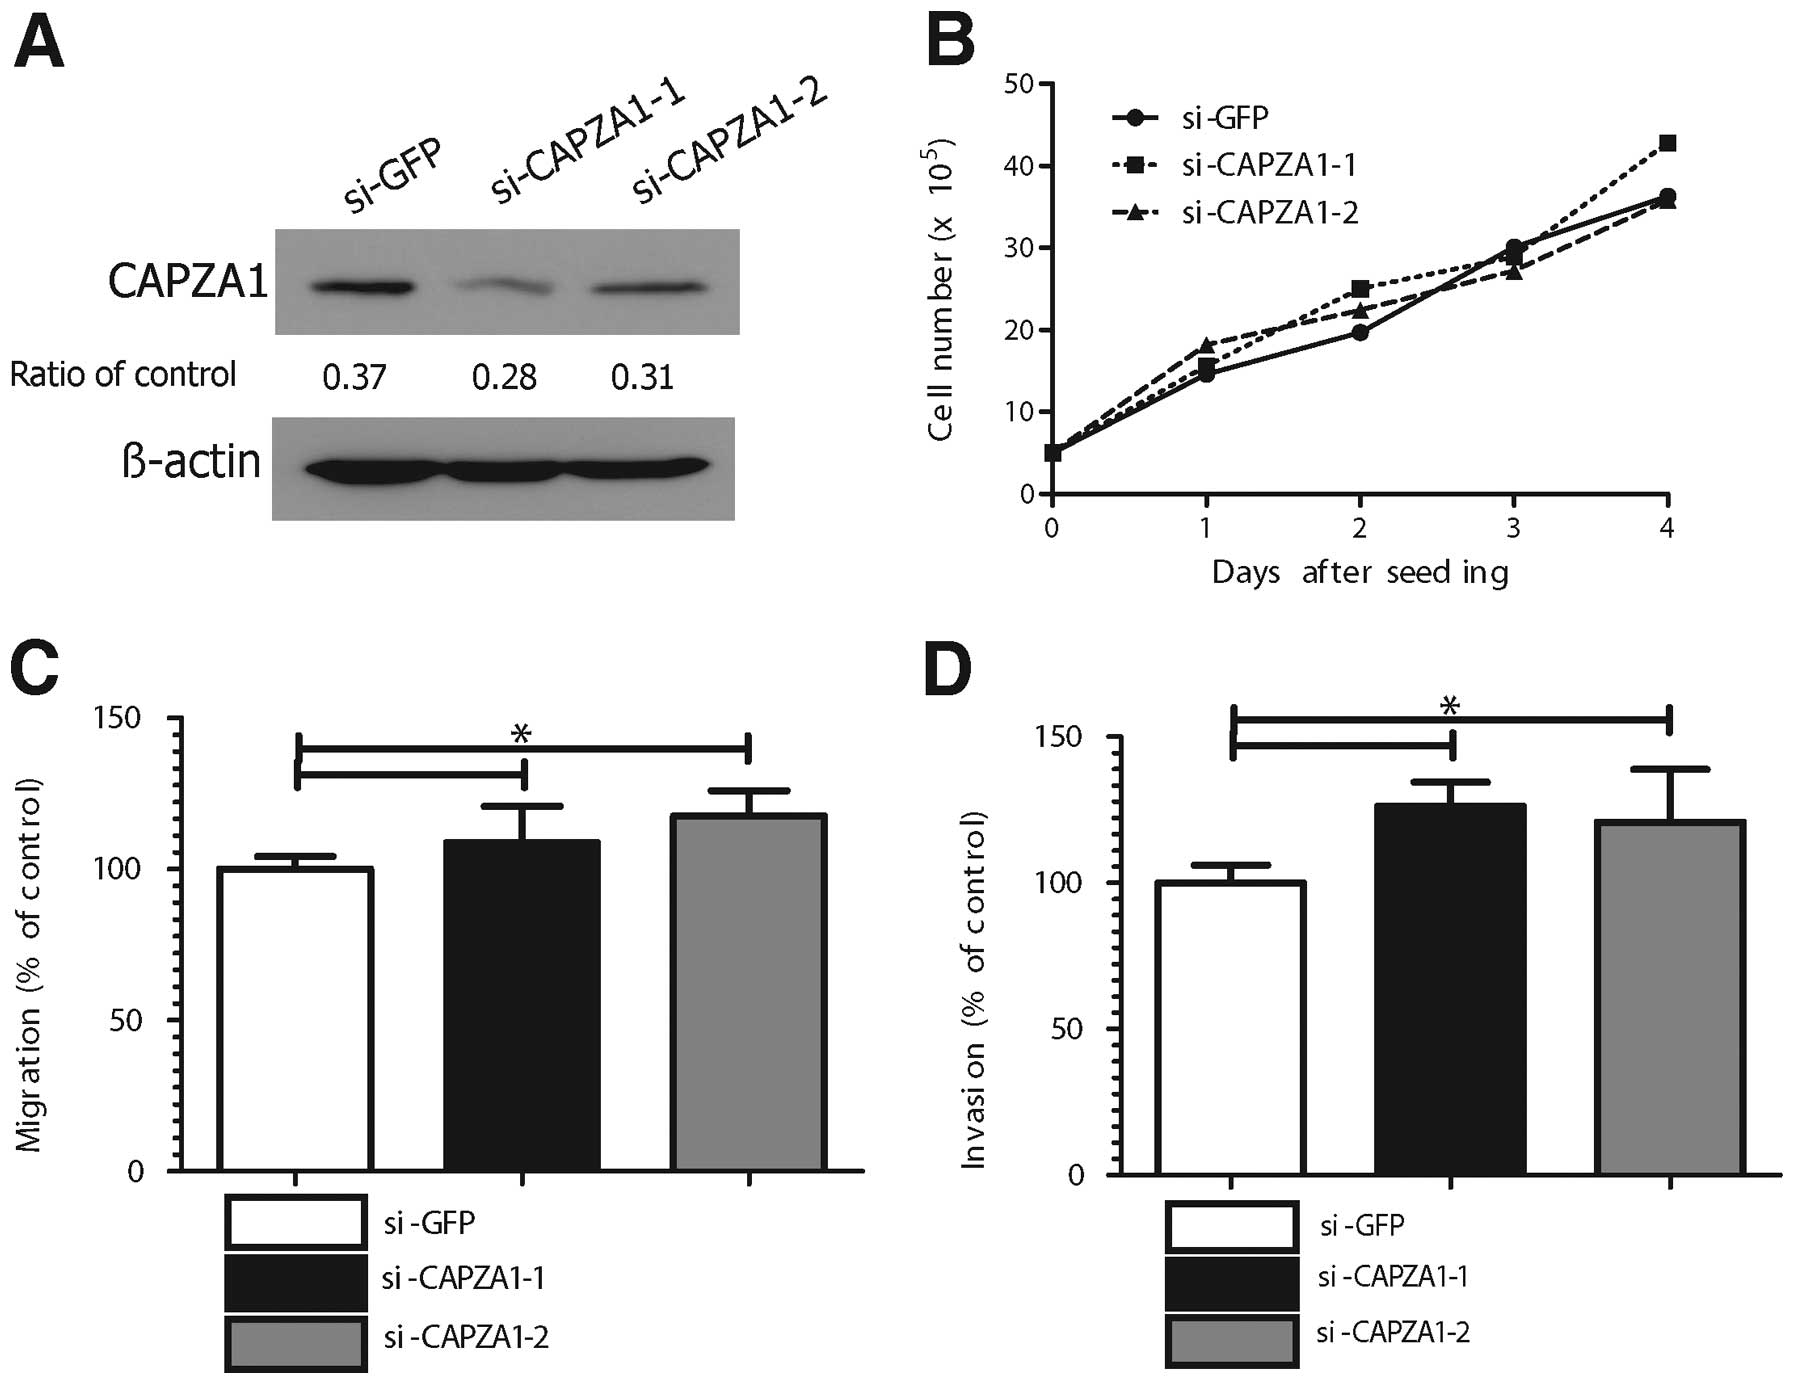
Depletion of CAPZA1 expression triggered
GC cell migration and invasion in vitro
The effect of CAPZA1 depletion on tumor cell
proliferation, migration and invasion was assessed in MKN-45 cells
using CAPZA1-siRNA. The specificity of the two different CAPZA1
siRNAs (si-CAPZA1-1, si-CAPZA1-2) was confirmed (Fig. 4A). The proliferation rate of
CAPZA1-depleted MKN-45 cells was not different from that of control
cells (Fig. 4B); however, the
migration rate of CAPZA1-depleted MKN-45 cells (si-CAPZA1-1,
si-CAPZA1-2) was markedly increased compared to that of control
cells (p<0.05, Fig. 4C). The
invasion rate of the CAPZA1-depleted MKN-45 cells was also markedly
increased compared to that of control cells (p<0.01, Fig. 4D).
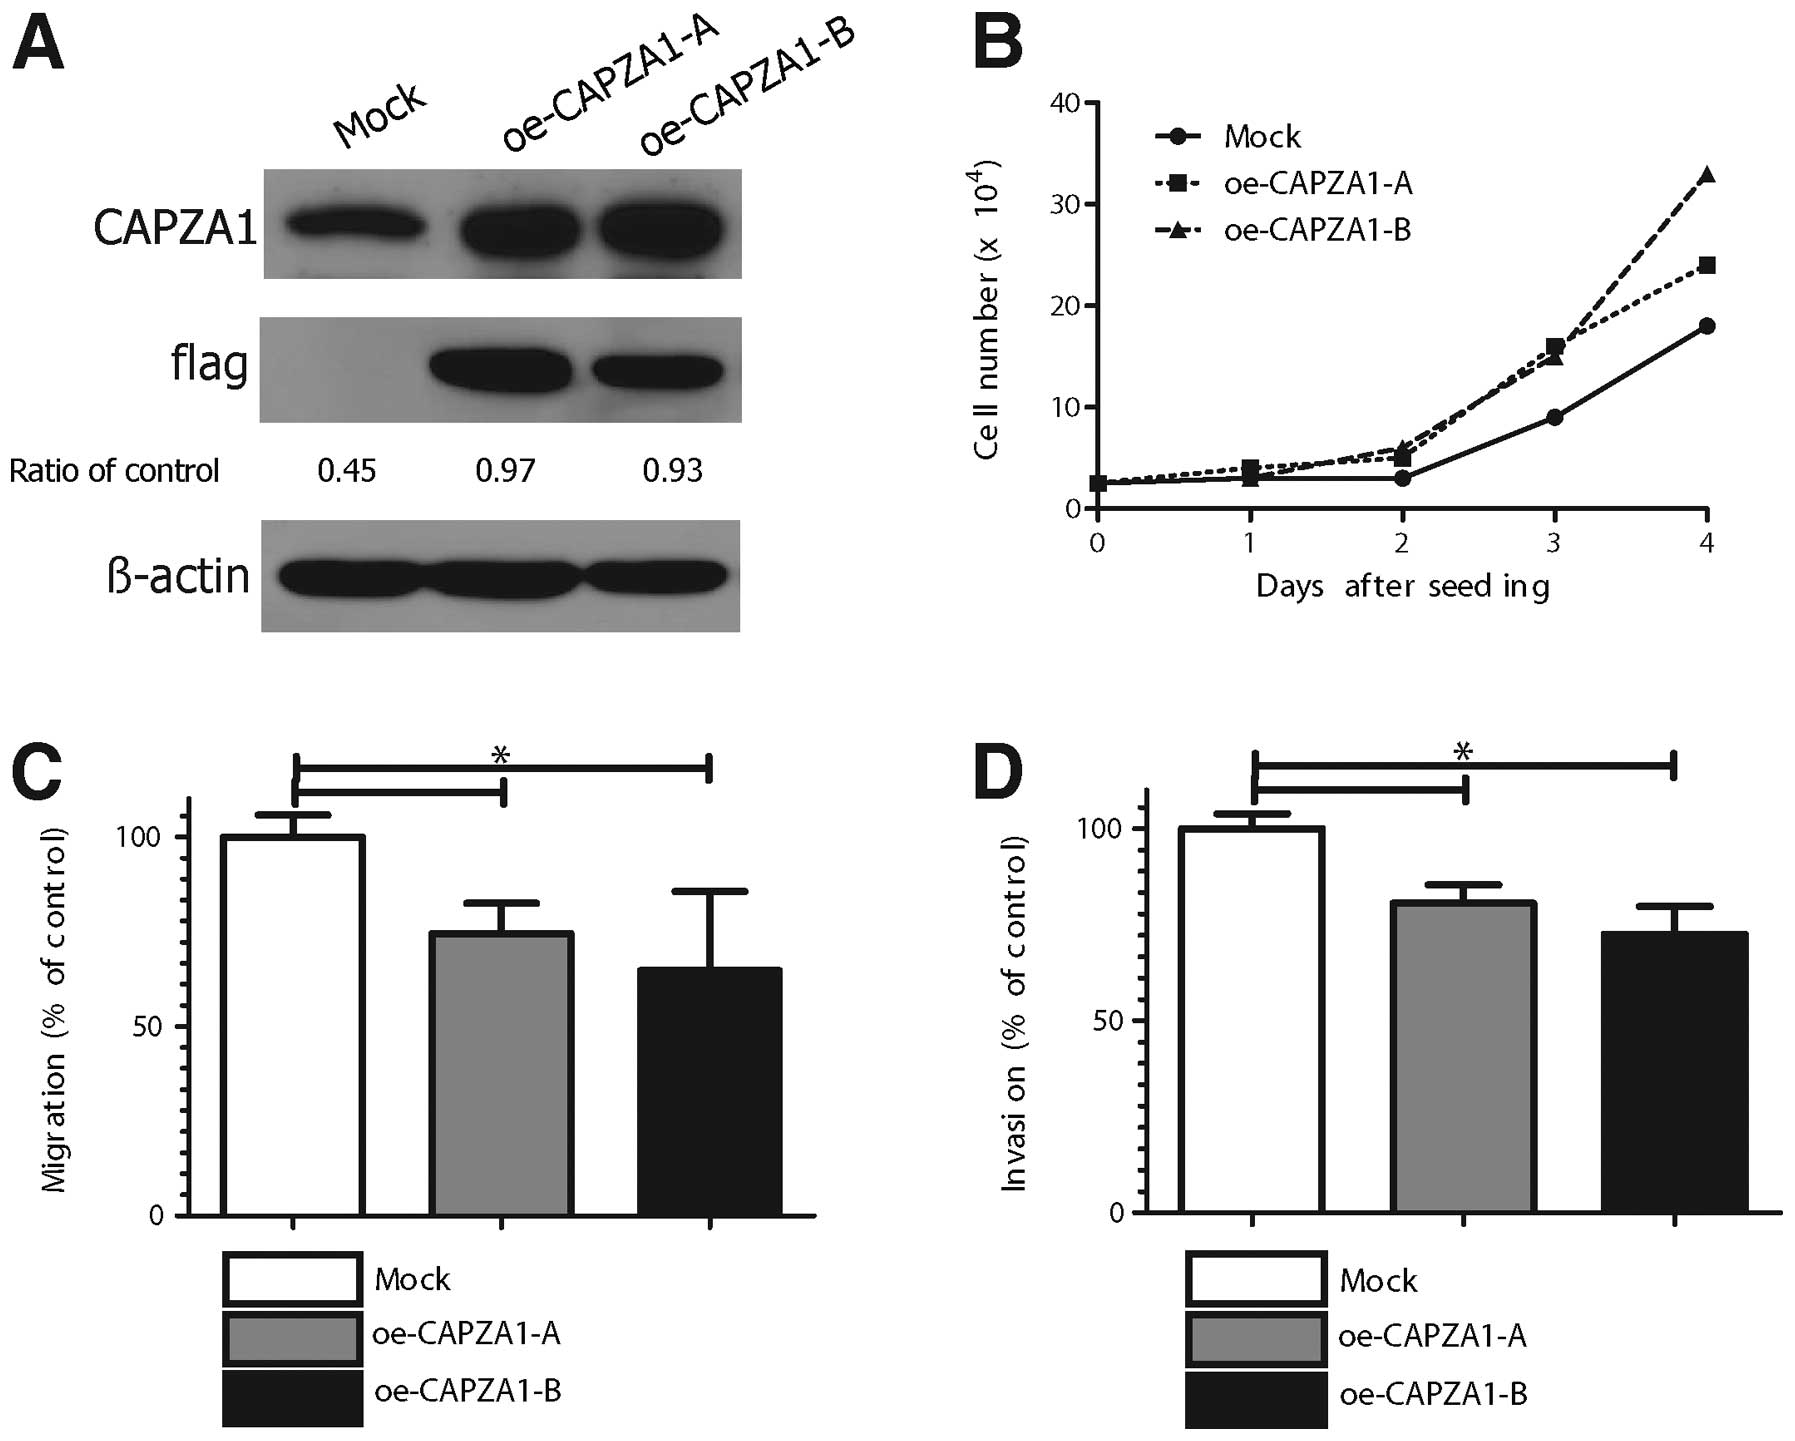
CAPZA1 overexpression suppressed GC cell
migration and invasion in vitro
The effect of CAPZA1 overexpression on tumor cell
proliferation, migration and invasion was assessed in
CAPZA1-overexpressing MKN-45 cells. MKN-45 cells stably transfected
with empty (mock) or CAPZA-1 expression vector (oe-CAPZA1-A,
oe-CAPZA1-B) were analyzed by immunoblotting with an antibody to
CAPZA1 (Fig. 5A). The
proliferation rate of the CAPZA1-overexpressing MKN-45 cells
(oe-CAPZA1-A, oe-CAPZA1-B) was not significantly different from
that of control cells (Fig. 5B).
The migration rate of CAPZA1-overexpressing MKN-45 cells was
markedly decreased compared to that of control cells (p<0.01,
Fig. 5C). The invasion rate of the
CAPZA1-overexpressing MKN-45 cells was also markedly decreased
compared to that of control cells (p<0.01, Fig. 5D).
Discussion
In our previous proteomic study, CAPZA1 was found to
be upregulated in GC tissue compared to normal tissue. As a
follow-up, this study was designed to determine whether CAPZA1 may
be used as a prognostic marker in GC. Results showed that CAPZA1
overexpression is associated with well differentiated histology,
smaller tumor size, higher T1 stage, absence of LN metastasis,
lower TNM stage, lower recurrence rate and longer survival. In
vitro modeling in GC cell lines showed that the overexpression
of CAPZA1 markedly suppresses cell migration and invasion and that
the depletion of CAPZA1 has the opposite effect. Multivariate
analysis of clinicopathological parameters showed that TNM stage is
an independent prognostic indicator of cancer-related death.
Collectively, these results suggest that CAPZA1 may have prognostic
value in gastric cancer. CAPZA1 expression in gastric cancer tissue
may help determine treatment choice. For example, in cases of
gastric cancer excision by endoscopic submucosal dissection [large
T1 mucosal cancer (greater than 2 cm), mixed type of
undifferentiated cancer or possibility of submucosal invasion],
CAPZA1 expression could be the decisive factor in determining
whether surgery should be performed: if CAPZA1 is underexpressed in
the cancer tissue, it may be best to recommend surgery over
surveillance.
TMAs offer two major advantages: they allow
large-scale analysis of human tissues and, through the use of
consecutive sections, permit the assessment of multiple proteins in
almost all morphologically identical regions of the tumor (23). Recent studies used TMAs to identify
biomarkers for breast cancer and brain tumors (24,25),
and research has shown that protein expression profiling is
clinically useful in the prognostic classification of neoplasms
(26). In GC, the expression of
EMT-related proteins and the overexpression of EGFR using TMAs were
correlated with a poor prognosis and TMA protein expression
profiling predicts LN metastasis and prognosis in early stage
gastric cancer (7,26,27).
Reports on the role of CAPZA1 in cancer are rare.
Differential expression of CAPZA1 has been reported in oral
squamous cell carcinoma. A 10-fold increase in the expression of
CAPZA1 was observed in HPV18-positive oral squamous cell carcinomas
compared to other HPV18-positive cancers, although no
overexpression was detected at the RNA level (28). Research has shown that CAPZA2 was
amplified in more than 20% of glioblastomas (29). F-actin capping protein has also
been implicated in renal cell cancer. This was investigated using
PROTEOMEX, an approach that combines conventional proteome analysis
with serological screening (30).
There is no existing report on the role of CAPZA1 in GC.
Several in vitro studies have attempted to
elucidate the function of CP. In Saccharomyces cerevisiae,
disruption of the genes encoding CP results in a disorganized actin
cyto-skeleton (31). In
Drosophila melanogaster, mutations in the CP-b gene affect
actin organization, bristle morphology and viability (10). These results indicate that CP is
important in cell morphology. CP is also necessary for actin
assembly during myofibrillogenesis in cultured muscle cells
(32). In a study of CP expression
in Dictylostellum cells, Hug et al found that
over-expressing cells moved faster and underexpressing cells moved
slower than control cells. The authors also reported that CP
mutants exhibited alterations in cytoskeleton architecture
(33). Loisel et al
performed experiments with Escherichia coli and
Listeria, and reported that the rate of cell movement varied
with CP concentration and resulted in a bell-shaped curve (34). Initially, the rate of cell movement
was fast; however, at very high concentrations, CP blocked the
elongation of the actin filaments formed at the bacterium surface,
and cell movement became slower. In the present TMA study, 39% of
the patients in the CAPZA1 overexpression group had advanced GC
(AGC) compared to 60% in the CAPZA1 underexpression group. Among
patients with CAPZA1 overexpression, 27% had LN metastasis compared
to 41% of those with underexpression. These results suggest that
CAPZA1 may stimulate the initial phase of GC development and that a
high concentration of CAPZA1 may prevent migration and invasion.
Further experiments are needed to investigate this hypothesis. In
conclusion, CAPZA1 overexpression may be a suitable marker of good
prognosis in GC and is associated in vitro with decreased
cancer cell migration and invasion.
Acknowledgements
The authors would like to thank
Young-Tae Ju, Chi-Young Jeong and Seon Min Lee in the Department of
Surgery of Gyungsang National University for supporting this study.
The study was supported by a grant from the National R&D
Program for Cancer Control, Ministry of Health, Welfare and Family
affairs, Republic of Korea (0820050).
References
|
1.
|
Lee HJ, Yang HK and Ahn YO: Gastric cancer
in Korea. Gastric Cancer. 5:177–182. 2002. View Article : Google Scholar
|
|
2.
|
Kamangar F, Dores GM and Anderson WF:
Patterns of cancer incidence, mortality, and prevalence across five
continents: defining priorities to reduce cancer disparities in
different geographic regions of the world. J Clin Oncol.
24:2137–2150. 2006. View Article : Google Scholar
|
|
3.
|
Sakuramoto S, Sasako M, Yamaguchi T, et
al: Adjuvant chemotherapy for gastric cancer with S-1, an oral
fluoropyrimidine. N Engl J Med. 357:1810–1820. 2007. View Article : Google Scholar : PubMed/NCBI
|
|
4.
|
Bang YJ, Van Cutsem E, Feyereislova A, et
al: Trastuzumab in combination with chemotherapy versus
chemotherapy alone for treatment of HER2-positive advanced gastric
or gastrooesophageal junction cancer (ToGA): a phase 3, open-label,
randomised controlled trial. Lancet. 376:687–697. 2010. View Article : Google Scholar
|
|
5.
|
Chen CD, Wang CS, Huang YH, et al:
Overexpression of CLIC1 in human gastric carcinoma and its
clinicopathological significance. Proteomics. 7:155–167. 2007.
View Article : Google Scholar : PubMed/NCBI
|
|
6.
|
Cho HJ, Baek KE, Park SM, et al: RhoGDI2
expression is associated with tumor growth and malignant
progression of gastric cancer. Clin Cancer Res. 15:2612–2619. 2009.
View Article : Google Scholar : PubMed/NCBI
|
|
7.
|
Kim MA, Lee HS, Lee HE, Jeon YK, Yang HK
and Kim WH: EGFR in gastric carcinomas: prognostic significance of
protein overexpression and high gene copy number. Histopathology.
52:738–746. 2008. View Article : Google Scholar : PubMed/NCBI
|
|
8.
|
Lim BH, Cho BI, Kim YN, Kim JW, Park ST
and Lee CW: Overexpression of nicotinamide N-methyltransferase in
gastric cancer tissues and its potential post-translational
modification. Exp Mol Med. 38:455–465. 2006. View Article : Google Scholar : PubMed/NCBI
|
|
9.
|
Waddle JA, Cooper JA and Waterston RH: The
alpha and beta subunits of nematode actin capping protein function
in yeast. Mol Biol Cell. 4:907–917. 1993. View Article : Google Scholar : PubMed/NCBI
|
|
10.
|
Hopmann R, Cooper JA and Miller KG: Actin
organization, bristle morphology, and viability are affected by
actin capping protein mutations in Drosophila. J Cell Biol.
133:1293–1305. 1996. View Article : Google Scholar : PubMed/NCBI
|
|
11.
|
Amatruda JF, Cannon JF, Tatchell K, Hug C
and Cooper JA: Disruption of the actin cytoskeleton in yeast
capping protein mutants. Nature. 344:352–354. 1990. View Article : Google Scholar : PubMed/NCBI
|
|
12.
|
Casella JF, Casella SJ, Hollands JA,
Caldwell JE and Cooper JA: Isolation and characterization of cDNA
encoding the alpha subunit of Cap Z(36/32), an actin-capping
protein from the Z line of skeletal muscle. Proc Natl Acad Sci USA.
86:5800–5804. 1989. View Article : Google Scholar : PubMed/NCBI
|
|
13.
|
Barron-Casella EA, Torres MA, Scherer SW,
Heng HH, Tsui LC and Casella JF: Sequence analysis and chromosomal
localization of human Cap Z. Conserved residues within the
actin-binding domain may link Cap Z to gelsolin/severin and
profilin protein families. J Biol Chem. 270:21472–21479. 1995.
View Article : Google Scholar
|
|
14.
|
Cooper JA, Caldwell JE, Gattermeir DJ,
Torres MA, Amatruda JF and Casella JF: Variant cDNAs encoding
proteins similar to the alpha subunit of chicken CapZ. Cell Motil
Cytoskeleton. 18:204–214. 1991. View Article : Google Scholar : PubMed/NCBI
|
|
15.
|
Tanaka H, Yoshimura Y, Nishina Y, Nozaki
M, Nojima H and Nishimune Y: Isolation and characterization of cDNA
clones specifically expressed in testicular germ cells. FEBS Lett.
355:4–10. 1994. View Article : Google Scholar : PubMed/NCBI
|
|
16.
|
Schafer DA, Korshunova YO, Schroer TA and
Cooper JA: Differential localization and sequence analysis of
capping protein beta-subunit isoforms of vertebrates. J Cell Biol.
127:453–465. 1994. View Article : Google Scholar : PubMed/NCBI
|
|
17.
|
Hart MC, Korshunova YO and Cooper JA:
Mapping of the mouse actin capping protein alpha subunit genes and
pseudo-genes. Genomics. 39:264–270. 1997. View Article : Google Scholar : PubMed/NCBI
|
|
18.
|
Von Bulow M, Rackwitz HR, Zimbelmann R and
Franke WW: CP beta3, a novel isoform of an actin-binding protein,
is a component of the cytoskeletal calyx of the mammalian sperm
head. Exp Cell Res. 233:216–224. 1997.PubMed/NCBI
|
|
19.
|
Nachmias VT, Golla R, Casella JF and
Barron-Casella E: Cap Z, a calcium insensitive capping protein in
resting and activated platelets. FEBS Lett. 378:258–262. 1996.
View Article : Google Scholar : PubMed/NCBI
|
|
20.
|
Barkalow K, Witke W, Kwiatkowski DJ and
Hartwig JH: Coordinated regulation of platelet actin filament
barbed ends by gelsolin and capping protein. J Cell Biol.
134:389–399. 1996. View Article : Google Scholar : PubMed/NCBI
|
|
21.
|
Kimura M, Tsuda H, Morita D, et al: A
proposal for diagnostically meaningful criteria to classify
increased epidermal growth factor receptor and c-erbB-2 gene copy
numbers in gastric carcinoma, based on correlation of fluorescence
in situ hybridization and immunohistochemical measurements.
Virchows Arch. 445:255–262. 2004. View Article : Google Scholar
|
|
22.
|
Koike N, Todoroki T, Komano H, et al:
Invasive potentials of gastric carcinoma cell lines: role of alpha
2 and alpha 6 integrins in invasion. J Cancer Res Clin Oncol.
123:310–316. 1997.PubMed/NCBI
|
|
23.
|
Lee HS and Kim WH: Tissue array methods
for high-throughput clinicopathologic research. Cancer Res Treat.
38:1–6. 2006. View Article : Google Scholar : PubMed/NCBI
|
|
24.
|
Ikota H, Kinjo S, Yokoo H and Nakazato Y:
Systematic immunohistochemical profiling of 378 brain tumors with
37 antibodies using tissue microarray technology. Acta Neuropathol.
111:475–482. 2006. View Article : Google Scholar : PubMed/NCBI
|
|
25.
|
Ou K, Yu K, Kesuma D, et al: Novel breast
cancer biomarkers identified by integrative proteomic and gene
expression mapping. J Proteome Res. 7:1518–1528. 2008. View Article : Google Scholar : PubMed/NCBI
|
|
26.
|
Lee HS, Cho SB, Lee HE, et al: Protein
expression profiling and molecular classification of gastric cancer
by the tissue array method. Clin Cancer Res. 13:4154–4163. 2007.
View Article : Google Scholar : PubMed/NCBI
|
|
27.
|
Kim MA, Lee HS, Lee HE, Kim JH, Yang HK
and Kim WH: Prognostic importance of epithelial-mesenchymal
transition-related protein expression in gastric carcinoma.
Histopathology. 54:442–451. 2009. View Article : Google Scholar : PubMed/NCBI
|
|
28.
|
Lo WY, Lai CC, Hua CH, et al: S100A8 is
identified as a biomarker of HPV18-infected oral squamous cell
carcinomas by suppression subtraction hybridization, clinical
proteomics analysis, and immunohistochemistry staining. J Proteome
Res. 6:2143–2151. 2007. View Article : Google Scholar
|
|
29.
|
Mueller HW, Michel A, Heckel D, et al:
Identification of an amplified gene cluster in glioma including two
novel amplified genes isolated by exon trapping. Hum Genet.
101:190–197. 1997. View Article : Google Scholar : PubMed/NCBI
|
|
30.
|
Kellner R, Lichtenfels R, Atkins D, et al:
Targeting of tumor associated antigens in renal cell carcinoma
using proteome-based analysis and their clinical significance.
Proteomics. 2:1743–1751. 2002. View Article : Google Scholar : PubMed/NCBI
|
|
31.
|
Amatruda JF and Cooper JA: Purification,
characterization, and immunofluorescence localization of
Saccharomyces cerevisiae capping protein. J Cell Biol.
117:1067–1076. 1992. View Article : Google Scholar : PubMed/NCBI
|
|
32.
|
Schafer DA, Hug C and Cooper JA:
Inhibition of CapZ during myofibrillogenesis alters assembly of
actin filaments. J Cell Biol. 128:61–70. 1995. View Article : Google Scholar : PubMed/NCBI
|
|
33.
|
Hug C, Jay PY, Reddy I, et al: Capping
protein levels influence actin assembly and cell motility in
dictyostelium. Cell. 81:591–600. 1995. View Article : Google Scholar : PubMed/NCBI
|
|
34.
|
Loisel TP, Boujemaa R, Pantaloni D and
Carlier MF: Reconstitution of actin-based motility of Listeria and
Shigella using pure proteins. Nature. 401:613–616. 1999. View Article : Google Scholar : PubMed/NCBI
|