Introduction
It is well established that unlike normal tissues
cancer cells switch the pathway of energy production from oxidative
phosphorylation (OXPHOS) to aerobic glycolysis under normoxic
conditions (Warburg effect) even though the efficiency of ATP
production through OXPHOS is much higher than that of glycolysis
(1,2). The high demand of rapid energy
release in fast proliferating cancer cells is covered more
efficiently by glycolysis, since this pathway can be regulated
effectively without requiring the replenishment of suitable
metabolites as is the case with the aerobic respiration which is a
slower process. In addition, glycolysis confers the ability to
cancer cells to evade apoptosis, resist immune responses and use
the glycolytic intermediate products as substrates for anabolic
reactions, explaining the preference of these cells to produce
energy through glycolysis (3–5).
Cellular energy needs are covered by the
coordination of the gene expression of a network of metabolic genes
carried out by oncogene and tumour suppressor pathways coupling
environmental conditions to cellular physiology. For example, in
conditions of low oxygen concentration, which is a common event in
the tumour microenvironment, HIF-1, the major orchestrator of
transcription under these conditions, induces gene expression of
glycolytic enzymes and reduces mitochondrial activity switching the
energy production pathway from oxidative phosphorylation to
glycolysis thus facilitating the cellular adaptation to hypoxia
(6–8).
The p53 tumour suppressor on the other hand,
displays diverse effects on energy metabolism by fine tuning the
gene expression of proteins involved in both OXPHOS and glycolysis
(9,10). Recently synthesis of cytochrome
c oxidase 2 (SCO2) and TP53-induced glycolysis and
apoptosis regulator (TIGAR), two genes involved in oxidative
phosphorylation and glycolysis respectively, have been documented
as p53 transcriptional targets (11,12).
SCO2 is involved in the assembly of the cytochrome c oxidase
complex (complex IV subunit 2) in the mitochondrial respiratory
electron transport chain and the delivery of copper to this complex
(13). Mutations in SCO2
gene severely impair cytochrome c oxidase assembly
accompanied by cellular copper deficiency which result in various
mitochondrial diseases such as encephalomyopathy and hypertrophic
cardiomyopathy (14). By inducing
SCO2 gene expression, p53 enhances mitochondrial respiration
(9,10) while in its absence glycolysis
prevails (11). TIGAR
inhibits glycolysis as it displays homology to the phosphatase
domain of the 6-phosphofructo-2-kinase/fructose-2,6-bisphosphatase
(PFK2/FBPase2) enzyme which restrains glycolysis by
dephosphorylating fructose-2,6-bisphosphate (F2,6BP). The kinase
domain of the PFK2/FBPase2 induces the phosphorylation of fructose
6-phosphate (F6P) thereby increasing the intracellular levels of
the F2,6BP, whereas the phosphatase domain of this bi-functional
enzyme dephosphorylates F2,6BP to F6P. F2,6BP is an allosteric
activator of PFK-1 therefore its levels play a crucial role in the
determination of the glycolytic rate, the blockade of the Warburg
effect and the redirection of glycolysis to the pentose phosphate
pathway (PPP) (3,15,16).
Induction of TIGAR gene expression is an alternative way by
which p53 determines the cellular fate by depleting the
intracellular NADPH hence mediating antioxidant defence (3,12).
We have previously demonstrated the role of the
p300/CBP associated factor (PCAF) as common coregulator of the
function of p53 and HIF-1α in hypoxia indicating that the
acetylation function of PCAF is crucial in determining cell cycle
arrest and survival or apoptosis in hypoxic conditions in a manner
depending on its intrinsic HAT activity (17). PCAF mediated acetylation and Sirt-1
dependent deacetylation of HIF-1α have been more recently shown to
modulate cellular responses in hypoxia (18). Taking into account the fact that
both PCAF and p300 interact with Sirt-1 (19,20)
and Sirt-1 is a well-known cellular sensor of reduced glucose and
NAD+ availability (21), we hypothesised that PCAF as common
regulator of p53 and HIF-1α, might coordinate the pathways for
cellular energy production regulating the physiologically distinct
pathways of OXPHOS and glycolysis.
It is known that p53 and HIF-1α play important roles
in the determination of sensitivity/resistance of cancer cells to
chemotherapy or radiotherapy (22). In this respect, p53 degradation, or
HIF-1α stabilisation and fine tuning of their transcription target
selectivity contribute to the response to radiation damage and
affect the therapeutic efficacy of agents that regulate these
properties. It is therefore of crucial importance to study the
factors that can distinguish between the beneficial and detrimental
properties of both these transcription factors in cancer therapy in
order to improve the efficacy of various therapeutic approaches. We
present herein evidence that the HAT activity of PCAF beyond its
role in the control of cell proliferation and survival/apoptosis in
hypoxic conditions (17) is also
implicated in the modulation of metabolic pathways, such as OXPHOS
or glycolysis regulating energy and oxidative stress homeostasis in
cancer cells. This function of PCAF is in accord with the recently
presented view suggesting the existence of common regulatory
systems shared between cell cycle progression and metabolic
pathways (23).
Materials and methods
Cell lines, cell culture and
constructs
U2OS and MCF7 (p53 wt) and MDA-MB-231 (p53 mutant)
and SaOS2 (p53−/−) cells were cultured in DMEM
(Sigma-Aldrich, UK) supplemented with 10% v/v heat inactivated
fetal calf serum (Gibco, UK) and 1% of penicillin and streptomycin
10,000 U/ml (Lonza, USA) at 37°C in a humidified atmosphere
containing 5% CO2. Wherever mentioned, cells were treated with 250
μM desferrioxamine (DSFX) (Sigma-Aldrich) for 16 h.
The PCDNA3-Flag-TIGAR expression construct was a
generous gift from Professor K. Vousden (Beatson Institute,
Glasgow, UK) the PCDNA3-SCO2 expression construct was provided by
Professor P. Hwang (NIH, Bethesda, MD, USA) and the
pCiFlag-PCAF(wt) and pCiFlag-PCAF(ΔHAT) were obtained from Dr I.
Talianidis (Athens, Greece) (24).
Human SCO2 and TIGAR luciferase reporters containing the consensus
HREs and p53 binding sites were constructed by amplifying the −287
to −1712 fragment of the SCO2 and the +400 to −508 region of the
TIGAR (counted from the translation initiation codon) (primer
sequences are shown in Table I)
and inserting them in the pGL3 promoter luciferase vector (Promega,
USA). The calcium phosphate method (25) and the polyfect transfection system
(Qiagen, UK) were used to transfect cells. Luciferase reporter
assays were carried out as described previously (25).
 | Table ILuciferase primers. |
Table I
Luciferase primers.
| Gene name | Forward primer | Reverse primer |
|---|
| TIGAR |
5′-CTCGAGGGGTGGGTGGGTCTAAGTCT-3′ |
5′-GAGCTCGGACGAGCAATTCTGCAAAC-3′ |
| SCO2 |
5′-ACCGTGGAGCTGGTCC-3′ |
5′-CAGCAAGGTGAACCTCT-3′ |
Immunoblotting and antibodies
Cells were harvested in 240 mM TNN buffer (50 mM
Tris-HCl pH 7.4, 240 mM NaCl, 5 mM EDTA and 0.5% NP-40) and equal
amounts of protein were loaded and resolved by SDS-PAGE and western
blotting. After incubating with primary and secondary antibodies,
the blots were developed with ECL substrate according to the
manufacturer’s instructions (Pierce, Thermo Scientific, USA). The
following antibodies were used for western blotting: β-actin
(Abcam, UK), SCO2 (ProSciInc., USA), TIGAR-IN1 (ProSci Inc.),
HIF-1α (H1α67; Calbiochem, EMD Chemicals, USA), p53 (DO1; Santa
Cruz Biotechnology, USA), PCAF (E-8; Santa Cruz Biotechnology),
anti-Flag (M2; Sigma-Aldrich) and PFKFB3 (Abgent, USA).
Quantitative RT-PCR
Quantitative RT-PCR analysis was carried out as
described previously (17).
Briefly, total RNA was extracted from cells using RNeasy plus mini
kit (Qiagen, USA) following the manufacturer’s instructions. The
RNA was then reverse transcribed to cDNA and used for qPCR analysis
using SYBR Green fluorescent probe. Analysis was performed using
the Opticon Monitor (Bio-Rad Laboratories, USA) or Realplex
(Eppendorf, UK) software. The primer sequences used in qPCR
reaction are provided in Table
II.
| Table IIqPCR primers. |
Table II
qPCR primers.
| Gene | Orientation | Primer
sequence | Product size
(bp) |
|---|
| TIGAR | Forward |
5′-ATGGAATTTTGGAGAGAA-3′ | 84 |
| Reverse |
5′-CCATGGCCCTCAGCTCAC-3′ | |
| SCO2 | Forward |
5′-TCACTCACTGCCCTGACATC-3′ | 149 |
| Reverse |
5′-CGGTCAGACCCAACAGTCTT-3′ | |
| Rpl19 | Forward |
5′-ATGTATCACAGCCTGTACCTG-3′ | 122 |
| Reverse |
5′-TTCTTGGTCTCTTCCTCCTTG-3′ | |
Chromatin immunoprecipitation
Chromatin immunoprecipitation analysis was performed
in U2OS cells as described previously (17). Briefly, chromatin was cross-linked
using 1% formaldehyde and the protein DNA complex was sonicated to
produce ∼500 bp DNA fragments which were then immunoprecipitated
with HIF-1α-ChIP grade (AB2185; Abcam) or an irrelevant antibody
(HRP conjugated anti-rabbit). The reverse cross-linked DNA
fragments were then amplified in PCR reactions with specific
primers (Table III) flanking
different HREs within the TIGAR and SCO2 promoter and
analyzed using Opticon Monitor software (Bio-Rad Laboratories) or
2% agarose gel electrophoresis.
| Table IIIChIP primers. |
Table III
ChIP primers.
| Forward | Reverse |
|---|
| TIGAR | | |
| HRE 1 |
5′-GTGTTGGAATCTCGGCTCAC-3′ |
5′-CAAGGCAGGTCAGGAGAATC-3′ |
| HRE 2 |
5′-CCGTGTTAGCCAAAATGGTC-3′ |
5′-CACATTTGGCCTTCTGAACA-3′ |
| HRE 3 and
E2F1 |
5′-CTATAGAAGGGTGCGTCCTT-3′ |
5′-TGACTCCTTCCCATTACCTA-3′ |
| HRE 4 |
5′-ACACGGTGAAACCCTGTCTC-3′ |
5′-AGTGCAGTGGTGTGATCTCG-3′ |
| HRE 5 |
5′-CACAGTCTGTTGGTCGCTG-3′ |
5′-GATTCCTTCCCTCGATAGCC-3′ |
| HRE 6 |
5′-AGGAATCCTACCGCGGACT-3′ |
5′-CTACCTCCCCCACACCACT-3′ |
| SCO2 | | |
| HRE 1 |
5′-TGGTGCTGCACGAGCTCGG-3′ |
5′-CTCACCACGGCGCAGCCTC-3′ |
| HRE 2 |
5′-CTCTGCAGGGACCCCCTGGC-3′ |
5′-GCGGTCGGAGAGTACGAGCG-3′ |
| HRE 3 |
5′-CAGGAGGCGCTCGTACTCT-3′ |
5′-GACAGGCTCTCAGCGCGTGC-3′ |
| HRE 4 |
5′-CATGCGCAGCTCCGGGGAC-3′ |
5′-ACGAGAGGAAGCGCCGACCT-3′ |
| HRE 5 and
p53 |
5′-GCCAGAGAGTTACCCACCTCCTTTTAA-3′ |
5′-CTGTCACCGCACCCTGCCC-3′ |
| HRE6 |
5′-GTGTGGTTGCCCAGGTGTGGA-3′ |
5′-GGCTGCCCCTGCGACTTGAG-3′ |
Measurement of oxygen consumption
A Clark-type oxygen electrode system (Rank Brothers,
Cambridge, UK) was used to measure the ability of the cells to
uptake oxygen. The Clarke type electrode uses polarising voltage to
create a current or flow of electrons between one silver and one
platinum electrode. The output of the electrode is connected to a
voltage adaptor and the output of this adaptor is connected to a
Pico Log recorder (Pico Technology Ltd., UK). As the oxygen
concentration in the incubation chamber changes, the current
flowing between the two metal electrodes changes in proportion of
the oxygen concentration in the incubation chamber. These changes
in the current are converted to changes in the voltage which was
recorded in the Pico Log recorder. Cells (2×10⁵) were
collected in 2-ml medium loaded into the incubation chamber
maintained at 37°C and stirred continuously using a magnetic
stirrer. The value of the voltage indicating the amount of oxygen
available in the incubation chamber at each time-point in
DSFX-treated cells was divided with the respective value obtained
for the amount of oxygen available in the chamber in untreated
cells. The inverted numbers attained from this calculation showing
the oxygen consumption in treated and non-treated cells were
plotted as a slope. Oxygen consumption was measured from 1 to 600
sec.
Measurement of lactic acid
production
Cells were grown in 6-well plates, transiently
transfected and treated as described in the text and figure
legends. Lactate levels were quantified using Lactate Reagent kit
(Trinity Biotech, Ireland) following the manufacturer’s
instructions. Lactate production rates were expressed as nmol/min
per milligram protein.
Results
SCO2 and TIGAR gene expression in hypoxia
mimicking conditions
To investigate whether gene expression of the p53
transcription targets SCO2 and TIGAR was
differentially affected in hypoxia mimicking conditions, we
followed SCO2 and TIGAR mRNA and protein levels in
p53wt (U2OS and MCF7), p53 mutated (MDA-MB-231), or p53-deficient
(SaOS2) cells treated with the hypoxia mimicking agent DSFX.
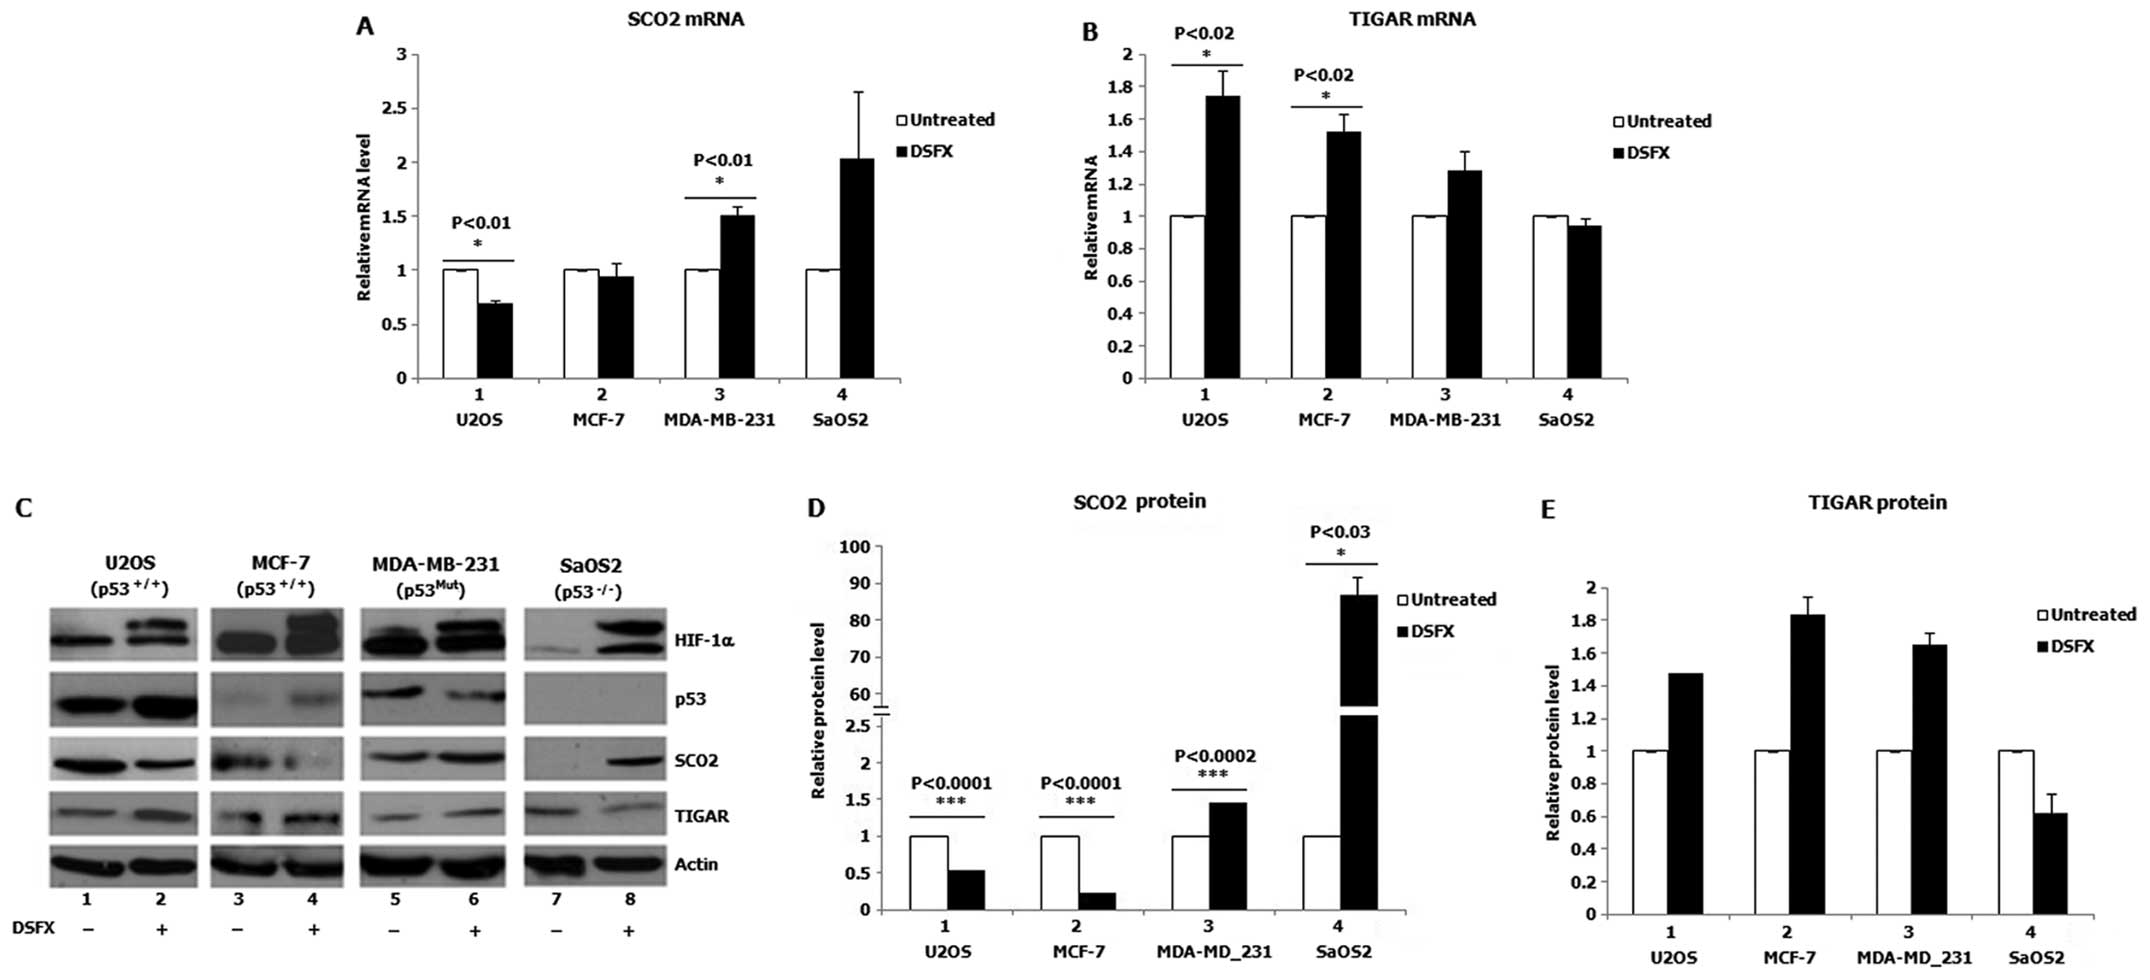
Significantly decreased SCO2 mRNA levels were observed in
DSFX-treated U2OS cells (p53wt) compared to those in the
non-treated cells (Fig. 1A,
compare black bar 1 to white bar 1). In contrast, increased
SCO2 mRNA levels were monitored in DSFX-treated MDA-MB-231
cells (mutated p53) and SaOS2 cells (p53 null) compared to those in
non-treated cells (Fig. 1A,
compare black bars 3 and 4 to white bars 3 and 4). Similarly lower
SCO2 protein levels were detected in DSFX-treated versus
non-treated U2OS and MCF-7 cells (Fig.
1C, compare lanes 2 to 1 and 4 to 3; Fig. 1D, compare black bars 1 and 2 to
white bars 1 and 2) and higher in DSFX-treated as opposed to
non-treated MDA-MB-231 and SaOS2 cells (Fig. 1C, compare lanes 6 to 5 and 8 to 7;
Fig. 1D, compare black bars 3 and
4 to white bars 3 and 4).
In contrast to SCO2, increased TIGAR mRNA and
protein levels were recorded in DSFX-treated U2OS and MCF-7
compared to non-treated cells (Fig.
1B, compare black bars 1 and 2 to white bars 1 and 2; Fig. 1C, compare lanes 2 to 1 and 4 to 3;
Fig. 1E, compare black bars 1 and
2 to white bars 1 and 2). Although TIGAR mRNA levels did not
change, downregulation of TIGAR protein was observed in
DSFX-treated SaOS2 cells compared to non-treated cells (Fig. 1C, compare lanes 8 to 7; Fig. 1E, compare black bar 4 to white bar
4). Higher TIGAR mRNA and protein levels were documented in
DSFX-treated MDA-MB-231 cells compared to those in non-treated
cells (Fig. 1B, compare black bar
3 to white bar 3; Fig. 1C, compare
lanes 6 to 5; Fig. 1E, compare
black bar 3 to white bar 3). Taken together results presented in
Fig. 1 are suggestive of a
differential regulation of the SCO2 and TIGAR cellular levels in
hypoxia mimicking conditions in a manner dependent on the presence
of p53.
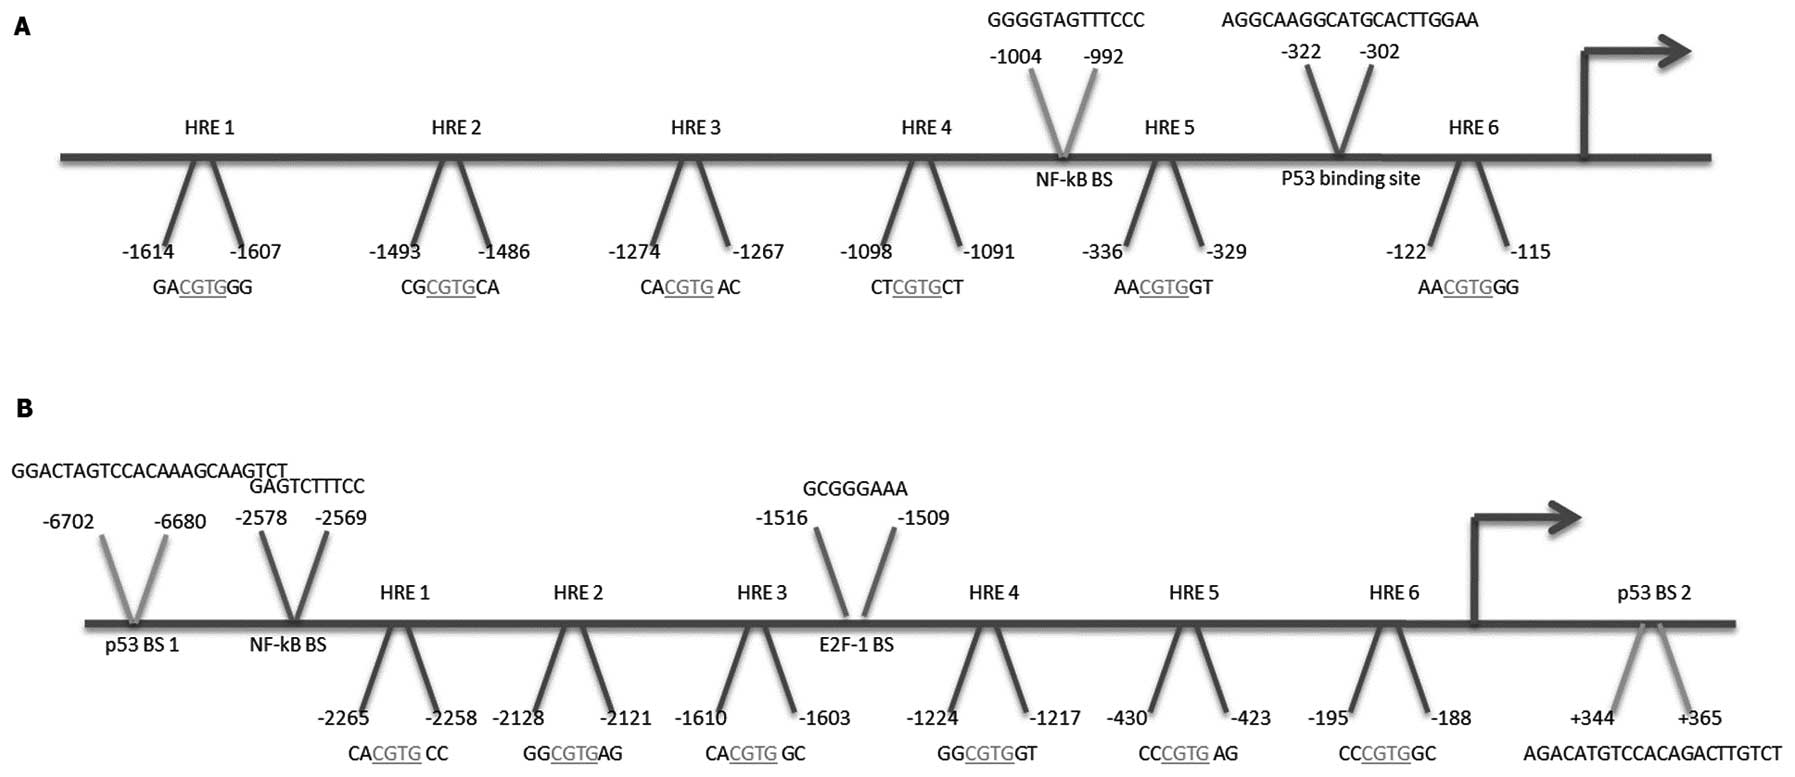
Putative HREs are present in the
regulatory region of the SCO2 and TIGAR promoters
To gain a better understanding of the
transcriptional events regulating SCO2 and TIGAR gene
expression in DSFX-treated cells and in particular to test whether
HIF-1 was involved in these events, the upstream regulatory region
of the SCO2 and TIGAR promoters were submitted to
bioinformatics analysis to investigate whether hypoxia responsive
elements (HREs) were present in these regions. Putative HRE sites
were identified within the regulatory region of both SCO2
and TIGAR promoters (Fig.
2).
The presence of binding sites for several
transcription factors in addition to the known p53 binding sites
(11,16) within the upstream regulatory region
of SCO2 and TIGAR promoters implies that gene
expression of these genes is under a complex control of multiple
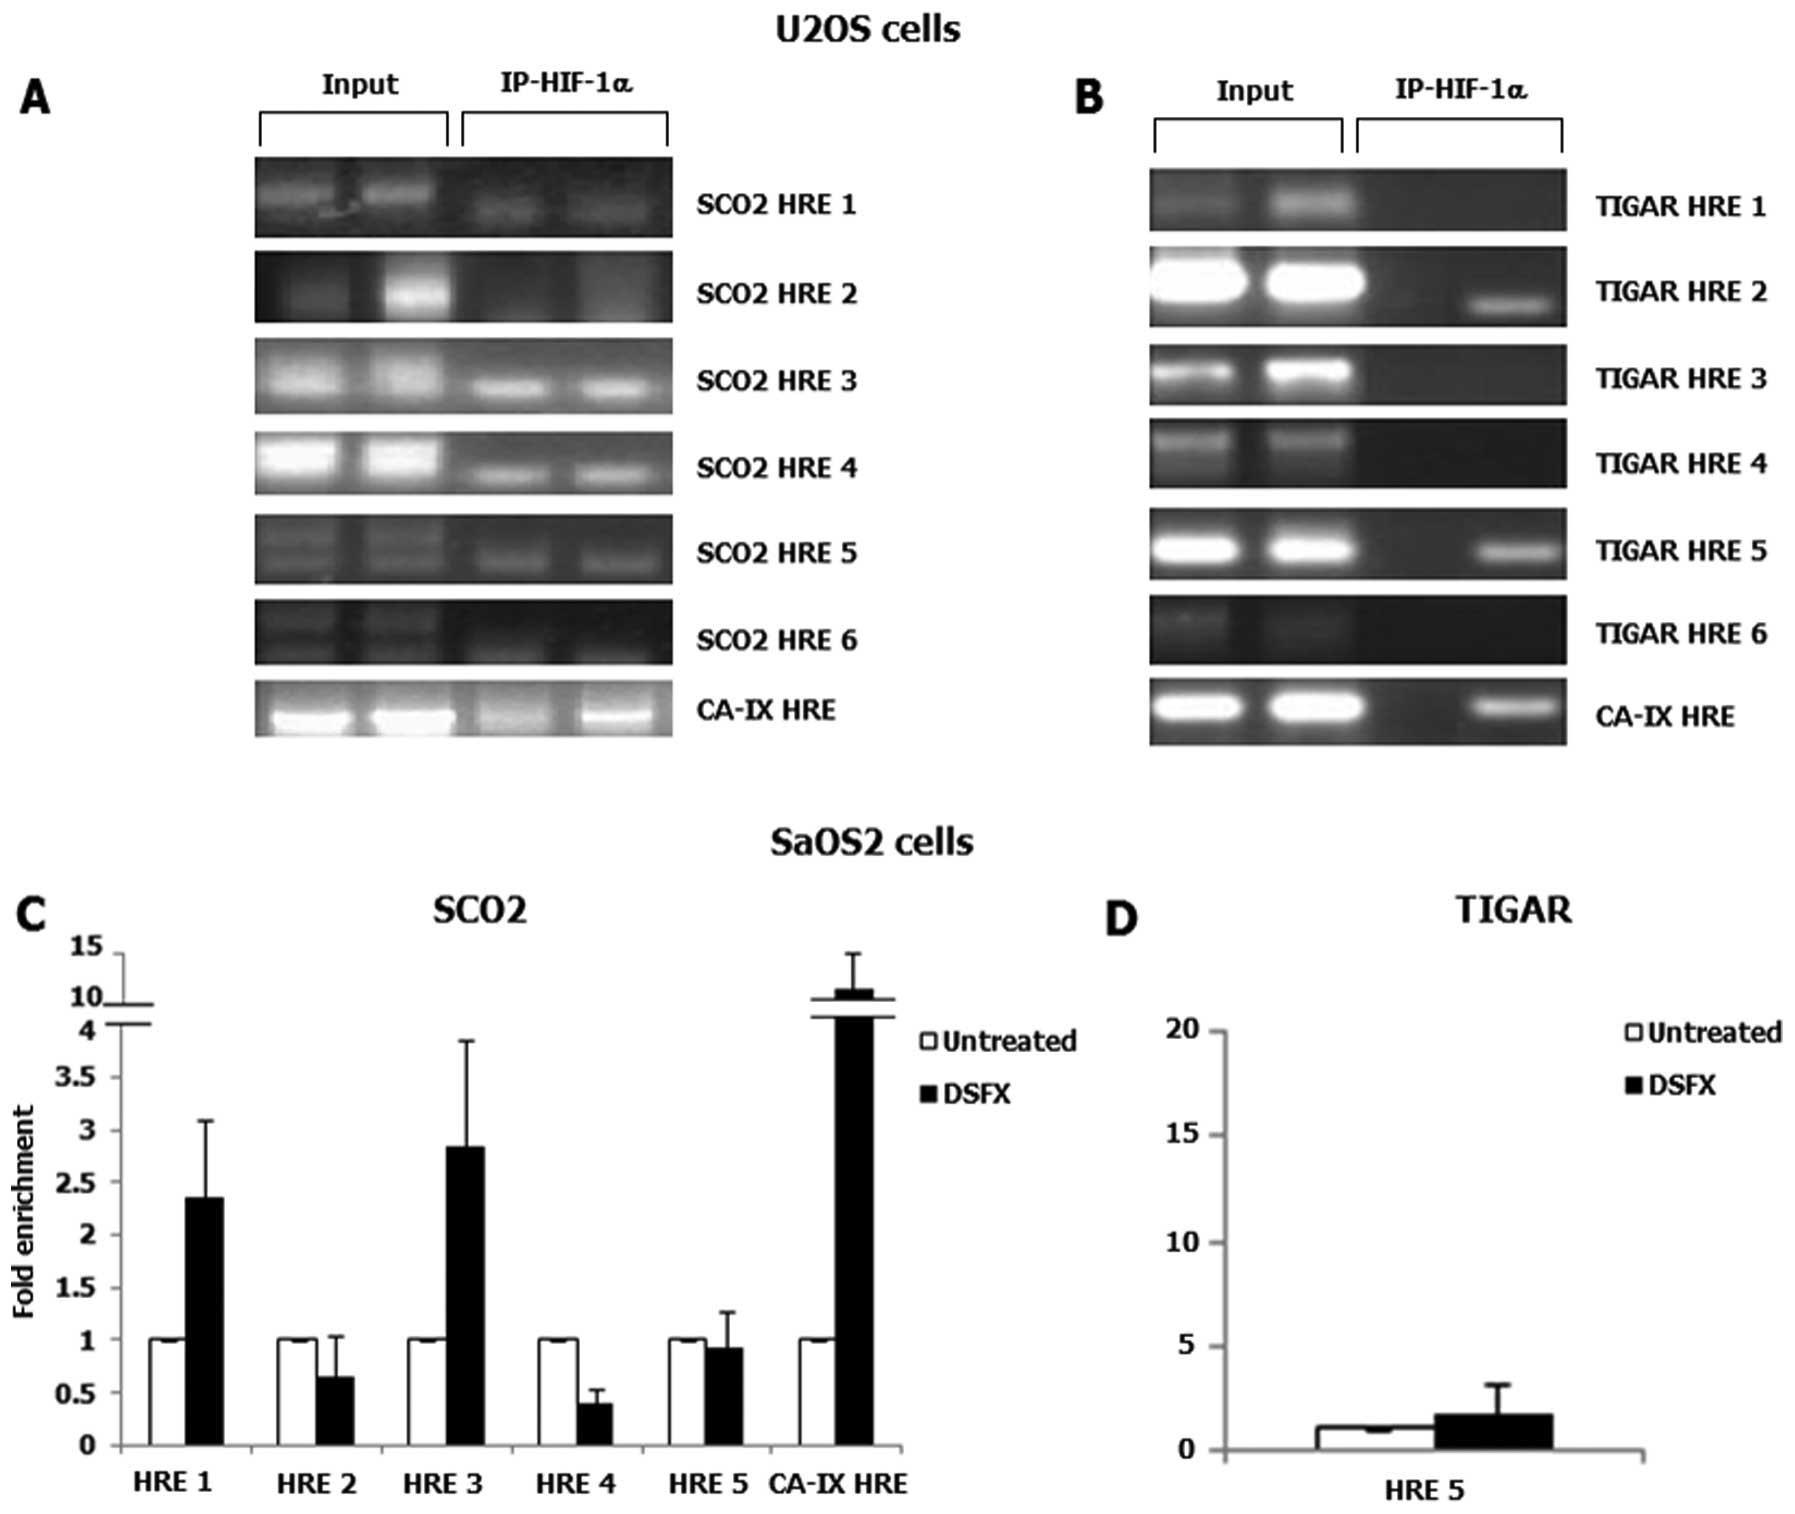
transcription factors. ChIP assays were carried out to assess the
recruitment of HIF-1 to the putative binding sites identified in
SCO2 and TIGAR promoters. HIF-1 complexes with
chromatin were immunoprecipitated using HIF-1α specific ChIP grade
antibody. Rabbit IgG was used as a negative control and 10% input
as loading control. The known HIF-1 transcription target gene
CA-IX was used as a positive control (Fig. 3A–C). In U2OS cells HIF-1α
recruitment was not detected in any of the putative HREs identified
within the SCO2 promoter (Fig.
3A), whereas only the HRE 5 within the TIGAR promoter
was found to be occupied by HIF-1α in DSFX-treated U2OS cells
(Fig. 3B, compare lanes 3 with 4;
the band appearing in the TIGAR HRE 2 panel is not specific).
However, in SaOS2 cells, HIF-1α was found to be recruited in the
putative HRE 1 and HRE 3 sites within the SCO2 promoter
(Fig. 3C). Furthermore, HIF-1α was
not detected bound to the HRE 5 of the TIGAR promoter in the
Saos2 cells (Fig. 3D).
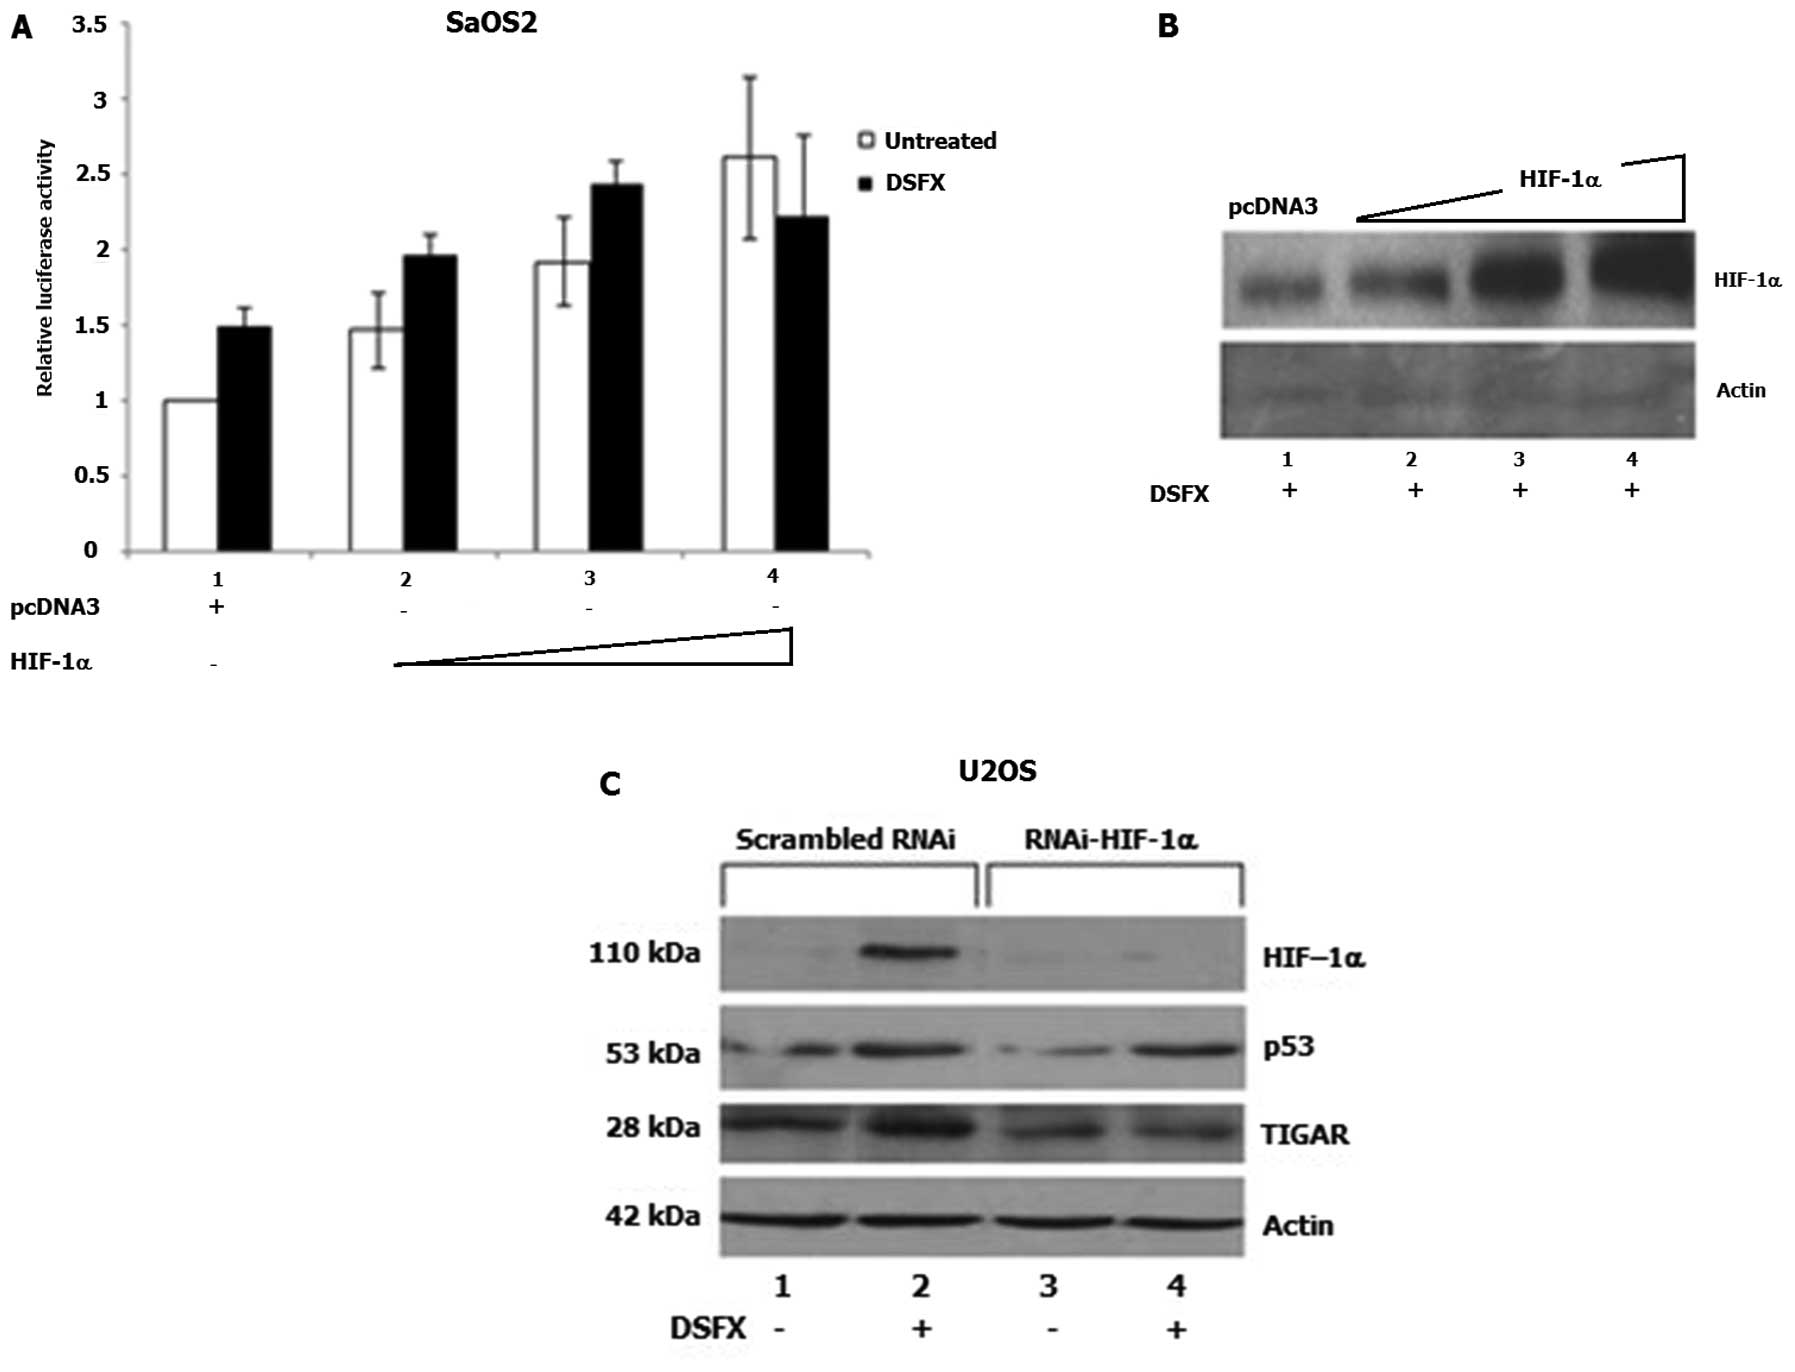
To further investigate the involvement of HIF-1 in
the transcriptional regulation of SCO2 gene expression, the
fragment of the SCO2 promoter containing the putative HREs
1–5 (Fig. 2A) was cloned in the
pGL3-Luc reporter vector as described in Materials and methods. The
constructed SCO2-HRE1-5-p53bs-Luc was used to carry out luciferase
reporter assays in DSFX-treated U2OS and SaOS2 cells ectopically
expressing increasing amounts of HIF-1α. Results shown in Fig. 4A indicated that increasing amounts
of HIF-1α (Fig. 4B) induced
SCO2-HRE1-5-p53bs-Luc expression in SaOS2 cells signifying the
potential involvement of HIF-1α in the regulation of SCO2
gene expression.
Possible involvement of HIF-1α in the regulation of
TIGAR gene expression was evidenced in U2OS cells
transfected with RNAi against HIF-1α and monitoring TIGAR protein
levels (Fig. 4C). Increased TIGAR
protein levels were observed in DSFX-treated U2OS cells transfected
with scrambled RNAi compared to those detected in non-treated cells
(Fig. 4C, compare lanes 2 to 1),
whereas reduced TIGAR protein levels were recorded in U2OS cells
transfected with RNAi-HIF (Fig.
4C, compare lanes 3 and 4 to lanes 1 and 2, respectively).
The HAT activity of PCAF is potentially
involved in the determination of SCO2 and TIGAR cellular
levels
We have previously reported that PCAF HAT activity
plays important role in the determination of both p53 and HIF-1α
transcription target selectivity in hypoxia mimicking conditions
thus coordinating cell cycle arrest or apoptosis under these
conditions (17). It is also known
that lysine acetylases (such as p300 and PCAF) and deacetylases
(such as Sirt-1) act antagonistically to promote or suppress the
transcriptional activity of many transcription factors including
p53 and HIF-1, thereby regulating important cellular functions
(19,20).
Since SCO2 and TIGAR were identified
as possible common transcription targets of p53 (11,16)
and HIF-1α (Figs. 1–4) we were intrigued to examine whether
the HAT activity of PCAF played coordinative role in selectively
targeting p53 or HIF-1 to the SCO2 and TIGAR promoter
in response to diverse environmental stimuli. For this purpose,
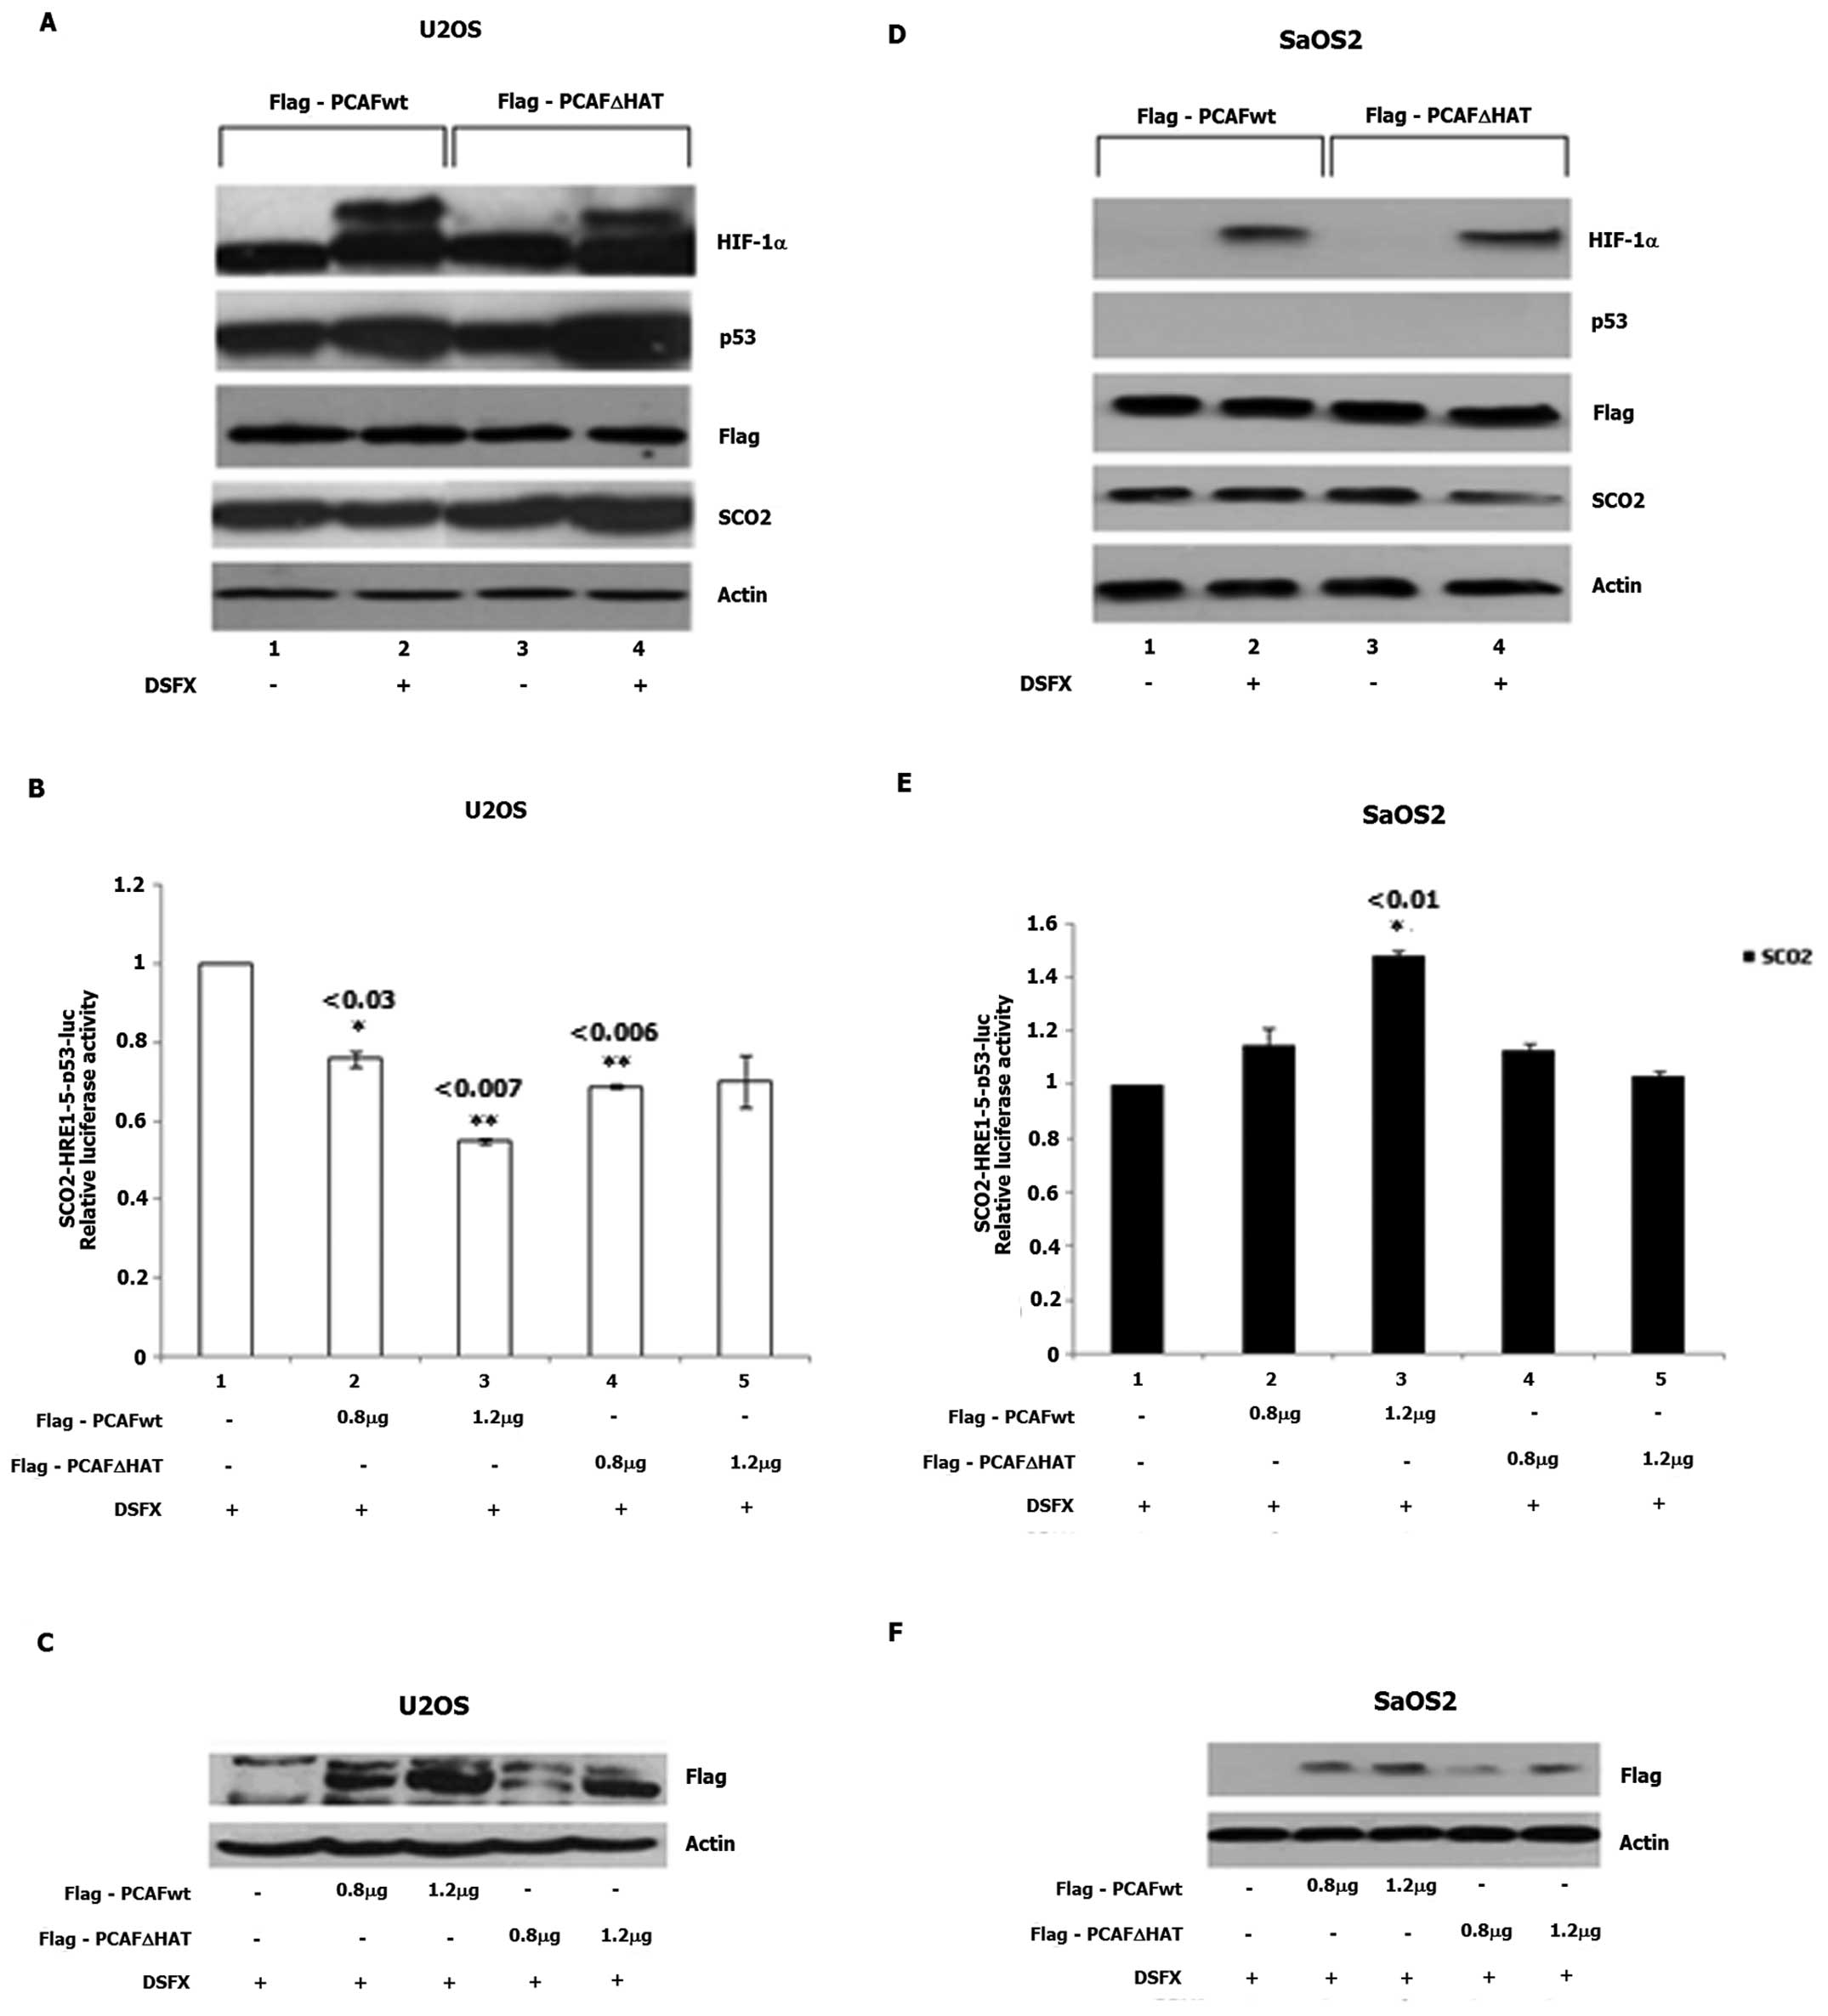
SCO2 protein levels were followed in non-treated and DSFX-treated
U2OS and SaOS2 cells transfected with either, Flag-PCAFwt or
Flag-PCAFΔHAT expression vectors (Fig.
5). Reduced SCO2 protein levels were detected in DSFX-treated
U2OS cells overexpressing Flag-PCAFwt compared to non-treated cells
(Fig. 5A, compare lanes 2 to 1)
while increased SCO2 protein levels were observed in DSFX-treated
U2OS overexpressing Flag-PCAFΔHAT compared to the non-treated cells
(Fig. 5A, compare lanes 4 to 3).
In Flag-PCAFΔHAT overexpressing SaOS2 cells, reduced SCO2 protein
levels were identified in DSFX-treated cells compared to the
non-treated cells (Fig. 5D,
compare lanes 4 to 3). No change in SCO2 protein levels was
observed in Flag-PCAFwt overexpressing SaOS2 cells treated or not
treated with DSFX (Fig. 5D,
compare lanes 2 to 1).
Flag-PCAFwt overexpression in DSFX-treated U2OS
cells downregulated luciferase expression driven by the
SCO2-HRE1-5-p53bs-Luc reporter (Fig.
5B, compare bars 3 to 1). Increasing amounts of Flag-PCAFwt
transfected in SaOS2 cells resulted in 1.5-fold increase in
SCO2-HRE1-5-p53bs-Luc activity compared to that exhibited in the
SaOS2 cells transfected with the empty vector (Fig. 5E, compare bars 1 to 3). No
difference in the SCO2-HRE1-5-p53bs-Luc reporter activity was
observed in U2OS and SaOS2 cells treated with DSFX and ectopically
expressing increasing amounts of Flag-PCAFΔHAT (Fig. 5B and E, bars 4 and 5). Increasing
expression of Flag-PCAFwt and Flag-PCAFΔHAT transfected in U2OS and
SaOS2 cells is shown in Fig. 5C and
F, respectively.
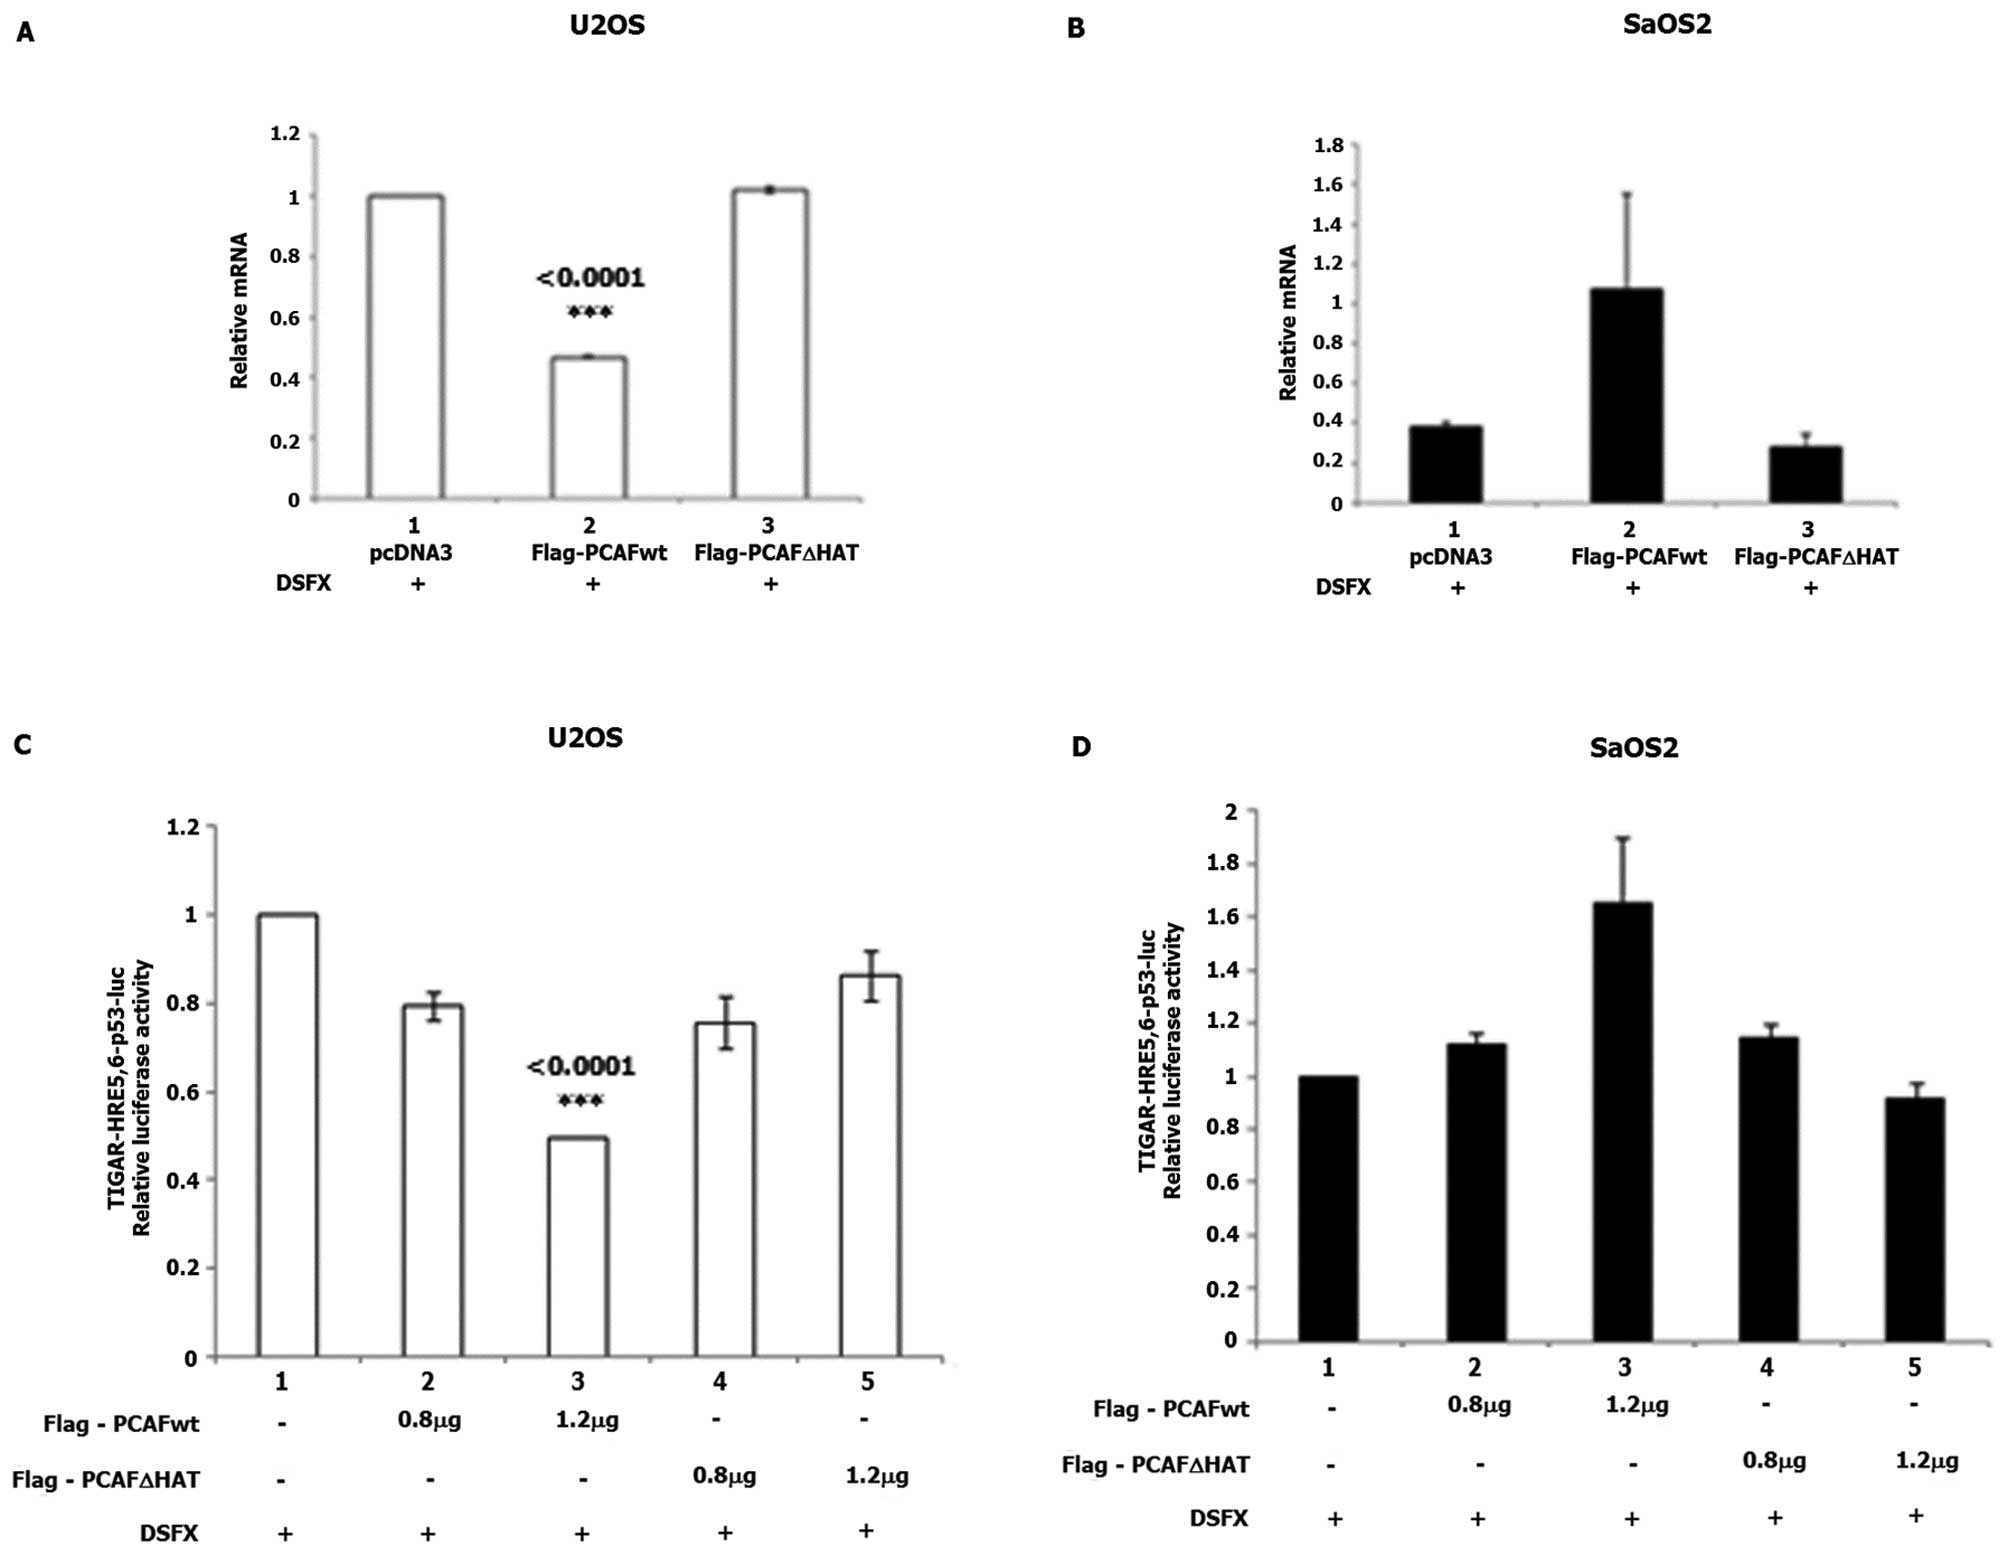
To test whether PCAF plays a role in the regulation
of TIGAR gene expression, we followed TIGAR mRNA levels in
DSFX-treated U2OS and SaOS2 cells transfected with Flag-PCAFwt or
Flag-PCAFΔHAT expression vectors. A statistically significant
reduction of TIGAR mRNA levels was observed in U2OS cells
ectopically expressing Flag-PCAFwt (Fig. 6A, compare bars 2 to 1), whereas
TIGAR mRNA levels were not affected in
Flag-PCAFΔHAT-transfected cells (Fig.
6A compare bars 3 to 1). Upregulated TIGAR mRNA levels
were detected in SaOS2 cells expressing Flag-PCAFwt (Fig. 6B, compare bars 2 to 1) and no
effect of Flag-PCAFΔHAT (Fig. 6B,
compare bars 3 to 1).
Flag-PCAFwt overexpression in DSFX-treated U2OS
cells repressed the luciferase activity of the
TIGAR-HRE5,6-p53bs-Luc reporter (Fig.
6C, compare bars 3 to 1). In DSFX-treated SaOS2 cells
overexpression of Flag-PCAFwt induced the luciferase activity of
the TIGAR-HRE5,6-p53bs-Luc reporter (Fig. 6D, compare bars 3 to 1).
Flag-PCAFΔHAT overexpression did not affect the luciferase activity
of the TIGAR-HRE5,6-p53bs-Luc reporter in either U2OS or SaOS2
cells (Fig. 6C and D respectively,
bars 4 and 5). The increasing amounts of Flag-PCAFwt and
Flag-PCAFΔHAT transfected in U2OS and SaOS2 cells are shown in
Fig. 5C and F, respectively. Taken
together the results shown in Figs.
5 and 6 support the notion
that the HAT activity of PCAF regulates SCO2 and TIGAR cellular
levels by fine tuning p53 and HIF-1α transcriptional activities and
the interplay between these transcription factors (12,16,17).
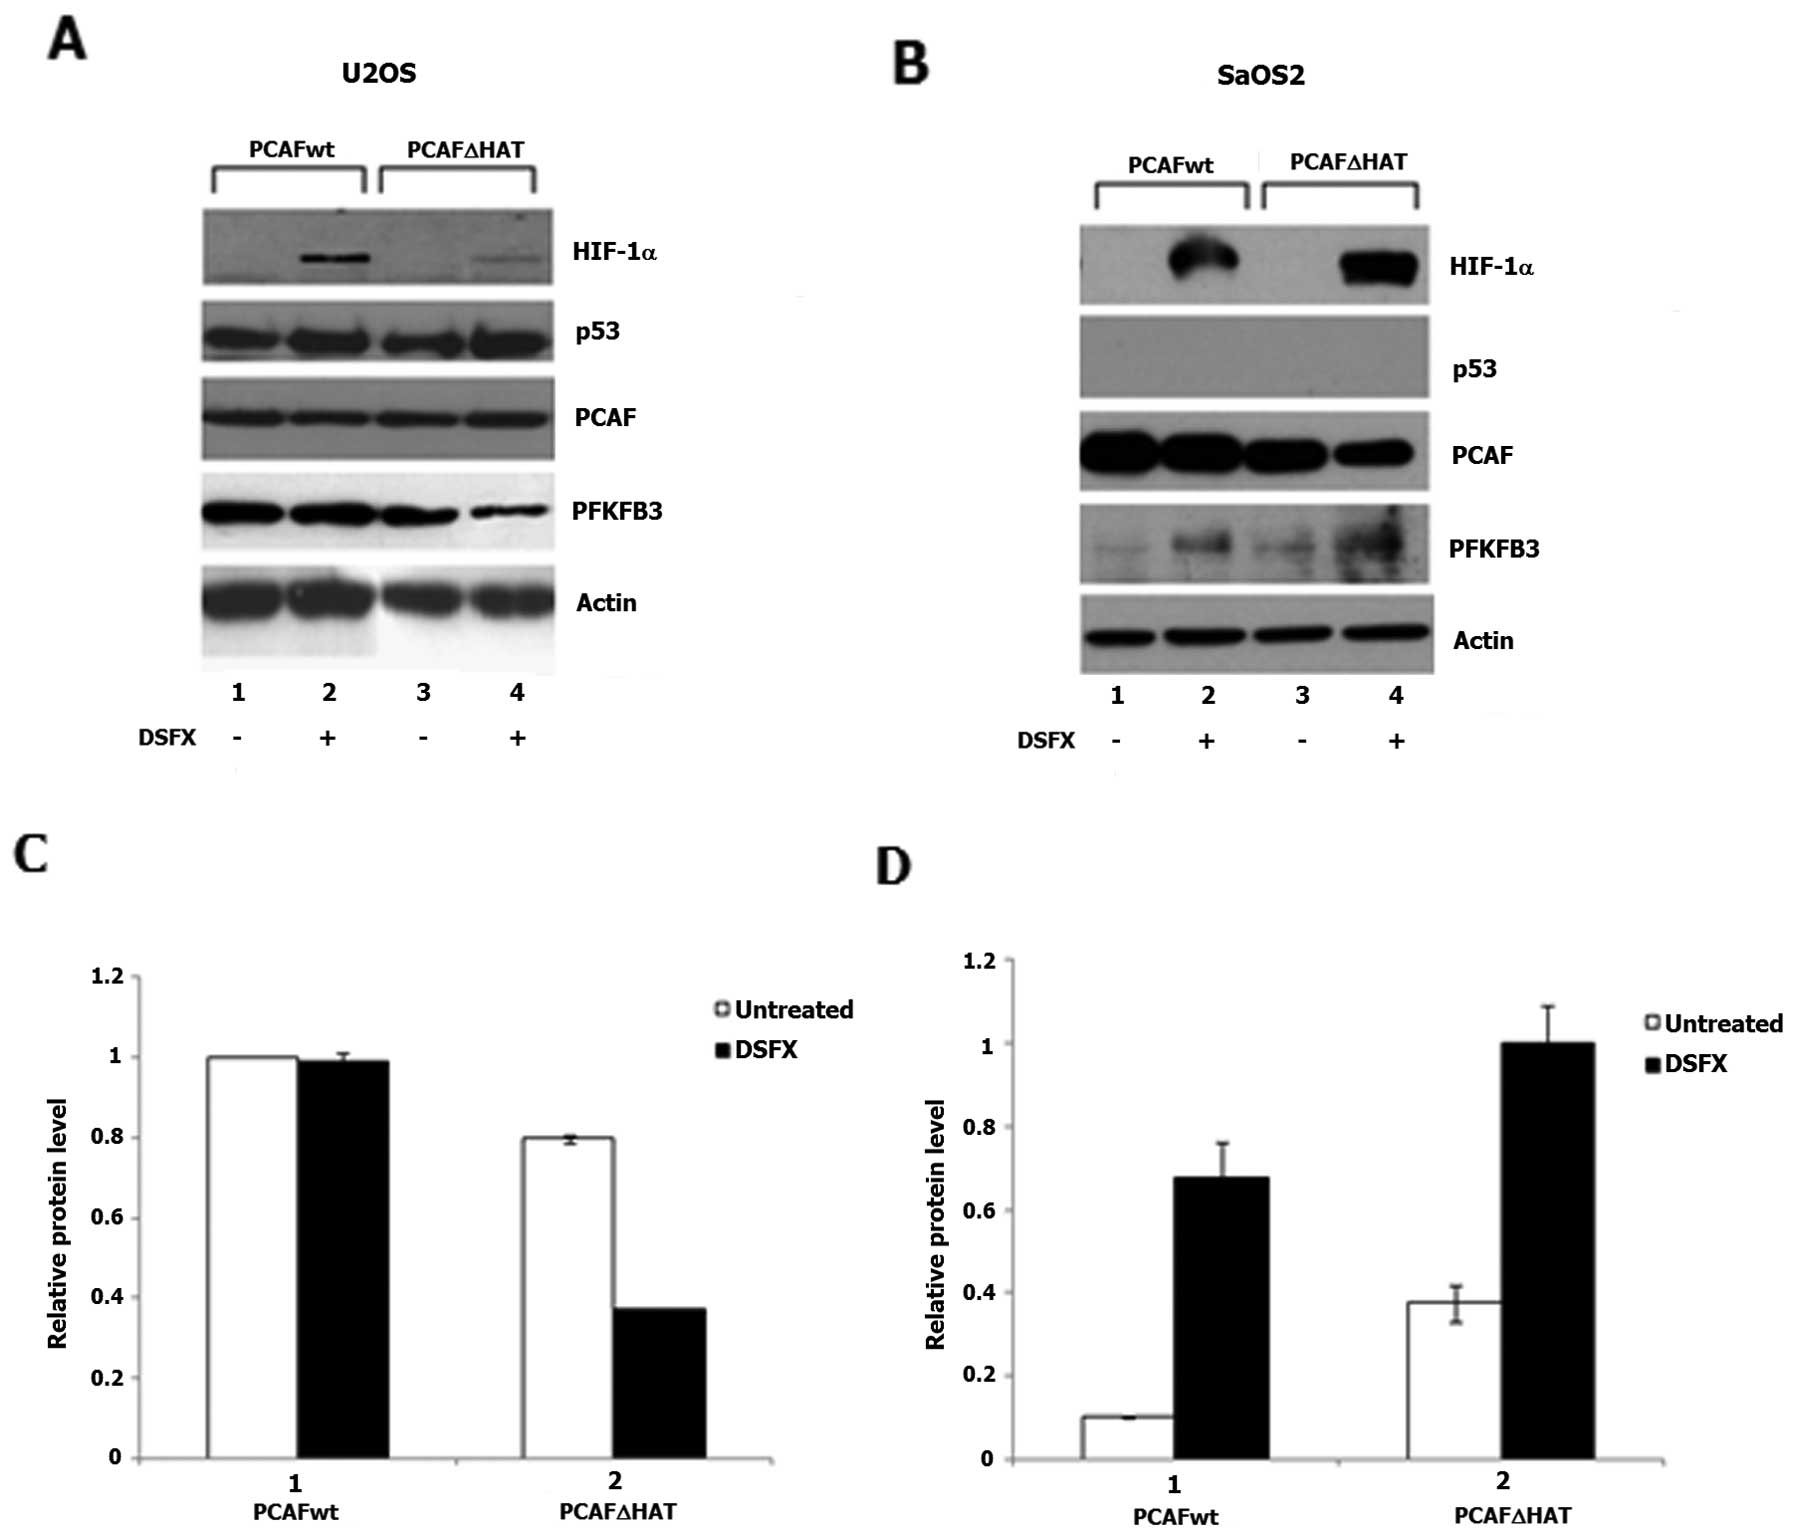
To investigate whether PCAF played a role in the
regulation of the expression of the HIF-1α transcriptional target
gene PFKFB3 the protein levels of this glycolytic regulator
were followed in U2OS and SaOS2 cells overexpressing either
Flag-PCAFwt or Flag-PCAFΔHAT in the presence or absence of DSFX.
Reduced PFKFB3 protein levels were observed in the Flag-PCAFΔHAT
compared to Flag-PCAFwt overexpressing and DSFX-treated U2OS cells
(Fig. 7A, compare lanes 4 to 2 and
Fig. 7C, compare black bars 2 to
1). In SaOS2 cells the HAT activity of PCAF exhibited the opposite
effect to that observed in U2OS on the PFKFB3 protein levels
(Fig. 7B, compare lanes 4 to 2 and
Fig. 7D, compare black bars 2 to
1).
Functional significance of the HAT
activity of PCAF in the regulation of cellular energy
metabolism
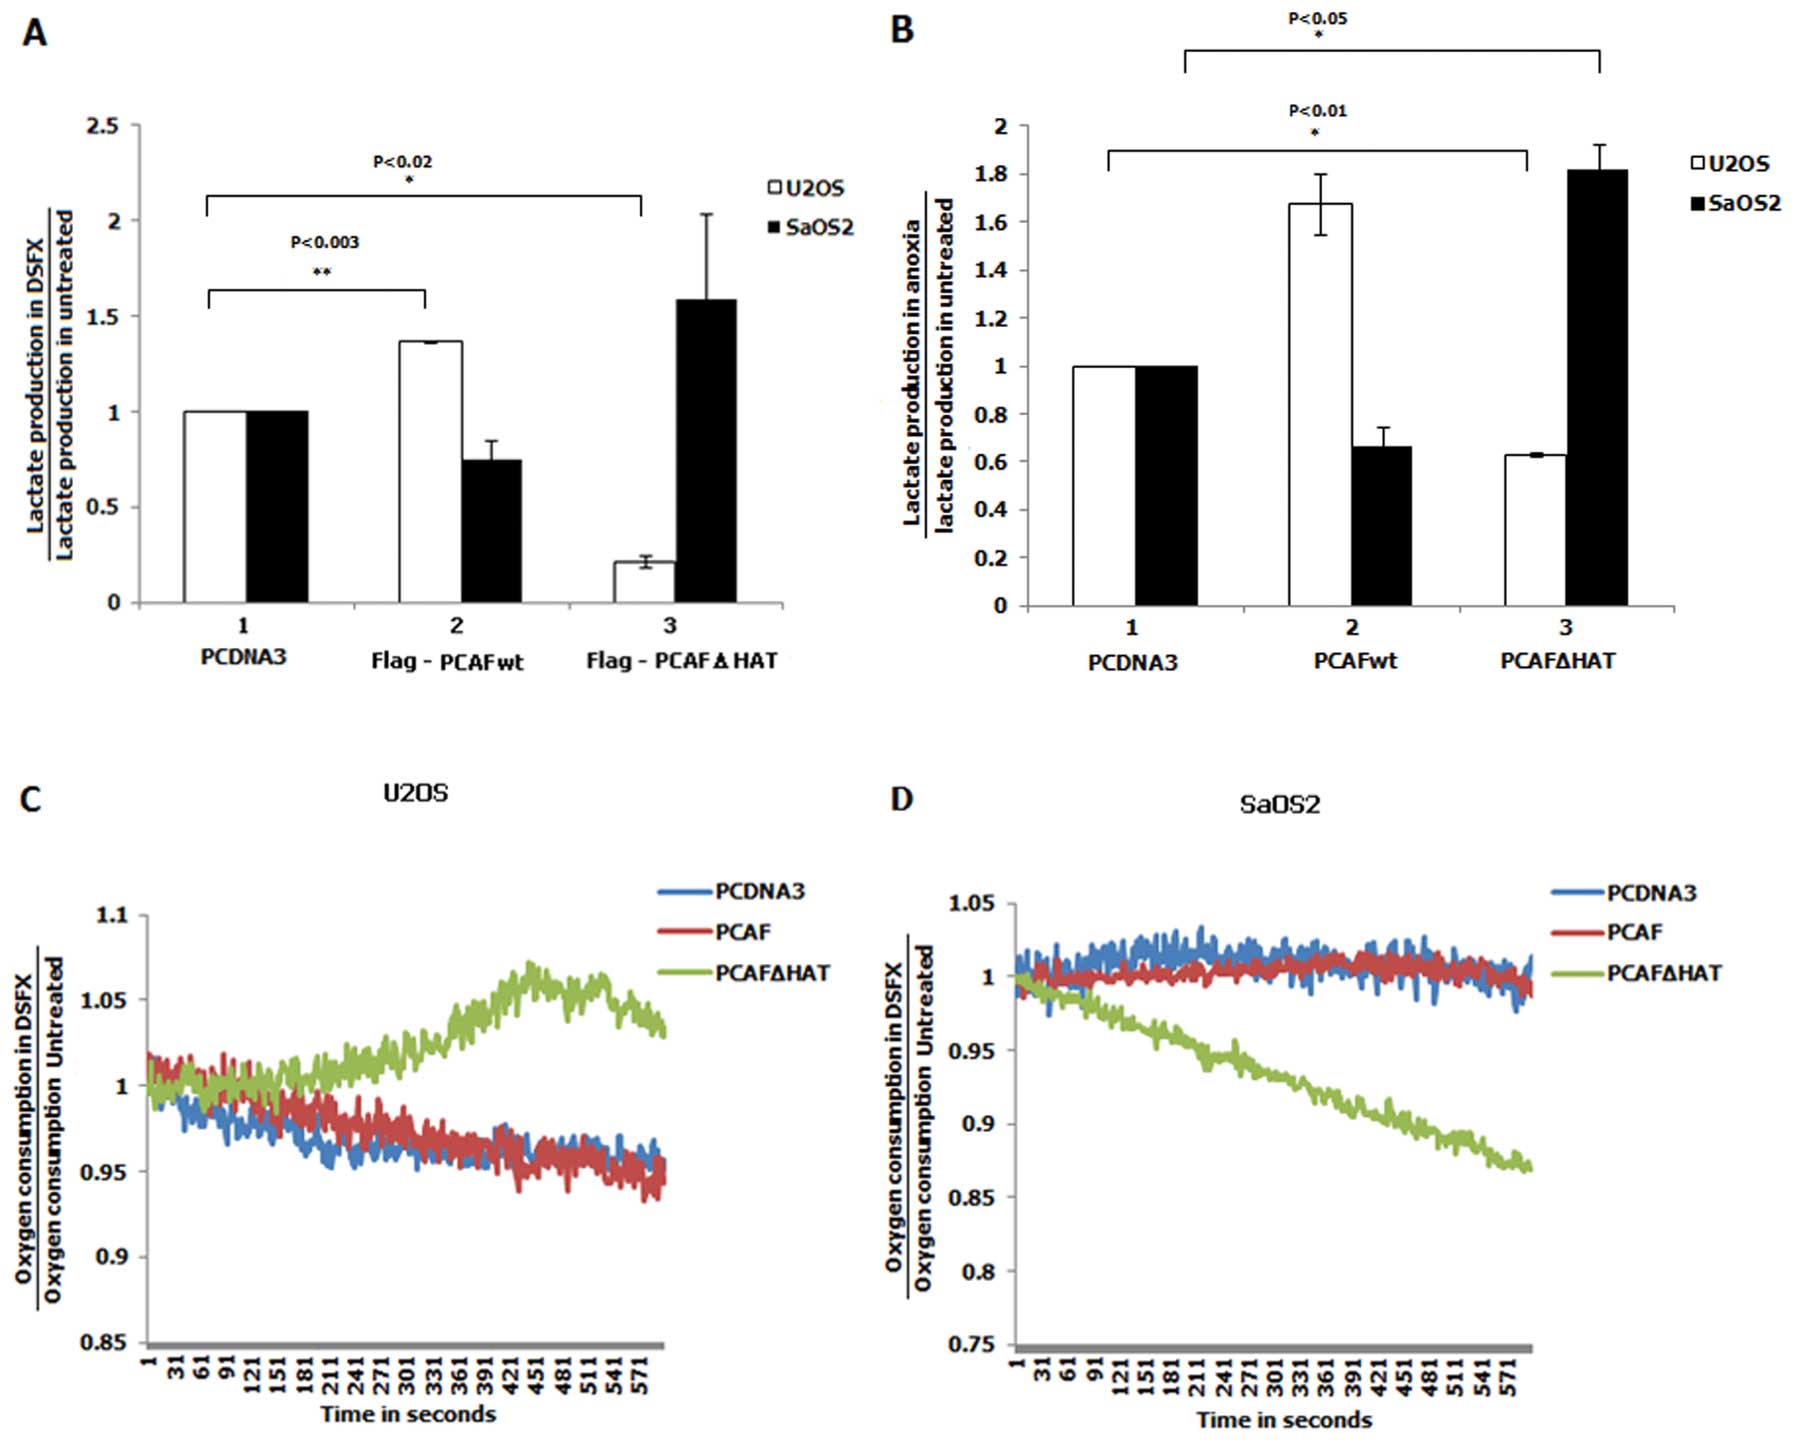
The functional significance of the regulation of
SCO2 and TIGAR gene expression mediated by the
acetyltransferase activity of PCAF was investigated by assessing
the lactate levels produced by cells transfected with either
Flag-PCAFwt or Flag-PCAFΔHAT. The lactate efflux observed in
DSFX-treated cells was normalised to that produced by non-treated
cells. Increased lactate production by DSFX-treated U2OS cells
overexpressing Flag-PCAFwt was observed compared to that estimated
in these cells expressing Flag-PCAFΔHAT under the same conditions
(Fig. 8A, compare white bars 2
with 3). The opposite was the case in SaOS2 cells where
overexpression of Flag-PCAFwt led to reduced lactate efflux in
DSFX-treated versus non-treated cells whereas transfection of
Flag-PCAFΔHAT resulted in increased production of lactate in
hypoxia mimicking conditions (Fig.
8A, compare black bars 2 with 3). Lactate production measured
in U2OS and SaOS2 cells incubated in an anoxic chamber presented
similar results with those obtained from DSFX-treated cells
(compare Fig. 8A with B). These
findings indicated that the HAT activity of PCAF increased
glycolysis in hypoxic U2OS cells and reduced it in SaOS2 cells
corresponding with downregulated TIGAR gene expression in
DSFX-treated and Flag-PCAFwt expressing U2OS cells and upregulated
TIGAR gene expression in SaOS2 cells under these conditions
(Fig. 6). Thus the differential
lactate production in U2OS and SaOS2 cells could be mechanistically
explained at least in part by the opposite effect of PCAF on the
TIGAR gene expression in the two cell lines (Fig. 6).
Inability to produce energy through OXPHOS in cancer
cells is compensated by increased glycolysis (26). Oxygen uptake is an indicator of the
ability of the cells to produce energy through the OXPHOS pathway
(11). The role of the HAT
activity of PCAF in the regulation of OXPHOS was studied by
quantifying the ability of Flag-PCAFwt, Flag-PCAFΔHAT or PCDNA3
empty vector transfected in U2OS or SaOS2 cells to uptake oxygen
(Fig. 8C and D, red, green and
blue lines respectively). The oxygen consumption in DSFX-treated
and non-treated cells was calculated as described in Materials and
methods. While the lactate production of DSFX-treated U2OS cells
transfected with Flag-PCAFΔHAT was decreased compared to these
cells transfected with Flag-PCAFwt under the same conditions
(Fig. 8A, compare white bars 3
with 2), the oxygen consumption was found to be increased in the
same conditions (Fig. 8C, compare
green line with red and blue lines). In contrast to U2OS cells,
DSFX-treated SaOS2 cells overexpressing Flag-PCAFΔHAT consumed less
oxygen compared to cells transfected with Flag-PCAFwt (Fig. 8D, compare green line with red and
blue lines). Taken together results shown in Fig. 8 indicate that the HAT activity of
PCAF plays an important role in determining the pathway of cellular
energy production in hypoxia mimicking conditions.
Discussion
Proliferation status and physiological conditions
are some of the factors determining the cellular energy demands.
Among the transcription factors that orchestrate the pathways of
cellular energy metabolism to harmonize cell cycle progression and
energy metabolism with environmental physiological conditions is
the tumour suppressor p53 (27).
Inactivation of p53 results in substantial OXPHOS deficiency
(11) and increased dependence on
glycolysis accompanied by elevated lactate production (28). The p53 mediated switch from OXPHOS
to glycolysis is in part implemented by the transcriptional
regulation of the expression of a number of genes involved in both
OXPHOS and glycolysis by this transcription factor (11). For example, p53 acting in a cell
type-dependent mode stimulates the expression of genes essential
for the completion of the OXPHOS pathway such as
SCO2(11) and inhibits
glycolysis by repressing the glucose transporters GLUT-1 and GLUT-4
(29).
In cancer tissues the deprivation of cellular oxygen
within hypoxic regions contributes to the shift to glycolysis and
eventually tumour cell growth. In response to low oxygen
concentration the gene expression of a variety of metabolic enzymes
such as GLUT and the regulatory bifunctional PFKFB3 enzyme is
directed by the HIF family of transcription factors (30,31).
Dramatic increase of the ratio of kinase:phosphatase activity of
the HIF-1α transcription target PFKFB3 in hypoxic conditions
results in increased F2,6BP concentration in hypoxic solid tumours
(31,32). The homologue to the bisphosphatase
domain of the PFK2/FBPase2 gene TIGAR has been identified as
a p53 transcriptional target (16)
suggesting that the reduction of the phosphatase activity of
FBPase2 in hypoxia and increased glycolysis could be exaggerated as
a result of active repression of TIGAR gene expression under
these conditions. In addition, HIF-1α mediated downregulation of
mitochondrial oxygen consumption and preservation of the Crabtree
effect might be the result of differential modulation of
SCO2 gene expression in hypoxia (6).
In order to identify p53 and HIF-1α common
transcription target genes involved in energy production pathways
we tested the possibility the gene expression of the known p53
targets SCO2 and TIGAR was under HIF-1α control. We
followed the mRNA and protein levels of these genes in hypoxia
mimicking conditions, which revealed that both SCO2 and
TIGAR cellular levels were differentially regulated in
normoxia compared to hypoxia mimicking conditions (Fig. 1). To find out whether HIF-1α was
one of the factors involved in the regulation of SCO2 and
TIGAR mRNA and protein levels we searched for the existence
of potential HRE sites within the regulatory region of the
promoters of both these genes (Fig.
2) and tested the activity of these sites employing luciferase
reporter and chromatin immunoprecipitation assays, which supported
the notion that SCO2 and TIGAR were under HIF-1
transcriptional control (Figs. 3
and 4).
PCAF has been shown to acetylate both HIF-1α and p53
and coordinate their selective recruitment to pro-survival or
apoptotic genes such as p21 and BID thereby regulating cell cycle
arrest and apoptosis in hypoxic conditions (17). Given the fact that cell cycle
regulation and metabolism share common regulatory pathways
(23) and PCAF is a co-factor
regulating cell growth effects mediated by both p53 and HIF-1α
(17), we expanded our studies to
investigate whether PCAF was involved in the fine tuning of p53 and
HIF-1α mediated effects on metabolism. Luciferase reporter assays
pointed out that the HAT activity of PCAF was involved in the
HIF-1α mediated regulation of the expression of SCO2
(Fig. 5) and TIGAR
(Fig. 6) gene expression
indicating a role of PCAF mediated acetylation as a major regulator
for the determination of the pathway of cellular energy production
in hypoxia mimicking conditions. Furthermore, downregulation of
PFKFB3 in U2OS cells overexpressing Flag-PCAFΔHAT in hypoxia
mimicking conditions and upregulation of this enzyme in SaOS2 under
the same conditions (Fig. 7)
implied that the HAT activity of PCAF regulated both TIGAR
(Fig. 6) and PFKFB3 (Fig. 7) cellular levels. Given the fact
that TIGAR shares structural and functional similarity with the
phosphatase domain of PFKFB3, this result suggested that TIGAR
might compensate for the lack of phosphatase activity of PFKFB in
hypoxia mimicking conditions.
The interplay of the two main bioenergetic pathways
OXPHOS and glycolysis mediated by the HAT activity of PCAF was
investigated by analysing lactate production and oxygen consumption
in cells overexpressing Flag-PCAFwt or Flag-PCAFΔHAT variants
(Fig. 8). Results shown in
Fig. 8A and B suggested that
Flag-PCAFwt overexpressing U2OS cells depend more on glycolysis in
hypoxia mimicking and anoxic conditions than untransfected or
Flag-PCAFΔHAT expressing cells under the same conditions (Fig. 8A and B). In contrast, in hypoxia
mimicking or anoxic conditions SaOS2 cells overexpressing
Flag-PCAFwt exhibited higher lactate level production than those
transfected with Flag-PCAFΔHAT (Fig.
8A and B). Increased ability of Flag-PCAFΔHAT overexpressing
U2OS cells to uptake oxygen in hypoxia mimicking conditions
(Fig. 8C) could be indicative of
elevated capacity of these cells to produce energy through OXPHOS.
In addition, the increased lactate production observed in U2OS
cells overexpressing Flag-PCAFΔHAT comply with the reduced oxygen
consumption observed in these cells (Fig. 8A, B and D). Reduced oxygen uptake
could be an indication of reduced oxidative phosphorylation, but
the increased oxygen consumption may or may not indicate increased
OXPHOS (33).
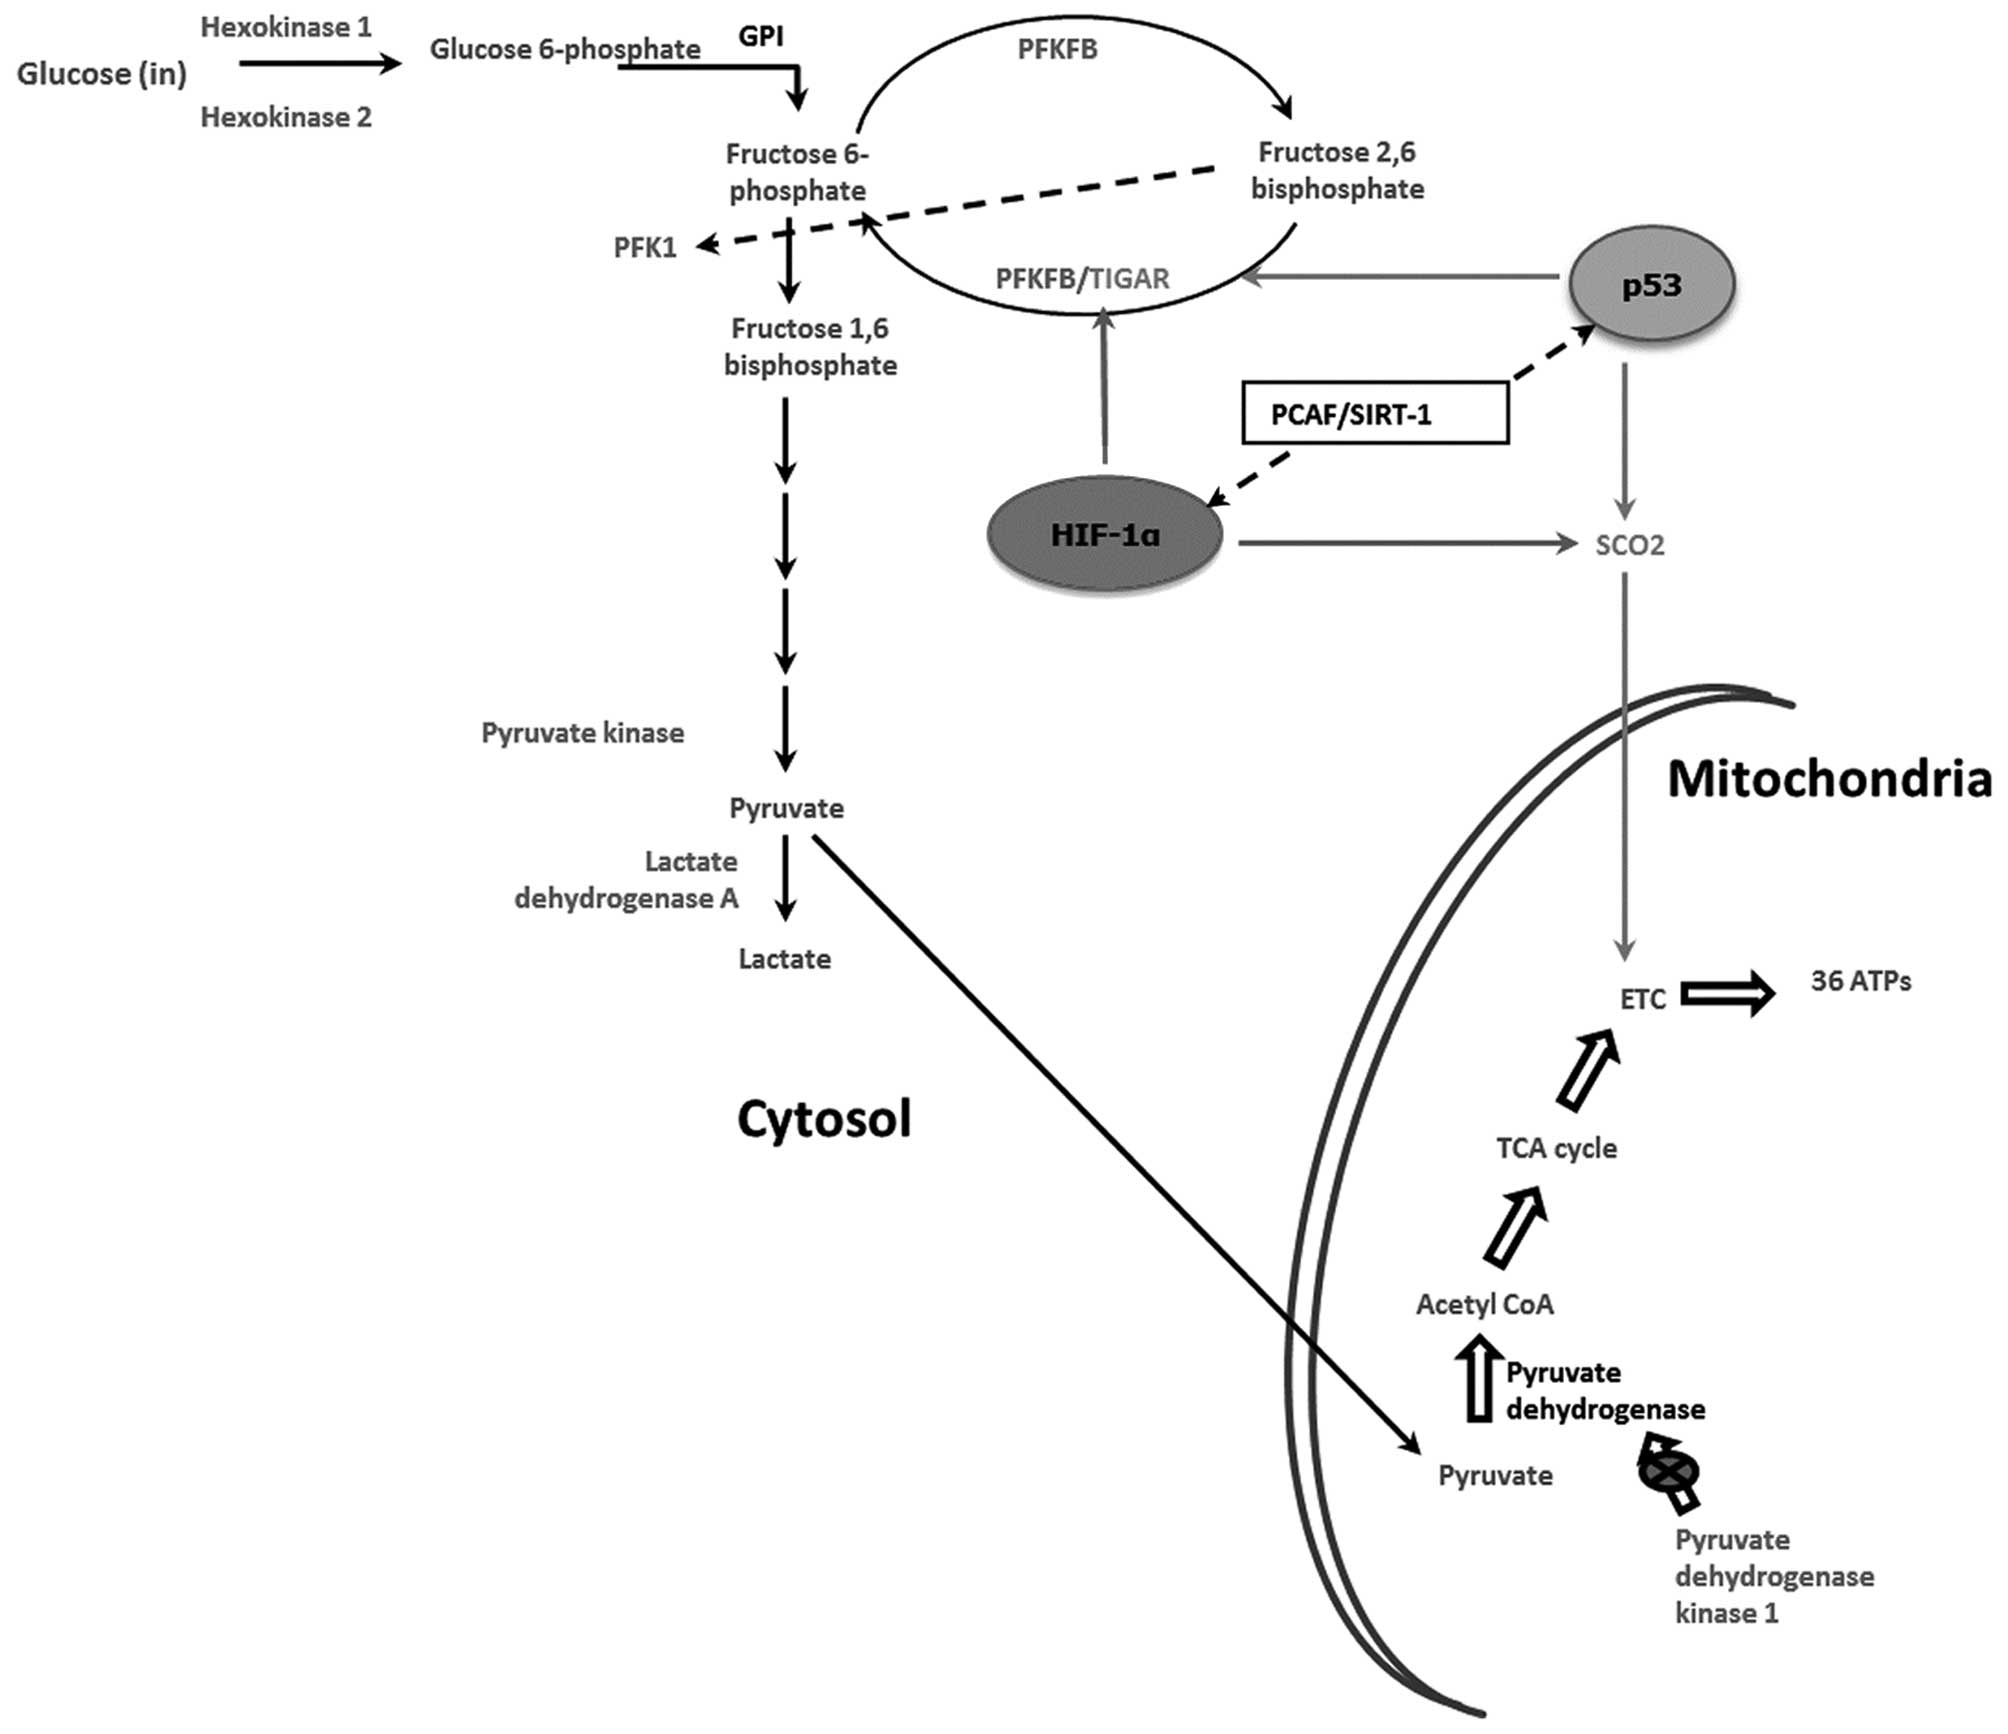
Collectively, the results presented provide evidence
to support a role for the HAT activity of PCAF, at least in part,
in determining the pathway of cellular energy production in U2OS
and SaOS2 cells by fine tuning the crosstalk between p53 and HIF-1α
(Fig. 9).
Acknowledgements
We would like to thank Professor K.
Vousden, Professor P.M. Hwang and Dr I. Talianidis for providing
reagents used in this study.
References
|
1
|
Fantin VR, St-Pierre J and Leder P:
Attenuation of LDH-A expression uncovers a link between glycolysis,
mitochondrial physiology, and tumor maintenance. Cancer Cell.
9:425–434. 2006. View Article : Google Scholar : PubMed/NCBI
|
|
2
|
Vander Heiden MG, Plas DR, Rathmell JC,
Fox CJ, Harris MH and Thompson CB: Growth factors can influence
cell growth and survival through effects on glucose metabolism. Mol
Cell Biol. 21:5899–5912. 2001.PubMed/NCBI
|
|
3
|
Olovnikov IA, Kravchenko JE and Chumakov
PM: Homeostatic functions of the p53 tumor suppressor: Regulation
of energy metabolism and antioxidant defense. Semin Cancer Biol.
19:32–41. 2009. View Article : Google Scholar
|
|
4
|
Sonveaux P, Végran F, Schroeder T, et al:
Targeting lactate-fueled respiration selectively kills hypoxic
tumor cells in mice. J Clin Invest. 118:3930–3942. 2008.
|
|
5
|
Kroemer G and Pouyssegur J: Tumor cell
metabolism: cancer’s Achilles’ heel. Cancer Cell. 13:472–482.
2008.
|
|
6
|
Papandreou I, Cairns RA, Fontana L, Lim AL
and Denko NC: HIF-1 mediates adaptation to hypoxia by actively
downregulating mitochondrial oxygen consumption. Cell Metab.
3:187–197. 2006. View Article : Google Scholar : PubMed/NCBI
|
|
7
|
Semenza G: HIF-1 mediates the Warburg
effect in clear cell renal carcinoma. J Bioenerg Biomembr.
39:231–234. 2007. View Article : Google Scholar : PubMed/NCBI
|
|
8
|
Tennant DA, Duran RV, Boulahbel H and
Gottlieb E: Metabolic transformation in cancer. Carcinogenesis.
30:1269–1280. 2009. View Article : Google Scholar : PubMed/NCBI
|
|
9
|
Vousden KH and Ryan KM: p53 and
metabolism. Nat Rev Cancer. 9:691–700. 2009. View Article : Google Scholar
|
|
10
|
Shen L, Sun X, Fu Z, Yang G, Li J and Yao
L: The fundamental role of the p53 pathway in tumor metabolism and
its implication in tumor therapy. Clin Cancer Res. 18:1561–1567.
2012. View Article : Google Scholar : PubMed/NCBI
|
|
11
|
Matoba S, Kang J-G, Patino WD, et al: p53
regulates mitochondrial respiration. Science. 312:1650–1653. 2006.
View Article : Google Scholar : PubMed/NCBI
|
|
12
|
Bensaad K, Cheung EC and Vousden KH:
Modulation of intracellular ROS levels by TIGAR controls autophagy.
EMBO J. 28:3015–3026. 2009. View Article : Google Scholar : PubMed/NCBI
|
|
13
|
Stiburek L and Zeman J: Assembly factors
and ATP-dependent proteases in cytochrome c oxidase biogenesis.
Biochim Biophys Acta. 1797:1149–1158. 2010. View Article : Google Scholar : PubMed/NCBI
|
|
14
|
Jaksch M, Ogilvie I, Yao J, et al:
Mutations in SCO2 are associated with a distinct form of
hypertrophic cardiomyopathy and cytochrome c oxidase deficiency.
Hum Mol Genet. 9:795–801. 2000. View Article : Google Scholar : PubMed/NCBI
|
|
15
|
Li H and Jogl G: Structural and
biochemical studies of TIGAR (Tp53-induced glycolysis and apoptosis
regulator). J Biol Chem. 284:1748–1754. 2009. View Article : Google Scholar : PubMed/NCBI
|
|
16
|
Bensaad K, Tsuruta A, Selak MA, et al:
TIGAR, a p53-inducible regulator of glycolysis and apoptosis. Cell.
126:107–120. 2006. View Article : Google Scholar : PubMed/NCBI
|
|
17
|
Xenaki G, Ontikatze T, Rajendran R, et al:
PCAF is an HIF-1[alpha] co-factor that regulates p53
transcriptional activity in hypoxia. Oncogene. 27:5785–5796.
2008.
|
|
18
|
Lim J-H, Lee Y-M, Chun Y-S, Chen J, Kim
J-E and Park J-W: Sirtuin 1 modulates cellular responses to hypoxia
by deacetylating hypoxia-inducible factor 1α. Mol Cell. 38:864–878.
2010.PubMed/NCBI
|
|
19
|
Fulco M, Schiltz RL, Iezzi S, et al: Sir2
regulates skeletal muscle differentiation as a potential sensor of
the redox state. Mol Cell. 12:51–62. 2003. View Article : Google Scholar : PubMed/NCBI
|
|
20
|
Motta MC, Divecha N, Lemieux M, et al:
Mammalian SIRT1 represses forkhead transcription factors. Cell.
116:551–563. 2004. View Article : Google Scholar : PubMed/NCBI
|
|
21
|
Haigis MC and Sinclair DA: Mammalian
sirtuins: biological insights and disease relevance. Annu Rev
Pathol. 5:253–295. 2010. View Article : Google Scholar : PubMed/NCBI
|
|
22
|
Sohda M, Ishikawa H, Masuda N, et al:
Pretreatment evaluation of combined HIF-1α, p53 and p21 expression
is a useful and sensitive indicator of response to radiation and
chemotherapy in esophageal cancer. Int J Cancer. 110:838–844.
2004.
|
|
23
|
Fritz V and Fajas L: Metabolism and
proliferation share common regulatory pathways in cancer cells.
Oncogene. 29:4369–4377. 2010. View Article : Google Scholar : PubMed/NCBI
|
|
24
|
Soutoglou E, Katrakili N and Talianidis I:
Acetylation regulates transcription factor activity at multiple
levels. Mol Cell. 5:745–751. 2000. View Article : Google Scholar : PubMed/NCBI
|
|
25
|
Demonacos C, Krstic-Demonacos M and La
Thangue NB: A TPR motif co-factor contributes to p300 activity in
the p53 response. Mol Cell. 8:71–84. 2001. View Article : Google Scholar : PubMed/NCBI
|
|
26
|
Wallace DC: Bioenergetics, the origins of
complexity, and the ascent of man. Proc Natl Acad Sci USA.
107:8947–8953. 2010. View Article : Google Scholar : PubMed/NCBI
|
|
27
|
Bensaad K and Vousden KH: p53: new roles
in metabolism. Trends Cell Biol. 17:286–291. 2007. View Article : Google Scholar : PubMed/NCBI
|
|
28
|
Zhou S, Kachhap S and Singh KK:
Mitochondrial impairment in p53-deficient human cancer cells.
Mutagenesis. 18:287–292. 2003. View Article : Google Scholar : PubMed/NCBI
|
|
29
|
Schwartzenberg-Bar-Yoseph F, Armoni M and
Karnieli E: The tumor suppressor p53 down-regulates glucose
transporters GLUT1 and GLUT4 gene expression. Cancer Res.
64:2627–2633. 2004. View Article : Google Scholar : PubMed/NCBI
|
|
30
|
Formenti F, Constantin-Teodosiu D,
Emmanuel Y, et al: Regulation of human metabolism by
hypoxia-inducible factor. Proc Natl Acad Sci USA. 107:12722–12727.
2010. View Article : Google Scholar : PubMed/NCBI
|
|
31
|
Yalcin A, Telang S, Clem B and Chesney J:
Regulation of glucose metabolism by
6-phosphofructo-2-kinase/fructose-2,6-bisphosphatases in cancer.
Exp Mol Pathol. 86:174–179. 2009. View Article : Google Scholar : PubMed/NCBI
|
|
32
|
Chesney J:
6-phosphofructo-2-kinase/fructose-2,6-bisphosphatase and tumor cell
glycolysis. Curr Opin Clin Nutr Metab Care. 9:535–539. 2006.
View Article : Google Scholar : PubMed/NCBI
|
|
33
|
Seyfried T and Shelton L: Cancer as a
metabolic disease. Nutr Metab. 7:72010. View Article : Google Scholar
|