Introduction
Cancer cachexia is a serious problem that affects
the majority of the cancer patients (1,2). The
characteristics of cancer cachexia are appetite loss, decrease in
body weight (BW) decline in storage fat and muscle weights, and
deteriorations of nutrition, water, and electrolyte status. In
addition, cancer cachexia is associated with poor prognosis,
diminished quality of life, and obstacles to cancer treatment
(3). Therefore, it is very
important to establish a therapeutic strategy for cancer cachexia
in order to improve patient quality of life and outcomes. However,
the mechanisms underlying cancer cachexia have not been fully
elucidated, likely because many factors (including many cytokines
and hormones) are involved in the pathogenesis of this condition
(4,5).
Some studies have reported that the tumor
characteristics play a major role in the pathogenesis of cancer
cachexia, while host factors play a minor role (6,7).
However, the fact that cancer cachexia develops in the majority of
end-stage cancer patients (3,8) but
not in patients with certain types of cancer, suggests that the
tumor environment may play a larger role. In addition,
cachexia-inducing factors, such as various cytokines and hormones
(4,5), are produced both by cancer cells and
host cells. Using colon 26 murine adenocarcinoma cells, we
previously demonstrated that the host’s immune function plays an
important role in the development of cancer cachexia (9–12).
Tumor cells are comprised of many different kinds of
cells. The inoculation of tumor cells provokes a reaction by the
host cells, resulting in a selection of tumor cells. Indeed,
inoculation of original colon 26 in different sites results in
different composition of tumor cells, and the selection of cancer
cells in response to the host environment results in different
clinical manifestations (13).
Even when tumor cells are inoculated in nude mice with an
immunological deficit, the metastatic capacity of the established
tumor varies according to the site of the tumor (14,15).
The present study investigated the relationship
between tumor environment and cancer cachexia. In order to exclude
the difference of tumor cell type grown in the inoculated site
after selection by the immune system, a single cell clone (clone 5
of colon 26 adenocarcinoma) was employed. Clone 5 tumor was
established by the limiting dilution method; i.e., it was
established from a single cell of colon 26 adenocarcinoma (16).
Materials and methods
Tumor cells
Clone 5 cell, a single-cell clone established from
colon 26 adenocarcinoma by the limiting dilution cell cloning
method, was employed. Unlike original colon 26, clone 5 does not
provoke any symptoms and signs of cancer cachexia in mice when
inoculated in the subcutaneous tissues (10,16).
Clone 20 cell, another subclone of colon 26, with a potent
cachexia-inducing capacity when inoculated in subcutaneous tissues,
was also used.
Cells were seeded at a density of 5×10⁵
cells/ml in T75 flasks (75 cm2, Iwaki Glass, Tokyo,
Japan) with RPMI-1640 containing 10% heat-inactivated fetal bovine
serum (FBS) (Gibco, Grand Island, NY, USA) and incubated at 37°C in
a humidified 5% CO2 atmosphere until they grew to
sub-confluence. They were then trypsinized and re-suspended in
Hanks’ balanced salt solution (Gibco) at a density of
5×10⁵ cells/ml, and 0.2 ml of cell suspension containing
106 cells was inoculated either in the subcutis,
gastrocnemius muscle, peritoneal cavity, or thoracic cavity.
For determination of cytokine levels in the cell
lysate and conditioned medium, 1×10⁶ cells in
conditioned medium were centrifuged at 500 × g for 5 min at 4°C.
The conditioned medium was collected and stored at −80°C until the
cytokine assay was performed. The cells were re-suspended with
phosphate-buffered saline (PBS). After removal of PBS by
centrifugation, the cells were suspended in Procarta lysis buffer
(Panomics, Inc., Fremont, CA, USA, from Veritas, Tokyo, Japan) for
5 min on ice. After centrifugation at 19,100 × g for 10 min at 4°C,
the supernatant was collected. The supernatants were stored at
−80°C until the cytokine assay was performed.
Animals
The experimental design was approved by the
Institutional Review Board of Jichi Medical University, and all
animal procedures followed the Principles of Laboratory Animal
Care. Seven-week-old male CD2F1 (BALB/c x DBA/2 F1) mice were
purchased from Charles River Japan (Atsugi, Kanagawa, Japan).
Groups of four mice were housed in a cage placed in a
temperature-controlled (22°C) room with high efficacy particulate
arresting (HEPA; 0.3 μm) filtered air supply and were kept
under a 12-h light/12-h dark diurnal cycle. Prior to the
experiments, mice were fed ad libitum with standard Rodent
Laboratory Chow (Nippon Bio-Supply, Tokyo, Japan) so as to become
acclimated to experimental conditions. After allowing 1 week of
acclimation to the environment, 8-week-old mice were randomly
assigned to one of six different groups: i) mice bearing clone 5
subcutaneously in the right flank (C5 Cut), ii) mice bearing clone
5 in the left gastrocnemius muscle (C5 Mus), iii) mice bearing
clone 5 in the peritoneal cavity (C5 Per), iv) mice bearing clone 5
in the thoracic cavity (C5 Tho), v) non-tumor-bearing mice (NTB),
and vi) mice bearing clone 20 subcutaneously in the right flank
(C20 Cut). Body weight and consumption of food and water were
measured every day around 4 p.m.
Blood sampling and extirpation of tumors
and organs
Blood was collected from the right atrium of mice
under profound pentobarbital (60 μg/g BW) anesthesia at 14
days after tumor inoculation. The right gastrocnemius muscle and
epididymal fat pads were extirpated and weighed while wet.
Inoculated tumors were extirpated, and 10 mg of tumor was
homogenized in 300 μl of Procarta lysis buffer (Panomics)
with protease inhibitors and centrifuged at 19,100 × g for 10 min
at 4°C. Supernatant was stored at −80°C until the cytokine assay
was performed. For histological and immunohistochemical evaluation,
extirpated tumors were stored at −80°C until evaluation.
For assessment of blood cell count, 300 μl of
the obtained blood was treated with EDTA. Blood cells were counted
using a clinical auto-analyzer at a clinical laboratory institute
(Japan Pet Life Co., Ltd., Tokyo, Japan). Plasma was obtained from
blood treated with heparin. The serum was collected in MiniCollect
(Sekisui Chemical Co., Ltd., Tokyo, Japan). Blood samples were
centrifuged at 5,000 × g for 10 min at 20°C to separate plasma or
serum from blood cells. Plasma and serum were used for the
measurement of hormones via a clinical auto-analyzer at a clinical
laboratory institute (SRL, Inc., Tokyo, Japan). The serum was
stored at −80°C until the cytokine assay was performed.
Serum amyloid A (SAA) was measured by enzyme-linked
immunosorbent assay (ELISA) methods as described in a previous
report (17,18). A plastic 96-well microtiter plate
was coated with the monoclonal antibody diluted in PBS overnight at
37°C and then blocked with 1% bovine serum albumin (BSA) in PBS for
2 h at 37°C. The mouse serum, diluted more than 1:100 in BSA-PBS
containing 0.05% Tween-20, was added to the plates and allowed to
react for 2 h at 37°C. The plate was washed and then incubated with
a peroxidase-conjugated secondary antibody, clone BI-2, diluted in
1% BSA-PBS containing 0.05% Tween-20 for 1 h at 37°C. After a final
wash, color was developed in ortho-phenyldiamine and read at 490
nm.
Measurement of cytokine levels
Procarta Cytokine Assay kit (Panomics) was used for
cytokine determination. After incubation with antibody-conjugated
beads, detection antibodies and streptavidin-phycoerythrin
complexes, samples were assessed by a Luminex 100 instrument
(Bio-Rad, Hercules, CA, USA). The cytokines examined were as
follows: interleukin (IL)-1β, IL-6, IL-10, tumor necrosis factor
(TNF)-α, interferon (IFN)-γ, leukemia inhibitory factor (LIF),
granulocyte macrophage colony-stimulating factor (GM-CSF), monocyte
chemotactic protein (MCP)-1, macrophage inflammatory protein
(MIP)-1α and vascular endothelial growth factor A (VEGF-A). A
standard curve for sample cytokine concentration determination was
used. Cytokine concentrations in tumor homogenates were corrected
relative to protein concentrations measured by the Lowry protein
assay.
Real-time PCR
Expressions of spermidine/spermine N-1 acetyl
transferase (SSAT) in murine liver were evaluated by real-time PCR.
Total RNA was extracted from the homogenized liver tissues using
the Illustra RNAspin Mini RNA Isolation kit (GE Healthcare
Biosciences, Little Chalfont, UK), and the quality of RNA was
assessed using a Bioanalyzer 2100 (Agilent Technologies, Santa
Clara, CA, USA) according to the manufacturer’s instructions.
Single-stranded cDNA from total RNA was synthesized using a High
Capacity RNA-to-cDNA kit (Applied Biosystems, Carlsbad, CA,
USA).
The PCR reactions were performed on ABI PRISM 7900
HT sequence detection system (Applied Biosystems) in a total volume
of 50 μl, containing the appropriate amount of SYBR Premix
Ex Taq (Takara Bio, Inc., Otsu, Japan), cDNA template and each
primer. Thermal cycling conditions were: 95°C for 10 sec, followed
by 40 cycles of 95°C for 5 sec and 60°C for 34 sec. A melt curve
was generated after amplification, starting at 95°C for 15 sec,
followed by 60°C for 1 min and then 95°C for 15 sec. All reactions
were run in duplicate. The Sequence Detection System (SDS2.1)
software and the external standard curves were used for analysis.
Transcript levels of glyceraldehyde-3-phosphate dehydrogenase
(GAPDH) were utilized as an internal control. Primers used were as
follows: SSAT primers (Invitrogen, Carlsbad, CA, USA):
5′-ATCTAAGCCAGGTTGCAATGA-3′ (forward), 5′-GCACTCCTCACTCCTCTGTTG-3′
(reverse). GAPDH primers (Invitrogen): 5′-TGTGTCCGTCGTGGATCTGA-3′
(forward), 5′-TTGCTGTTGAAGTCGCAGGAG-3′ (reverse).
Western blotting
For the measurement of acetyl-CoA carboxylase (ACC),
30 mg of liver in 500 μl of lysis buffer [RIPA buffer; Cell
Signaling Technology, Beverly, MA, USA: 20 mM Tris-HCl (pH 7.5),
150 mM NaCl, 1 mM Na2EDTA, 1 mM ethylene glycol
tetraacetic acid, 1% nonyl phenoxypolyethoxylethanol-40, 1% sodium
deoxycholate, 2.5 mM sodium pyrophosphate, 1 mM β-glycerophosphate,
1 mM Na3VO4, 1 μg/ml leupeptin] with 1
mM phenylmethylsulfonyl fluoride (PMSF) was homogenized and then
sonicated three times for 10 sec on ice. After removing insoluble
material by centrifugation at 14,000 × g for 10 min, the total
amount of protein was quantified using the Bradford protein assay
(Bio-Rad Protein Assay kit; Bio-Rad). Equal amounts of total
protein were subjected to SDS-PAGE and then transferred to
polyvinylidene difluoride membrane (PVDF) (GE Healthcare
Bio-Sciences). The PVDF membrane was blocked with 5% skim milk in
Tris-buffered saline with 0.1% Tween-20 (TBS-T) for 3 h at room
temperature and then washed two times with TBS-T. The membrane was
incubated with anti-acetyl CoA carboxylase antibody (1:200; Cell
Signaling Technology) in TBS-T containing 5% BSA and with
anti-mouse β-actin antibody (1:3,000; Cell Signaling Technology) in
TBS-T containing 5% skim milk at 4°C overnight. The membrane was
subsequently rinsed three times and incubated with a horseradish
peroxidase (HRP)-conjugated secondary antibody (1:3,000; GE
Healthcare) in TBS-T containing 5% skim milk for 1 h and then
rinsed three times. Finally, protein bands were detected by
enhanced chemiluminescence (ECL Prime; GE Healthcare) and
quantified by densitometry using Image J software.
Malonyl-CoA measurement
Murine livers were weighed and homogenized with a
4-fold weight of 0.3 M H2SO4 for 10 min on
ice. The supernatants obtained by centrifugation at 10,000 × g for
10 min were adjusted to a pH 6.5 on ice using 1 M Tris 5% v/v.
The measurement of malonyl-CoA was performed as
described previously (malonyl-CoA:acetyl-CoA cycling procedures)
(19,20). Briefly, acetyl-CoA in tissue
extract was removed by 2 μl of citrate synthase with 100 mM
oxaloacetic acid, distilled water and cycling buffer [500 mM
Tris-HCl (pH 7.2) containing 100 mM
MgSO4-7H2O and 10 mM 2-mercaptoethanol].
Then, the cycling reaction was initiated by adding 50 mM malonate
with 10 mM ATP and 1.0 U of malonate decarboxylase followed by the
addition of 1.0 U of acetate kinase. Next, 2.5 M neutralized
hydroxylamine was added, and final concentrations of 10 mM ferric
chloride dissolved in 25 mM trichloroacetic acid and 1 M HCl were
added. The absorbance of the end product was measured using a
spectrophotometer (Ultraspect 3100 Pro, Amersham Biosciences,
Buckinghamshire, UK). A standard curve was created using purified
malonyl-coenzyme A (Sigma, St. Louis, MO, USA).
Histological and immunohistochemical
analysis
Tumor tissues were fixed in 10% formaldehyde and
dehydrated in ethanol and xylene, embedded in paraffin and then cut
into serial 3-μm sections. The sections were deparaffinized
in xylene, hydrated gradually through graded ethanol and then
transferred to PBS. One of the sections was stained with
hematoxylin and eosin (H&E), and histological evaluations were
conducted by two pathologists and their evaluations were then peer
reviewed.
For immunohistochemical analysis, the sections were
placed in a container with 10 mM sodium citrate buffer and 0.01%
EDTA and heated at 95°C for 30 min for antigenic retrieval. The
sections were treated with 1% hydrogen peroxide in methanol to
quench the endogenous peroxidase activity for 15 min followed by
blocking in 10% normal rabbit serum with 1% BSA in PBS for 2 h at
room temperature. The sections were incubated with rat monoclonal
anti-neutrophil antibody (1:100; NIMP-R14; Abcam, Cambridge, MA,
USA) or rat monoclonal anti-F4/80 antibody (1:100; BM8; Abcam)
overnight at 4°C in a humidified chamber. After being washed with
PBS, the slides were treated with rabbit anti-rat biotinylated
secondary antibodies (1:200; Vector Laboratories, Burlingame, CA,
USA), and then an ABC horseradish peroxidase reagent (Vectastain
Elite ABC kit; Vector Laboratories) for 30 min at room temperature.
Neutrophils and macrophages were visualized using the Peroxidase
Substrate kit (ImmPACT DAB; Vector Laboratories) after incubation
for 7 min. The sections were lightly counterstained with Mayer’s
hematoxylin. According to color sampling method (21), a quantitative assay for
immunohistochemistry was performed using Image J software. Six
fields were examined at ×40 magnification and analyzed.
Statistical analysis
Data are expressed as the mean ± standard deviation
(SD). All statistical analyses were performed using SPSS version
11.0 for Windows (SPSS, Inc., Chicago, IL, USA). Comparisons
between two groups of data were analyzed by the Mann-Whitney U
test. A correlation between two groups was assessed by the Pearson
correlation test. A forward selection stepwise multiple regression
model for BW loss and the loss of epididymal fat pad and
gastrocnemius muscle was developed using serum cytokines and
chemokines with or without hormones as variables. A P-value of
<0.05 was considered to indicate a significant difference.
Results
Body weight, food intake, and fat and
muscle tissue weight
Changes in BW, food and water intake, and fat and
muscle tissue weight on the 14th day after tumor inoculation and
total food intake after tumor inoculation are shown in Fig. 1. BW of mice bearing clone 20 in
subcutaneous tissues (C20 Cut) decreased starting at approximately
9 days after tumor inoculation and was 76.1% of those at the time
of tumor inoculation. Further, food and water intake significantly
decreased. The BW of C5 Cut mice did not decrease, and their amount
of food and water intake decreased only slightly. However, the BW
and food intake of C5 Mus mice, C5 Per mice, and C5 Tho mice
significantly decreased, albeit with intergroup variation (Fig. 1A and B).
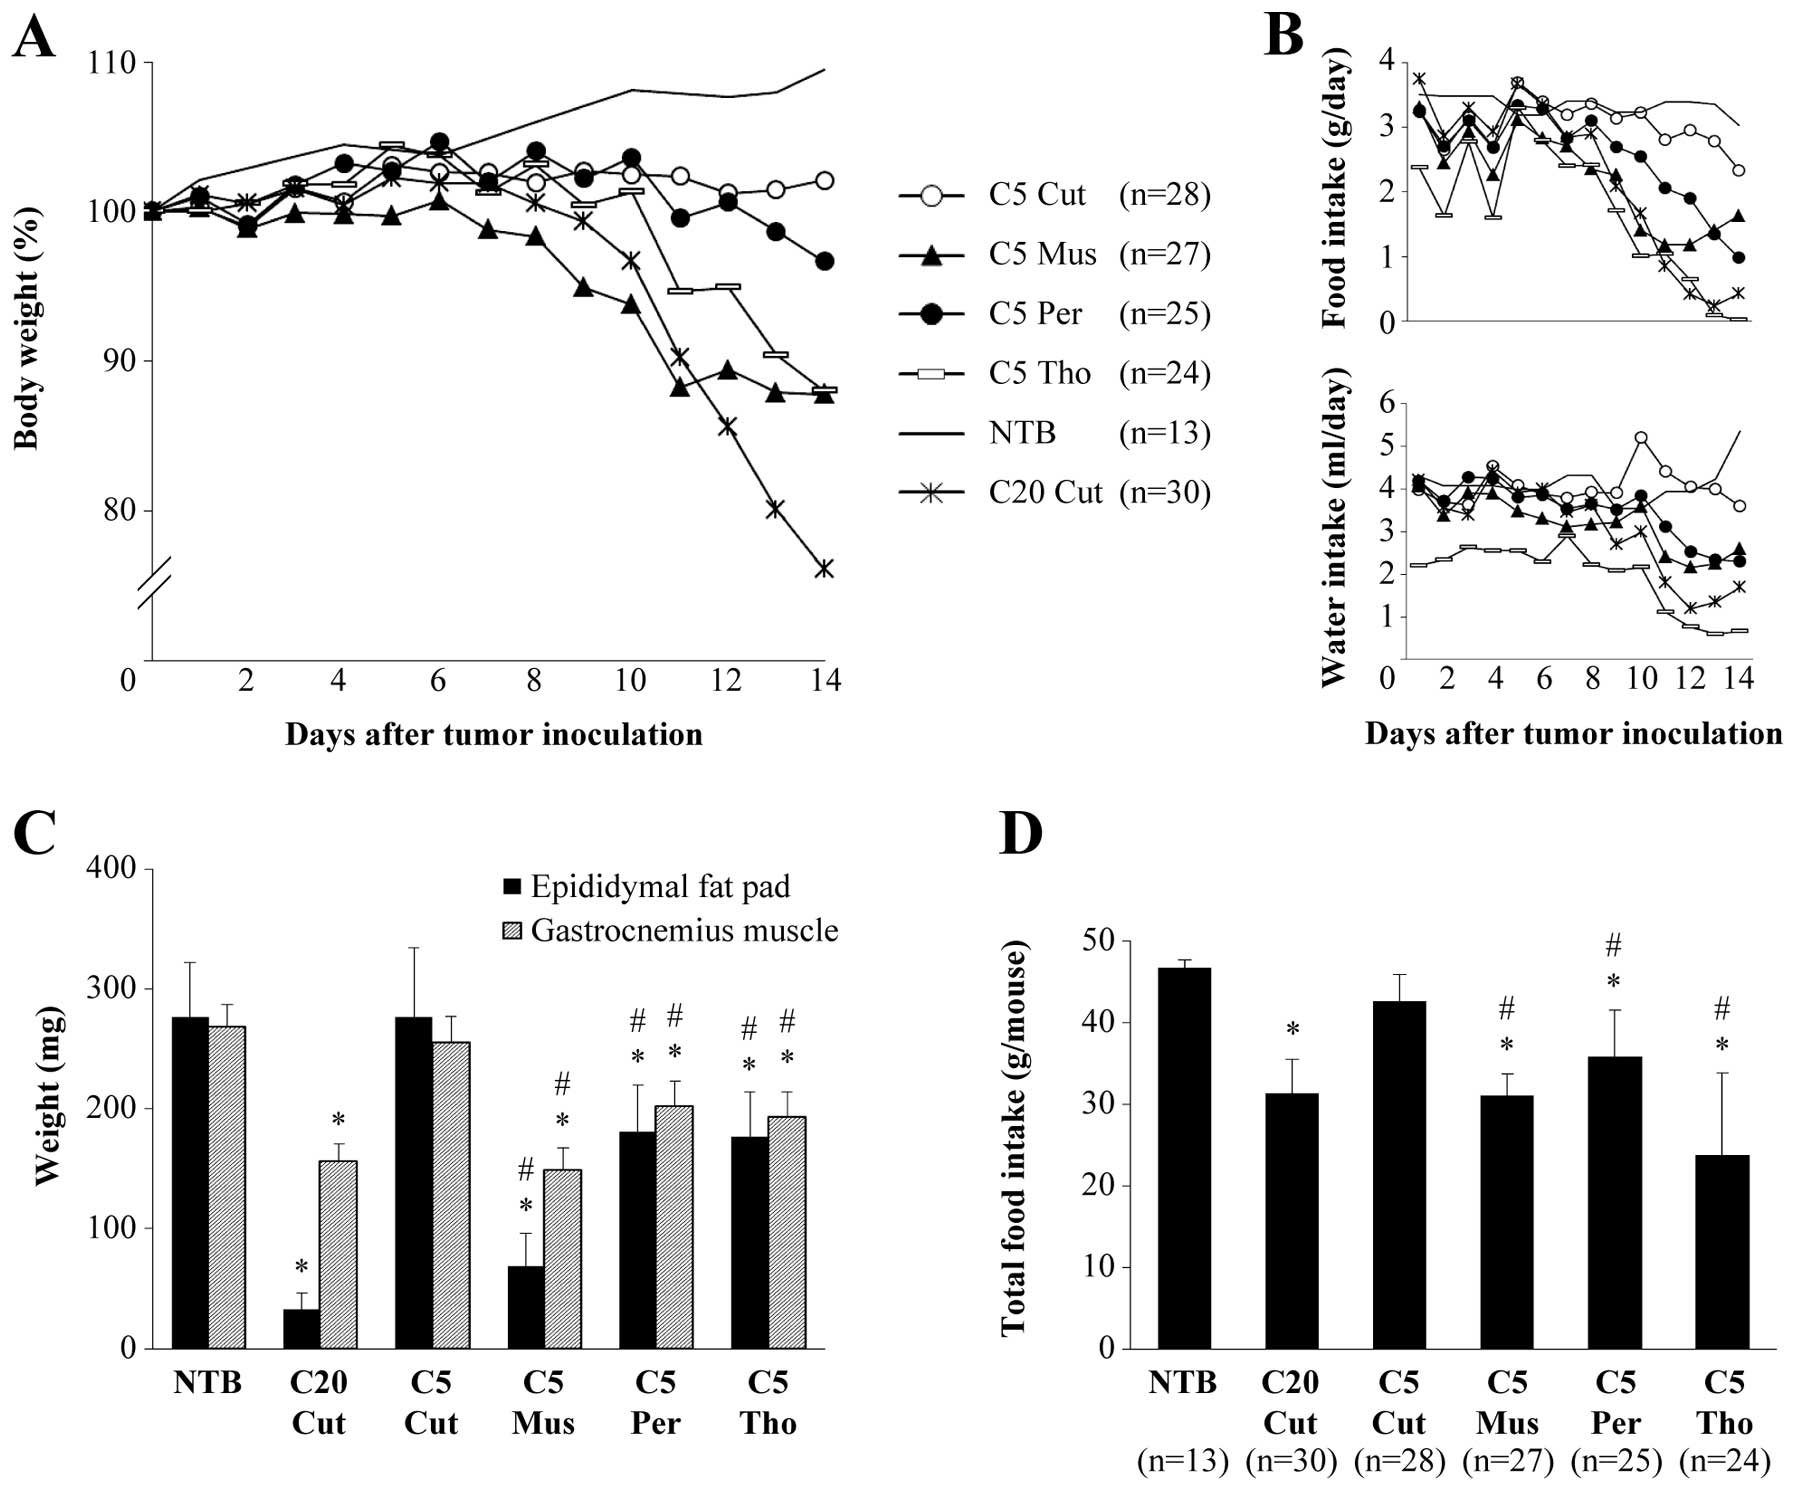 | Figure 1.Changes in body weight, food and
water intake, and weights of epididymal fat pad and gastrocnemius
muscle. (A) Change in body weight. The body weight of NTB and C5
Cut mice did not decrease. Body weight started to decrease around
the 9th day after tumor inoculation in C20 Cut, C5 Mus, C5 Per and
C5 Tho mice. (B) Change in food and water intake. Mice were housed
individually in closed metabolic cages, and food and water intake
were calculated daily by subtracting the residues from initial
amounts. (C) Weights of epididymal fat pad and gastrocnemius muscle
at the end of observation period (n=10). The epididymal fat pad and
gastrocnemius muscle were extirpated and weighed at 14 days after
tumor inoculation. (D) Total amount of food intake during the
observation period. Data represent the mean with bars indicating
SD. *Significantly lower than the corresponding value
for NTB at P<0.05. #Significantly lower than the
corresponding value for C5 Cut at P<0.05. C5 Cut, mice bearing
clone 5 tumor in subcutaneous tissue in the right flank; C5 Mus,
mice bearing clone 5 tumor in left gastrocnemius muscle; C5 Per,
mice bearing clone 5 tumor in peritoneal cavity; C5 Tho, mice
bearing clone 5 tumor in thoracic cavity; NTB, control mice bearing
no tumor; C20 Cut, mice bearing clone 20 tumor in subcutaneous
tissue in the right flank. |
At the end of the observation period, the weights of
fat and muscle tissues in C20 Cut were only 12 and 58.3%,
respectively, of those in NTB mice, while those in C5 Cut did not
decrease. Relative to NTB mice, the weights of the epididymal fat
pad and the gastrocnemius muscle were 28.7 and 55.4%, 64.1 and
71.9%, and 65.4 and 75.3% in C5 Mus, C5 Per and C5 Tho,
respectively. Among mice bearing the clone 5 tumor, the weights of
fat and muscle tissues were the lowest in C5 Mus; further, those in
C5 Mus, C5 Per and C5 Tho were significantly lower than those in C5
Cut (Fig. 1C).
Total amount of food intake in C20 Cut was
significantly lower than that of NTB. While the amount of food
intake did not decrease in C5 Cut, it did significantly decrease in
C5 Mus, C5 Per and C5 Tho (Fig.
1D). Although the decreased food intake was accompanied by a
decrease in fat and muscle tissue, changes in these variables did
not correlate with each other. Although the most prominent decrease
in food intake was found in C5 Tho, their fat and muscle tissues
were preserved to a greater degree than those of C5 Mus or C20
Cut.
We performed similar experiments using clone 20
cells. Clone 20 cells were inoculated either in muscle tissue,
peritoneal cavity, or thoracic cavity. All of these animals
suffered typical cancer cachexia of greater severity and died
earlier when compared with C20 Cut.
Blood analyses
When compared with NTB mice, the number of white
blood cells (WBC), including neutrophils, monocytes, and
lymphocytes, and platelets in the peripheral blood were increased
in tumor-bearing mice irrespective of the presence or the severity
of cachectic manifestations. No significant difference in
peripheral blood examination except for SAA was observed between
C20 Cut and C5 Cut. Among C5 groups of mice, the WBC count
correlated with the manifestations of cancer cachexia. SAA, an
acute phase reactant reflecting inflammation in the body,
significantly increased in C20 Cut, C5 Cut, and C5 Mus and increase
to a lesser degree in C5 Per and C5 Tho, despite the fact that
there was a significant increase in the WBC count in C5 Per and C5
Tho mice (Table I).
 | Table I.Peripheral blood examination. |
Table I.
Peripheral blood examination.
| WBC
(mm3) | Neutrophils
(mm3) | Monocytes
(mm3) | Lymphocytes
(mm3) | RBC
(×104/mm3) | Hb (g/dl) | Platelets
(×104/mm3) | SAA (mg/l) |
|---|
| NTB | 1,571±180 | 307±55 | 79±28 | 1,183±170 | 946±56 | 13.5±0.6 | 81±17 | 0.4±0.1 |
| C20 | 3,514±1229a | 1,033±554a | 182±93a | 2,299±617a | 931±34 | 13.0±0.4a | 163±36a |
463±142a,b |
| Cut | | | | | | | | |
| C5 | 3,542±315a | 861±114a | 305±15a | 2,497±323a | 915±35 | 13.2±0.5 | 131±25a | 256±178a |
| Cut | | | | | | | | |
| C5 |
4,928±430a,b | 1,015±158a | 262±67a,b |
3,644±420a,b | 905±39 | 12.6±0.5b | 182±10a,b |
576±104a,b |
| Mus | | | | | | | | |
| C5 |
4,628±844a,b |
1,171±191a,b | 191±75a |
3,258±795a,b | 899±18a | 13.1±0.2a | 104±18 | 64±59a,b |
| Per | | | | | | | | |
| C5 |
4,757±1429a,b |
1,290±492a,b | 206±79a |
3,261±722a,b |
1,061±108a,b |
15.2±1.4a,b | 108±7a | 28±37a,b |
| Tho | | | | | | | | |
Corticosterone levels increased in tumor-bearing
mice irrespective of the presence of cachectic manifestations.
However, levels of other hormones, such as serum insulin, plasma
glucagon, and plasma catecholamines, did not correlate with tumor
inoculation or the manifestations of cancer cachexia (Table II).
| Table II.The concentration of serum or plasma
hormones. |
Table II.
The concentration of serum or plasma
hormones.
| Serum (ng/ml)
| Plasma (pg/ml)
|
|---|
| Insulin | Corticosterone | ACTH | Glucagon | Adrenaline | Noradrenaline | Dopamine |
|---|
| NTB | 1.4 | 272.7 | 114 | 66 | 792 | 1,072 | 135 |
| C20 Cut | 1.3 | 589.7 | 88.3 | 66 | 699 | 506 | 57 |
| C5 Cut | 2.7 | 376.6 | 269 | 44 | 6,149 | 4,318 | 179 |
| C5 Mus | 2.0 | 344.8 | 267 | 50 | 2,272 | 1,411 | 80 |
| C5 Per | 0.7 | 436.2 | 205 | 47 | 1,933 | 2,699 | 262 |
| C5 Tho | 1.4 | 786.4 | 43.9 | 65 | 2,048 | 4,053 | 502 |
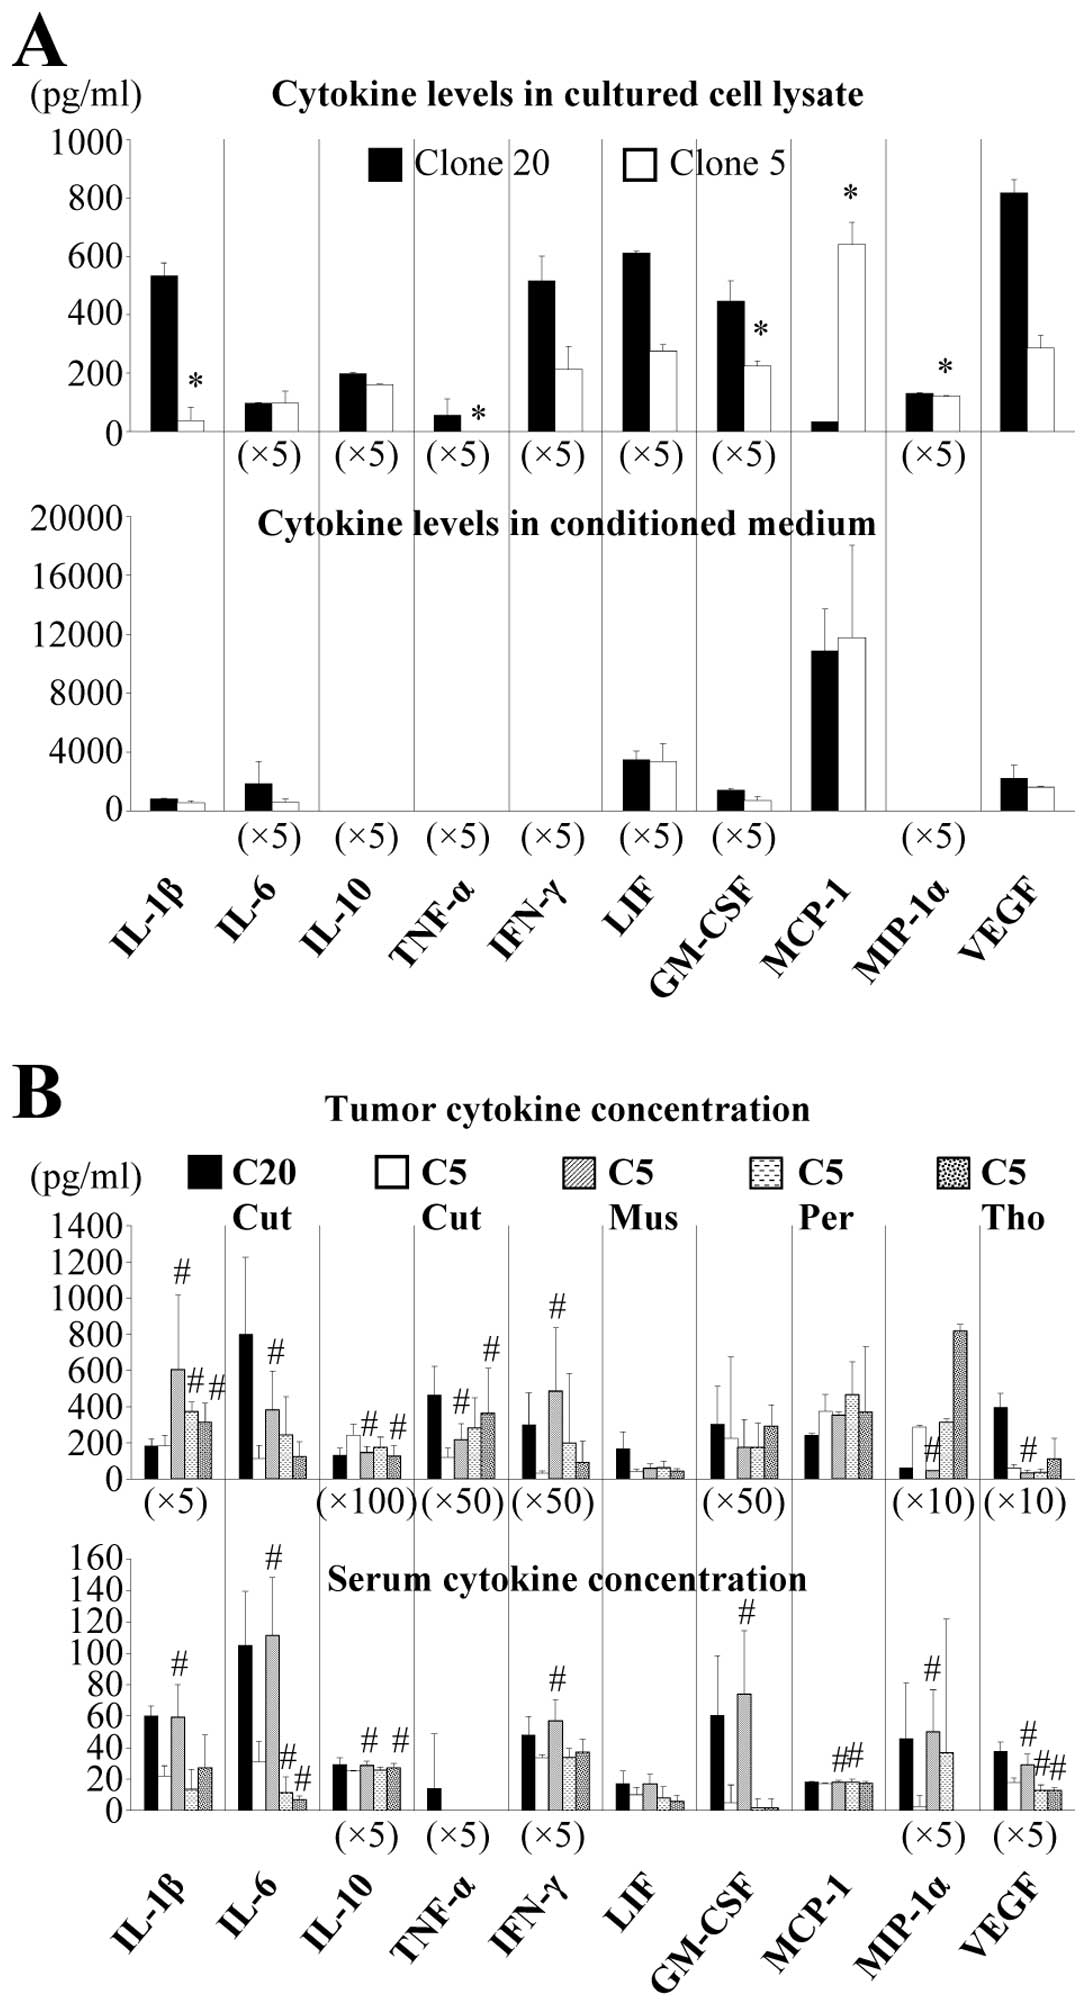
Cytokine levels
When comparing the levels of various cytokines and
chemokines in the conditioned medium, no significant difference was
found between clones 5 and 20, despite the fact that the ability of
these clones to induce cachexia was significantly different. In
cell lysate, levels of the majority of cytokines and chemokines
were higher in clone 20 cells than in clone 5 cells, while levels
of MCP-1 were lower in clone 20 than in clone 5 (Fig. 2A).
Types and concentrations of cytokines and chemokines
in the lysates of the inoculated tumor and in the serum of C5 Cut
and C20 Cut groups did not differ significantly when compared with
those in conditioned medium and culture cell lysate. Levels of
these substances tended to be lower in clone 5 Cut than in clone 20
Cut, except for MCP-1 and MIP-1α. Further, levels of IL-1β, IL-6,
TNF-α and IFN-γ were elevated in tumor lysates of C5 Mus, C5 Per,
and C5 Tho when compared with C5 Cut. Although serum IL-1β, IL-6,
IFN-γ, and GM-CSF were increased in C20 Cut and C5 Mus, no such
increases were found in C5 Per and C5 Tho (Fig. 2B).
In order to identify factors involved in the
induction of cancer cachexia, the mean serum levels of cytokine and
chemokines that affect BW and the weights of epididymal fat pad and
gastrocnemius muscle were assessed in a stepwise multiple
regression model using the forward selection method among the four
groups of mice bearing clone 5 (C5 Cut, C5 Mus, C5 Per and C5 Tho)
with NTB mice. Significant independent variables included IL-10
(R=−0.911, P=0.032) for BW; IL-10 (R=−0.849, P=0.004), MIP-1α
(R=−0.403, P=0.006), and IFN-γ (R=0.159, P=0.027) for the weight of
epididymal fat pad; and IL-10 (R=−0.701, P=0.004) and MCP-1
(R=−0.379, P=0.012) for the weight of gastrocnemius muscle. When
levels of hormones were added to the analysis, the results were the
same, except that dopamine (R=−0.044, P=0.011) was identified as a
significant independent variable for the weight of gastrocnemius
muscle.
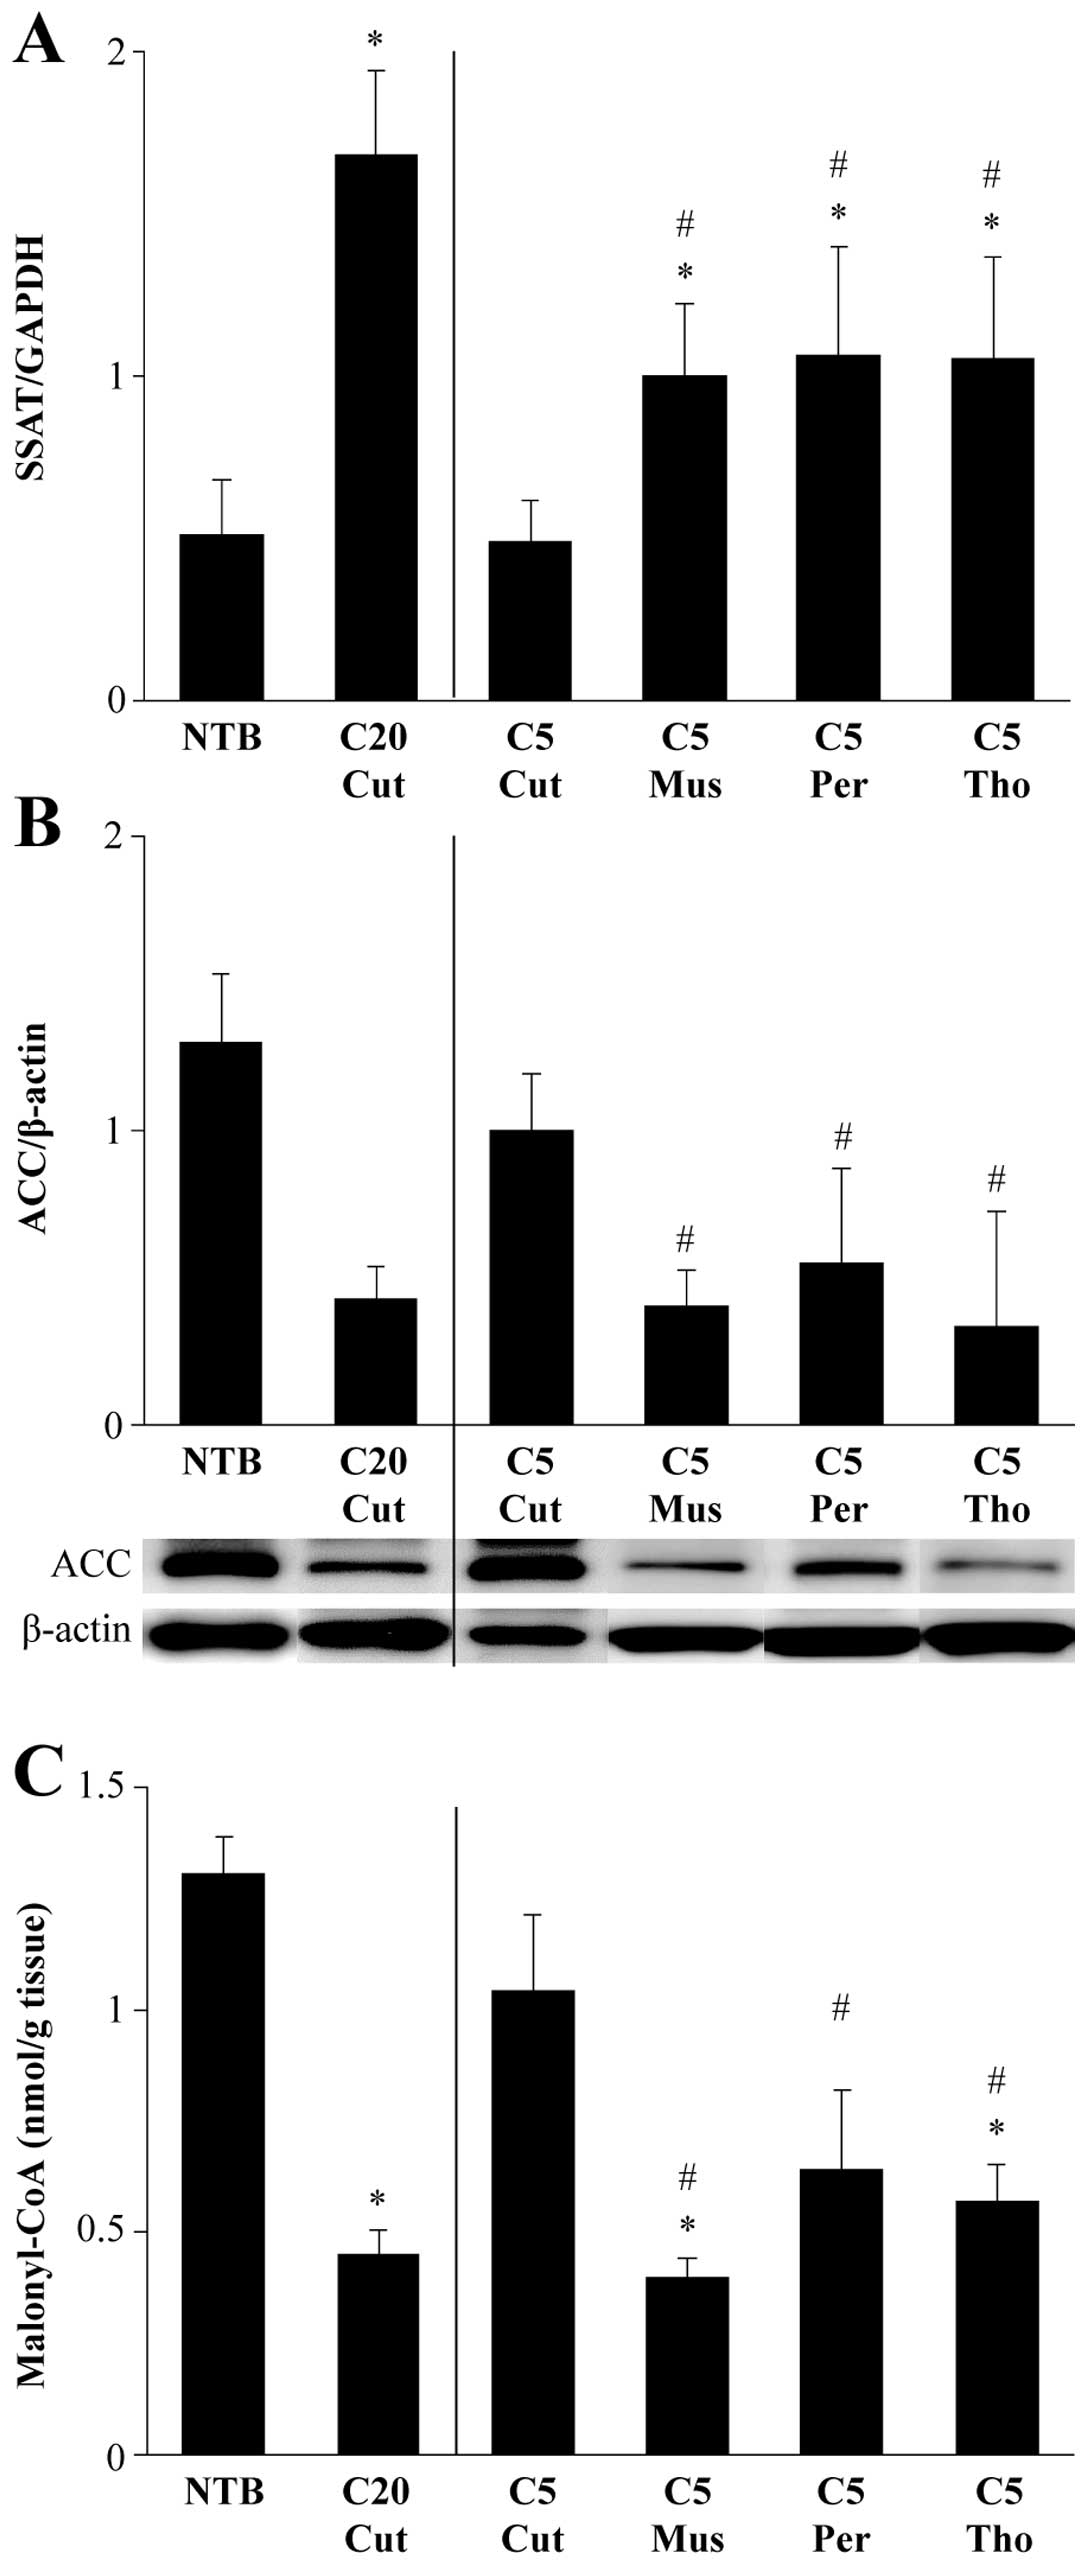
SSAT expression, acetyl-CoA carboxylase
levels, and malonyl-CoA levels
Levels of SSAT mRNA relative to GAPDH mRNA were
significantly increased in cachectic mice but not in the C5 Cut
group. SSAT mRNA levels were 3-fold higher in C20 Cut than in NTB,
and SSAT mRNA levels were 2-times higher in C5 Mus, C5 Per and C5
Tho than in NTB (Fig. 3A).
The amounts of ACC were corrected against β-actin.
Tumor inoculation resulted in a decrease in ACC levels irrespective
of the presence of cachectic manifestations. However, this decrease
was augmented when mice were suffering from cancer cachexia.
Relative to NTB groups, ACC levels were 33, 31, 43 and 26% in C20
Cut, C5 Mus, C5 Per and C5 Tho, respectively (Fig. 3B).
The amounts of hepatic malonyl-CoA were not
decreased in non-cachectic C5 Cut mice but they were significantly
decreased in C20 Cut mice (P=0.004 vs. NTB). Relative to NTB mice,
the amounts of hepatic malonyl-CoA concentrations in C5 Mus, C5
Per, and C5 Tho were 30.5, 49.2 and 43.5%, respectively, which were
significantly lower than that in C5 Cut mice (P=0.004 vs. C5 Mus;
P=0.010 vs. C5 Per; P=0.004 vs. C5 Tho) (Fig. 3C).
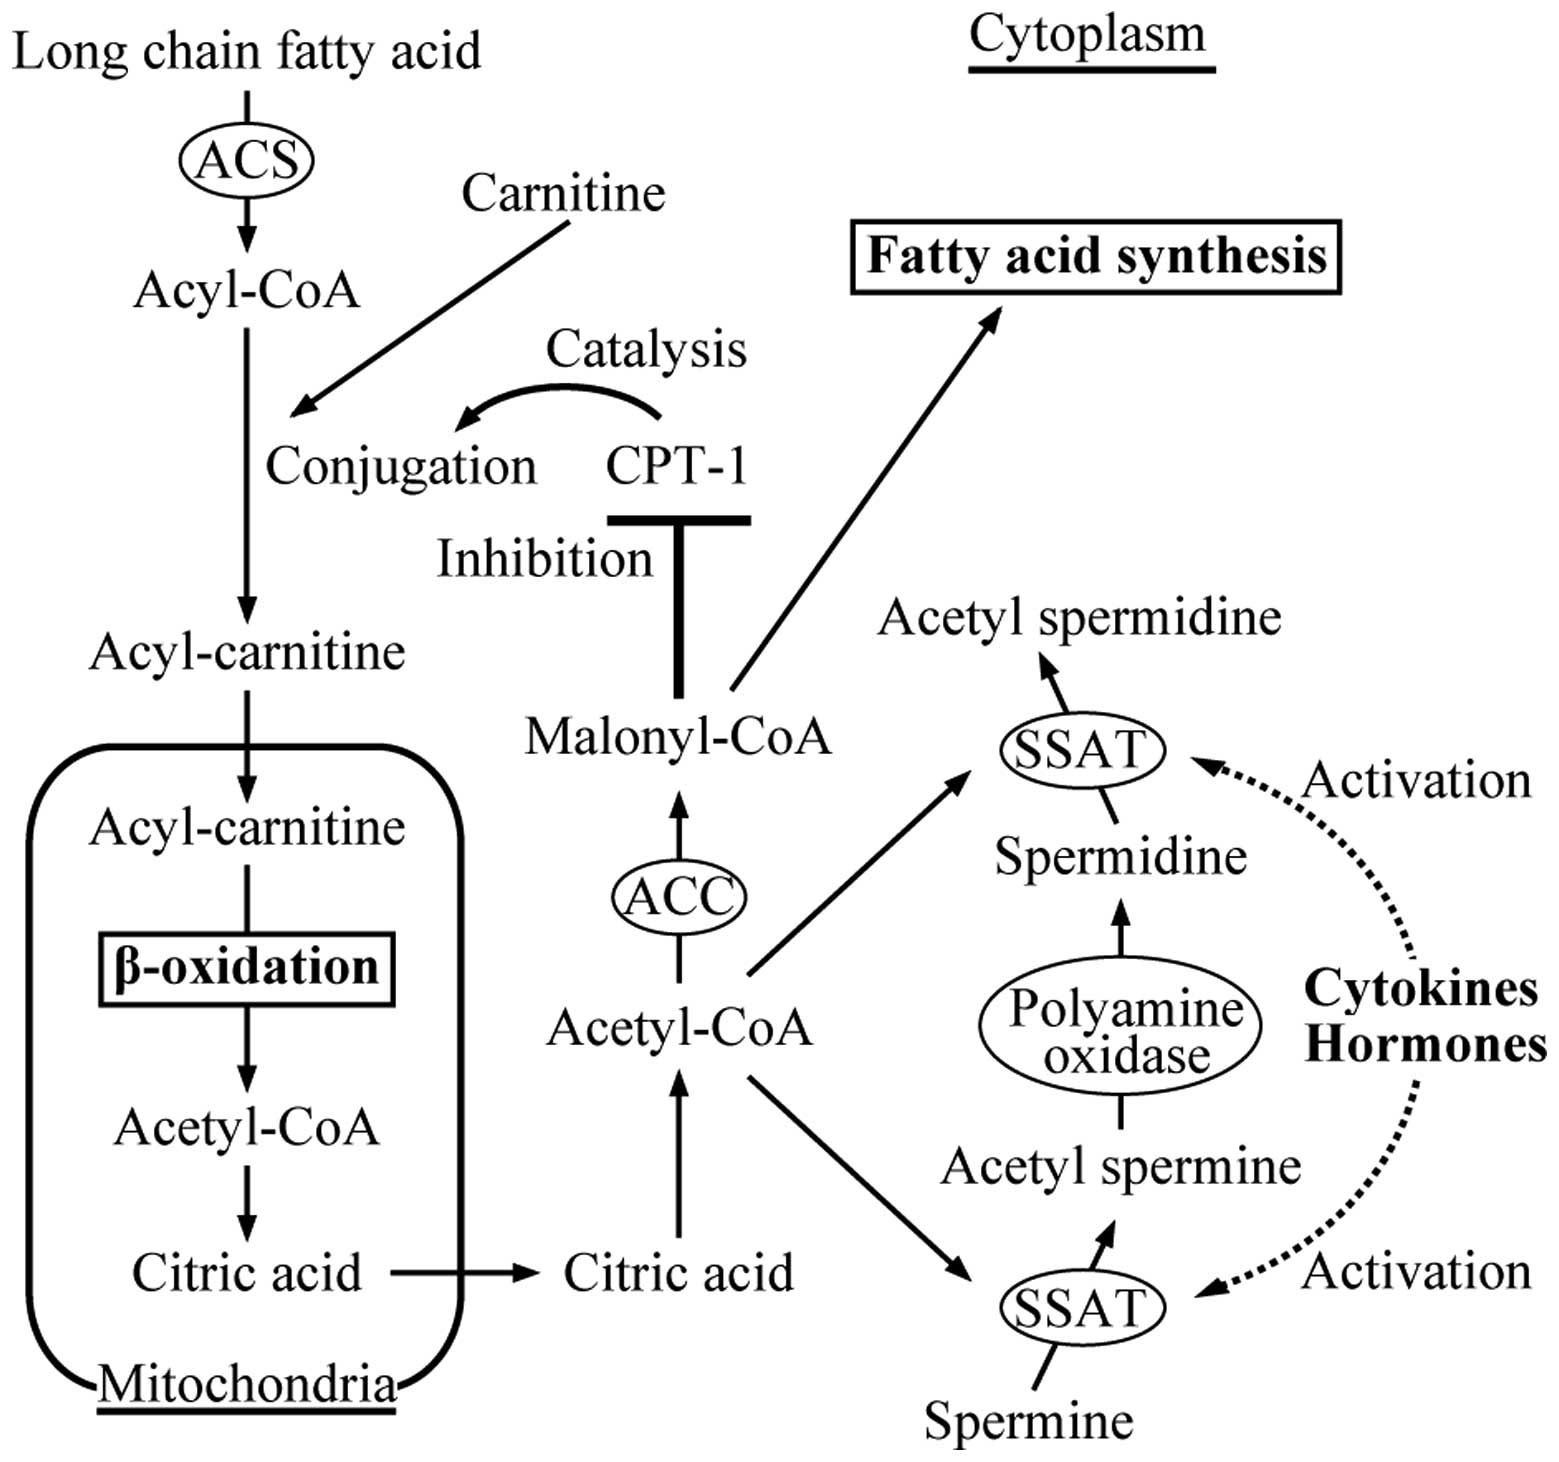
SSAT is activated by cytokines and hormones, and
SSAT activation and resultant decreases in malonyl-CoA
concentrations are involved in the mechanism of lipolysis, a
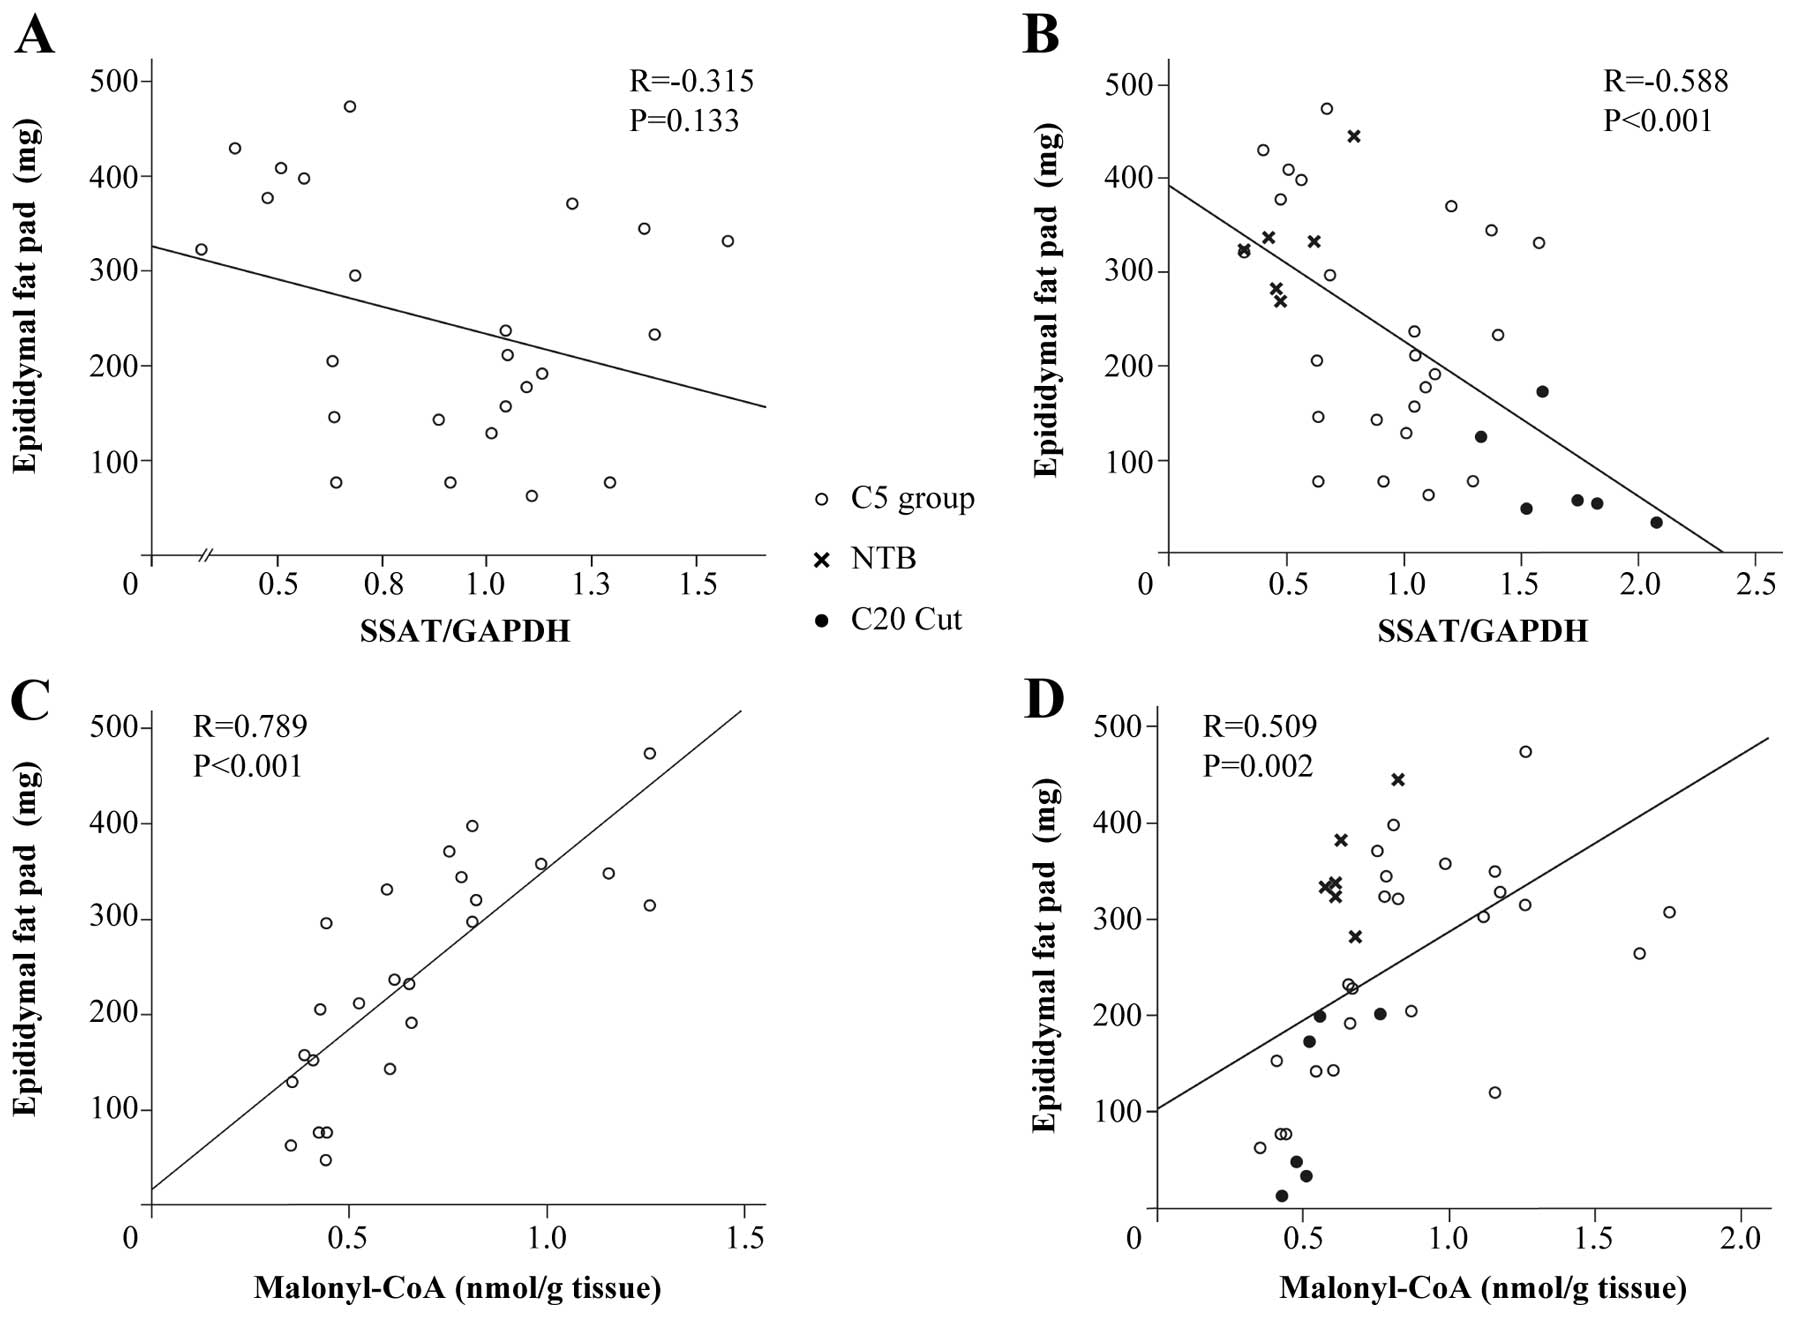
typical manifestation of cancer cachexia (Fig. 4). However, when comparing among
mice bearing the clone 5 tumor (C5 Cut, C5 Mus, C5 Per and C5 Tho)
with or without NTB, there was no correlation between SSAT/GAPDH
and the weight of epididymal fat pad (with NTB: R=−0.357, P=0.052,
n=30; without NTB: R=−0.315, P=0.133, n=24) (Fig. 5A). However, there was an inverse
correlation between SSAT/GAPDH and the weight of epididymal fat pad
when the C20 Cut group of mice was added to the analysis (R=−0.588,
P<0.001, n=36) (Fig. 5B). There
was a close positive correlation between malonyl-CoA levels and the
weight of epididymal fat pad in mice bearing clone 5 tumor, whether
or not the NTB group of mice was added to the analysis (NTB mice
included: R=0.415, P=0.022, n=30; NTB mice not included R=0.789,
P<0.001, n=24) (Fig. 5C).
Further, there was a close positive correlation between malonyl-CoA
levels and fat weights among all groups of animals (R=0.509,
P=0.002, n=36) (Fig. 5D).
Macroscopic, histological, and
immunohistochemical findings of transplanted tumors
In some animals in the C5 Tho and C5 Per groups,
tumor invasion to the heart and large vessels was observed.
However, such animals died at a very early stage and we excluded
mice from the study analysis when apparent tumor invasion to
important organs (e.g., lung, heart, major vessels, liver, kidney,
intestines) was found macroscopically. Generally, several lumps of
clone 5 tumor were found to be disseminated in the thoracic and
peritoneal cavities. Histological evaluation revealed no
significant difference in morphology when comparing tumors from
different C5 groups (C5 Cut, C5 Mus, C5 Per, and C5 Tho).
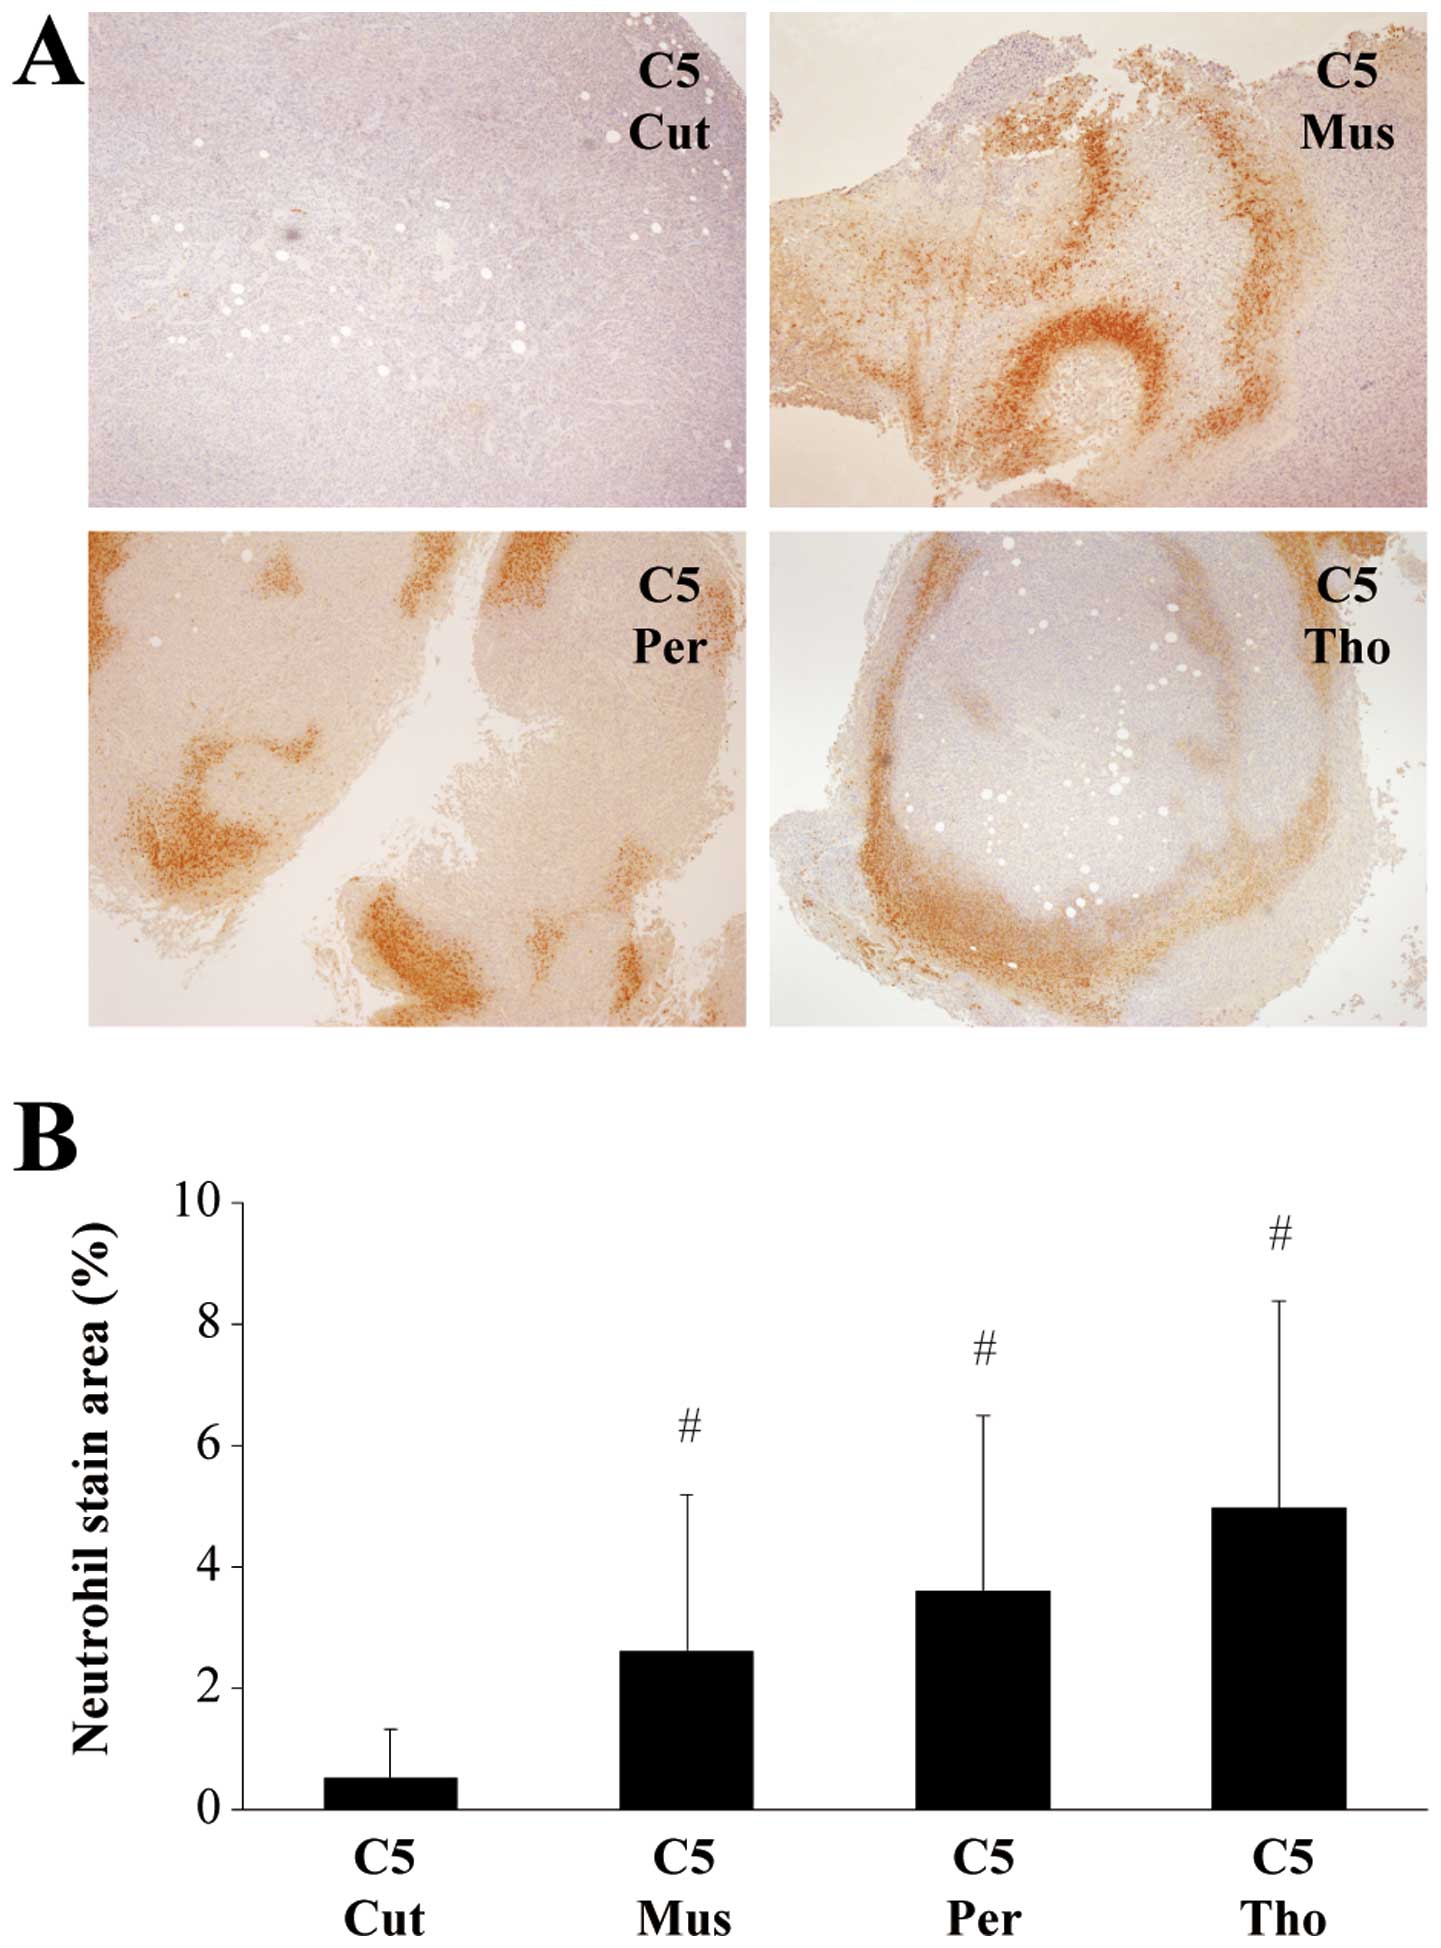
Immunohistochemical examination showed differences
in the amount of neutrophils, but not macrophages, among groups of
mice bearing the clone 5 tumor. Neutrophils in tumors of C5 Cut and
C20 Cut were not significant increased. However, a significantly
large amount of neutrophil infiltration was found in tumors of the
C5 Mus, C5 Per, and C5 Tho groups (Fig. 6).
Discussion
The present study showed that host factors are
important for the induction of cancer cachexia. Use of the clone 5
tumor, which was established from a single cell in colon 26
adenocarcinoma, obviates the effect of selection of a tumor cell
clone by the host’s immune system, thereby facilitating
experimental investigation of host factors in the present study.
Indeed, inoculation of the clone 5 tumor does not result in
inoculation site-dependent differences in the composition of cell
clones that can otherwise be seen in other animal models where
tumors were composed of many cell clones (13–15).
Levels of cytokines and chemokines in the inoculated
tumor and levels of cytokines and chemokines in murine serum levels
differ significantly depending on the inoculation site. Therefore,
manifestations observed in the present animal model can be
considered to be due mainly to a difference in the host reaction
against the tumor. In addition, because these mice did not have any
apparent immune or endocrine defects, the interactions between
tumor and host in the present study likely reflected those seen in
cancer patients. Indeed, the relationship between cachexia
manifestation and serum cytokine levels among C5 groups was similar
to that seen in human cancer cachexia, in which serum IL-10, but
not other pro-inflammatory cytokines, is correlated with the
manifestations of cancer cachexia (22–24).
In the present study, only IL-10, but not IL-1β, IL-6, or TNF-α,
had a negative correlation with BW and the weights of skeletal
muscle and storage fat, which contradicts findings from other
studies (9,10,25–27).
We could not elucidate a single factor or narrow
down a few factors, that play a pivotal role in the induction of
cancer cachexia and should therefore be targeted for the treatment
of cancer cachexia. However, malonyl-CoA seemed to be a good marker
of cancer cachexia, and its preservation might be a therapeutic
strategy for cancer cachexia, because the weight of storage fat in
mice correlated with the amount of malonyl-CoA in the liver.
Malonyl-CoA, converted from acetyl-CoA by ACC, is a substrate of
fatty acid synthesis (28). In
addition, malonyl-CoA controls the uptake of mitochondrial fatty
acid through allosteric inhibition of carnitine
palmitoyltransferase 1 (CPT-1), the enzyme catalyzing the first
committed step in mitochondrial fatty acid oxidation (29). Therefore, a decrease in malonyl-CoA
resulted in decreased fatty acid synthesis and accelerates
lipolysis via activation of CPT-1 and ketogenesis (30). The amount of malonyl-CoA is
controlled by several factors, such as the amount of its precursor
(acetyl-CoA) and the activities of ACC, malonyl-CoA decarboxylase,
and SSAT (19,31). SSAT overexpression provokes
symptoms similar to cachexia in animals (31), and several cytokines, hormones,
natural substances, and stress are known to stimulate SSAT
(32–37). The continuous SSAT activation leads
to an increased demand for acetyl-CoA (a co-factor of SSAT),
thereby restricting conversion of acetyl-CoA to malonyl-CoA.
However, among mice bearing the clone 5 tumor, SSAT mRNA levels did
not correlate with the severity of cachectic manifestations. These
observations suggest that some other factors that lead to a
decrease in malonyl CoA levels likely play a role in the induction
of cancer cachexia.
Recent clinical reports suggest that an increase in
neutrophils and neutrophil infiltration to the tumor are associated
with poor outcomes and an increasing severity of cachexia
manifestations (38–42). In animal models, although
circulating GM-CSF levels were not necessarily increased in
cachectic mice, an increase in peripheral blood WBC and neutrophils
correlated with cachectic manifestations of mice bearing the clone
5 tumor. The involvement of neutrophil is supported by
immunohistochemical findings, because neutrophil infiltration was
abundant in clone 5 tumors of mice suffering from cancer cachexia.
We previously demonstrated that the suppression of granulocyte
differentiation by the enhancement of erythrocyte production
results in an attenuation of the manifestations of cancer cachexia
(12). However, the grade of
neutrophil infiltration was not necessarily accompanied by a change
in SAA levels (as an indicator of systemic inflammation) or a
change in the serum levels of cytokines and chemokines. These must
be dependent on the specific environment of tissues and organs in
which the tumor grows.
In conclusion, the present study suggests that host
factors and host-tumor interactions are very important for the
induction of cancer cachexia. Further, liver malonyl-CoA likely
plays an important role in cancer cachexia. Finally, the animal
model used in the present study appears to be suitable for the
investigation of the mechanisms involved in cachexia of cancer
patients.
Acknowledgements
This study was supported by Ms. Tomomi
Kaku, Department of Clinical Laboratory Medicine, Jichi Medical
University, Tochigi, Japan, and technical experts of Veritas Corp.
in Tokyo, Japan.
References
|
1.
|
Madeddu C, Maccio A and Mantovani G:
Multitargeted treatment of cancer cachexia. Crit Rev Oncog.
17:305–314. 2012. View Article : Google Scholar : PubMed/NCBI
|
|
2.
|
Honors MA and Kinzig KP: Characterization
of the Yoshida sarcoma: a model of cancer cachexia. Support Care
Cancer. 21:2687–2694. 2013. View Article : Google Scholar : PubMed/NCBI
|
|
3.
|
Dewys WD, Begg C, Lavin PT, et al:
Prognostic effect of weight loss prior to chemotherapy in cancer
patients. Eastern Cooperative Oncology Group. Am J Med. 69:491–497.
1980. View Article : Google Scholar : PubMed/NCBI
|
|
4.
|
Tisdale MJ: Mechanisms of cancer cachexia.
Physiol Rev. 89:381–410. 2009. View Article : Google Scholar : PubMed/NCBI
|
|
5.
|
Fearon KC, Glass DJ and Guttridge DC:
Cancer cachexia: mediators, signaling, and metabolic pathways. Cell
Metab. 16:153–166. 2012. View Article : Google Scholar : PubMed/NCBI
|
|
6.
|
Tisdale MJ: Are tumoral factors
responsible for host tissue wasting in cancer cachexia? Future
Oncol. 6:503–513. 2010. View Article : Google Scholar : PubMed/NCBI
|
|
7.
|
Rebeca R, Bracht L, Noleto GR, et al:
Production of cachexia mediators by Walker 256 cells from ascitic
tumors. Cell Biochem Funct. 26:731–738. 2008. View Article : Google Scholar : PubMed/NCBI
|
|
8.
|
Tisdale MJ: Cachexia in cancer patients.
Nat Rev Cancer. 2:862–871. 2002. View
Article : Google Scholar
|
|
9.
|
Soda K, Kawakami M, Kashii A and Miyata M:
Characterization of mice bearing subclones of colon 26
adenocarcinoma disqualifies interleukin-6 as the sole inducer of
cachexia. Jpn J Cancer Res. 85:1124–1130. 1994. View Article : Google Scholar : PubMed/NCBI
|
|
10.
|
Soda K, Kawakami M, Kashii A and Miyata M:
Manifestations of cancer cachexia induced by colon 26
adenocarcinoma are not fully ascribable to interleukin-6. Int J
Cancer. 62:332–336. 1995. View Article : Google Scholar : PubMed/NCBI
|
|
11.
|
Soda K, Kawakami M, Takagi S, Kashii A and
Miyata M: Splenectomy before tumor inoculation prolongs the
survival time of cachectic mice. Cancer Immunol Immunother.
41:203–209. 1995. View Article : Google Scholar : PubMed/NCBI
|
|
12.
|
Kanzaki M, Soda K, Gin PT, Kai T, Konishi
F and Kawakami M: Erythropoietin attenuates cachectic events and
decreases production of interleukin-6, a cachexia-inducing
cytokine. Cytokine. 32:234–239. 2005. View Article : Google Scholar : PubMed/NCBI
|
|
13.
|
Matsumoto T, Fujimoto-Ouchi K, Tamura S,
Tanaka Y and Ishitsuka H: Tumour inoculation site-dependent
induction of cachexia in mice bearing colon 26 carcinoma. Br J
Cancer. 79:764–769. 1999. View Article : Google Scholar : PubMed/NCBI
|
|
14.
|
Giavazzi R, Campbell DE, Jessup JM, Cleary
K and Fidler IJ: Metastatic behavior of tumor cells isolated from
primary and metastatic human colorectal carcinomas implanted into
different sites in nude mice. Cancer Res. 46:1928–1933.
1986.PubMed/NCBI
|
|
15.
|
Morikawa K, Walker SM, Nakajima M, Pathak
S, Jessup JM and Fidler IJ: Influence of organ environment on the
growth, selection, and metastasis of human colon carcinoma cells in
nude mice. Cancer Res. 48:6863–6871. 1988.PubMed/NCBI
|
|
16.
|
Fujimoto-Ouchi K, Tamura S, Mori K, Tanaka
Y and Ishitsuka H: Establishment and characterization of
cachexia-inducing and -non-inducing clones of murine colon 26
carcinoma. Int J Cancer. 61:522–528. 1995. View Article : Google Scholar : PubMed/NCBI
|
|
17.
|
Tsuchiya H, Sato J, Tsuda H, et al: Serum
amyloid A upsurge precedes standard biomarkers of hepatotoxicity in
ritodrine-injected mice. Toxicology. 305:79–88. 2013. View Article : Google Scholar : PubMed/NCBI
|
|
18.
|
Yamada T, Fukuda T, Wada A and Itoh Y:
Monoclonal antibody-based sensitive enzyme-linked immunosorbent
assay for murine serum amyloid A. J Immunoassay. 20:223–235. 1999.
View Article : Google Scholar : PubMed/NCBI
|
|
19.
|
Celik A, Kano Y, Tsujinaka S, et al:
Decrease in malonyl-CoA and its background metabolic alterations in
murine model of cancer cachexia. Oncol Rep. 21:1105–1111.
2009.PubMed/NCBI
|
|
20.
|
Takamura Y, Kitayama Y, Arakawa A,
Yamanaka S, Tosaki M and Ogawa Y: Malonyl-CoA: acetyl-CoA cycling.
A new micromethod for determination of acyl-CoAs with malonate
decarboxylase. Biochim Biophys Acta. 834:1–7. 1985. View Article : Google Scholar : PubMed/NCBI
|
|
21.
|
Kaczmarek E, Górna A and Majewski P:
Techniques of image analysis for quantitative immunohistochemistry.
Rocz Akad Med Bialymst. 49(Suppl 1): 155–158. 2004.
|
|
22.
|
Ebrahimi B, Tucker SL, Li DH, Abbruzzese
JL and Kurzrock R: Cytokines in pancreatic carcinoma - correlation
with phenotypic characteristics and prognosis. Cancer.
101:2727–2736. 2004.PubMed/NCBI
|
|
23.
|
Shibata M, Nezu T, Takekawa M, et al:
Serum levels of inter-leukin-10 and interleukin-12 in patients with
colorectal cancer. Ann NY Acad Sci. 795:410–412. 1996. View Article : Google Scholar : PubMed/NCBI
|
|
24.
|
Lira FS, Rosa JC, Zanchi NE, et al:
Regulation of inflammation in the adipose tissue in cancer
cachexia: effect of exercise. Cell Biochem Funct. 27:71–75. 2009.
View Article : Google Scholar : PubMed/NCBI
|
|
25.
|
Strassmann G, Fong M, Kenney JS and Jacob
CO: Evidence for the involvement of interleukin 6 in experimental
cancer cachexia. J Clin Invest. 89:1681–1684. 1992. View Article : Google Scholar : PubMed/NCBI
|
|
26.
|
Greenberg AS, Nordan RP, McIntosh J, Calvo
JC, Scow RO and Jablons D: Interleukin 6 reduces lipoprotein lipase
activity in adipose tissue of mice in vivo and in 3T3-L1
adipocytes: a possible role for interleukin 6 in cancer cachexia.
Cancer Res. 52:4113–4116. 1992.PubMed/NCBI
|
|
27.
|
Johnen H, Lin S, Kuffner T, et al:
Tumor-induced anorexia and weight loss are mediated by the TGF-beta
superfamily cytokine MIC-1. Nat Med. 13:1333–1340. 2007. View Article : Google Scholar : PubMed/NCBI
|
|
28.
|
Harwood HJ: Treating the metabolic
syndrome: acetyl-CoA carboxylase inhibition. Expert Opin Ther
Targets. 9:267–281. 2005. View Article : Google Scholar : PubMed/NCBI
|
|
29.
|
McGarry JD and Brown NF: The mitochondrial
carnitine palmitoyltransferase system. From concept to molecular
analysis. Eur J Biochem. 244:1–14. 1997. View Article : Google Scholar : PubMed/NCBI
|
|
30.
|
Foster DW: The role of the carnitine
system in human metabolism. Ann NY Acad Sci. 1033:1–16. 2004.
View Article : Google Scholar : PubMed/NCBI
|
|
31.
|
Jell J, Merali S, Hensen ML, et al:
Genetically altered expression of spermidine/spermine
N1-acetyltransferase affects fat metabolism in mice via acetyl-CoA.
J Biol Chem. 282:8404–8413. 2007. View Article : Google Scholar : PubMed/NCBI
|
|
32.
|
Casero RA and Pegg AE: Spermidine/spermine
N1-acetyltransferase - the turning point in polyamine metabolism.
FASEB J. 7:653–661. 1993.PubMed/NCBI
|
|
33.
|
Desiderio MA, Pogliaghi G and Dansi P:
Regulation of spermi-dine/spermine N1-acetyltransferase expression
by cytokines and polyamines in human hepatocarcinoma cells (HepG2).
J Cell Physiol. 174:125–134. 1998. View Article : Google Scholar : PubMed/NCBI
|
|
34.
|
Green ML, Chung TE, Reed KL, et al:
Paracrine inducers of uterine endometrial spermidine/spermine
N1-acetyltransferase gene expression during early pregnancy in the
pig. Biol Reprod. 59:1251–1258. 1998. View Article : Google Scholar : PubMed/NCBI
|
|
35.
|
Rodriguez-Sallaberry C, Simmen FA and
Simmen RC: Polyamine- and insulin-like growth factor-I-mediated
proliferation of porcine uterine endometrial cells: a potential
role for spermidine/spermine N(1)-acetyltransferase during
periimplantation. Biol Reprod. 65:587–594. 2001. View Article : Google Scholar
|
|
36.
|
Huang YL and Taylor MW: Induction of
spermidine/spermine N1-acetyltransferase by interferon type I in
cells of hematopoietic origin. J Interferon Cytokine Res.
18:337–344. 1998. View Article : Google Scholar : PubMed/NCBI
|
|
37.
|
Babbar N, Hacker A, Huang Y and Casero RA:
Tumor necrosis factor alpha induces spermidine/spermine
N-1-acetyltransferase through nuclear factor kappa B in non-small
cell lung cancer cells. J Biol Chem. 281:24182–24192. 2006.
View Article : Google Scholar
|
|
38.
|
McMillan DC: Systemic inflammation,
nutritional status and survival in patients with cancer. Curr Opin
Clin Nutr Metab Care. 12:223–226. 2009. View Article : Google Scholar : PubMed/NCBI
|
|
39.
|
McMillan DC: The systemic
inflammation-based Glasgow Prognostic Score: a decade of experience
in patients with cancer. Cancer Treat Rev. 39:534–540. 2013.
View Article : Google Scholar : PubMed/NCBI
|
|
40.
|
Zahorec R: Ratio of neutrophil to
lymphocyte counts - rapid and simple parameter of systemic
inflammation and stress in critically ill. Bratisl Lek Listy.
102:5–14. 2001.PubMed/NCBI
|
|
41.
|
Donskov F: Immunomonitoring and prognostic
relevance of neutrophils in clinical trials. Semin Cancer Biol.
23:200–207. 2013. View Article : Google Scholar : PubMed/NCBI
|
|
42.
|
Dumitru CA, Moses K, Trellakis S, Lang S
and Brandau S: Neutrophils and granulocytic myeloid-derived
suppressor cells: immunophenotyping, cell biology and clinical
relevance in human oncology. Cancer Immunol Immunother.
61:1155–1167. 2012. View Article : Google Scholar : PubMed/NCBI
|