Introduction
Chordoma is a rare, low-malignant bone tumor. This
unique bone tumor has both epithelial and mesenchymal
characteristics (1). Chordomas
arise along the spine with hot spots at the upper (skull base
20–30%) and lower (sacro-coccygeal 50–60%) end, and are therefore
thought to originate from remnants of the notochord (2). Chordomas grow slowly. However, due to
their location, it is difficult to obtain wide-margin resection.
Frequently, these tumors recur after surgical treatment. Systemic
treatments are largely ineffective and new therapeutic approaches
are therefore needed. To date, no targeted therapeutic strategies
have been established for chordomas. Recently, however, a phase II
study showed a modest antitumor activity of lapatinib in chordoma
(3–6).
Chordoma characteristically occurs in adolescence
and is rarely found in children. Conventional and molecular
cytogenetic analyses revealed chromosomal gains of 7q and losses of
1p and 3p to be the most prominent alterations in chordoma
(7). In addition, loss of
heterozygosity (LOH) and genome-wide linkage studies have already
been successfully used to narrow down and define candidate regions
for chordoma development on 1p36.13 and 7q33 (8,9).
Some studies focused on gene expression analysis in chordoma.
Brachyury (T) was one of these candidates (reviewed in ref.
10), which was knocked down in
U-CH1, resulting in striking morphological changes in the tumor
cells (11). However, many
specific genes or altered transcripts have yet to be
determined.
This study comprises a genome-wide cytogenetic
analysis of 33 chordomas using comparative genomic hybridization
(CGH) and, in selected cases, additional transcript profiling by
microarray analysis. We linked these with RT-PCR,
immunohistochemistry and FACS analysis. We performed this
comprehensive study to determine those genes most differentially
expressed in chordoma and thus to establish which had the most
promise for translation into clinically useful targets.
Materials and methods
Samples
We examined 33 paraffin-embedded chordoma tumor
samples (for 7 of which snap-frozen tissue samples were also
available) obtained from 26 patients (8 male, 18 female; median age
at diagnosis: 66 years), 6 fresh-frozen, conventional
chondrosarcomas (6 patients; 4 male, 2 female; median age at
diagnosis: 54 years; 1 clivus, 3 femur, 2 pelvis; 3 grade 1, 3
grade 2) and pooled material of short-term cultures of 2 vertebral
discs (both male; age 47 and 63 years) from the files of the
Institute of Pathology, University Hospitals of Ulm, Germany,
Department of Orthopedics, University of Düsseldorf, Germany,
Department of Neuropathology, Ludwig-Maximilian University of
Munich, Munich, Germany, and Department of Neurosurgery, University
of Kiel, Kiel, Germany (Table
I).
 | Table I.Summary of selected clinical data,
histopathologic characteristics. |
Table I.
Summary of selected clinical data,
histopathologic characteristics.
| Case/sex/age/tumor
status | Localization | Follow-up
(Month) | P53 LI | Ki-67 PI | CD24 IR | Osteopontin IR | Osteonectin IR | Microarray
data | Real-time PCR |
|---|
| *1/M/46/R | Sacral | 6 | 3.1 | 13.4 | +++ | ++ | ++ | A/K | Y |
| *2/F/77/R | Sacral | 31
o Met | 3.3 | 5.5 | +++ | ND | ND | A/K | Y |
| *3/F/70/P | Sacral | 30 | 3.8 | 14.4 | +++ | + | ++ | K | Y |
| *3R/F/71/R | Sacral | 6 | 5.3 | 14.2 | + | + | ++ | ND | Y |
| 3R/U-CH2 | Sacral | | ND | ND | ++ | ND | ND | A/K | Y |
| *4/F/69/P | Sacral | 22
p Mets | ND | ND | ND | ND | ND | ND | ND |
| *4R/F/70/R | Sacral | 144 | 8.3 | 4.5 | ND | ++ | + | ND | ND |
| *5/F/46/P | Sacral | 72 | 4 | 5.5 | ND | + | ++ | ND | ND |
| *5R/F/52/R | Sacral | 12 | 2.3 | 2.1 | ND | + | ++ | ND | ND |
| *6/F/74/R | Sacral | 45
DOD | 8.3 | 4.5 | ++ | + | +++ | ND | Y |
| 7/M/68/P | Sacral | 47 | 1.7 | 4.9 | ND | + | +++ | ND | ND |
| 8/F/60/P | Sacral | 8
DOD | 6.3 | 2.6 | ND | + | ++ | ND | ND |
| 9/F/78/P | Sacral | 77
DOD | 1.9 | 1.6 | ND | ND | ND | ND | ND |
| 10/F/56/R | Sacral | 62
DOD | 10 | 4.6 | ND | + | + | ND | ND |
| 11/F/65/P | Sacral | 92
DOD | 2.4 | 5 | ND | ND | ND | ND | ND |
| 12/M/70/P | Sacral | 58
R | 4.4 | 2.6 | ND | +++ | ++ | ND | ND |
| 13/F/66/R | Sacral | 58
DOD | 7.9 | 3.3 | ND | ND | ND | ND | ND |
| 14/F/66/R | Sacral | 2M
DOD | ND | 7 | ND | ++ | - | ND | ND |
| 15//M/70/R | Sacral | 38 | 2.4 | 2.8 | ND | + | ND | ND | ND |
| 16/F/63/P | Sacral | 23 | ND | 6.1 | ND | + | - | ND | ND |
| 17/F/72/P | Sacral | 23 | 2.1 | 2.3 | ND | + | ++ | ND | ND |
| 17R1/F/73/R | Sacral/vaginal | | 4.4 | 31.5 | ND | +++ | +++ | ND | ND |
| 17R2/F73/Met |
Abdominal/perianal | | 2.4 | 8.6 | ND | ++ | ND | ND | ND |
| 18/M/65/R/Met |
Abdominal/sacral | 12 | 18.8 | 5.5 | ND | ++ | +++ | ND | ND |
| 19/F/17/P | Spinal | 36
DOD | 5.3 | 2.7 | ND | ++ | - | ND | ND |
| 20/M/78/P | Spinal | 36
R | 15 | 2.1 | ND | ND | ND | ND | ND |
| 21/F/63/R | Clivus | 13 | ND | ND | +++ | ND | ND | ND | Y |
| 22/M/52/R | Clivus | 52 | 5.7 | 10.7 | ND | + | ++ | ND | ND |
| 23/F/57/P | Clivus | 26 | ND | 2 | ND | + | + | ND | ND |
| 24/F/67/P | Clivus | 12 | 2.7 | 2.8 | ND | + | + | ND | ND |
| 24R/F/68/R | Clivus | | 31.3 | 12.3 | ND | + | ++ | ND | ND |
| *25/M/37/P | Clivus | 66 | 3.4 | 5.7 | ND | ND | ND | ND | ND |
| *26/F/58/P | Clivus | 108 | 14.2 | 3.2 | ND | ND | ND | ND | ND |
| 26R/F/67/R | Clivus | | 3.3 | 9.3 | ND | ++ | + | ND | ND |
The chordoma cell lines U-CH1 and U-CH2 were
established from sacral chordoma recurrences as described
previously (7,12). The chondrosarcoma cell line U-CS2
was established from a chondrosarcoma of the distal femur in a
48-year-old female patient, operated in 2002. One and two years
after primary diagnosis, the patient underwent surgery following
pulmonary metastasis of the primary grade 2 chondrosarcoma.
Immunohistochemistry and
fluorescence-activated cell sorter analysis (FACS)
Immunostaining was performed using a routine
indirect peroxidase method. The following antibodies were applied:
TP53 (Dako, Denmark), Ki-67 (Dako), and CD24 (clone 24C02, Dianova,
Hamburg, Germany). These antibodies were used at a final
concentration of 1–2 μg/ml. For immunohistochemical
detection of osteopontin and osteonectin, deparaffinized and
ethanol-dehydrated tissue sections were incubated overnight with
polyclonal rabbit antibodies to osteonectin (dilution 1:1,000) and
osteopontin (dilution 1:3,500) at room temperature. The antibodies
were kindly provided by L.W. Fisher, NIH, USA (13). Sections were then incubated with a
monoclonal mouse-anti-rabbit antibody (Dako, Glostrup, Denmark) for
30 min followed by signal detection using the Dako ChemMate APAAP
system and the Dako TechMate™ 500 plus automatic
stainer.
FACS analysis was performed according to protocols
described previously (14). The
following antibodies were applied: CD24 (clone 24C02), CD20 (clone
L26, Dako), EMA (clone E29, Dako) and rabbit anti-mouse
immunoglobulins (code no. F0313, Dako).
Cell culture and chromosome
preparation
We performed a short-term culture of vertebral
discs. The primary cells were seeded, cultured and subcultivated as
previously described (7).
Metaphase chromosome spreads were prepared from the cell lines and
from primary blood cell cultures of healthy donors (for CGH
experiments) using standard protocols (7). Cells were karyotyped using
conventional GTG-banding techniques according to the 1995 ISCN
nomenclature.
Comparative genomic hybridization (CGH)
and fluorescence in situ hybridization (FISH)
All seven chordoma samples were available as
paraffin-embedded tissue. In addition, seven tissue samples were
available as fresh-frozen samples. Histological evaluation of these
samples revealed an estimated tumor cell content of ≥90%. CGH
analysis was carried out according to the protocol previously
described in detail (7). Image
acquisition and processing were performed with the image analysis
system ISIS (MetaSystems, Altlussheim, Germany).
FISH was performed on imprint cytology slides and
5-μm sections of paraffin-embedded tumor material. The
commercially available combined probe m-bcr/abl with assignment to
9q34 (ABL locus) and 22q11.2 (BCR locus), and the
indirect labeled probes assigned to loci 7cen, 1p36 (all probes by
Q-Biogene, Illkirch Cedex, France), and the Her2/neu probe
(Zytomed, Germany) were applied. Additionally, we used the
following YAC clones obtained from the CEPH YAC library: 801_A_8
(3p14.2), 724_G_5 (RHEB, 7q36), 798_G_8 (8p12), 751_A_4
(MDM2, 12q14.3–q15), 984_D_2 (12q22–q24), 763_A_3 (22q12),
and 949_A_7 (Xp11.4) (7,15). FISH experiments were performed as
dual-color hybridization as previously described (7).
RNA preparation and gene expression
analyses
Fresh-frozen tissue and cell culture samples were
homogenized and total RNA was isolated using the RNeasy Mini kit
(Qiagen, Valencia, CA, USA) according to the manufacturer’s
instructions. Total RNA was quantitated by ultraviolet absorbance
at 260 and 280 nm and its integrity was assessed by means of
agarose gel electrophoresis.
Oligonucleotide array
Total RNA of two pooled vertebral discs, three
chordoma recurrences, and the novel chondrosarcoma cell line U-CS2,
grade 2, were subjected to gene expression analysis using the
high-density oligonucleotide array U133 set (Affymetrix, Santa
Clara, CA, USA), which contains a probe set for ∼33,000
well-substantiated human genes. Equal amounts (5 μg) of
total RNA of tumors and control samples were sent to the German
Resource Center (RZPD, Berlin, Germany). Labeling of total RNA,
testing of synthesized cDNA (IVT Ambion’s T7 Megascript kit,
Roche), of labeled probes, signal detection and data acquisition
was performed as described (16).
The Microarray Analysis Suite (MAS) 5.0 software (Affymetrix) was
used to calculate the gene expression levels. The Affymetrix Gene
Expression Assay has been shown to identify X-fold changes that are
>2 for 98% of the time. Based on the observations, robust
changes can be identified by selecting transcripts with a fold
change of >2 for increases and <2 for decreases, which
correspond to a signal log ratio of 1 and −1, respectively.
cDNA microarray analysis
Expression analysis of four chordomas (one primary
and three recurrences) and three chondrosarcomas (Table I), as well as pooled material of
short-term culture of vertebral disc as a reference, was performed
using a cDNA microarray containing 1,000 human genes involved in
hedgehog signaling and cancer (17). Hybridization experiments and signal
detection were performed as described above (17).
Image analysis, spot finding and data acquisition
were performed with the ImaGene 4.0 software package (BioDiscovery,
Los Angeles, CA, USA). Mean signal intensities for each spot were
corrected by subtracting the mean signal of local background.
Normalization was performed by equalizing the overall intensities
of both dyes. The resulting data were used to calculate the ratio
of gene expression in tumors versus vertebral disc.
Real-time reverse transcription
polymerase chain reaction (RT-PCR)
Total RNA of cases 1-3R, 6 and 20, U-CS2, six
chondrosarcomas, low-grade and vertebral disc was amplified using
the RiboAmp RNA amplification kit (Arcturus, Mountain View, CA,
USA) according to the manufacturer’s protocol. The RT-PCR reactions
were carried out in a final volume of 20 μl containing 25 ng
cDNA, 300–900 pmol of each primer (RARRES2 and KRT18 300/300 nM;
T1A and ECRG4 900/900 nM; T, IGFBP2 and CD24 300/300 nM), and 10
μl SYBR green PCR master mix (Applied Biosystems, UK) in a
thermocycler (iCycler, Bio-Rad, Germany). For PCR experiments,
reverse and forward primers were selected for the following genes:
T brachyury (mouse) homolog (T; Gene bank accession no.
NM_003181.2), CD24 antigen (CD24; Gene bank accession no.
NM_013230.2), insulin-like growth factor binding protein 2 (IGFBP2;
Gene bank accession no. NM_000597.2), retinoic acid receptor
responder 2 (RARRES2; Gene bank accession no. NM_002889.3),
esophageal cancer-related gene 4 protein (ECRG4; Gene bank
accession no. NM_032411.2), keratin 18 (KRT18; Gene bank accession
no. NM_000224.2), podoplanin/T1A-2 lung type-I cell
membrane-associated glycoprotein (PDPN/T1A2; Gene bank accession
no. NM_006474.4), and osteopontin (SSP1; Gene bank accession no.
NM_001040058.1). For all primer sets, hot start PCR was performed
with an initial denaturation step at 95°C for 5 min. This was
followed by 40 cycles at 95°C for 20 sec, 60°C for 20 sec and 72°C
for 20 sec. Final extension was carried out for 10 min at 72°C.
Vertebral disc was used as calibrator.
Results
Morphology and cytogenetics of U-CH2
U-CH2 was established from the first recurrence of a
chordoma in a 72-year-old woman, whose primary tumor had been
operated one year previously (case 3, Table I). Initially, U-CH2 had a doubling
time of about four weeks. After 11 passages, the cells maintained a
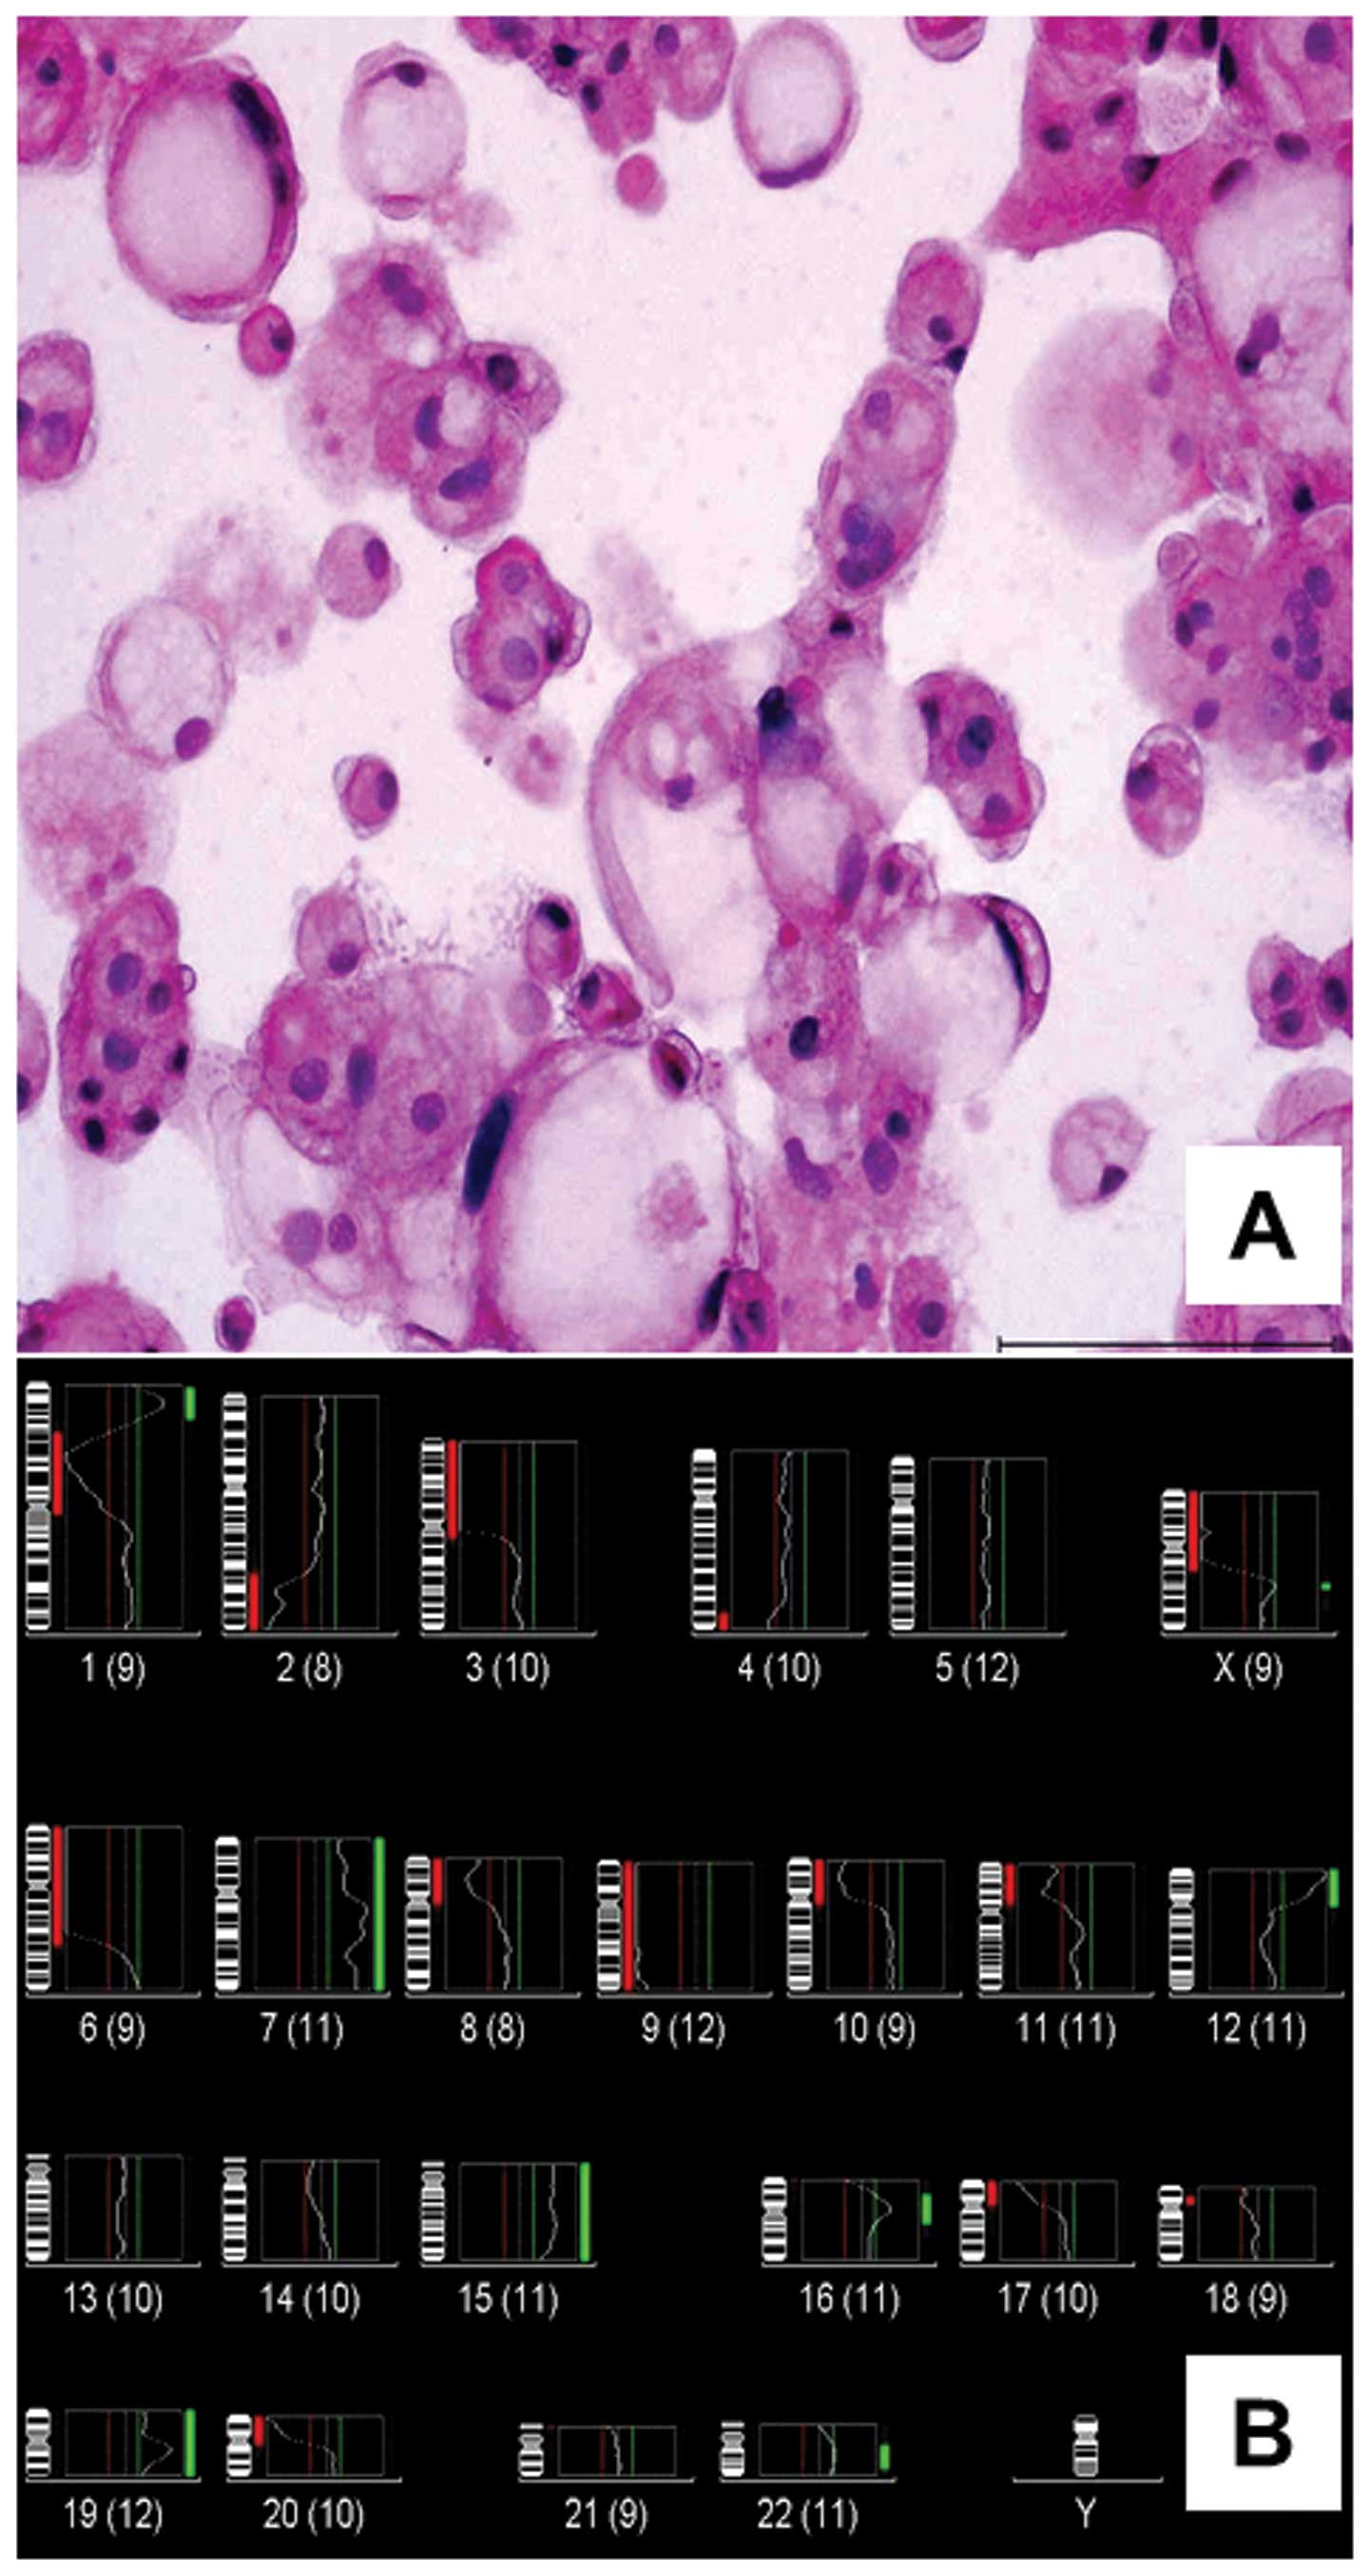
doubling time of approximately one week. Microscopically, U-CH2 is
comprised of typical physaliphorous cells (Fig. 1A). CGH of genomic DNA isolated from
U-CH2 (cell culture passage no. 2–3) revealed the rev ish
karyotype enh(1p34.2–p36.1,7,12p,15q,Xq),
dim(1p11–p31,2q32–q36,3p,4q34–q35,6p-q22,8p,9,10p,11p,17p,20p,Xp)
(Fig. 1B). Using M-FISH, 20 out of
38 metaphase spreads (cell culture passage nos. 2–3) could be
analyzed demonstrating the following clonal aberrations:
t(1;19),t(1;8),del(2)(q),del(4)(p),der(7),t(8;15),t(10;17),der(12)t(8;12),t(7;13),
t(14;?),der(16),t(20;22),der(X) t(X;18). Furthermore, we detected
non-identified double minutes.
Molecular cytogenetics in chordomas
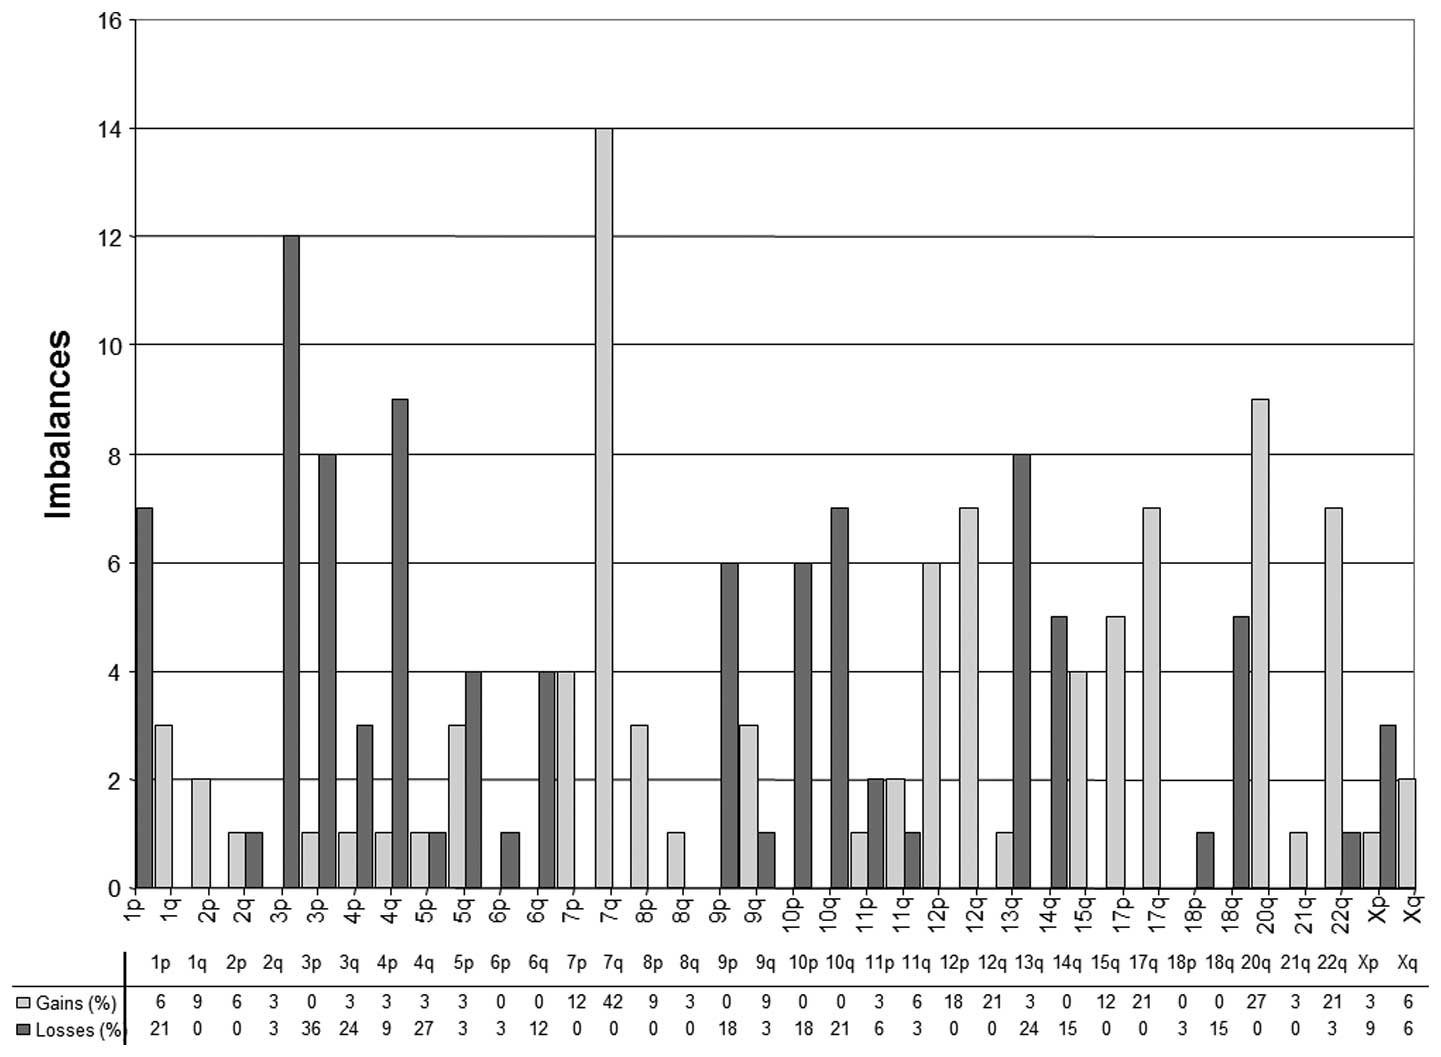
The CGH findings of 33 chordomas are shown in
Table II. Overall, we found 166
chromosomal aberrations (0–14 per tumor; median 4 per tumor) in 33
chordomas. On average, 4.1 losses and 4 gains were detected per
tumor. Chromosomal losses occurred most frequently at 1p (21%), 3p
(36%), 4q (27%), 10q (21%) and 13q (24%). DNA sequence copy number
gains were most prevalent at 7q (42%), 12q (21%), 17q (21%), 20q
(27%), and 22q (21%). The distribution of deletions, gains and the
total number of aberrations in tumors are shown in Table II and Fig. 2.
| Table II.Summary of CGH and FISH results. |
Table II.
Summary of CGH and FISH results.
| Case | FISH (Mean of
FISH-signals/nucleus) | Chromosomal
imbalances using CGH |
|---|
|
|---|
| Gains | Losses |
|---|
| *1 | 1p36:1.8; | 7qter: 4.7; | 7; 8p; 9q34;
12q24; 15q; 17, 20q | 1p21-p34; 3;
10; 11; 14q; 18; 22 |
| 3p14: 1.9; | 8p12: 3.8; | | |
| 6cen: 2.7; | 9cen: 2.7; | | |
| 7cen: 4.7; | 9q34: 3.6; | | |
| 7q34-35: 4.2; | 10cen: 1.4; | | |
| 7q36: 4.7; | 22q11: 2.0; | | |
| *2 | 7cen: NA; | 7qter: 2.7 | 7q36;
20 | 1p22-p31.3;
3p12-p21; 13q21-q32; 18q22-q23 |
| 7q34-q35: 2.5; | | | |
| *3 | 1p36: 3.1; | 7qter: 2.9; | 1p34.2-p36;
7p21-qter; 12p; 15q; 22q | 1p21-p31; 3p;
6q11-q21; 9p; Xp |
| 6cen: 1.6; | 9q34: 1.9; | | |
| 7cen: 2.8; | 22q11: 2.8 | | |
| *3R | 1p36: 3.4; | 7qTIM: 3.8; | amp1p34.2-p36;
7; 12p; 15q; 22q | 1p21-p31; 2q33-q36;
3p; 6q11-q21; 9p-q31; Xp |
| 7cen: 3.2; | 7q36: 3.9 | | |
| 7q34-q35: 3.9; | | | |
| *4 | 1p22: 2.1; | 7q34-q35: 3.0; | 7q22-qter;
12p | - |
| 7cen: NA; | 7q36: 3.3 | | |
| 7qTIM: 2.5; | | | |
| *4R | ND | | 7q22-qter | 3; 4; 5; 9p;
10 |
| *5 | 7cen: NA; | 7q36: 2.9 | 5q23-qter;
7; 12q24; 20 | 3; 4q35 |
| 7q34-q35: 2.5; | | | |
| *5R | 7cen: NA; | 9q34: 2.2; | 5q31-qter;
7q34-qter; 12q24; 20; 22q; | - |
| 7q34-q35: 2.5; | 22q11: 2.7 | Xq23-qter | |
| 7q36: 2.4; | | | |
| *6 | 1p22: 2.2; | 7q36: 4.1; | 1q; 3p;
4q12-q27; 5q; 7; 8pter-q21.1; 8q24; | - |
| 3p14: 4.2; | 8p12: 4.1; | 9q22-qter;
11pter-q22; 12; 13q22-qter; 15q; | |
| 7cen: NA; | 10cen: 2.3; | 17q; 21;
22 | |
| 7q34-q35: 4; | 22q12: 4.3 | | |
| 7qTIM: 4.5; | | | |
| 7 | ND | | 5q35; 7q36; 8q24;
9q34; 10q26; 11q25; 12q24; 20q; 22q12-qter; X | 4q24-q26; 5q15-q21;
6q11-q15; 13q21 |
| | 12q24;
20q;22q12-qter; X | |
| 8 | 1p36: 1.6; | 7qter: 2.8; | - | 1p13-p34;
3p11-p22; 10; 18q22-qter |
| 3p14.2: 1.2; | 8p22: 2.1; | | |
| 7q36: 2.2; | 10cen: 1.5 | | |
| 9 | 1p36: 2.7; | 8p22: 2.4; | 17;20q | 3p11-p23;
3q25-q26; 4q26-q28; 10p15; 10q11-q24 |
| 3p14.2: 1.4; | 9q24:1.9; | | |
| 7q36: 2.2; | 17qHer2neu:
2.5; | | |
| 7qter: 2.5; | 22q11: 2.2 | | |
| 10 | 7qter: 2.6; | | - | - |
| 8p22: 2.2 | | | |
| 11 | 7q36: 2.3; | 8p22:: 2.2 | - | - |
| 7qter: 2.4; | | | |
| 12 | 7q36: 2; | 8p22: 2.1 | - | - |
| 7qter: 2.8; | | | |
| 13 | 3p14.2: 1.8; | 12qMDM2: 2.1; | - | 4q32-qter;
13q14-q21 |
| 7q36: 2.3; | 12q22-q24: 2 | | |
| 8p22: 2.1; | | | |
| 14 | ND | ND | - | - |
| 15 | ND | ND | - | - |
| 16 | 1p36: 2; | 9q34: 2; | 7q34-q36;
17; 22q12-q13.1 | - |
| 3p14.2: 2.2; | 17qHer2neu:
2.8; | | |
| 7q36: 2.9; | 22q11: 2.1 | | |
| 8p22: 2; | | | |
| 17 | 7qter: 2.8; | Xp21.1: 2; | - | - |
| 8p22: 2; | Xp11.4: 2.2 | | |
| 17R1 | 3p14.2: 1.2; | 17qHer2neu:
2.8 | 2p24;2q37;
17p12-qter; 22q | 1p22-p31; 3;
4p13-p15; 5q13-q21; 9p13-pter; |
| 8p22: 2.1; | | | 10q21-qter;
11p11.2-p15.3; 14q12-q21; 18q |
| 17R2 | 3p14.2: 1.8; | 9q34: 2; | 17;
20q11-q13.2 | 18q23 |
| 7q36: 2.2; | 17qHer2neu:
2.7; | | |
| 8p22: 2.1; | 22q11: 2.2 | | |
| 18 | 3p14.2: 2; | 9q34: 3; | 1q11-q32; 9q34;
17q; 20q; 22q | 3p14.1-3q25;
4q11-q28; 6q14-q24; 13q; 14q |
| 7q36:2.4; | 17qHer2neu:
15; | | |
| 8p22:2.6; | 22q11: 4.4 | | |
| 19 | 7q36:2.2; | 12qMDM2: 2.1; | 4p16 | - |
| 7qter:2.3; | 12q22-q24:2 | | |
| 8p22: 2.1; | | | |
| 20 | 7q36: 2,2; | | - | - |
| 8p22:2.3 | | | |
| 21 | 7q36: 2.7; | 8p22: 2 | 7q36 | - |
| 7qter: 3.2; | | | |
| 22 | 3p14.2: 2; | 12qMDM2: 2.8; | 7q34-q36; 12p13;
12q13-q14;12q22-q24; 20q12-qter | 6p23; 6q31; 9p |
| 7qter: 2.8; | 12q22-q24:
3.9; | | |
| 8p22: 1.9; | Xp21.1: 1.1 | | |
| 23 | 7q33: 2.1; | 9q34: 2.1; | 1q11-q24;
1q32-qter; 5p15; 7q35-q36; 8p; 12p | 3; 10; 14q |
| 7q36: 2.6; | 12q22-q24:
2.3; | | |
| 8q24: 2.7; | 22q11: 2.2 | | |
| 24 | ND | ND | - | 4q21; 13q21 |
| 24R | ND | ND | 4q11-q32;
13q21-q22 | 7q36;12q23-q24;
20q |
| *25 | 1p22: 2.4; | 7q36: 2.4; | 12q24 | 13q21-q31;
Xq25-Xqter |
| 7cen: NA; | 9q34: 1.9; | | |
| 7q34-q35: 2.3; | 22q11: 2.1 | | |
| *26 | 9q34: 2.7; | 22q11: 2.8 | 1q; 11q24-q25 | 1p; 3; 4; 9p; 10;
13q; 14q; X |
| 26R | 7q36: 2.7; | 8p22: 2.5 | - | - |
| 7qter: 2.9; | | | |
FISH was performed on 27 samples. In 6 cases (nos.
4R, 7, 14, 15, 24 and 24R) only limited amounts of material were
available and thus FISH was not performed. The FISH loci were
selected according to the results of CGH. However, FISH analysis
revealed no further chromosomal aberrations and confirmed the CGH
data (Table II). Most chordomas
were nearly diploid, with four exceptions (nos. 1, 18, 26 and 26R).
Those tumors were nearly triploid.
Using dual color FISH analysis, we found a
high-level DNA amplification of Her2/neu (on average 15
signals per cell) in case 18. All nuclei demonstrated >10
signals per nucleus. Interestingly, this case was an abdominal
metastasis of a sacral chordoma 9 years after primary diagnosis.
The tumor recurred twice during the following 7 months. We checked
four further samples with a gain of chromosome 17 (nos. 9, 16, 17R1
and 17R2), but they did not reveal further amplifications of
Her2/neu.
Analysis of gene transcript expression in
chordoma
Firstly, we compared the transcriptional profile of
∼33,000 genes in three sacral chordoma recurrences, including the
chordoma cell lines (U-CH1 and U-CH2) and the novel chondrosarcoma
cell line, U-CS2, with vertebral disc using Affymetrix Human Genome
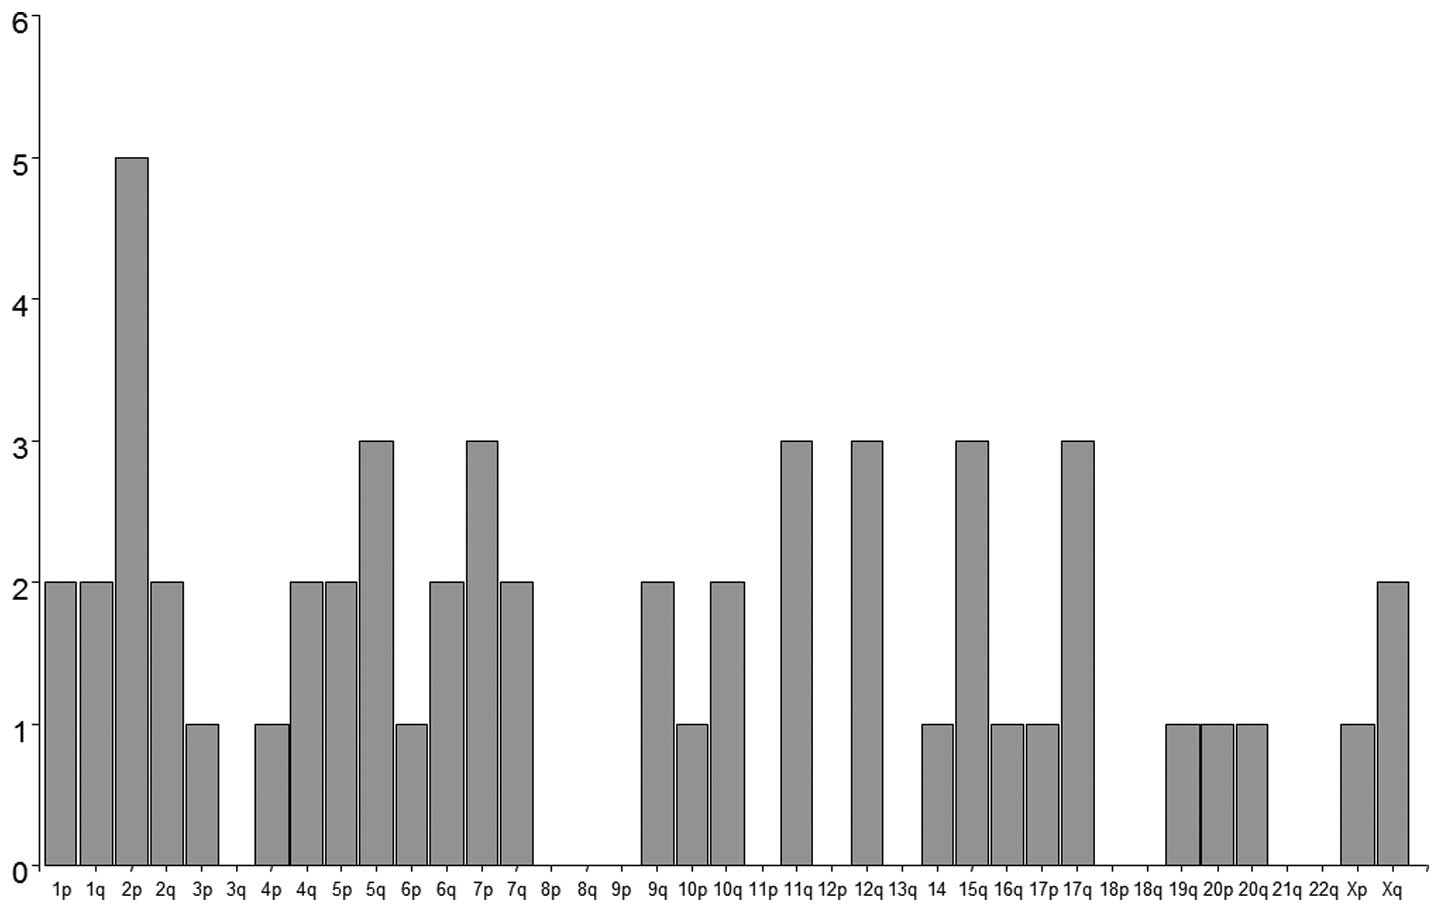
U133 set GeneChips. We identified 65 genes with distinct mRNA
levels (p<0.001; ≥6-fold change) of chordoma compared to the
control samples (vertebral disc) (Table III and Fig. 3). The genes were most frequently
located on chromosome 2 (7/65), 5 (5/65), 1 and 7 (each 4/65)
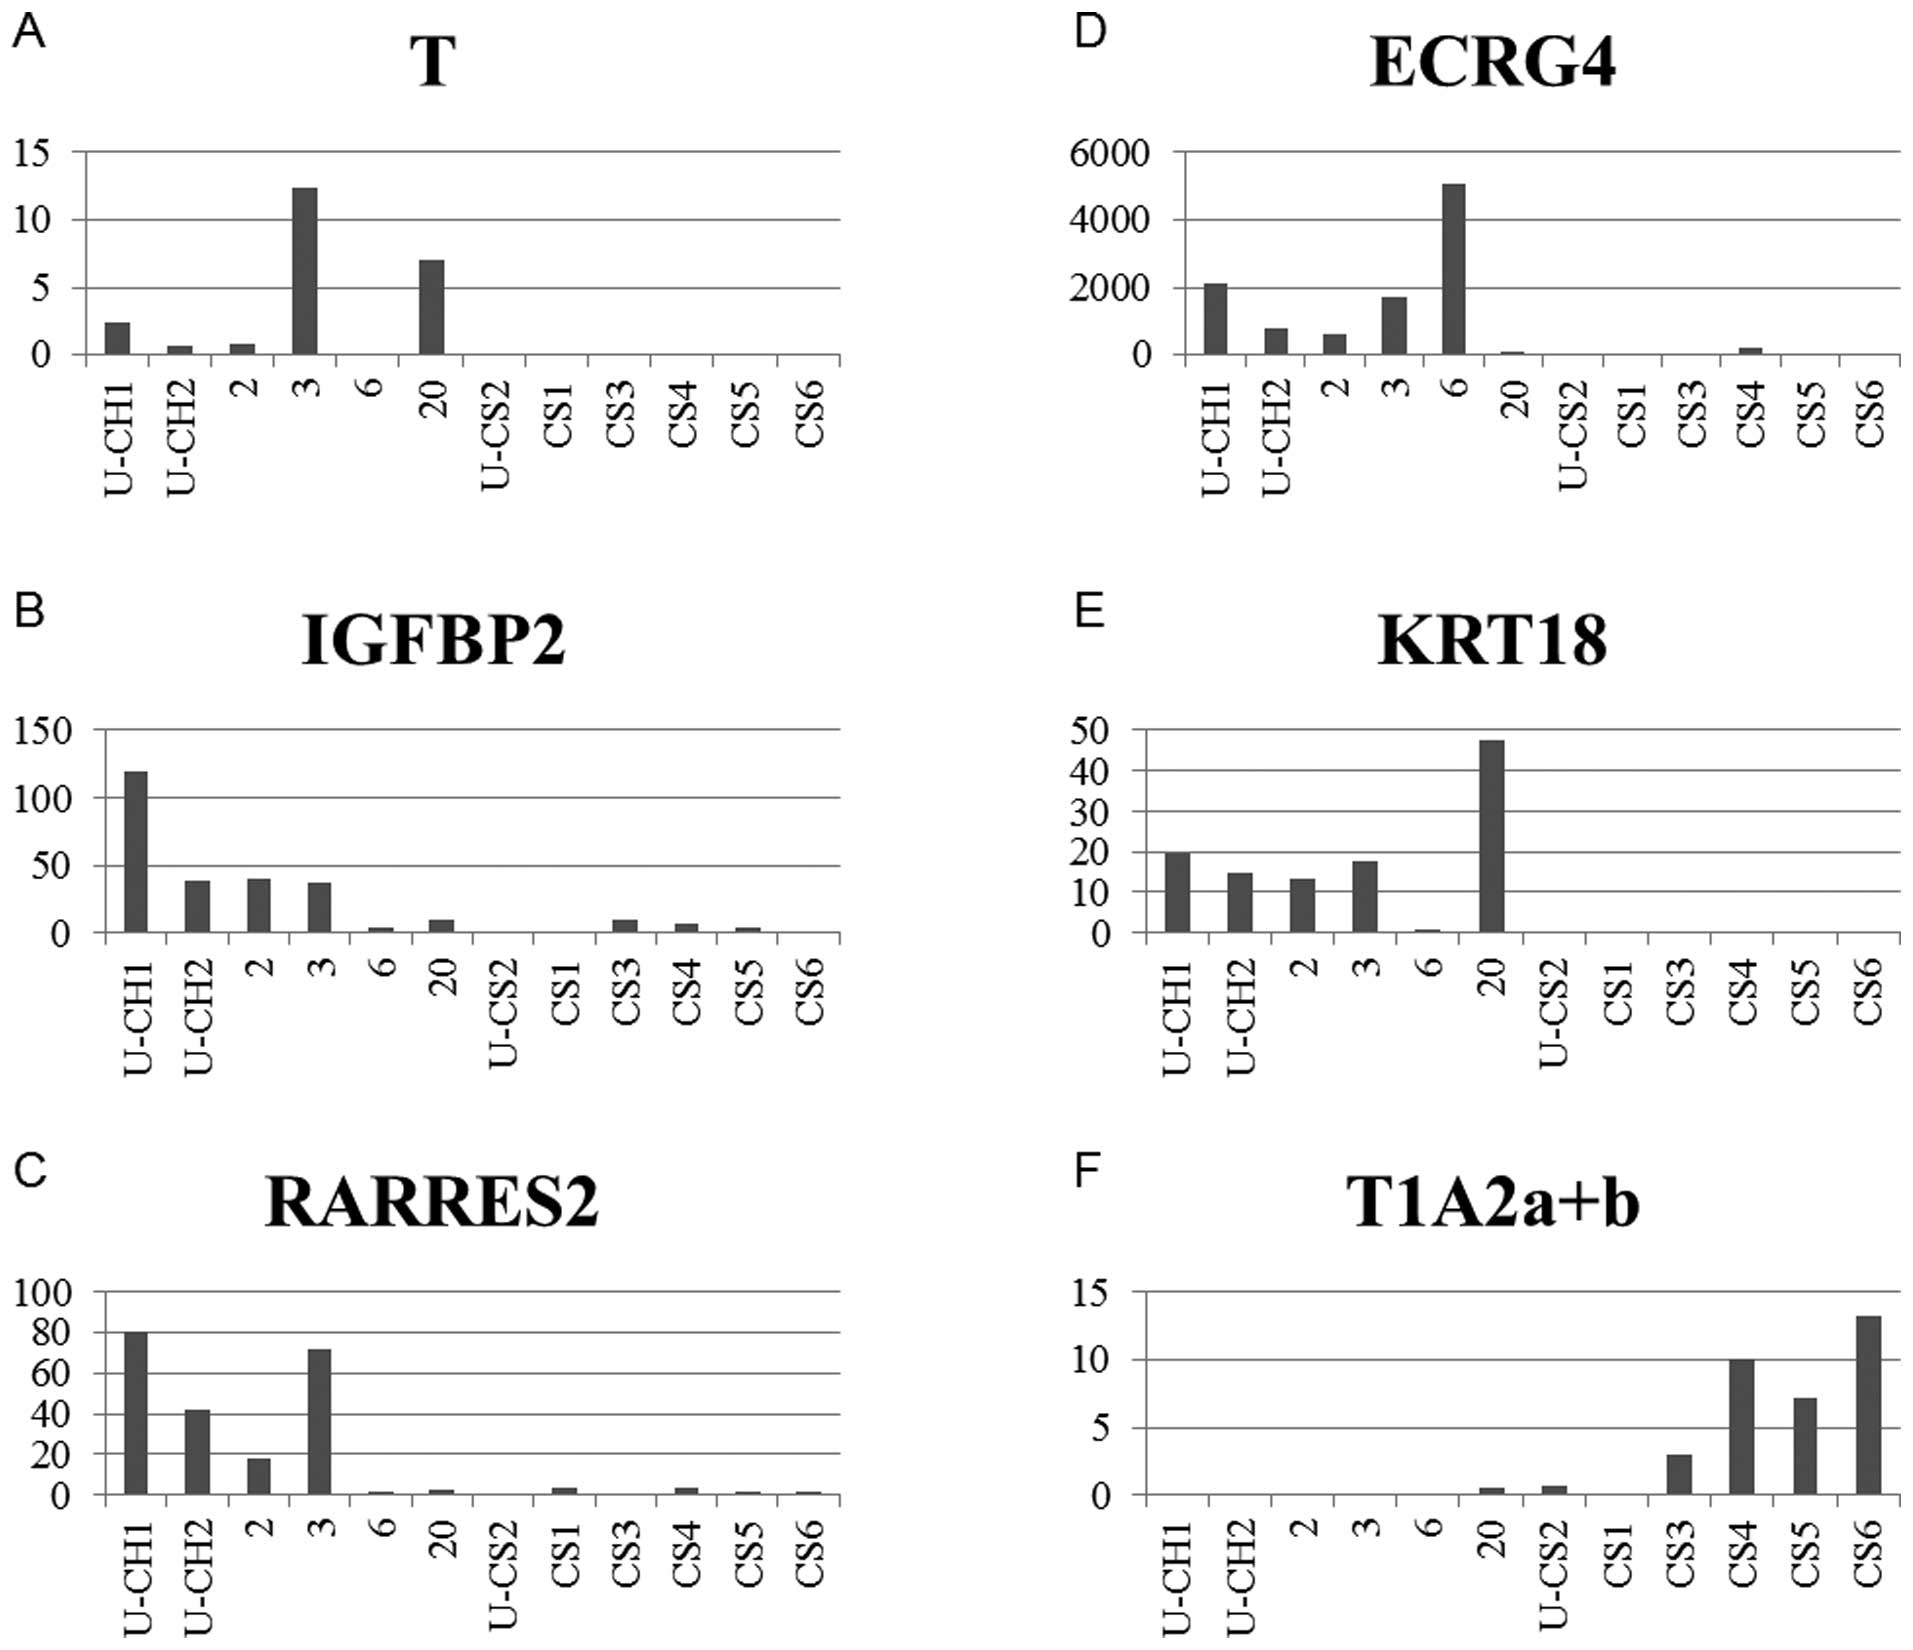
(Fig. 3). The microarray data were
corroborated by real-time PCR analysis for selected genes,
including six genes [T brachyury (mouse) homolog (T), CD24 antigen
(CD24), insulin-like growth factor binding protein 2 (IGFBP2),
retinoic acid receptor responder 2 (RARRES2), esophageal
cancer-related gene 4 protein (ECRG4) and keratin 18 (KRT18)] with
increased expression and one gene (T1A-2 lung type-I cell
membrane-associated glycoprotein T1A2) with reduced expression
compared to control and chondrosarcoma. The RT-PCR data were
determined in an independent series of six chordomas and six
chondrosarcomas, including the U-CS2 cell line (Figs. 4 and 5A). These analyses confirmed that the
transcript levels of the selected genes which differed
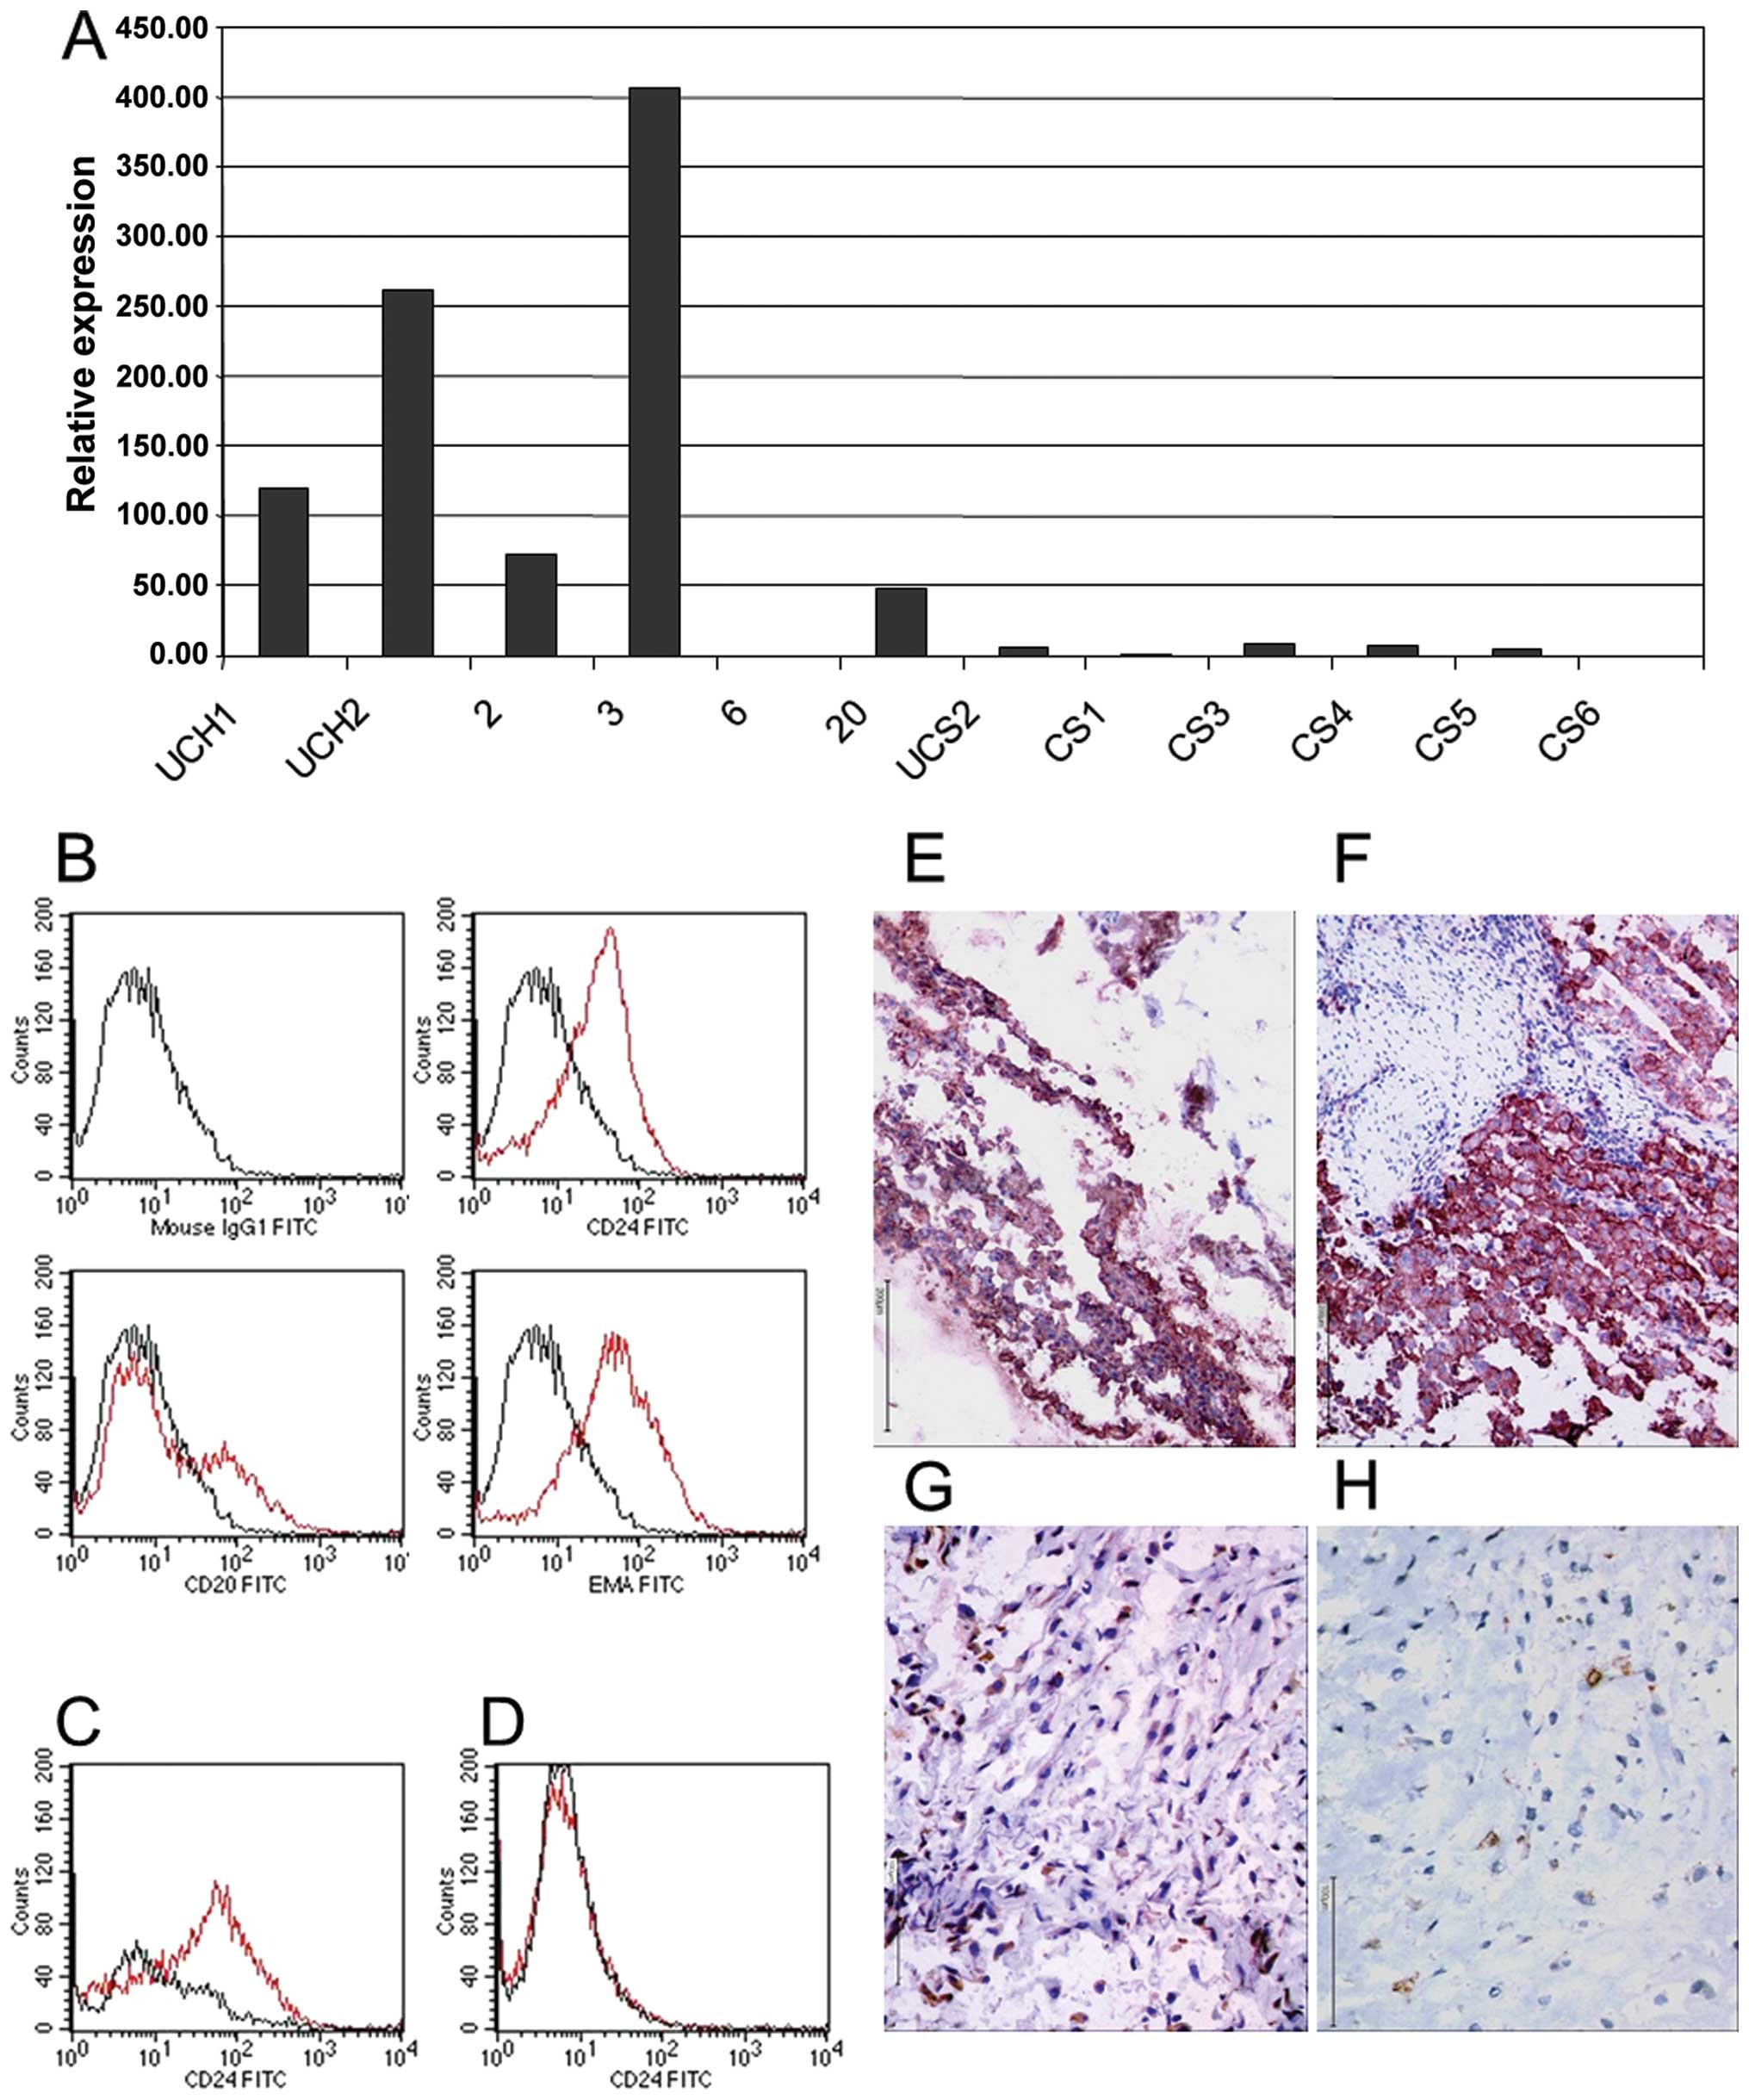
significantly between chordoma and chondrosarcoma. One interesting
candidate gene in chordoma-genesis is CD24. Using the Affymetrix
Human Genome U133 set GeneChip set, CD24 was highly expressed in
chordoma (signal: 1409) compared to vertebral disc (p<0.00024;
signal: 10) or to U-CS2 (signal: 62.9). With respect to
immunohistochemistry and FACS analysis, it was demonstrated that
CD24 antigen is highly abundant in all chordomas (Fig. 5B–F), but is absent in conventional
skeletal chondrosarcomas. CS6 demonstrated focally weak unspecific
background immunoreactivity and we therefore diagnosed a negative
CD24 immunoreactivity (Fig.
5H).
| Table III.Summary of gene transcript expression
analysis.a |
Table III.
Summary of gene transcript expression
analysis.a
| GeneChip probe
no. | Locus | Gene
U133A/B | Expression
level |
|---|
|
|---|
| Symbol | Chordoma Signal
Mean | Chordoma Signal
SEM | Fold change |
|---|
| 209469_at | 6q27 | Guanine nucleotide
exchange factor for Rap1 | Rap1 | 1043 | 350 | 745.1 |
| 205150_s_at | | T brachyury (mouse)
homolog | T | 1794 | 208 | 245.7 |
|
223748_at | | Bicarbonate
transporter-related protein | BTR1 | 4229 | 2884 | 212.5 |
| 220988_s_at | | Ribonuclease, RNase
A family, 1 | RNASE1 | 3259 | 339 | 148.8 |
| 213436_at | 6q21 | Keratin 19 | KRT19 | 4302 | 278 | 131.6 |
| 201785_at | | CD24 antigen (small
cell lung carcinoma cluster 4 antigen) | CD24 | 1409 | 480.2 | 122.6 |
|
223631_s_at | | HAI-2 related
small protein /UG=Hs.145362 immortalization-upregulated
protein | HAI-2 | 1144 | 926 | 114.4 |
| 210982_s_at | | Member RAS oncogene
family | RAB38 | 710 | 156 | 109.2 |
| 204959_at | 4q21-q25 | C i: Hs.138671
fms-related tyrosine kinase 1 (vascular endothelial growth factor
vascular permeability factor receptor) | | 136 | 26 | 91.0 |
| 213492_at | | Secreted
phosphoprotein 1 (osteopontin, bone sialoprotein I, early
T-lymphocyte activation 1) | SSP1 | 4230 | 1407 | 89.0 |
| 205433_at | | C i: Hs.278611
UDP-N-acetyl-α-D-galactosamine:polypeptide
N-acetylgalactosaminyltransferase 3 | GalNAc-T3 | 1315 | 220 | 71.4 |
| 209875_s_at | | mRNA, complete cds,
clone:SMAP31-12 | | 1578 | 636 | 54.8 |
| 209994_s_at | 2q33-q34 | Vesicle-associated
membrane protein 8 (endobrevin) | VAMP8 | 1031 | 140 | 53.7 |
| 206637_at | | Insulin-like growth
factor binding protein 2 (36 kDa) | IGFBP2 | 1281 | 654 | 52.7 |
| 207315_at | | KIAA0644 gene
product | KIAA0644 | 858 | 492 | 51.4 |
| 210222_s_at | |
Phosphatidylinositol-4-phosphate 5-kinase,
type I, β | PIP5K1B | 199 | 62 | 37.6 |
| 202546_at | | Retinoic acid
receptor responder (tazarotene induced) 2 | RARRES2 | 1074 | 252 | 28.7 |
| 205015_s_at | | C i: Hs.12969
hypothetical protein | | 542 | 337 | 20.6 |
| 206439_at | | Integral membrane
protein 2A | ITM2A | 181 | 40 | 20.4 |
| 217414_x_at | | C i: Hs.80620
guanine nucleotide exchange factor for Rap1; M-Ras-regulated
GEF | | 265 | 127 | 16.5 |
| 206254_at | | C i: Hs.94795 mRNA;
cDNA DKFZp564O222 (from clone DKFZp564O222) | | 1071 | 720 | 15.1 |
| 220117_at | | Keratin 18 | KRT18 | 3020 | 859 | 13.7 |
|
239262_at | 2q12.2 | Hs.43125 Homo
sapiens esophageal cancer related gene 4 protein mRNA, complete
cds | ECRG4 | 672 | 547 | 13.8 |
| 204220_at | | C i: Hs.12969
hypothetical protein | | 509 | 285 | 12.8 |
| 212843_at | | γ-aminobutyric acid
(GABA) A receptor, α2 | GABRA2 | 236 | 60 | 12.5 |
| 209292_at | | Hs.75893 ankyrin 3,
node of Ranvier (ankyrin G) | Ankyrin G | 296 | 147 | 9.7 |
| 203485_at | | Similar to actin
binding LIM protein 1/Hs.158203 actin binding LIM protein 1 | | 237 | 135 | 9.7 |
| 219411_at | | C i: Hs.323079
mRNA; cDNA DKFZp564P116 (from clone DKFZp564P116) | | 332 | 114 | 8.9 |
| 221595_at | | Transcription
factor 8 (represses interleukin 2 expression) | TCF8 | 144 | 21 | 8.6 |
| 209765_at | | Myosin 5C | MYO5C | 290 | 53 | 8.3 |
| 201690_s_at | | Ectodermal-neural
cortex (with BTB-like domain) | ENC1 | 719 | 123 | 8.0 |
| 210674_s_at | | ArgAbl-interacting
protein ArgBP2, transcript variant 2 | ARGBP2 | 493 | 195 | 7.7 |
| 219884_at | | Pig10 /UG=Hs.104925
ectodermal-neural cortex (with BTB-like domain) | PIG10 | 313 | 40 | 7.4 |
| 201839_s_at | | RAB3B, member RAS
oncogene family | RAB3B | 277 | 152 | 6.7 |
| 219232_s_at | | LRP5 mRNA for
lipoprotein receptor related protein 5 | LRP5 | 112 | 8 | 6.1 |
| 215177_s_at | | C i: Hs.169401
apolipoprotein E | | 202 | 46 | 6.0 |
| 221651_x_at | | C i: DNA sequence
from clone RP4-761I2 on chromosome 6 contains 3 part of the gene
for enhancer of filamentation (HEF1), ESTs, STSs and CpG islands
/UG=Hs.80261 enhancer of filamentation 1 (cas-like docking;
Crk-associated substrate related) | | 402 | 220 | 5.7 |
| 215930_s_at | | Actin binding LIM
protein 1 (ABLIM), transcript variant ABLIM-s | ABLIM | 598 | 218 | 5.6 |
| 202768_at | | C i: DNA sequence
from PAC 696H22 on chromosome Xq21.1-21.2. contains a mouse
E25-like gene, a kinesin-like pseudogene and ESTs /UG=Hs.17109
integral membrane protein 2A | | 393 | 21 | 5.2 |
| 202581_at | | Capping protein
(actin filament), gelsolin-like | CAPG | 910 | 166 | 5.1 |
| 213539_at | | Hypothetical
protein (FLJ20330) /UG=Hs.61485 hypothetical protein | | 153 | 43 | 5.0 |
| 210089_s_at | | Sialyltransferase 9
(CMP-NeuAc:lactosylceramide α-2,3-sialyltransferase; GM3
synthase) | SIAT9 | 275 | 71 | 4.7 |
| 210073_at | | 8D6 antigen
(LOC51293) | LOC51293 | 284 | 176 | 4.3 |
| 211654_x_at | | C i: KIAA0006 gene,
partial cds. /UG=Hs.79307 RacCdc42 guanine exchange factor (GEF)
6 | | 197 | 30 | 3.8 |
| 204309_at | | TP53 target gene
1 | | 129 | 30 | 3.5 |
| 204844_at | | BTG family, member
2 (BTG2) | BTG2 | 163 | 62 | 3.5 |
| 206178_at | | v-maf
musculoaponeurotic fibrosarcoma (avian) oncogene homolog | MAF | 217 | 73 | 3.4 |
| 214453_s_at | 6q25-q26 | Hypothetical
protein FLJ10700 (FLJ10700) /UG=Hs.295909 hypothetical protein
FLJ10700 | | 277 | 62 | 3.3 |
| 204526_s_at | | Cytovillin
2/UG=Hs.155191 villin 2 (ezrin) | VIL2 | 683 | 103 | 3.2 |
| 210582_s_at | | NADH dehydrogenase
(ubiquinone) 1 α subcomplex, 7 (14.5 kDa, B14.5a) | NDUFA7 | 209 | 30 | 3.0 |
Since it has been suggested that sonic hedgehog
(SHH) may be involved in chordomagenesis (7), we screened 4 sacral chordomas and 3
chondrosarcomas for differentially expressed genes using a
medium-dense cDNA microarray, which comprises genes associated with
hedgehog signaling and cancer (17). However, we detected no increase in
the expression of SHH and known downstream targets of the hedgehog
signaling cascade, such as PTCH1, GLI1, GLI3, D-type cyclins
(18), FOXF1 and GADD45a (19). Interestingly, the gene coding for
osteopontin (SSP), which has been shown to be transcriptionally
activated by GLI1, was upregulated in four out of six chordomas and
in one out of three chondrosarcomas in the cDNA microarray analysis
(data not shown). Importantly, we demonstrated SSP protein in all
chordomas (Table I), but not in
chondrosarcomas (n=6) using immunohistochemistry. However, we could
not show any prognostic impact of SSP or osteonectin expression in
these tumors (data not shown).
Discussion
In order to identify new candidate genes in
chordomagenesis, we performed a combined study of genome-wide
analysis of 33 chordomas using CGH and a transcript profile
analysis of a subgroup of 6 chordomas compared to 10
chondrosarcomas, grade 1–2. Molecular cytogenetics showed that
gains of chromosomal material in chordoma were most prevalent at 7q
(42%), 12q (21%), 17q (21%), 20q (27%) and 22q (21%) (Fig. 2). DNA sequence losses occurred most
frequently at 1p (21%), 3p (36%), 4q (27%), 10q (21%) and 13q (24%)
(Fig. 2). A recent study
summarized recurrent cytogenetic copy number alterations published
by these different groups (4,7,22,23).
Including our data, a consistent recurrent gain of all 101
chordomas studied in these four different cohorts was found on 7q
(25–69%), whereas consistent losses were found on 3p (36–75%), 10q
(21–65%) and 13q (24–61%). In summary, these tumors are
characterized by non-random genomic copy number alterations, where
losses are more frequent than gains.
Whereas the CGH analysis demonstrated gains of
chromosomal material in chordoma most prevalent at 7q, 12q, 17q,
20q and 22q, the gene transcripts with increased expression
compared to control and chondrosarcoma were most frequently located
on 2 (11%), 5 (8%), 1 and 7 (each 6%) (Fig. 3). In an earlier study (7), we suggested that oncogenes located on
7q36 might be involved in chordomagenesis. Using GeneChip
experiments we could not identify any known oncogene located on
7q36 that is misregulated in chordoma. Furthermore, we could not
demonstrate that our former candidate genes, HLXB9 and SHH
(7), are overexpressed in
chordoma. None of the genes involved in the SHH pathway was
transcriptionally activated in chordoma or chondrosarcoma. However,
the gene coding for osteopontin (SSP), which has been shown to be
transcriptionally activated by GLI1, was upregulated in four
chordomas and one chondrosarcoma. SSP has been recognized to be
important in the processes of tumorigenicity and metastasis of
various cancers (22). Using
immunohistochemistry in 24 chordomas obtained from 19 patients, we
could not demonstrate any prognostic relevance of SSP expression
and prognosis (data not shown).
Another candidate gene found in our GeneChip
expression analysis was the transcription factor T brachyury (T),
which was highly increased in chordoma compared to vertebral disc
or U-CS2 (Table III). This
transcription factor is located on 6q27. It influences the cell
cycle in different ways to other transcription factors, growth
factors, cytokines and kinases and it influences the cell
differentiation (10). In several
studies, T was identified in chordoma (reviewed in ref. 10). T seems to be the key transcription
factor in chordomas. In a very early review, the mechanisms of
repair of bone and cartilage were described (23). They summarized that the control of
chondrocytic differentiation is affected by the interplay of T,
BMP-4, and TGFβ3. T protein is vital for the formation and
differentiation of posterior mesoderm and for axial development in
all vertebrates (24). The authors
demonstrated that T mutant mice or zebrafish die due to, for
example, abnormality or lack of the notochord. They found that
human T expression was very similar to that found for T in other
vertebrate species and was confined to cells derived from the
notochord. Chordoma originates from notochordal remnants. A genetic
and functional-based study, demonstrated the role of T in the
pathogenesis of sporadic chordoma (11). The group summarized that gain of
the T locus is common in sporadic chordomas and that expression of
this gene is critical for proliferation of chordoma cells in
vitro. A common single-nucleotide variant in this gene is
strongly associated with development of the disease (25). Furthermore, in vitro
silencing of T induces growth arrest of chordoma cells (25). The authors showed that specific
target genes of the transcription factor have been identified
through shRNA-mediated silencing followed by global gene expression
microarray analyses.
Recently, duplication of the transcription factor T
was shown to be associated with the development of chordoma in a
few families (26). At any rate,
screening for mutations in T (all coding exons and promoter) failed
to show any genetic alterations in 23 chordomas (5). Furthermore, amplification of T was
described in a subgroup of sporadic chordoma. In line with this, we
found that T is overexpressed in chordoma.
Specific target genes of the transcription factor T
have been identified through shRNA-mediated silencing followed by
global gene expression microarray analyses of 18 chordomas and the
cell line U-CH1 (27). These genes
include growth factors such as TGFA, FGF1 or EGF. To date, there
has been little experience in chordoma with targeting therapy
strategies (28) using tyrosine
kinase inhibition. In their case report, the authors summarized a
total of 4 cases and described a duration of response between 4 and
12 months (28).
Another gene expressed in chordoma and carcinoma is
CD24. Two studies focused on aspects of CD24 (small cell lung
carcinoma cluster 4 antigen) as a prognostic marker in epithelial
malignomas (29,30). In invasive breast cancer, the
authors found CD24 expression in 84.6% of cases. In univariate
survival analysis, a significant association of CD24 expression
with shortened patient overall survival (5-year survival rate 91.9
versus 83.8%; p=0.031; log rank test) and disease-free survival
(5-year progression rate 88.3 versus 57.0%; p=0.0008) was
demonstrated. Kaplan-Meier curves and Cox regression analysis of
their prostate cancer study showed that CD24 expression was
strongly linked to significantly earlier disease progression
(relative risk, 3.2), which was especially pronounced in
organ-confined or moderately differentiated primary prostate
tumors. In our cohort of chordoma and chondrosarcoma, we
demonstrated by immunohistochemistry and, in part, by FACS analysis
that our chordoma cell lines and the fresh-frozen chordomas (n=7)
express CD24 protein. Importantly, none of the skeletal
chondrosarcomas (n=9) or U-CS2 expressed CD24 antigen demonstrated
CD24 immunoreactivity. Further investigations are needed in order
to study the prognostic relevance of CD24 protein expression in
chordoma.
Another new candidate gene is the esophageal
cancer-related gene 4 (ECRG4/C2ORF40). To date, this gene
has been described in epithelial tumors. Chordoma is a unique bone
tumor with both epithelial and mesenchymal characteristics
(1). We detected a gene expressed
in chordomas that was previously found to be a prognostic marker in
various carcinomas (reviewed in ref. 31). In 1998, ECRG4 was identified
from normal esophageal epithelium (32). Several years ago, the encoded
protein (augurin) was identified (33). We could not analyze the prognostic
impact of ECRG4 expression in chordoma. Further studies are needed
to address this issue.
Systemic treatments of chordoma are largely
ineffective and new therapeutic approaches are therefore needed.
Only very recently, survivin expression has been suggested for use
as a potential target gene of angiogenesis in sacral chordoma
(34). Consequently, our study
indicated a series of 65 genes that are differentially expressed in
chordoma. Further studies are needed to validate our set of genes
in order to define their possible value as new candidate prognostic
and therapeutic targets for chordomas.
Acknowledgements
Stefanie Scheil-Bertram was supported
by grants from the Deutsche Krebshilfe e.V./Dr. Mildred Scheel
Stiftung (70-3028-Sche 2) and Rudolf and Clothilde
Eberhardt-Stiftung. We would like to acknowledge Yvonne Sauter for
skillful technical assistance and Caroline Higginson for editorial
help.
References
|
1.
|
Dorfman HD and Czerniak B: Bone tumors.
Mosby; St. Louis, MO: 1998
|
|
2.
|
Mirra JM, Nelson SD, Della Rocca C and
Mertens F: Chordoma. Pathology and Genetics of Tumors of Soft
Tissue and Bone World Health Organization Classification of Tumors.
Fletcher CDM, Unni KK and Mertens F: IARC Press; Lyon: pp. 316–317.
2002
|
|
3.
|
Dewaele B, Maggiani F, Floris G, Ampe M,
Vanspauwen V, Wozniak A, Debiec-Rychter M and Sciot R: Frequent
activation of EGFR in advanced chordomas. Clin Sarcoma Res.
25:42011. View Article : Google Scholar : PubMed/NCBI
|
|
4.
|
Diaz RJ, Guduk M, Romagnuolo R, Smith CA,
Northcott P, Shih D, Berisha F, Flanagan A, Munoz DG, Cusimano MD,
Pamir MN and Rutka JT: High-resolution whole-genome analysis of
skull base chordomas implicates FHIT loss in chordoma pathogenesis.
Neoplasia. 14:788–798. 2012.PubMed/NCBI
|
|
5.
|
Shalaby AA, Presneau N, Idowu BD, Thompson
L, Briggs TR, Tirabosco R, Diss TC and Flanagan AM: Analysis of the
fibroblastic growth factor receptor-RAS/RAF/MEK/ERK-ETS2/ brachyury
signalling pathway in chordomas. Mod Pathol. 22:996–1005. 2009.
View Article : Google Scholar : PubMed/NCBI
|
|
6.
|
Stacchiotti S, Tamborini E, Lo Vullo S,
Bozzi F, Messina A, Morosi C, Casale A, Crippa F, Conca E, Negri T,
Palassini E, Marrari A, Palmerini E, Mariani L, Gronchi A, Pilotti
S and Casali PG: Phase II study on lapatinib in advanced
EGFR-positive chordoma. Ann Oncol. 24:1931–1936. 2013. View Article : Google Scholar : PubMed/NCBI
|
|
7.
|
Scheil S, Bruederlein S, Liehr T, Starke
H, Herms J, Schulte M and Moeller P: Genome wide analysis of 16
chordomas by comparative genomic hybridization and cytogenetics of
the first human chordoma cell line, U-CH1. Genes Chromosomes
Cancer. 32:203–211. 2001. View
Article : Google Scholar : PubMed/NCBI
|
|
8.
|
Larizza L, Mortini P and Riva P: Update on
the cytogenetics and molecular genetics of chordoma. Hered Cancer
Clin Pract. 3:29–41. 2005. View Article : Google Scholar : PubMed/NCBI
|
|
9.
|
Kelley MJ, Korczak JF, Sheridan E, Yang X,
Goldstein AM and Parry DM: Familial chordoma, a tumor of
notochordal remnants, is linked to chromosome 7q33. Am J Hum Genet.
69:454–460. 2001. View
Article : Google Scholar : PubMed/NCBI
|
|
10.
|
Szuhai K and Hogendoorn PC: ‘The chicken
or the egg?’ dilemma strikes back for the controlling mechanism in
chordoma. J Pathol. 228:261–265. 2012.
|
|
11.
|
Presneau N, Shalaby A, Ye H, Pillay N,
Halai D, Idowu B, Tirabosco R, Whitwell D, Jacques TS, Kindblom LG,
Brüderlein S, Möller P, Leithner A, Liegl B, Amary FM, Athanasou
NN, Hogendoorn PC, Mertens F, Szuhai K and Flanagan AM: Role of the
transcription factor T (brachyury) in the pathogenesis of sporadic
chordoma: a genetic and functional-based study. J Pathol.
223:327–335. 2011. View Article : Google Scholar : PubMed/NCBI
|
|
12.
|
Bruederlein S, Sommer JB, Meltzer PS, Li
S, Osada T, Ng D, Möller P, Alcorta DA and Kelley MJ: Molecular
characterization of putative chordoma cell lines. Sarcoma.
2010:6301292010.PubMed/NCBI
|
|
13.
|
Fisher LW, Hawkins GR, Tuross N and
Termine JD: Purification and partial characterization of small
proteoglycans I and II, bone sialoproteins I and II, and
osteonectin from the mineral compartment of developing human bone.
J Biol Chem. 262:9702–9708. 1987.PubMed/NCBI
|
|
14.
|
Straeter J, Walczak H, Pukrop T, von
Müller L, Hasel C, Kornmann M, Mertens T and Möller P: TRAIL and is
receptors in the colonic epithelium: a putative role in the defense
of viral infections. Gastroenterology. 122:659–666. 2002.
View Article : Google Scholar : PubMed/NCBI
|
|
15.
|
Gisselsson D, Pålsson E, Höglund M,
Domanski H, Mertens F, Pandis N, Sciot R, Dal Cin P, Bridge JA and
Mandahl N: Differentially amplified chromosome 12 sequences in low-
and high-grade osteosarcoma. Genes Chromosomes Cancer. 33:133–140.
2002. View
Article : Google Scholar : PubMed/NCBI
|
|
16.
|
Van Gelder RN, von Zastrow ME, Yool A,
Dement WC, Barchas JD and Eberwine JH: Amplified RNA synthesized
from limited quantities of heterogeneous cDNA. Proc Natl Acad Sci
USA. 87:1663–1667. 1990.PubMed/NCBI
|
|
17.
|
Kappler R, Hess I, Schlegel J and Hahn H:
Transcriptional up-regulation of Gadd45a in Patched-associated
medulloblastoma. Int J Oncol. 25:113–120. 2004.PubMed/NCBI
|
|
18.
|
Ruiz I, Altaba A, Sánchez P and Dahmane N:
Gli and hedgehog in cancer: tumours, embryos and stem cells. Nat
Rev Cancer. 2:361–372. 2002. View
Article : Google Scholar : PubMed/NCBI
|
|
19.
|
Kappler R, Calzada-Wack J, Schnitzbauer U,
Koleva M, Herwig A, Piontek G, Graedler F, Adamski J, Heinzmann U,
Schlegel J, Hemmerlein B, Quintanilla-Martinez L and Hahn H:
Molecular characterization of Patched-associated rhabdomyosarcoma.
J Pathol. 200:348–356. 2003. View Article : Google Scholar : PubMed/NCBI
|
|
20.
|
Hallor KH, Staaf J, Jönsson G, Heidenblad
M, Vult von Steyern F, Bauer HC, Ijszenga M, Hogendoorn PC, Mandahl
N, Szuhai K and Mertens F: Frequent deletion of the CDKN2A locus in
chordoma: analysis of chromosomal imbalances using array
comparative genomic hybridisation. Br J Cancer. 98:434–442. 2008.
View Article : Google Scholar
|
|
21.
|
Le LP, Nielsen GP, Rosenberg AE, Thomas D,
Batten JM, Deshpande V, Schwab J, Duan Z, Xavier RJ, Hornicek FJ
and Iafrate AJ: Recurrent chromosomal copy number alterations in
sporadic chordomas. PLoS One. 6:e188462011. View Article : Google Scholar : PubMed/NCBI
|
|
22.
|
Rittling SR and Chambers AF: Role of
ostopontin in tumour progression. Br J Cancer. 17:1877–1881. 2004.
View Article : Google Scholar : PubMed/NCBI
|
|
23.
|
Otto WR and Rao J: Tomorrow’s skeleton
staff: mesenchymal stem cells and the repair of bone and cartilage.
Cell Prolif. 37:97–110. 2004.
|
|
24.
|
Edwards YH, Putt W, Lekoape KM, Stott D,
Fox M, Hopkinson DA and Sowden J: The human homolog T of the mouse
T (Brachyury) gene; gene structure, cDNA sequence, and assignment
to chromosome 6q27. Genome Res. 6:226–233. 1996. View Article : Google Scholar : PubMed/NCBI
|
|
25.
|
Hsu W, Mohyeldin A, Shah SR, Ap Rhys CM,
Johnson LF, Sedora-Roman NI, Kosztowski TA, Awad OA, McCarthy EF,
Loeb DM, Wolinsky JP, Gokaslan ZL and Quiñones-Hinojosa A:
Generation of chordoma cell line JHC7 and the identification of
Brachyury as a novel molecular target. J Neurosurg. 115:760–769.
2011. View Article : Google Scholar : PubMed/NCBI
|
|
26.
|
Yang XR, Ng D, Alcorta DA, Liebsch NJ,
Sheridan E, Li S, Goldstein AM, Parry DM and Kelley MJ: T
(brachyury) gene duplication confers major susceptibility to
familial chordoma. Nat Genet. 41:1176–1178. 2009. View Article : Google Scholar : PubMed/NCBI
|
|
27.
|
Nelson AC, Pillay N, Henderson S, Presneau
N, Tirabosco R, Halai D, Berisha F, Flicek P, Stemple DL, Stern CD,
Wardle FC and Flanagan AM: An integrated functional genomics
approach identifies the regulatory network directed by brachyury
(T) in chordoma. J Pathol. 228:274–285. 2012. View Article : Google Scholar : PubMed/NCBI
|
|
28.
|
Launay SG, Chetaille B, Medina F, Perrot
D, Nazarian S, Guiramand J, Moureau-Zabotto L and Bertucci F:
Efficacy of epidermal growth factor receptor targeting in advanced
chordoma: case report and literature review. BMC Cancer.
11:4232011. View Article : Google Scholar : PubMed/NCBI
|
|
29.
|
Kristiansen G, Winzer KJ, Mayordomo E,
Bellach J, Schluns K, Denkert C, Dahl E, Pilarsky C, Altevogt P,
Guski H and Dietel M: CD24 expression is a new prognostic marker in
breast cancer. Clin Cancer Res. 9:4909–4913. 2004.
|
|
30.
|
Kristiansen G, Pilarsky C, Pervan J,
Sturzebecher B, Stephan C, Jung K, Loening S, Rosenthal A and
Dietel M: CD24 expression is a significant predictor of PSA relapse
and poor prognosis in low grade or organ confined prostate cancer.
Prostate. 58:183–192. 2004. View Article : Google Scholar : PubMed/NCBI
|
|
31.
|
Sabatier R, Finetti P, Adelaide J, Guille
A, Borg JP, Chaffanet M, Lane J, Birnbaum D and Bertucci F:
Down-regulation of ECRG4, a candidate tumor suppressor gene, in
human breast cancer. PLoS One. 6:e276562011. View Article : Google Scholar : PubMed/NCBI
|
|
32.
|
Su T, Liu H and Lu S: Cloning and
identification of cDNA fragments related to human esophageal
cancer. China J Oncol. 20:254–257. 1998.(In Chinese).
|
|
33.
|
Mirabeau O, Perlas E, Severini C, Audero
E, Gascuel O, Possenti R, Birney E, Rosenthal N and Gross C:
Identification of novel peptide hormones in the human proteome by
hidden Markov model screening. Genome Res. 17:320–327. 2007.
View Article : Google Scholar : PubMed/NCBI
|
|
34.
|
Chen C, Yang HL, Chen KW, Wang GL, Lu J,
Yuan Q, Gu YP and Luo ZP: High expression of survivin in sacral
chordoma. Med Oncol. 30:5292013. View Article : Google Scholar : PubMed/NCBI
|