Introduction
The major reactive oxygen species (ROS) are hydroxyl
radical (•OH), superoxide anion
(O2•−) and hydrogen peroxide
(H2O2), which are involved in a variety of
cellular events such as transcription factor activation and cell
proliferation (1). ROS can also
induce damage in cells and tissues via the oxidation of DNA, lipid
and protein (2). Therefore, cells
and tissues have various antioxidants and systems to control the
excessive ROS level. Superoxide dismutase (SOD), which metabolizes
superoxide anion (O2•−) to hydrogen peroxide
(H2O2), is expressed as extracellular
(ecSOD), intracellular (Cu/ZnSOD) and mitochondrial (MnSOD)
isoforms (3). Glutathione (GSH) is
a dominant non-protein antioxidant in cells and supplies electrons
for glutathione peroxidase to detoxify H2O2
to O2 and H2O (4). GSH is
important for cell cycle progression and apoptosis and it is also
known to protect cells from toxic metabolites and oxidative stress
(5,6). Thioredoxin (Trx) as a small protein
contains cysteine residues (Cys 32 and Cys 35) in the active site
and the residues exist as either a dithiol in the reduced form and
a disulfide in the oxidized form (7). When Trx is oxidized, it is reduced
back to dithiol by nicotinamide adenine dinucleotide phosphate
(NADPH)-dependent Trx reductase (TrxR) (7). There are two isoforms of Trx;
cytoplasmic (Trx1) and mitochondrial (Trx2) (8). Especially, Trx1 is overexpressed in
many cancer cells including colorectal and breast cancer (9,10)
and has been reported as responsible for cellular resistance to
anticancer drugs (11).
Histone deacetylase (HDAC) is a class of enzyme that
removes acetyl groups from lysine amino acid on histones, leading
to the suppression of transcription (12). Deregulation of HDAC has been
observed in malignant tissues, resulting in the inhibition of tumor
suppressor genes, thereby allowing the expression of the malignant
phenotypes (13). In addition,
previous studies have demonstrated that HDAC activity is
upregulated in many human cancers and suggested that the ways to
inhibit HDAC activity can be a novel strategy in cancer
therapeutics (14,15). Suberoylanilide hydroxamic acid
(SAHA) is a potent HDAC inhibitor, that has been used for the
treatment of cutaneous T-cell lymphoma (16). Accumulating evidence indicates that
SAHA has effects on many biological functions such as cell cycle
arrest, apoptosis, invasion in cancer cells (17,18).
Furthermore, SAHA appears to induce cell death via generating ROS
and to downregulate Trx1 via increasing thioredoxin-interacting
protein (TXNIP) (19,20).
Cervical cancer is a major cause of death in women
worldwide and its occurrence results from both genetic and
epigenetic events. Epigenetic alterations such as global DNA
hypomethylation, hypermethylation of tumor suppressor genes and
histone modifications occur during the carcinogenesis of cervical
cancer (21). Overexpression of
HDAC2 is observed in cervical cancer (22). Furthermore, the upregulation of Trx
is found in invasive cervical carcinomas (23). It has been reported that SAHA has
anticancer effects on liver, breast, ovarian and cervical cancer
cells in vitro and in vivo (17,20,24).
However, little is known about the anticancer effect of SAHA on
cervical cancer cells in view of ROS and GSH levels as well as in
relation to antioxidant proteins, especially Trx1. Therefore, in
the present study we investigated the effects of SAHA on cell
growth and cell death in human cervical HeLa cells with respect to
the levels of ROS, GSH and Trx1.
Materials and methods
Cell culture
Human cervix adenocarcinoma HeLa cells were obtained
from the American Type Culture Collection (ATCC, Manassas, VA, USA)
and maintained in a humidified incubator containing 5%
CO2 at 37°C. The HeLa cells were cultured in RPMI-1640
(Sigma-Aldrich, St. Louis, MO, USA) supplemented with 10% fetal
bovine serum (FBS; Sigma-Aldrich) and 1% penicillin-streptomycin
(Gibco BRL, Grand Island, NY, USA). The cells were routinely grown
in 100-mm plastic tissue culture dishes (Nunc, Roskilde, Denmark)
and harvested with a solution of trypsin-EDTA while in a
logarithmic phase of growth.
Reagents
SAHA was purchased from Cayman Chemical Co. (Ann
Arbor, MI, USA) and was dissolved in dimethyl sulfoxide (DMSO;
Sigma-Aldrich Chemical Co.) at 10 mM as a stock solution. The
pan-caspase inhibitor (Z-VAD-FMK;
benzyloxycarbonyl-Val-Ala-Asp-fluoromethylketone), caspase-3
inhibitor (Z-DEVD-FMK;
benzyloxycarbonyl-Asp-Glu-Val-Asp-fluoromethylketone), caspase-8
inhibitor (Z-IETD-FMK;
benzyloxycarbonyl-Ile-Glu-Thr-Asp-fluoromethylketone) and caspase-9
inhibitor (Z-LEHD-FMK;
benzyloxycarbonyl-Leu-Glu-His-Asp-fluoromethylketone) were obtained
from R&D Systems, Inc. (Minneapolis, MN, USA) and were
dissolved in DMSO at 10 mM to serve as stock solutions. TNF-α,
TRAIL and FasL were also obtained from R&D Systems, Inc. and
were dissolved in water at 10 mg/ml as a stock solution. NAC
obtained from Sigma-Aldrich Chemical Co. was dissolved in buffer
[20 mM HEPES (pH 7.0)] at 100 mM as a stock solution. Cells were
pretreated with 15 μM caspase inhibitors or 2 mM NAC for 1 h
prior to SAHA treatment. DMSO (0.01%) was used as a control vehicle
and it did not affect cell growth and death.
Growth inhibition assay
The effect of SAHA on cell growth was determined by
measuring 3-(4,5-dimethylthiazol-2-yl)-2,5-diphenyltetrazolium
bromide (MTT; Sigma-Aldrich) absorbance in living cells as
described previously (25). In
brief, 5×10³ cells were seeded in 96-well microtiter
plates (Nunc) for MTT assays. After exposure to the designated
doses of SAHA with or without 15 μM each caspase inhibitor,
2 mM NAC, Trx1 siRNA or adTrx1 for the indicated times, MTT
solution [20 μl: 2 mg/ml in phosphate-buffered saline (PBS)]
was added to each well of the 96-well plates. The plates were
additionally incubated for 3 h at 37°C. Medium was withdrawn from
the plates by pipetting and 200 μl DMSO was added to each
well to solubilize the formazan crystals. The optical density was
measured at 570 nm using a microplate reader (Synergy™ 2, BioTek
Instruments Inc., Winooski, VT, USA).
Cell cycle and sub-G1 cell analysis
Cell cycle and sub-G1 cell analysis were determined
by propidium iodide (PI, Ex/ Em=488/617 nm; Sigma-Aldrich) staining
as described previously (26). In
brief, 1×10⁶ cells in a 60-mm culture dish (Nunc) were
incubated with the designated doses of SAHA with or without 15
μM caspase inhibitors, 2 mM NAC, Trx1 siRNA or adTrx1 for 24
h. Cells were washed again with PBS, then incubated with PI (10
μg/ml) with simultaneous RNase treatment at 37°C for 30 min.
Cellular DNA content was measured using a FACStar flow cytometer
(Becton-Dickinson, Franklin Lakes, NJ, USA) and analyzed by using
lysis II and Cellfit software (Becton-Dickinson).
Annexin V-FITC/PI staining for cell death
detection
Apoptotic cell death was determined by staining
cells with Annexin V-fluorescein isothiocyanate (FITC, Invitrogen
Life Technologies, Camarillo, CA, USA; Ex/Em=488/519 nm) as
described previously (26). In
brief, 1×10⁶ cells in a 60-mm culture dish (Nunc) were
incubated with the designated doses of SAHA with or without 15
μM caspase inhibitors, 10 ng/ml TNF family members, 2 mM
NAC, Trx1 siRNA or adTrx1 for 24 h. Cells were washed twice with
cold PBS and then resuspended in 500 μl of binding buffer
(10 mM HEPES/NaOH pH 7.4, 140 mM NaCl, 2.5 mM CaCl2) at
a concentration of 1×10⁶ cells/ml. Annexin V-FITC (5
μl) and PI (1 μg/ml) were then added and the cells
were analyzed with a FACStar flow cytometer.
Quantification of caspase-3 activity
The activity of caspase-3 was assessed using the
caspase-3 colorimetric assay kit (R&D Systems, Inc.) as
previously described (27). In
brief, 1×10⁶ cells in a 60-mm culture dishes (Nunc) were
incubated with 10 μM SAHA for 24 h. The cells were then
washed in PBS and suspended in five volumes of lysis buffer
provided with the kit. Protein concentrations were determined using
the Bradford method. Supernatants containing 50 μg total
protein were used to determine caspase-3 activity. The supernatants
were added to each well in 96-well microtiter plates (Nunc) with
DEVD-pNA as a caspase-3 substrate and the plates were incubated at
37°C for 1 h. The optical density of each well was measured at 405
nm using a microplate reader (Synergy 2, BioTek Instruments Inc.).
Caspase-3 activity was expressed in arbitrary absorbance units.
Western blot analysis
The expression of proteins was evaluated using
western blot analysis as previously described (28). In brief, 1×10⁶ cells in
a 60-mm culture dish (Nunc) were incubated with the designated
doses of SAHA for 24 h. The cells were then washed in PBS and
suspended in five volumes of lysis buffer (20 mM HEPES, pH 7.9, 20%
glycerol, 200 mM KCl, 0.5 mM EDTA, 0.5% NP40, 0.5 mM DTT, 1%
protease inhibitor cocktail). Supernatant protein concentrations
were determined using the Bradford method. Supernatant samples
containing 30 μg total protein were resolved by 7.5 or 12.5%
SDS-PAGE gels depending on the sizes of target proteins,
transferred to Immobilon-P PVDF membranes (Millipore, Billerica,
MA, USA) by electroblotting, and then probed with anti-ac-H3,
anti-PARP, anti-c-PARP, anti-Bcl-2, anti-Bax (Cell Signaling
Technology Inc., Danvers, MA, USA), anti-Trx1, anti-Trx2,
anti-TrxR1, anti-Cu/ZnSOD, anti-MnSOD and anti-β-actin antibodies
(Santa Cruz Biotechnology, Santa Cruz, CA, USA). Membranes were
incubated with horseradish peroxidaseconjugated secondary
antibodies. Blots were developed using an ECL kit (Amersham,
Arlington Heights, IL, USA).
Measurement of MMP (ΔΨm)
The MMP (ΔΨm) levels were measured by a
rhodamine 123 fluorescent dye (Sigma-Aldrich; Ex/Em=485/535 nm) as
described previously (26,29). In brief, 1×10⁶ cells in
a 60-mm culture dish (Nunc) were incubated with the designated
doses of SAHA for 24 h. Cells were washed twice with PBS and
incubated with rhodamine 123 (0.1 μg/ml) at 37°C for 30 min.
Rhodamine 123 staining intensity was determined by a FACStar flow
cytometer. The cells that were rhodamine 123-negative were
indicated to have lost MMP (ΔΨm). MMP (ΔΨm)
levels in cells except MMP (ΔΨm) loss are expressed as
mean fluorescence intensity (MFI), which was calculated by
CellQuest software.
Detection of intracellular ROS
levels
Intracellular ROS such as
H2O2, •OH, and ONOO•
were detected by means of an oxidation-sensitive fluorescent probe
dye, 2′,7′-dichlorodihydrofluorescein diacetate
(H2DCFDA, Invitrogen Molecular Probes, OR, USA;
Ex/Em=495/529nm) (26).
Mitochondrial O2•− level was specifically
detected using a MitoSox™ Red mitochondrial
O2•− indicator (Invitrogen Molecular Probes;
Ex/Em=510/580 nm). In brief, 1×10⁶ cells in 60-mm
culture dishes (Nunc) were incubated the designated doses of SAHA
with or without 15 μM caspase inhibitors, 10 ng/ml TNF
family members, 2 mM NAC, Trx1 siRNA or adTrx1 for 24 h. Cells were
then washed in PBS and incubated with 20 μM
H2DCFDA or 5 μM MitoSox Red at 37°C for 30 min.
DCF and MitoSox Red fluorescence were detected using a FACStar flow
cytometer. ROS and mitochondrial O2•− levels
were expressed as MFI, which was calculated by CellQuest software
(Becton-Dickinson).
Detection of intracellular glutathione
(GSH)
Cellular GSH levels were analyzed using a
5-chloromethylfluorescein diacetate dye (CMFDA, Ex/Em=522/595 nm;
Invitrogen Life Technologies) as previously described (30). In brief, 1×10⁶ cells
were incubated in a 60-mm culture dishes (Nunc) with the designated
doses of SAHA with or without 15 μM caspase inhibitors, 2 mM
NAC, Trx1 siRNA or adTrx1 for 24 h. Cells were then washed with PBS
and incubated with 5 μM CMFDA at 37°C for 30 min. CMF
fluorescence intensity was determined using a FACStar flow
cytometer. Negative CMF staining (GSH-depletion) of cells is
expressed as the percentage of (−) CMF cells.
Lactate dehydrogenase (LDH) activity for
the detection of necrosis
Necrosis in cells treated with SAHA and/or TNF
family members was evaluated by LDH kit (Sigma-Aldrich Chemical
Co.). In brief, 1×10⁶ cells in 60-mm culture dish (Nunc)
were incubated with the indicated doses of SAHA and/ or TNF family
members for 24 h. After treatment, the culture media were collected
and centrifuged for 5 min at 1,500 rpm. The supernatant (50
μl) was added to a fresh 96-well plate along with LDH assay
reagent and then incubated at room temperature for 30 min. The
absorbance values were measured at 490 nm using a microplate
reader. LDH release was expressed as the percentage of
extracellular LDH activity compared with the control cells.
Transfection of cells with Trx1
siRNA
Gene silencing of TrxR1 was performed as previously
described (31,32). A non-specific control (CTR) siRNA
duplex [5′-CCUACGCCACCAAUUUC GU(dTdT)-3′] and Trx1 siRNA duplex
[5′-GCAUGCCAACAU UCCAGUU(dTdT)-3′] were purchased from the Bioneer
Corp. (Daejeon, Korea). In brief, 2.5×10⁵ cells in
6-well plates (Nunc) were incubated in RPMI-1640 supplemented with
10% FBS. After 24 h, the cells (∼30–40% confluence) in each well
were transfected with the CTR or Trx1 siRNA duplex [80 pmol in
Opti-MEM (Gibco BRL)] using Lipofectamine 2000, according to the
manufacturer’s instructions (Invitrogen, Brandford, CT, USA). One
day later, the cells were treated with or without 10 μM SAHA
for additional 24 h. The transfected cells were used for western
blot analysis, MTT and cell death assays, and ROS and GSH level
measurements.
Infection of cells with adTrx1
Overexpression of Trx1 was performed using an
adenoviral gene transfer. adLacZ and adTrx1 were obtained from Dr
J. Sadoshima, New Jersey Medical School, Newark, USA. In brief,
5×10⁵ cells in 6-well plates (Nunc) were incubated in
RPMI-1640 supplemented with 10% FBS. The cells (∼50–60% confluence)
in each well were infected with the same titer adLacZ or adTrxR1,
as determined by plague assay. One day later, the cells were
treated with or without 10 μM SAHA for additional 24 h. The
infected cells were collected and used for western blot analysis,
MTT and cell death assays, and ROS and GSH level measurements.
Statistical analysis
The results represent the mean of at least three
independent experiments (mean ± SD). Data were analyzed using
Instat software (GraphPad Prism4, San Diego, CA, USA). The
Student’s t-test or one-way analysis of variance (ANOVA) with
post hoc analysis using Tukey’s multiple comparison test was
used for parametric data. The statistical significance was defined
as p<0.05.
Results
Effects of SAHA on cell growth, cell
death and MMP (ΔΨm) in HeLa cells
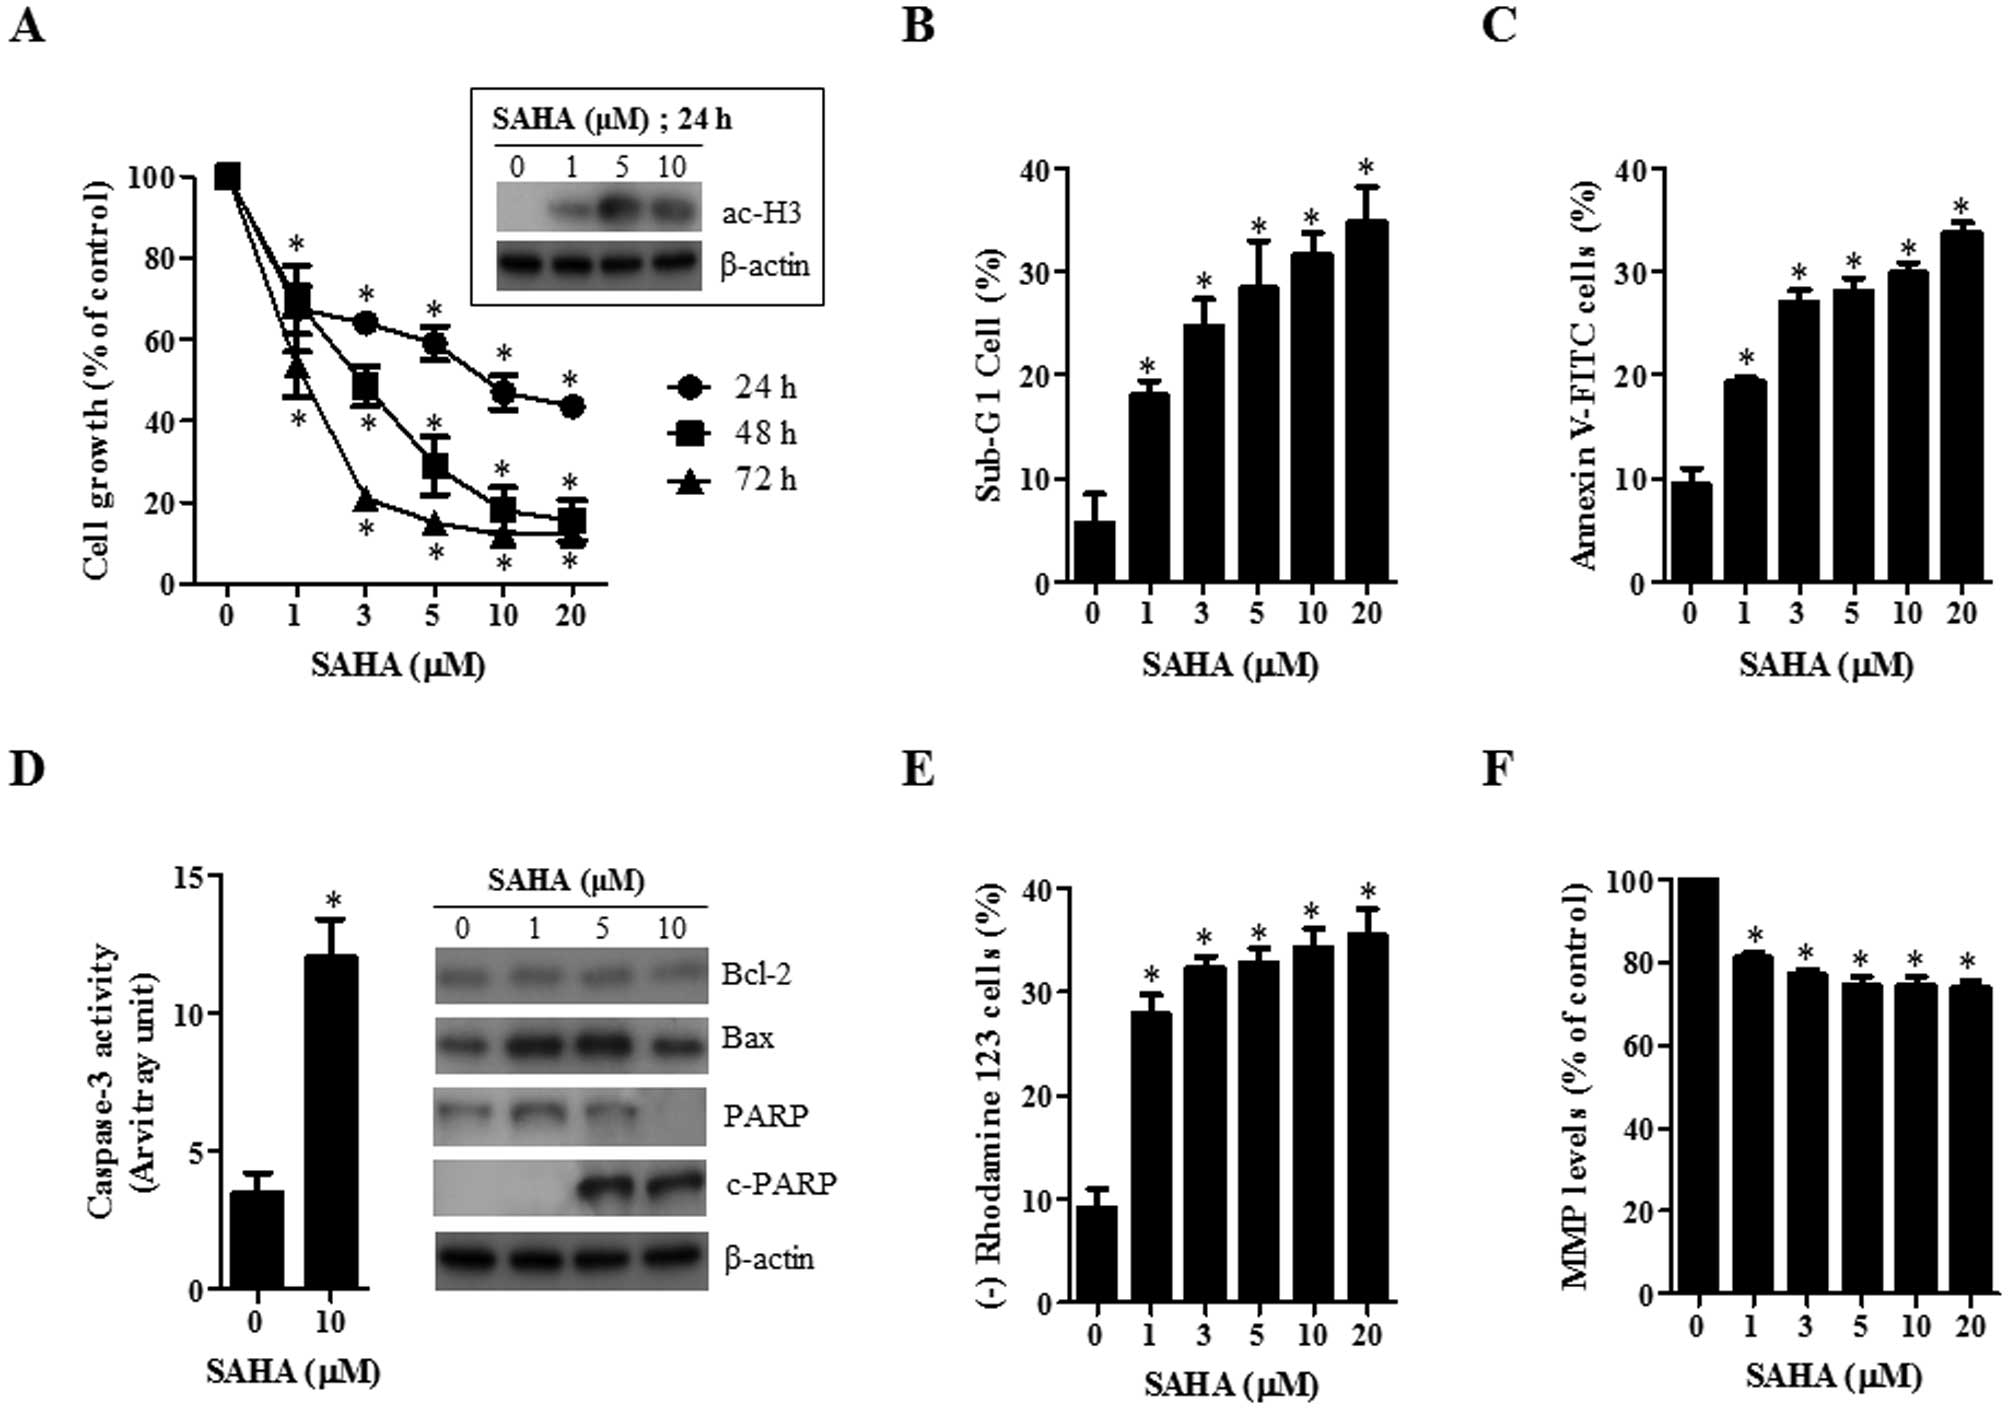
First, the effect of SAHA on the growth inhibition
of HeLa cells was examined using MTT assays. After exposure to SAHA
for 24, 48 and 72 h, the growth of HeLa cells was dose- and
time-dependently decreased with an IC50 of ∼10, 3 and 1
μM at 24, 48 and 72 h, respectively (Fig. 1A). In addition, SAHA increased the
level of acetylated H3 in HeLa cells at 24 h, implying that SAHA
worked as a HADC inhibitor in these cells (Fig. 1A).
As shown in Fig.
1B, SAHA increased the number of sub-G1 cells in HeLa cells in
a dose-dependent manner at 24 h. When HeLa cells were stained with
Annexin V-FITC to evaluate the induction of apoptosis, the
percentages of Annexin V-staining cells were dose-dependently
increased in SAHA-treated HeLa cells (Fig. 1C). In addition, the activity of
caspase-3 was increased in SAHA-treated HeLa cells (Fig. 1D). The examination of the
expressions in apoptotic-related proteins showed that Bcl-2 and Bax
proteins were downregulated and upregulated by SAHA, respectively
(Fig. 1D). The intact of
poly(ADP-ribose) polymerase (PARP) was also decreased and instead
the cleavage form of PARP was induced by SAHA (Fig. 1D). Furthermore, SAHA increased the
percentage of MMP (ΔΨm) loss cells (Fig. 1E) and reduced MMP (ΔΨm)
levels in HeLa cells at 24 h (Fig.
1F).
Effects of SAHA on intracellular ROS and
GSH levels in HeLa cells
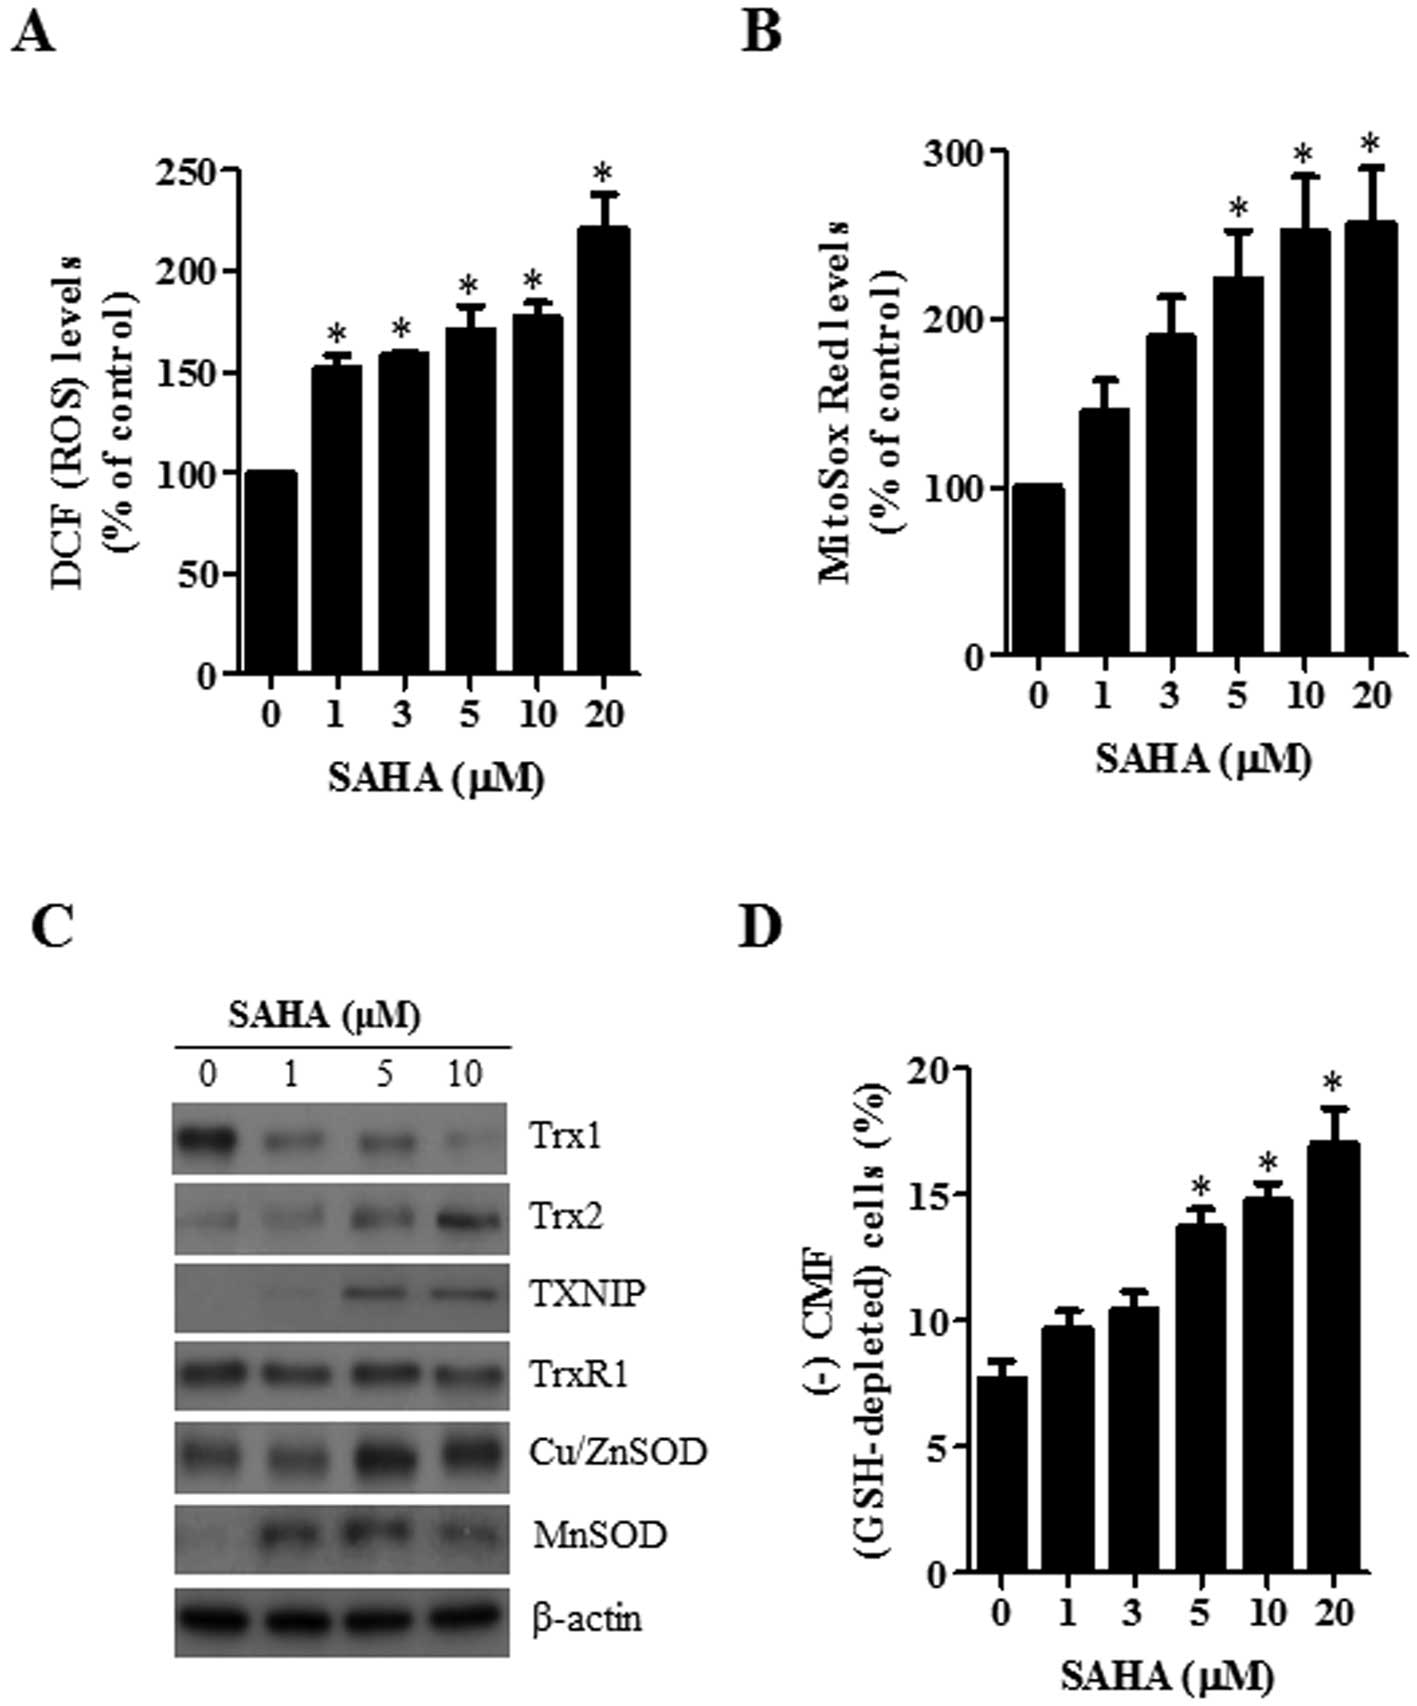
Changes in the intracellular ROS and GSH levels were
investigated in HeLa cells treated with SAHA. As shown in Fig. 2A, SAHA significantly increased the
intracellular ROS (DCF) levels in HeLa cells at 24 h. The level of
red fluorescence derived from MitoSox, which specifically reflects
mitochondrial O2•− accumulation, was markedly
increased in SAHA-treated HeLa cells in a dose-dependent manner at
24 h (Fig. 2B). In addition, the
examination of the expressions in antioxidant-related proteins
showed that the level of Trx1 was downregulated by SAHA whereas the
levels of Trx2, TXNIP, Cu/ZnSOD and MnSOD were upregulated by this
agent (Fig. 2C). With respect to
GSH levels as measured by a CMF fluorescence dye, SAHA
significantly increased the percentages of GSH-depleted cells in
HeLa cells at 24 h (Fig. 2D).
Effects of caspase inhibitors on cell
growth, cell death, ROS and GSH levels in SAHA-treated HeLa
cells
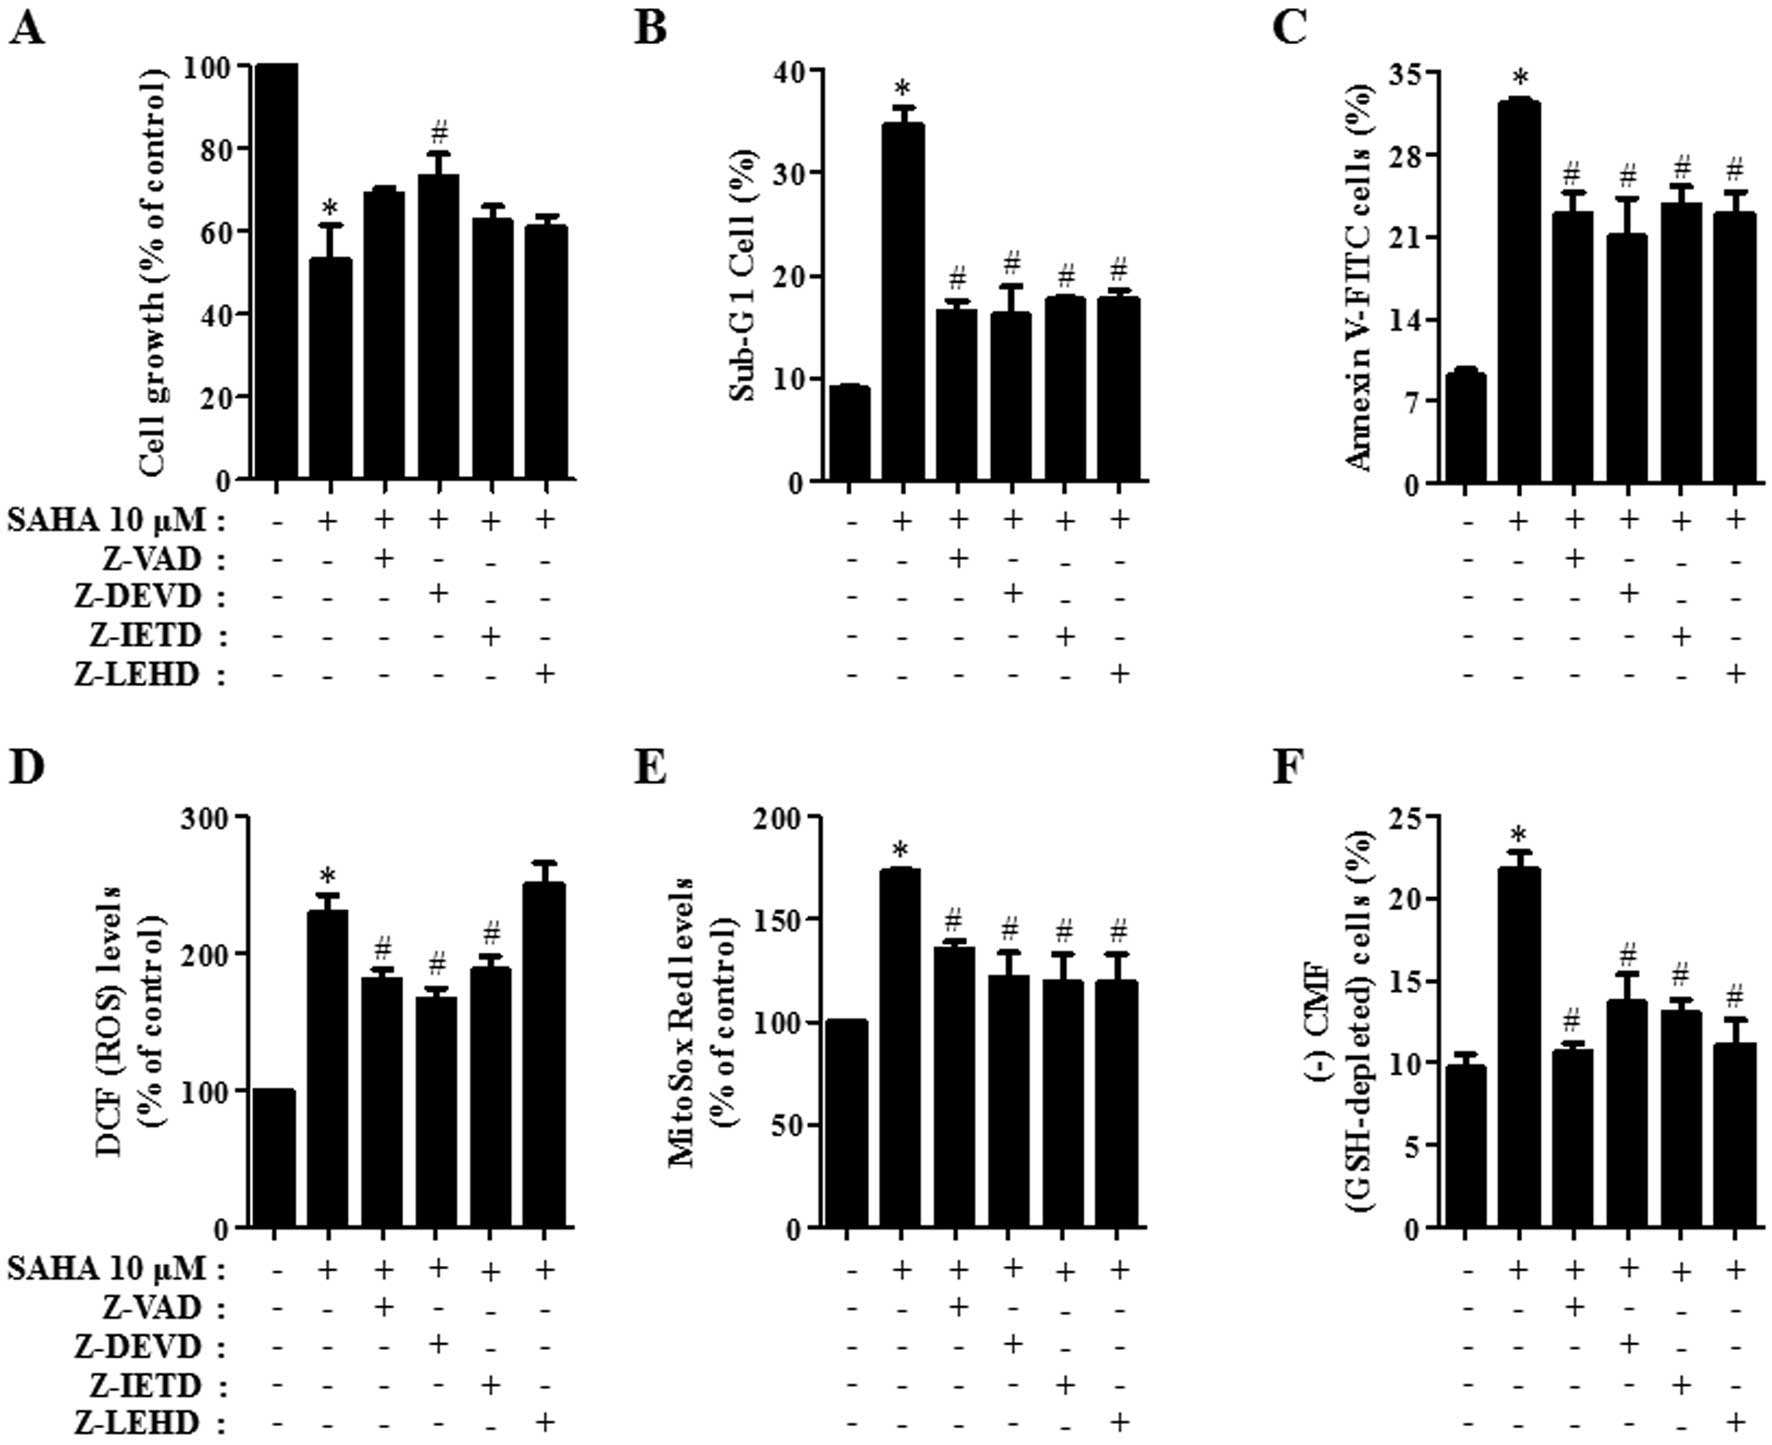
We determined which caspases were involved in the
death of SAHA-treated HeLa cells. For this experiment, we chose 10
μM SAHA as a suitable dose to differentiate the level of
cell death in the presence or absence of each caspase inhibitor
[pan-caspase inhibitor (Z-VAD), caspase-3 inhibitor (Z-DEVD),
caspase-8 inhibitor (Z-IELD), or caspase-9 inhibitor (Z-LEHD)]. A
concentration of 15 μM each caspase inhibitor was used as an
optimal dose in this study since it did not significantly affect
cell death in the control HeLa cells (33). All the caspase inhibitors,
especially Z-DEVD, attenuated cell growth inhibition induced by
SAHA in HeLa cells at 24 h (Fig.
3A). Moreover, all caspase inhibitors attenuated the
percentages of sub-G1 cells in SAHA-treated HeLa cells (Fig. 3B) and they prevented apoptotic cell
death in these cells (Fig. 3C).
Therefore, the activation of various caspases seemed to be involved
in apoptotic HeLa cell death caused by SAHA.
To determine whether the levels of intracellular ROS
and GSH in 10 μM SAHA-treated HeLa cells were changed by
treatment with each caspase inhibitor, ROS and GSH levels in HeLa
cells were assessed at 24 h. The caspase inhibitors except Z-LEHD
significantly reduced ROS (DCF) levels in HeLa cells treated with
SAHA (Fig. 3D). In addition, all
the caspase inhibitors decreased mitochondrial
O2•− level in SAHA-treated HeLa cells
(Fig. 3E). Furthermore, all the
caspase inhibitors significantly prevented GSH depletion caused by
SAHA (Fig. 3F).
Effects of TNF-family members on cell
death, LDH release, ROS and GSH levels in SAHA-treated HeLa
cells
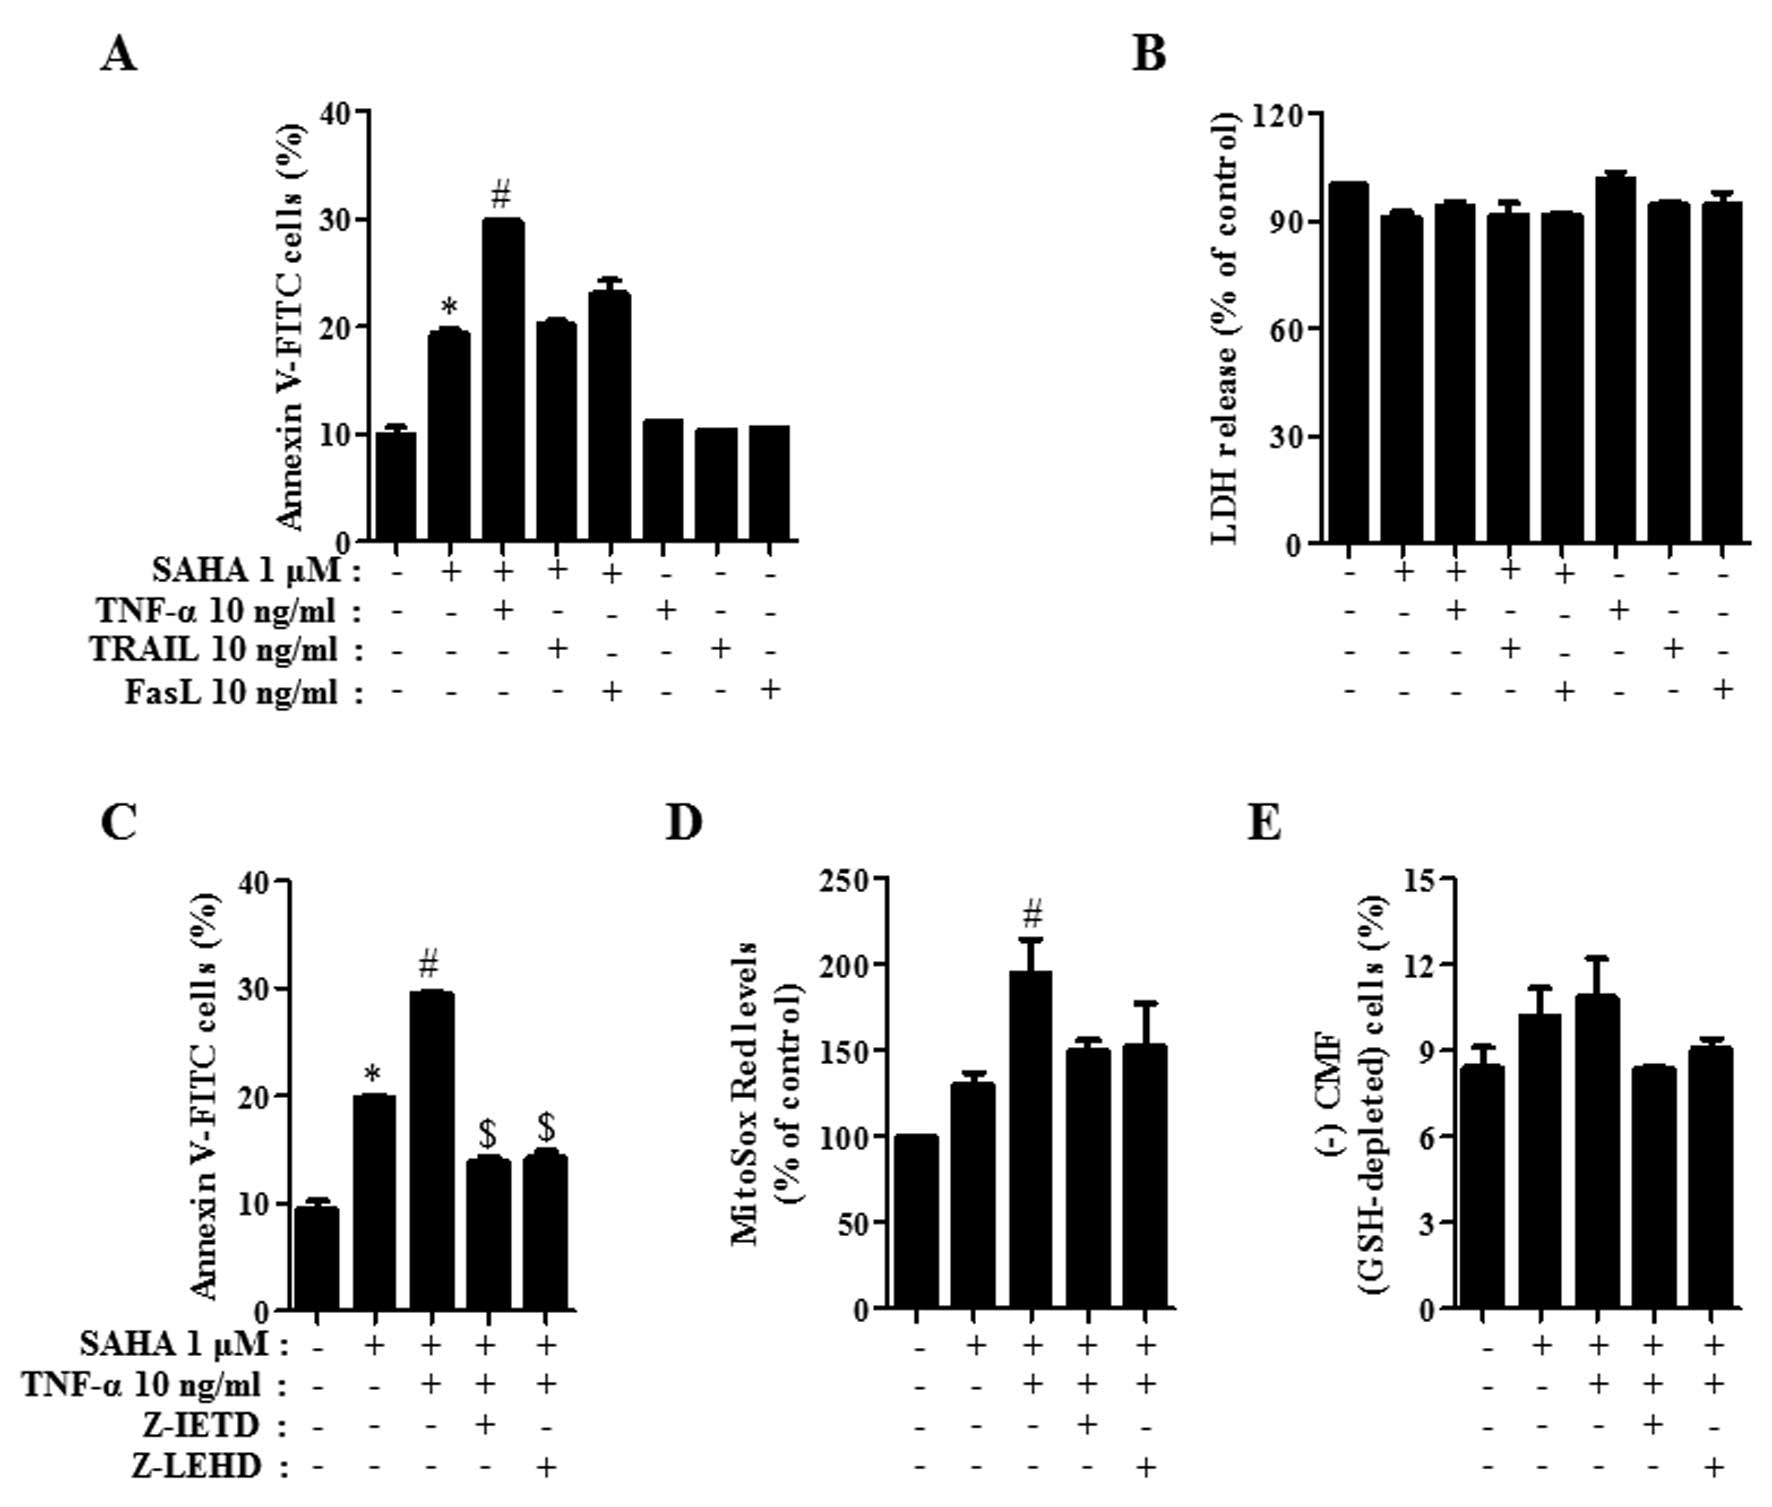
It has been reported that SAHA and TNF-family
members especially, TRAIL synergistically induce apoptosis in a
variety of cancer cells such as breast, liver and lymphoma cells
(34–36). Therefore, we investigated whether
TNF-family members affect HeLa cell death induced by SAHA. As shown
in Fig. 4A, TNF-α among the tested
TNF-family members significantly intensified the percentage of
Annexin V-FITC-positive cells in 1 μM SAHA-treated HeLa
cells and FasL also slightly increased the percentage of those
(Fig. 4A). Each TNF-family member
alone did not induce apoptosis in the control HeLa cells (Fig. 4A). Since SAHA and/or TNF-family
members can induce necrosis in HeLa cells, the status of necrosis
was assessed using the LDH release. Treatment with 1 μM SAHA
in the presence of each TNF-family member did not lead to LDH
release in HeLa cells and each TNF-family member alone did not
induce LDH release either (Fig.
4B). Treatment with 10 μM SAHA did not induce necrosis
in HeLa cells (data not shown). When Z-IETD (caspase-8 inhibitor)
and Z-LEHD (caspase-9 inhibitor) were co-incubated in HeLa cells
co-treated with SAHA and TNF-α, these inhibitors significantly
prevented apoptosis caused by co-treatment with SAHA and TNF-α
(Fig. 4C). In relation to ROS and
GSH levels, TNF-α elevated mitochondrial O2•−
level in 1 μM SAHA-treated HeLa cells and it marginally
increased GSH depletion in these cells (Fig. 4D and E). Z-IETD and Z-LEHD
attenuated the mitochondrial O2•− levels in
HeLa cells co-treated with SAHA and TNF-α and they prevented GSH
depletion in these cells (Fig. 4D and
E).
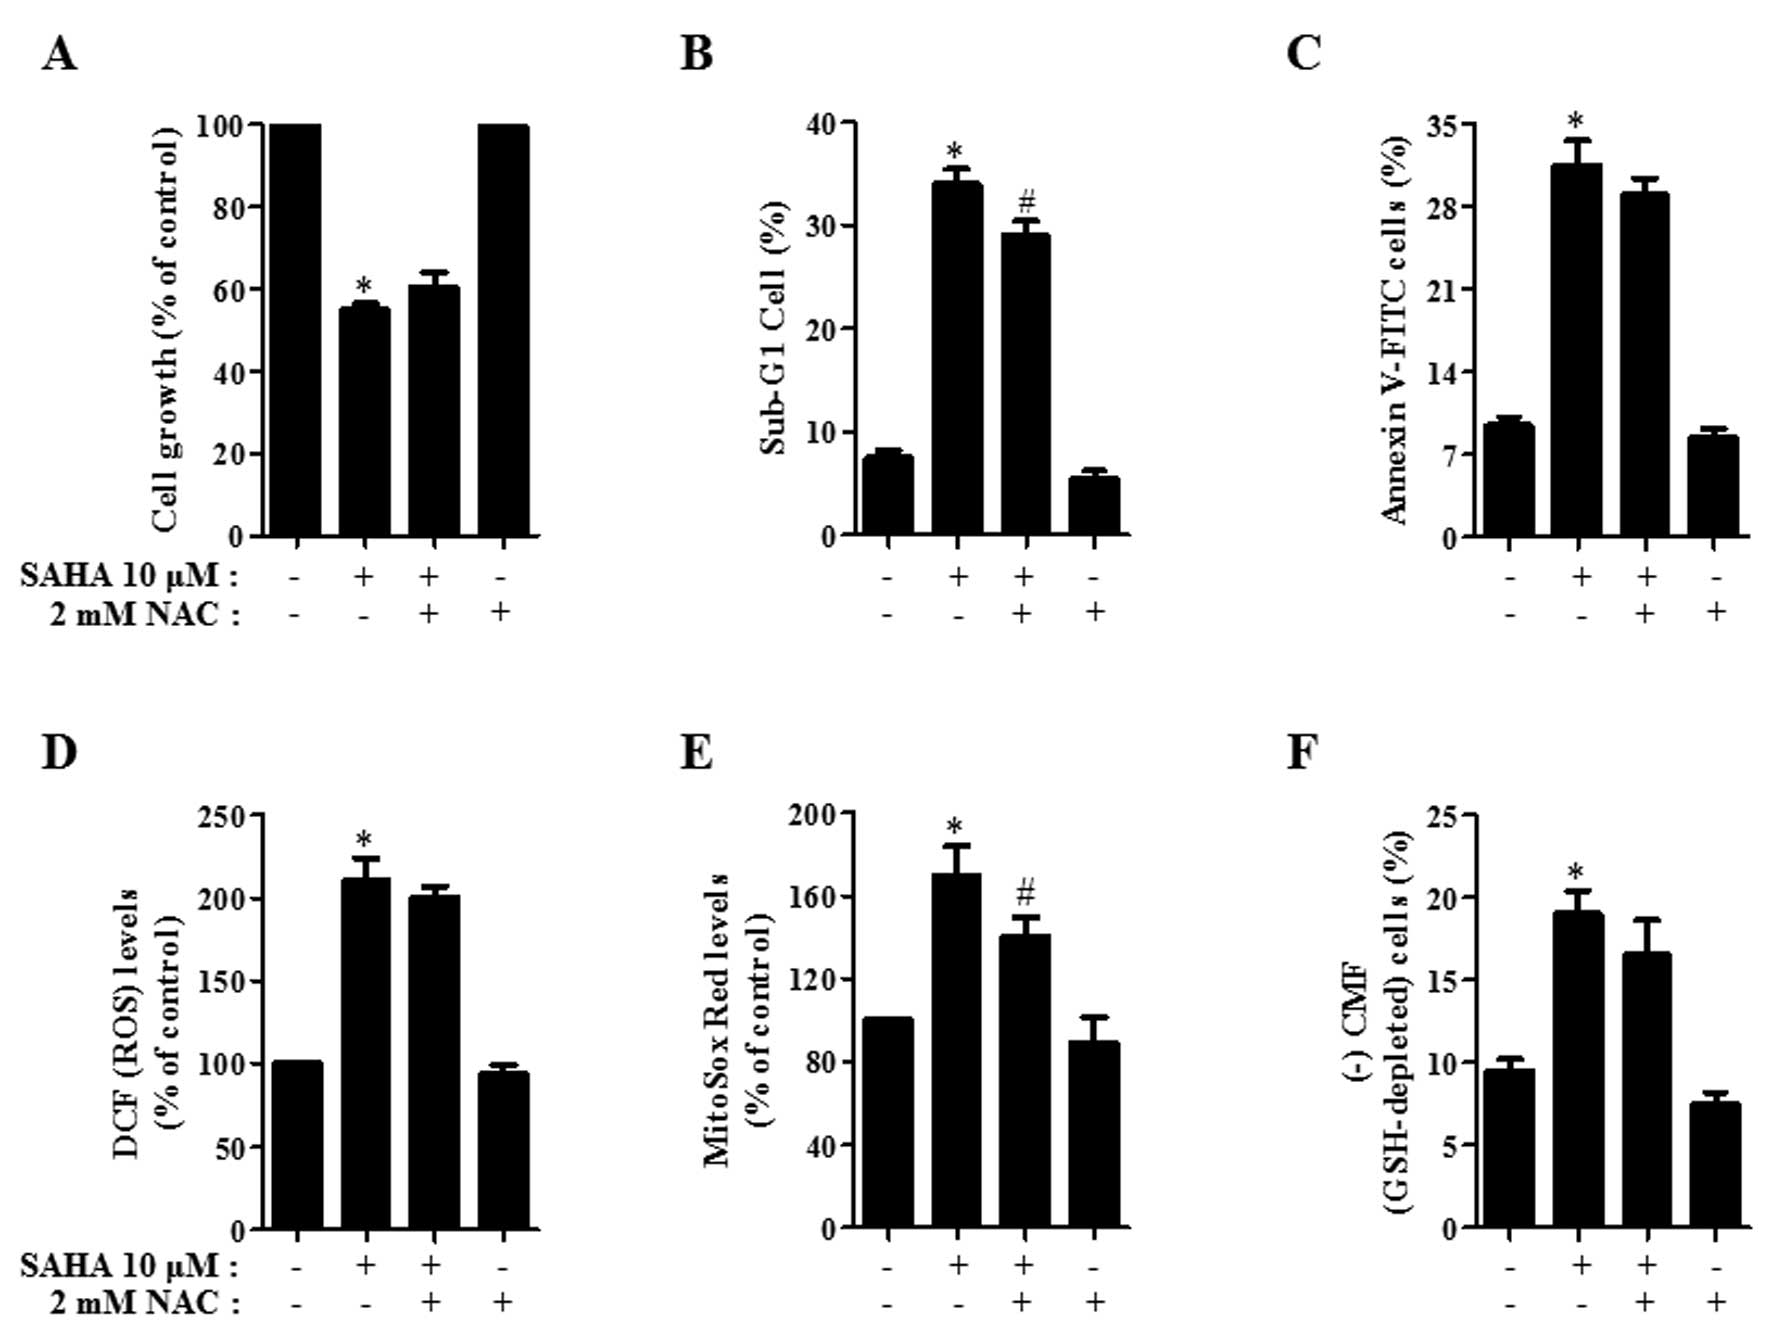
Effects of NAC on cell growth, death, ROS
and GSH levels in SAHA-treated HeLa cells
Next, the effects of NAC on cell growth, cell death,
ROS and GSH levels in 10 μM SAHA-treated HeLa cells were
assessed at 24 h. As shown in Fig.
5A, NAC slightly recovered cell growth inhibition induced by
SAHA. NAC also prevented cell death in SAHA-treated HeLa cells
(Fig. 5B and C). When assessed
whether NAC influences ROS levels in SAHA-treated HeLa cells, NAC
reduced ROS levels, especially mitochondrial
O2•− in these cells (Fig. 5D and E). Moreover, NAC attenuated
GSH depletion in SAHA-treated HeLa cells (Fig. 5F).
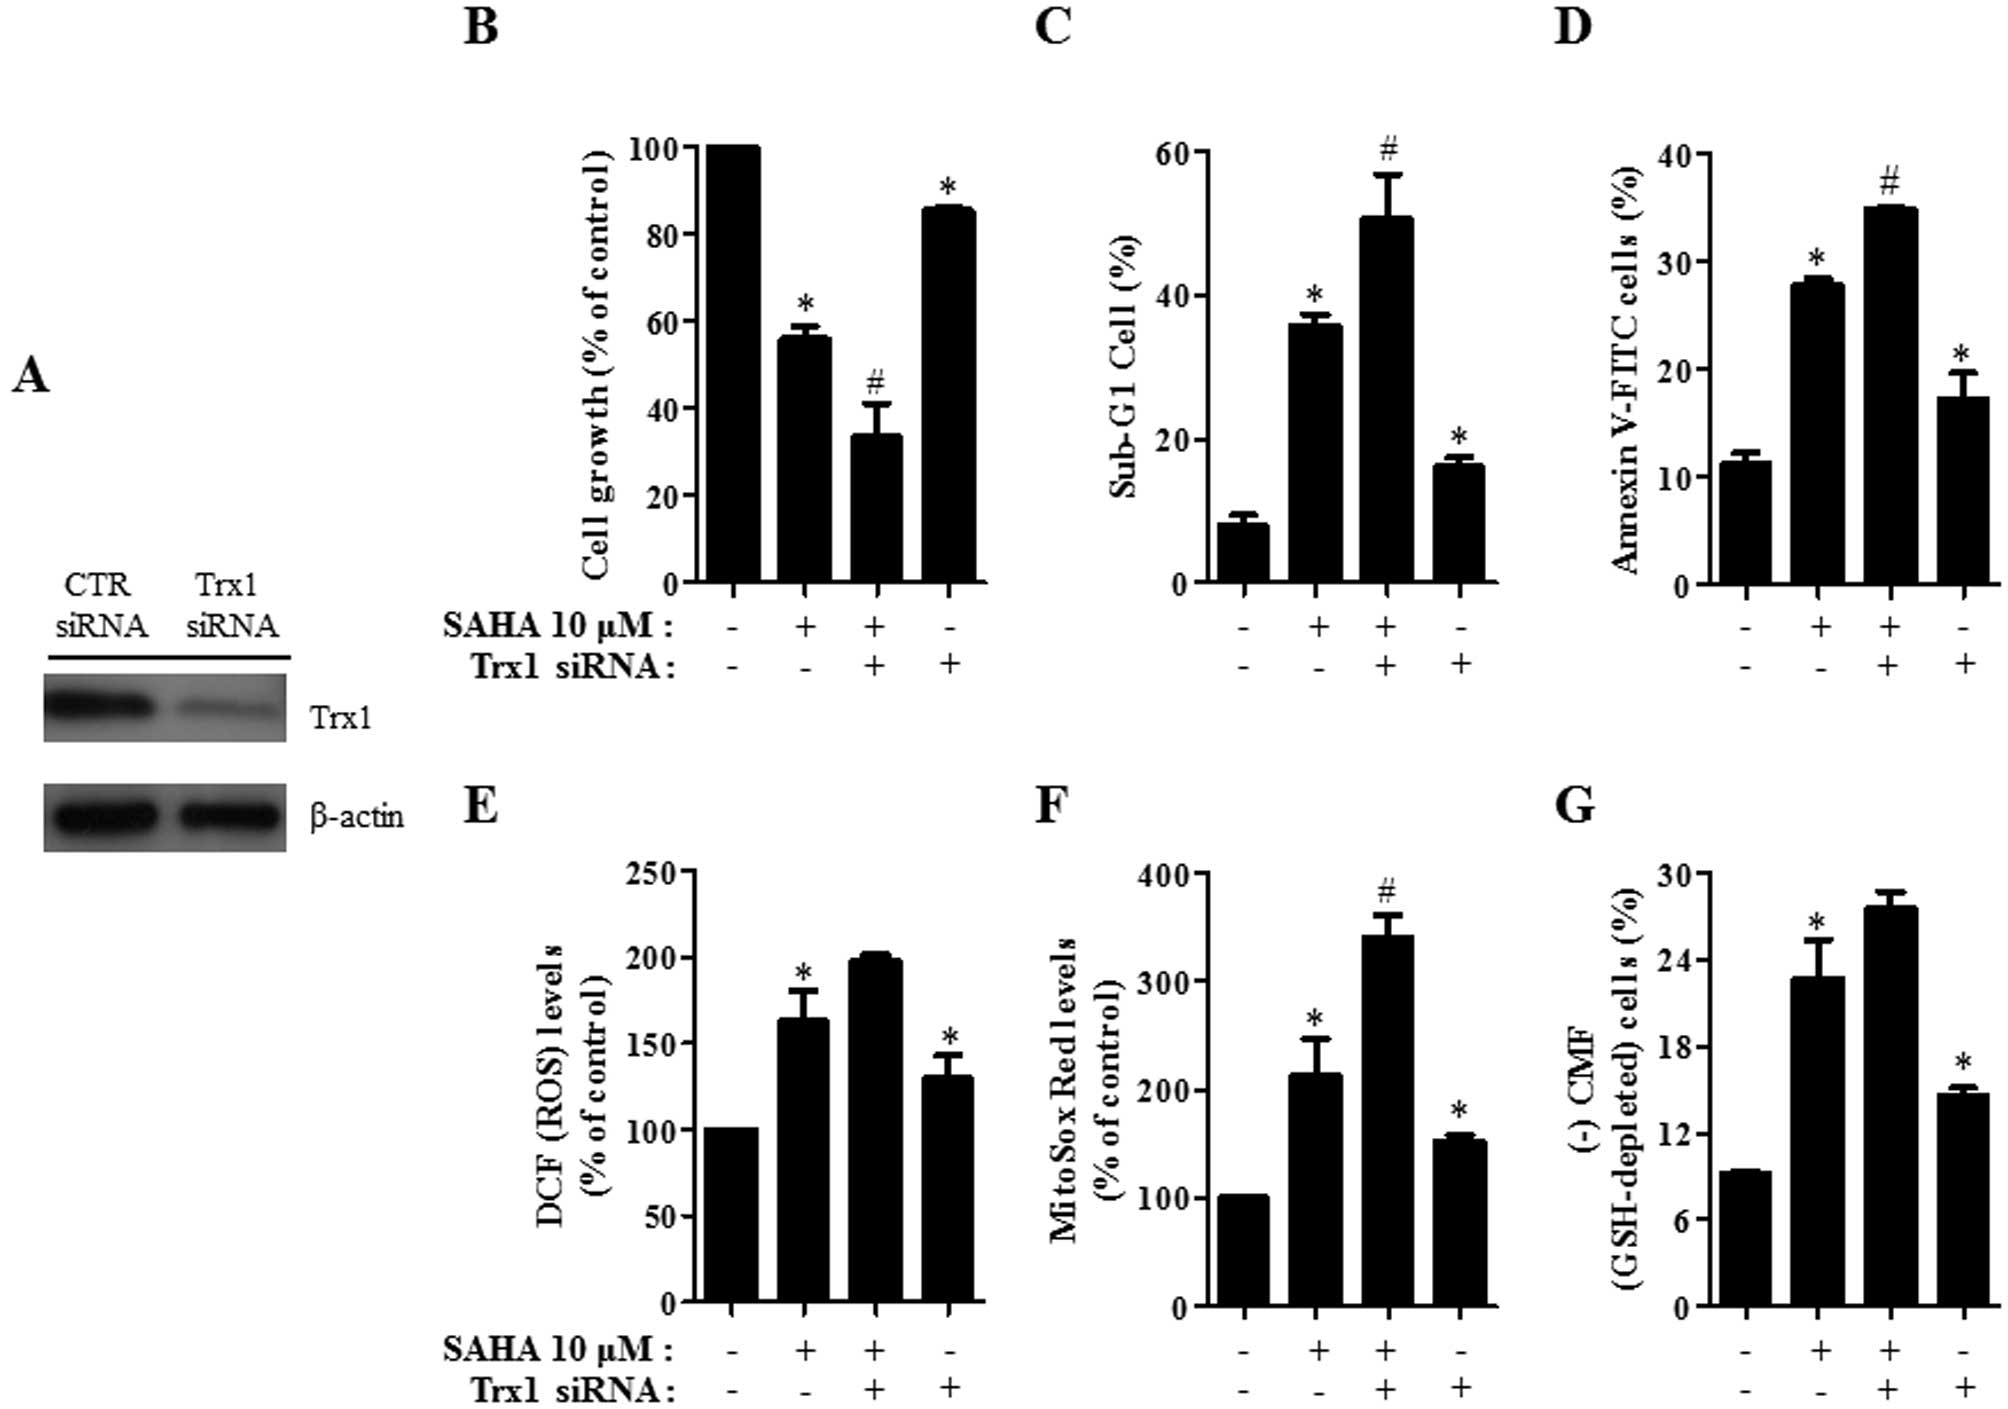
Effects of Trx1 siRNA and adTrx1 on cell
growth, cell death, ROS and GSH levels in SAHA-treated HeLa
cells
Because the level of Trx1 among other antioxidant
proteins was down-regulated in HeLa cells by SAHA, it was
hypothesized that a change in Trx1 level influences cell growth,
cell death, ROS and GSH levels in SAHA-treated HeLa cells. To
investigate this possibility, HeLa cells were transfected with
either CTR siRNA or Trx1 siRNA for the downregulation of Trx1 and
they were infected with either adLacZ or adTrx1 for the
overexpression of this protein. Trx1 level decreased greatly in
HeLa cells transfected with Trx1 siRNA (Fig. 6A). As shown in Fig. 6B, treatment with Trx1 siRNA
significantly enhanced cell growth inhibition in SAHA-treated HeLa
cells and inhibited cell growth in the control HeLa cells. In
addition, the percentages of sub-G1 and Annexin V-FITC-positive
cells were augmented by Trx1 siRNA in SAHA-treated HeLa cells
(Fig. 6C and D). Trx1 siRNA alone
induced cell death in the control HeLa cells (Fig. 6C and D). With respect to ROS and
GSH levels, treatment with Trx1 siRNA increased ROS levels
including mitochondrial O2•− in SAHA-treated
HeLa cells and in the control HeLa cells (Fig. 6E and F). GSH depletion in
SAHA-treated HeLa cells was enhanced by Trx1 siRNA and this siRNA
significantly induced GSH depletion in the control HeLa cells
(Fig. 6G).
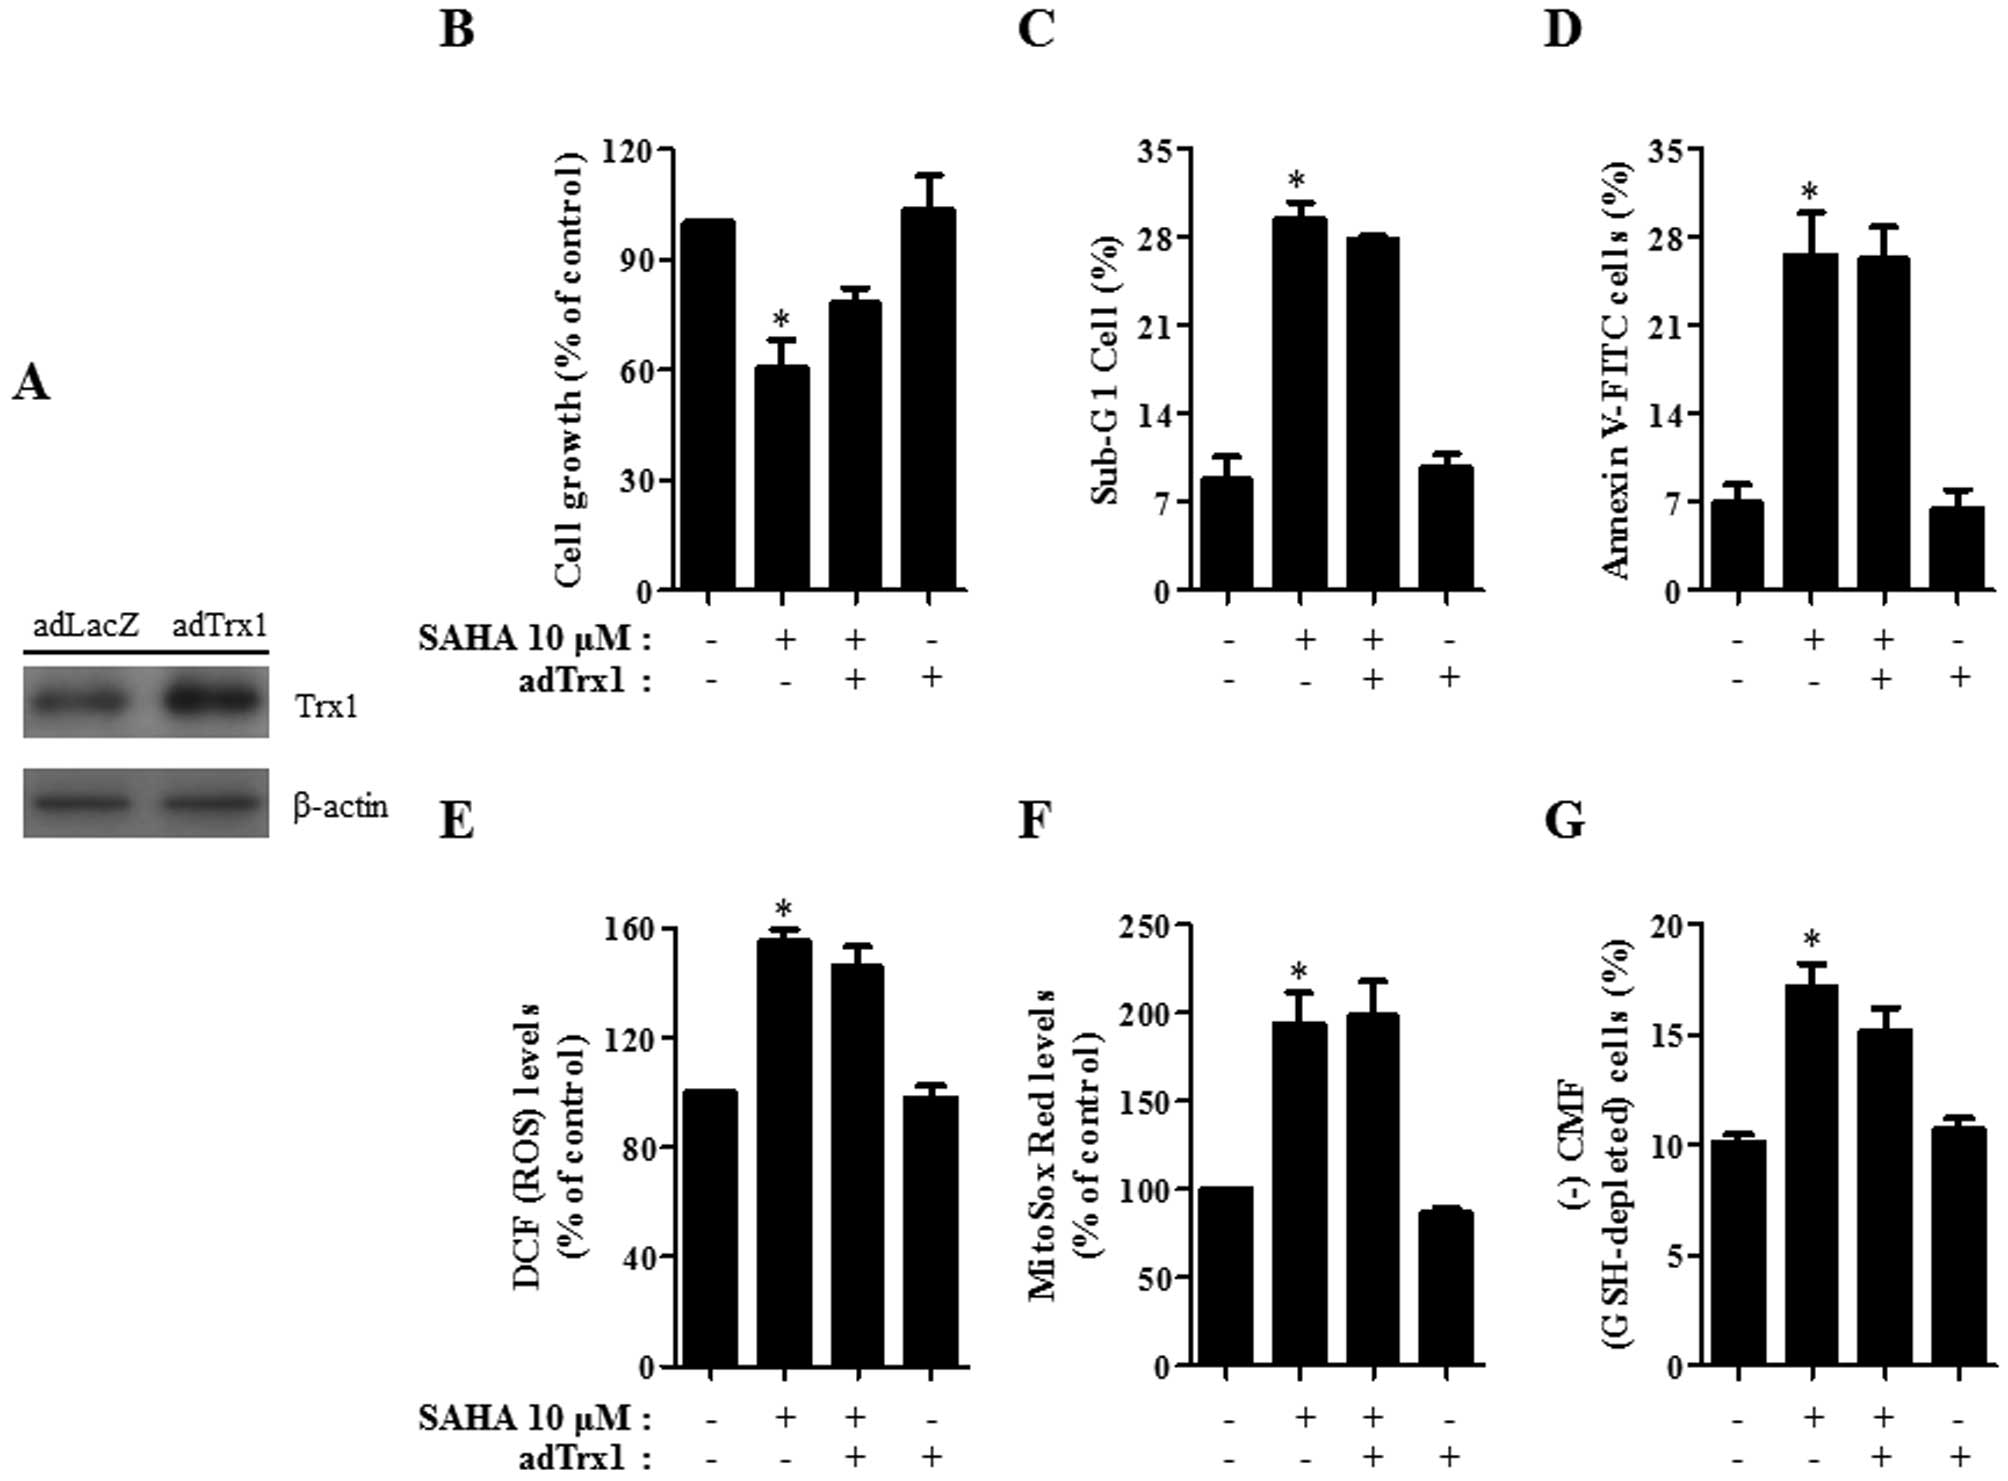
As shown in Fig.
7A, HeLa cells infected with adTrx1 showed an increase in Trx1
protein level compared with cells infected with the control adLacZ.
Administration with adTrx1 slightly attenuated cell growth
inhibition and cell death in SAHA-treated HeLa cells (Fig. 7B–D). This administration seemed to
decrease ROS level in the cells (Fig.
7E). However, mitochondrial O2•− level
was not altered by adTrx1 in SAHA-treated HeLa cells (Fig. 7F). GSH depletion in SAHA-treated
HeLa cells was marginally attenuated by adTrx1 (Fig. 7G).
Discussion
In the present study, we focused on assessing the
effects of SAHA on HeLa cervical cancer cells in relation to cell
death, ROS and GSH levels. Since SAHA increased the level of
acetylated histone H3 in HeLa cells, SAHA appeared to act as an
HDAC inhibitor in HeLa cells. SAHA decreased the growth of HeLa
cells dose- and time-dependently. When the cell cycle distribution
was examined, SAHA did not induce any specific phase arrest of the
cell cycle in HeLa cells at 24 h (data not shown), instead, SAHA
increased the number of sub-G1 cells and induced apoptosis, which
was accompanied by the cleavage of PARP. This agent also led to
loss of MMP (ΔΨm) and decreased MMP (ΔΨm)
levels in HeLa cells. It has been suggested that a high ratio of
Bax to Bcl-2 can cause the collapse of (ΔΨm) (37). Likewise, loss of apoptosis and MMP
(ΔΨm) caused by SAHA were accompanied by the
downregulation of Bcl-2 and upregulation of Bax. These results
suggested that cell death caused by SAHA was correlated with the
collapse of MMP (ΔΨm) via a high ratio of Bax to
Bcl-2.
When it was determined which caspases were involved
in growth inhibition and apoptosis in SAHA-treated HeLa cells, all
the tested caspase inhibitors prevented SAHA-induced HeLa cell
death. The activity of caspase-3 was also increased by SAHA in HeLa
cells. It is reported that SAHA and TNF-family members, especially
TRAIL synergistically induce apoptosis in many cancer cells such as
breast, liver and lymphoma cells (34–36).
According to the present data, TNF-α synergistically enhanced cell
death in SAHA-treated HeLa cells. SAHA and/or TNF-α did not induce
LDH release, implying that HeLa cell death caused by SAHA and/or
TNF-α did not result from the necrotic pathway. In particular,
Z-IETD and Z-LEHD significantly attenuated HeLa cell death induced
by co-treatment with SAHA and TNF-α. Therefore, the apoptotic cell
death caused by SAHA and/or TNF-α was mediated by the extrinsic
apoptotic pathway of caspase-8 as well as the intrinsic apoptotic
pathway of caspase-9.
HDAC inhibitor generates ROS in solid tumor and
leukemia cells and induces apoptosis in these cells (38). Oxidative stress resulted from the
increased ROS level might be involved in HDAC inhibitor-induced
cell death. In fact, it is reported that NAC prevents cell death
induced by HDAC inhibitors (39).
Similarly, ROS levels including mitochondrial
O2•− were significantly increased in
SAHA-treated HeLa cells. Caspase inhibitors showing the
anti-apoptotic effects appeared to decrease ROS levels, especially
mitochondrial O2•−. In particular, caspase-9
inhibitor (Z-LEHD) did not reduce ROS level derived from DCF
fluorescence dye but significantly decreased mitochondrial
O2•− level in SAHA-treated HeLa cells.
Furthermore, TNF-α showing an enhancement in apoptosis elevated the
mitochondrial O2•− level in SAHA-treated HeLa
cells. These data suggested that changes in mitochondrial
O2•− levels are closely related to apoptotic
cell death caused by SAHA. Moreover, NAC attenuated cell growth
inhibition and cell death in SAHA-treated HeLa cells and this agent
significantly reduced mitochondrial O2•−
level in these cells. Taken together, SAHA-induced HeLa cell death
was mediated by oxidative stress mainly derived from mitochondrial
O2•−.
Apoptotic effects are inversely proportional to GSH
content (40–42). Similarly, SAHA increased the number
of GSH-depleted HeLa cells. All the caspase inhibitors and NAC
prevented GSH depletion in SAHA-treated HeLa cells. In addition,
TNF-α marginally increased GSH depletion induced by SAHA. These
results support the hypothesis that the intracellular GSH content
has a decisive effect on cell death (29,40,43).
SAHA alters the expression levels of many
antioxidant proteins. Especially, SAHA markedly decreased Trx1
expression level. This result was similar to the report that SAHA
decreased the level of Trx1 in cancer cells (19). The downregulation of Trx1
consequently seemed to influence an increase in ROS levels
including mitochondrial O2•− in SAHA-treated
HeLa cells. However, the group of Holmgren reported that SAHA did
not decrease Trx1 level in HeLa cells (20). Therefore, Trx1 levels could be
changed depending on the incubation times and doses of SAHA.
Previous studies reported that SAHA transcriptionally increases the
level of TXNIP, which is an endogenous Trx1 inhibitor (19,20).
Likewise, SAHA increases the level of TXNIP in HeLa cells. In
addition, SAHA increased the levels of Trx2 and MnSOD. The
upregulation of these antioxidants might be induced by the
increased mitochondrial O2•− level and also
be transcriptionally induced by the inhibition of HDAC by SAHA.
These results imply that the changes of antioxidant protein levels
by SAHA affect ROS levels and they can also be regulated by ROS
levels reciprocally. The transcriptional regulation of these
antioxidant genes by HDAC inhibitors needs to be further
studied.
The Trx antioxidant system consists of Trx, TrxR and
NADPH, which is an important enzymatic network to maintain cellular
redox homeostasis (8).
Particularly, Trx1 is overexpressed in many cancer cells including
colorectal and breast cancer and this overexpression is responsible
for cellular resistance to anticancer drugs (9–11).
Moreover, upregulation of Trx in invasive cervical carcinomas has
been reported (23). Therefore,
Trx1 could be a new therapeutic target for cancer treatment. Other
studies have reported that suppression of Trx1 can enhance
cytotoxicity of anticancer drugs in human liver carcinoma and
diffuse large B-cell lymphoma cells (11,44).
Likewise, treatment with Trx1 siRNA significantly intensified cell
growth inhibition and cell death in SAHA-treated HeLa cells. Trx1
siRNA also increased mitochondrial O2•− level
and GSH depletion in SAHA-treated HeLa cells. In contrast, the
overexpression of Trx1 marginally attenuated growth inhibition and
death caused by SAHA and this overexpression also slightly reduced
ROS level and GSH depletion in SAHA-treated HeLa cells. In
addition, Trx1 siRNA induced cell growth inhibition and cell death
in the control HeLa cells and it increased ROS levels and GSH
depletion in these cells. These results suggest that Trx1 has a
protective role against cell death and oxidative stress in HeLa
cells.
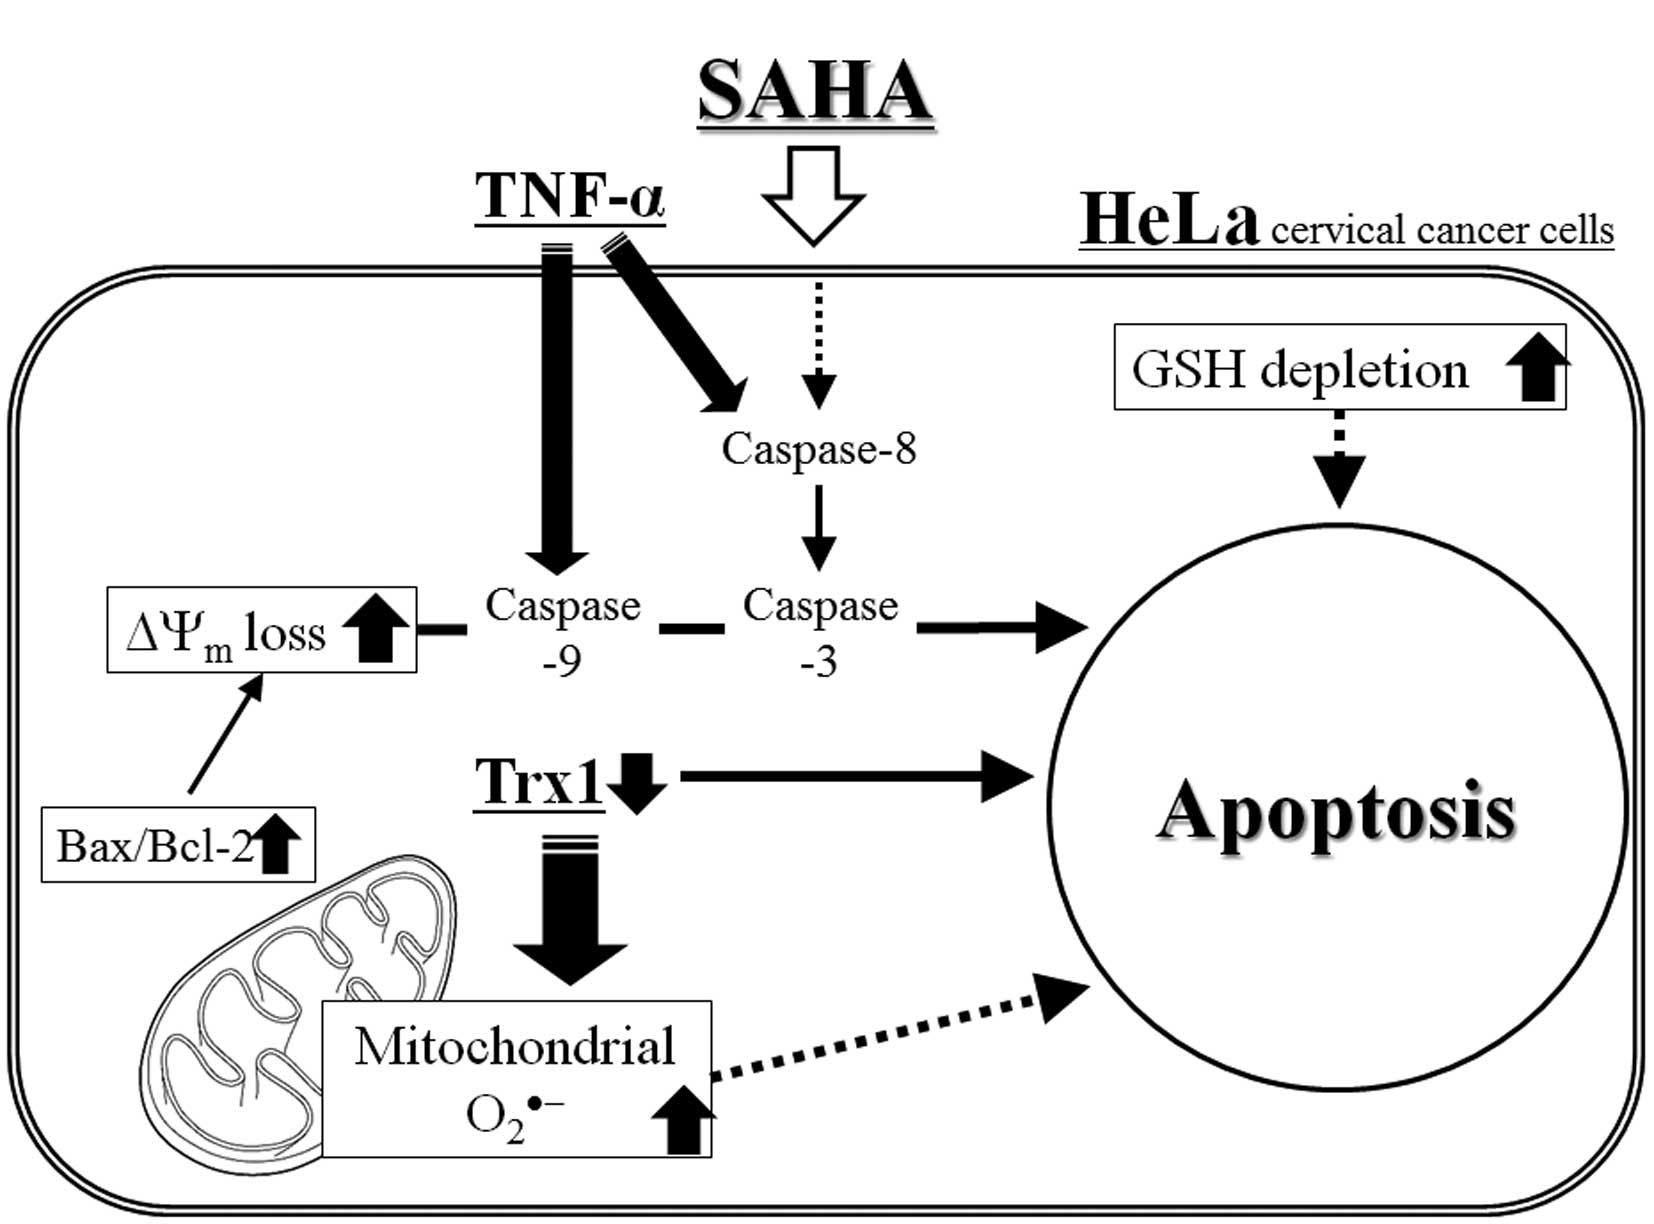
In conclusion, as depicted in Fig. 8, SAHA induced growth inhibition and
apoptosis in HeLa cervical cancer cells, which was accompanied by
the intracellular increases in ROS levels and GSH depletion. TNF-α
augmented apoptosis and ROS levels in SAHA-treated HeLa cells
whereas NAC attenuated the levels in these cells. In addition, Trx1
level was closely correlated with cell death and ROS levels in
SAHA-treated HeLa cells. The present study provides important
insight into the anticancer effects of SAHA on HeLa cells with
respect to oxidative stress and Trx1.
Abbreviations:
|
SAHA
|
suberoylanilide hydroxamic acid;
|
|
HDAC
|
histone deacetylase;
|
|
ROS
|
reactive oxygen species;
|
|
MMP (ΔΨm)
|
mitochondrial membrane potential;
|
|
FBS
|
fetal bovine serum;
|
|
MTT
|
3-(4,5-dimethylthiazol-2-yl)-2,5-diphenyltetrazolium bromide;
|
|
PI
|
propidium iodide;
|
|
FITC
|
fluorescein isothiocyanate;
|
|
Z-VAD-FMK
|
benzyloxycarbonyl-Val-Ala-Asp-fluoromethylketone;
|
|
Z-DEVD-FMK
|
benzyloxycarbonyl-Asp-Glu-Val-Asp-fluoromethylketone;
|
|
Z-IETD-FMK
|
benzyloxycarbonyl-Ile-Glu-Thr-Asp-fluoromethylketone;
|
|
Z-LEHD-FMK
|
benzyloxycarbonyl-Leu-Glu-His-Asp-fluoromethylketone;
|
|
TNF-α
|
tumor necrosis factor-α;
|
|
TRAIL
|
TNF-related apoptosis-inducing
ligand;
|
|
FasL
|
Fas ligand;
|
|
LDH
|
lactate dehydrogenase;
|
|
NAC
|
N-acetyl cysteine;
|
|
H2DCFDA
|
2′,7′-dichlorodihydrofluorescein
diacetate;
|
|
DHE
|
dihydroethidium;
|
|
GSH
|
glutathione;
|
|
CMFDA
|
5-chloromethylfluorescein
diacetate;
|
|
Trx
|
thioredoxin;
|
|
TrxR
|
thioredoxin reductase;
|
|
Cu/Zn SOD
|
copper zinc superoxide dismutase;
|
|
MnSOD
|
manganese superoxide dismutase
|
Acknowledgements
This study was supported by the
National Research Foundation of Korea (NRF) grant funded by the
Korea government (MSIP) (no. 2008-0062279) and supported by the
Basic Science Research Program through the National Research
Foundation of Korea (NRF) funded by the Ministry of Education
(2013006279).
References
|
1.
|
Bae YS, Oh H, Rhee SG and Yoo YD:
Regulation of reactive oxygen species generation in cell signaling.
Mol Cells. 32:491–509. 2011. View Article : Google Scholar : PubMed/NCBI
|
|
2.
|
Bergamini CM, Gambetti S, Dondi A and
Cervellati C: Oxygen, reactive oxygen species and tissue damage.
Curr Pharm Des. 10:1611–1626. 2004. View Article : Google Scholar : PubMed/NCBI
|
|
3.
|
Hiraishi H, Terano A, Razandi M, Sugimoto
T, Harada T and Ivey KJ: Role of cellular superoxide dismutase
against reactive oxygen metabolite injury in cultured bovine aortic
endothelial cells. J Biol Chem. 267:14812–14817. 1992.
|
|
4.
|
Fiser B, Szori M, Jojart B, Izsak R,
Csizmadia IG and Viskolcz B: Antioxidant potential of glutathione:
a theoretical study. J Phys Chem B. 115:11269–11277. 2011.
View Article : Google Scholar
|
|
5.
|
Habib GM: Arsenite causes down-regulation
of Akt and c-Fos, cell cycle dysfunction and apoptosis in
glutathione-deficient cells. J Cell Biochem. 110:363–371.
2010.PubMed/NCBI
|
|
6.
|
Kim SJ, Jung HJ and Lim CJ: Disruption of
redox homeostasis and induction of apoptosis by suppression of
glutathione synthetase expression in a mammalian cell line. Free
Radic Res. 45:1040–1051. 2011. View Article : Google Scholar : PubMed/NCBI
|
|
7.
|
Collet JF and Messens J: Structure,
function, and mechanism of thioredoxin proteins. Antioxid Redox
Signal. 13:1205–1216. 2010. View Article : Google Scholar : PubMed/NCBI
|
|
8.
|
Lu J and Holmgren A: Thioredoxin system in
cell death progression. Antioxid Redox Signal. 17:1738–1747. 2012.
View Article : Google Scholar : PubMed/NCBI
|
|
9.
|
Noike T, Miwa S, Soeda J, Kobayashi A and
Miyagawa S: Increased expression of thioredoxin-1, vascular
endothelial growth factor, and redox factor-1 is associated with
poor prognosis in patients with liver metastasis from colorectal
cancer. Hum Pathol. 39:201–208. 2008. View Article : Google Scholar : PubMed/NCBI
|
|
10.
|
Karlenius TC, Shah F, Di Trapani G, Clarke
FM and Tonissen KF: Cycling hypoxia up-regulates thioredoxin levels
in human MDA-MB-231 breast cancer cells. Biochem Biophys Res
Commun. 419:350–355. 2012. View Article : Google Scholar : PubMed/NCBI
|
|
11.
|
Li C, Thompson MA, Tamayo AT, et al:
Over-expression of Thioredoxin-1 mediates growth, survival, and
chemoresistance and is a druggable target in diffuse large B-cell
lymphoma. Oncotarget. 3:314–326. 2012.PubMed/NCBI
|
|
12.
|
Icardi L, De Bosscher K and Tavernier J:
The HAT/HDAC interplay: multilevel control of STAT signaling.
Cytokine Growth Factor Rev. 23:283–291. 2012. View Article : Google Scholar : PubMed/NCBI
|
|
13.
|
Lu Z, Luo RZ, Peng H, et al: E2F-HDAC
complexes negatively regulate the tumor suppressor gene ARHI in
breast cancer. Oncogene. 25:230–239. 2006.PubMed/NCBI
|
|
14.
|
Lehmann A, Denkert C, Budczies J, et al:
High class I HDAC activity and expression are associated with
RelA/p65 activation in pancreatic cancer in vitro and in vivo. BMC
Cancer. 9:3952009. View Article : Google Scholar : PubMed/NCBI
|
|
15.
|
Wang L, Zou X, Berger AD, et al: Increased
expression of histone deacetylaces (HDACs) and inhibition of
prostate cancer growth and invasion by HDAC inhibitor SAHA. Am J
Transl Res. 1:62–71. 2009.PubMed/NCBI
|
|
16.
|
Shankar S and Srivastava RK: Histone
deacetylase inhibitors: mechanisms and clinical significance in
cancer: HDAC inhibitor-induced apoptosis. Adv Exp Med Biol.
615:261–298. 2008. View Article : Google Scholar : PubMed/NCBI
|
|
17.
|
Chen MY, Liao WS, Lu Z, et al: Decitabine
and suberoylanilide hydroxamic acid (SAHA) inhibit growth of
ovarian cancer cell lines and xenografts while inducing expression
of imprinted tumor suppressor genes, apoptosis, G2/M arrest, and
autophagy. Cancer. 117:4424–4438. 2011. View Article : Google Scholar
|
|
18.
|
An Z, Gluck CB, Choy ML and Kaufman LJ:
Suberoylanilide hydroxamic acid limits migration and invasion of
glioma cells in two and three dimensional culture. Cancer Lett.
292:215–227. 2010. View Article : Google Scholar : PubMed/NCBI
|
|
19.
|
Butler LM, Zhou X, Xu WS, et al: The
histone deacetylase inhibitor SAHA arrests cancer cell growth,
up-regulates thioredoxin-binding protein-2, and down-regulates
thioredoxin. Proc Natl Acad Sci USA. 99:11700–11705. 2002.
View Article : Google Scholar : PubMed/NCBI
|
|
20.
|
Ungerstedt J, Du Y, Zhang H, Nair D and
Holmgren A: In vivo redox state of human thioredoxin and redox
shift by the histone deacetylase inhibitor suberoylanilide
hydroxamic acid (SAHA). Free Radic Biol Med. 53:2002–2007. 2012.
View Article : Google Scholar : PubMed/NCBI
|
|
21.
|
Duenas-Gonzalez A, Lizano M, Candelaria M,
Cetina L, Arce C and Cervera E: Epigenetics of cervical cancer. An
overview and therapeutic perspectives. Mol Cancer. 4:382005.
View Article : Google Scholar : PubMed/NCBI
|
|
22.
|
Huang BH, Laban M, Leung CH, et al:
Inhibition of histone deacetylase 2 increases apoptosis and
p21Cip1/WAF1 expression, independent of histone
deacetylase 1. Cell Death Differ. 12:395–404. 2005. View Article : Google Scholar : PubMed/NCBI
|
|
23.
|
Hedley D, Pintilie M, Woo J, et al:
Up-regulation of the redox mediators thioredoxin and
apurinic/apyrimidinic excision (APE)/Ref-1 in hypoxic microregions
of invasive cervical carcinomas, mapped using multispectral,
wide-field fluorescence image analysis. Am J Pathol. 164:557–565.
2004. View Article : Google Scholar
|
|
24.
|
Cooper AL, Greenberg VL, Lancaster PS, van
Nagell JR Jr, Zimmer SG and Modesitt SC: In vitro and in vivo
histone deacetylase inhibitor therapy with suberoylanilide
hydroxamic acid (SAHA) and paclitaxel in ovarian cancer. Gynecol
Oncol. 104:596–601. 2007. View Article : Google Scholar : PubMed/NCBI
|
|
25.
|
Han YH, Moon HJ, You BR, Kim SZ, Kim SH
and Park WH: Effects of carbonyl cyanide p-(trifluoromethoxy)
phenylhydrazone on the growth inhibition in human pulmonary
adenocarcinoma Calu-6 cells. Toxicology. 265:101–107. 2009.
View Article : Google Scholar : PubMed/NCBI
|
|
26.
|
Han YH, Moon HJ, You BR and Park WH: The
effect of MG132, a proteasome inhibitor on HeLa cells in relation
to cell growth, reactive oxygen species and GSH. Oncol Rep.
22:215–221. 2009.PubMed/NCBI
|
|
27.
|
You BR and Park WH: Proteasome inhibition
by MG132 induces growth inhibition and death of human pulmonary
fibroblast cells in a caspase-independent manner. Oncol Rep.
25:1705–1712. 2011.PubMed/NCBI
|
|
28.
|
You BR and Park WH: Zebularine inhibits
the growth of HeLa cervical cancer cells via cell cycle arrest and
caspase-dependent apoptosis. Mol Biol Rep. 39:9723–9731. 2012.
View Article : Google Scholar : PubMed/NCBI
|
|
29.
|
Han YH, Kim SH, Kim SZ and Park WH:
Carbonyl cyanide p-(trifluoromethoxy) phenylhydrazone (FCCP) as an
O2(*−) generator induces apoptosis via the
depletion of intracellular GSH contents in Calu-6 cells. Lung
Cancer. 63:201–209. 2009. View Article : Google Scholar : PubMed/NCBI
|
|
30.
|
Han YH and Park WH: Propyl gallate
inhibits the growth of HeLa cells via regulating intracellular GSH
level. Food Chem Toxicol. 47:2531–2538. 2009. View Article : Google Scholar : PubMed/NCBI
|
|
31.
|
Elbashir SM, Harborth J, Lendeckel W,
Yalcin A, Weber K and Tuschl T: Duplexes of 21-nucleotide RNAs
mediate RNA interference in cultured mammalian cells. Nature.
411:494–498. 2001. View Article : Google Scholar : PubMed/NCBI
|
|
32.
|
You BR and Park WH: Arsenic trioxide
induces human pulmonary fibroblast cell death via increasing ROS
levels and GSH depletion. Oncol Rep. 28:749–757. 2012.PubMed/NCBI
|
|
33.
|
You BR and Park WH: Suberoyl bishydroxamic
acid-induced apoptosis in HeLa cells via ROS-independent,
GSH-dependent manner. Mol Biol Rep. 40:3807–3816. 2013. View Article : Google Scholar : PubMed/NCBI
|
|
34.
|
Lauricella M, Ciraolo A, Carlisi D, Vento
R and Tesoriere G: SAHA/TRAIL combination induces detachment and
anoikis of MDA-MB231 and MCF-7 breast cancer cells. Biochimie.
94:287–299. 2012. View Article : Google Scholar : PubMed/NCBI
|
|
35.
|
Carlisi D, Lauricella M, D’Anneo A, et al:
The histone deacetylase inhibitor suberoylanilide hydroxamic acid
sensitises human hepatocellular carcinoma cells to TRAIL-induced
apoptosis by TRAIL-DISC activation. Eur J Cancer. 45:2425–2438.
2009. View Article : Google Scholar
|
|
36.
|
Al-Yacoub N, Fecker LF, Mobs M, et al:
Apoptosis induction by SAHA in cutaneous T-cell lymphoma cells is
related to down-regulation of c-FLIP and enhanced TRAIL signaling.
J Invest Dermatol. 132:2263–2274. 2012. View Article : Google Scholar : PubMed/NCBI
|
|
37.
|
Martinou JC and Youle RJ: Mitochondria in
apoptosis: Bcl-2 family members and mitochondrial dynamics. Dev
Cell. 21:92–101. 2011. View Article : Google Scholar : PubMed/NCBI
|
|
38.
|
Eot-Houllier G, Fulcrand G,
Magnaghi-Jaulin L and Jaulin C: Histone deacetylase inhibitors and
genomic instability. Cancer Lett. 274:169–176. 2009. View Article : Google Scholar : PubMed/NCBI
|
|
39.
|
Ungerstedt JS, Sowa Y, Xu WS, et al: Role
of thioredoxin in the response of normal and transformed cells to
histone deacetylase inhibitors. Proc Natl Acad Sci USA.
102:673–678. 2005. View Article : Google Scholar : PubMed/NCBI
|
|
40.
|
Han YH, Kim SZ, Kim SH and Park WH:
Intracellular GSH level is a factor in As4.1 juxtaglomerular cell
death by arsenic trioxide. J Cell Biochem. 104:995–1009. 2008.
View Article : Google Scholar : PubMed/NCBI
|
|
41.
|
Han YH, Kim SZ, Kim SH and Park WH:
Enhancement of arsenic trioxide-induced apoptosis in HeLa cells by
diethyldithiocarbamate or buthionine sulfoximine. Int J Oncol.
33:205–213. 2008.PubMed/NCBI
|
|
42.
|
Han YH, Kim SZ, Kim SH and Park WH:
Suppression of arsenic trioxide-induced apoptosis in HeLa cells by
N-acetylcysteine. Mol Cells. 26:18–25. 2008.PubMed/NCBI
|
|
43.
|
Estrela JM, Ortega A and Obrador E:
Glutathione in cancer biology and therapy. Crit Rev Clin Lab Sci.
43:143–181. 2006. View Article : Google Scholar
|
|
44.
|
Tian C, Gao P, Zheng Y, et al: Redox
status of thioredoxin-1 (TRX1) determines the sensitivity of human
liver carcinoma cells (HepG2) to arsenic trioxide-induced cell
death. Cell Res. 18:458–471. 2008. View Article : Google Scholar : PubMed/NCBI
|