Introduction
Hepatocellular carcinoma (HCC) is the fifth most
common malignant tumor worldwide with an incidence of about 626,000
cases each year (1,2). In China and Southeast Asia, HCC is
highly associated with viral hepatitis B and cirrhosis (3). Prognosis of patients with HCC have
been improved largely because the surgical techniques and
diagnostic methods have greatly improved in recent years, but
long-term prognosis is still unsatisfactory largely due to the high
recurrence and invasion rates even after resection (50–70% at five
years) (4,5). How to predict which patients are
likely to experience recurrence earlier after resection is a
challenge to surgeons.
ATAD2, a member of the AAA+ ATPase family of
proteins, was identified by microarray analysis (6). ATAD2, the predicted protein product
which contains both a bromodomain and an ATPase domain, maps to
chromosome 8q24, in a region that is frequently found amplified in
cancer (7). The structure of ATAD2
suggests its functions relate to genome regulation including cell
proliferation, differentiation and apoptosis. Studies have revealed
that ATAD2 is highly expressed in several types of tumors such as
breast cancer, lung cancer, large β-cell lymphoma (8–10).
It is also highly expressed in hepatocellular carcinoma detected by
RNA-seq (11).
The sonic hedgehog (SHH) signaling pathway was shown
to play a critical role in hepatocellular carcinoma, regulating the
cancer cells growth and differentiation (12–14).
HH pathway is frequently activated in HCC, and patched homolog 1
(Ptch1) and glioma-associated oncogene-1 (like Gli2) are the key
genes in the Hh pathway. Hh protein binds to its receptor human
Ptch1, and relieves Ptch1 inhibition on smoothened (SMO),
subsequently Smo triggers a series of intra-cellular events with
resultant activation of the zinc finger transcription effectors,
glioma-associated oncogenes (Gli1, Gli2, Gli3) transcription
factors, which induce the expression of numerous target genes, such
as Ptch1, Hip, Gli2 and Wnt, regulating proliferation, and
differentiation (15–17).
In our previous studies, we detected ATAD2 as highly
expressed in HCC tissues, compared with adjacent normal tissues,
and the patients with high-expression ATAD2 had a poorer prognosis,
and ATAD2 influenced HCC cells proliferation, invasion and
migration by transfection with ATAD2-siRNA-plasmid (18). Moreover, we also found mir-372 can
regulate the expression of ATAD2 in HCC cell lines, and ATAD2 is
the target gene of mir-372. In the present study, firstly, we found
that there was a relationship between the mRNA expression of ATAD2
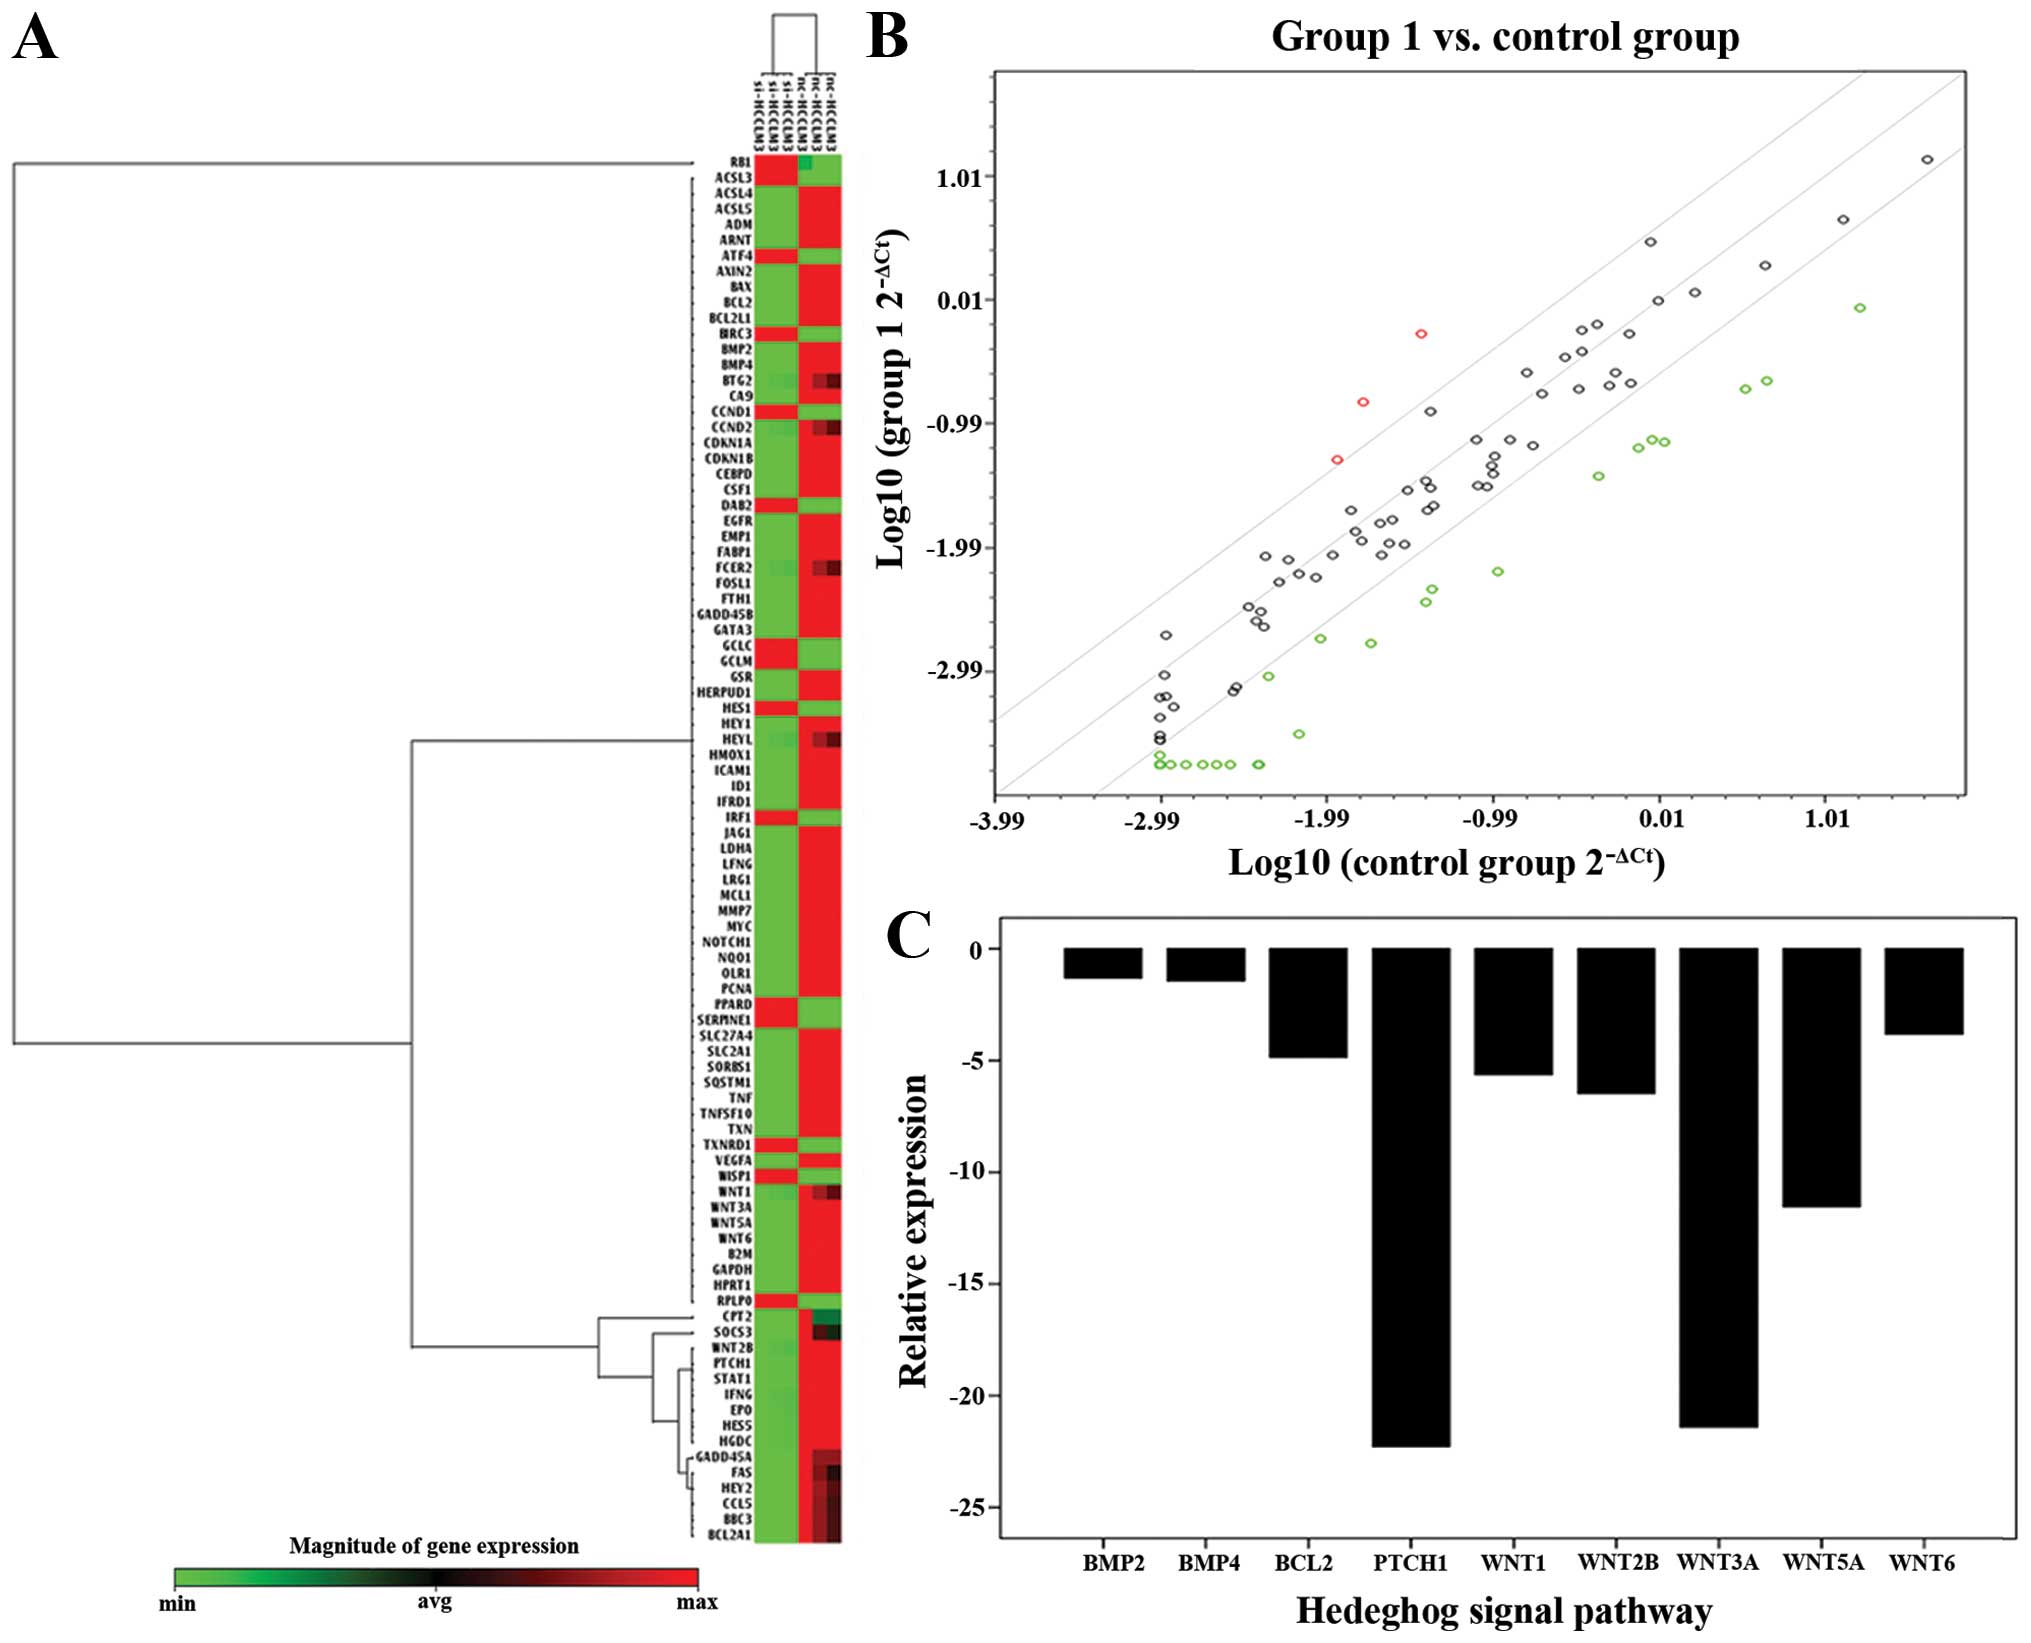
and PTCH1 by PCR microarray (Fig.
1). Then, we further investigated the function of ATAD2 in
vivo and in vitro by transfection with
ATAD2-RNAi-lentivirus, and tested whether ATAD2 could regulate the
Hh pathway. Moreover we investigated whether ATAD2 could activate
the Hh pathway in HCC.
Materials and methods
Human Signal Transduction PathwayFinder
PCR Array
The Human Signal Transduction PathwayFinder
RT2 Profiler PCR Array (SABiosciences) profiles the
expression of 84 key genes responsive to signal transduction
pathway activation or inhibition. We set the two groups as normal
control, and ATAD2-RNAi groups. The GAPDH gene was used as a
reference control. The cDNA normal control, and ATAD2-RNAi groups
were inserted in PCR array. Following data collection, the relative
levels of gene expression were presented as ΔCt=Ct gene-Ct
reference and the fold change in gene expression was calculated
using the 2−ΔΔCt method.
Hepatic cancer patients and liver cancer
cell lines
Hepatic cancer tissue and normal hepatic cancer were
obtained from 80 HCC patients. All patients were operated in the
First Affiliated Hospital of China Medical University between
March, 2002 and December, 2008. Among them, 58 were men and 22 were
women, with the median age of 56 years (range, 30 to 78.5 years).
No patient had been pretreated with preoperative radiotherapy or
chemotherapy before surgical resection. Up to December, 2008 (the
censor date), histologic diagnosis and differentiation were
evaluated independently by 3 pathologists using hematoxylin-stained
and eosin-stained slides according to the WHO classification system
(4). The total of 80 fresh
specimens including both tumor tissues and corresponding paired
non-cancerous parenchyma were snap-frozen in liquid nitrogen and
stored at −80°C immediately after resection until processing. The
project protocol was approved by the Institutional Ethics Committee
of China Medical University before initiation of the study, and all
patients provided a written informed consent for the use of the
tumor tissues for clinical research. The liver cancer cell lines
Huh7, HCCLM3 were obtained from Shanghai Cell Bank (Shanghai,
China). The Huh7, HCCLM3 cell lines were cultured in DMEM (Gibco,
USA).
RNA preparation and quantitative
real-time PCR
Total RNA was extracted according to the
manufacturer’s instructions from approximately 100 mg of tissue for
each of the 40 paired samples and liver cancer cell lines using
TRIzol reagent (Invitrogen). The ATAD2, PTCH1, Gli2, SMO and GADPH
primers were purchased from Takara Company (Japan). The GAPDH gene
was used as a reference control for ATAD2, PTCH1, Gli2 and SMO. The
relative levels of gene expression were represented as ΔCt=Ct
gene-Ct reference and the fold change in gene expression was
calculated using the 2−ΔΔCt method. The primer sequences
are: ATAD2 forward, GGA ATCCCAAACCACTGGACA and reverse, GGTAGCGT
CGTCGTAAAGCACA; Gli2 forward, TGGCCGCTTCAGA TGACAGATGTTG and
reverse CGTTAGCCGAATGTCAG CCGTGAAG; PTCH1 forward,
ATCCATAATGTCTGGAA CTTTGCTG and reverse, CATGCTAGGTCGCCAATGGTA; SMO
forward, TGCCAGCAAGATCAACGAGA and reverse, GCAGCTGAAGGTAATGAGCACAA;
C-MYC forward, GCAGCTGCTTAGACGCTGGA and reverse CGCAGT
AGAAATACGGCTGCAC.
Cell lysate preparation and western blot
analysis
Cell lysates were prepared by using a homogenate
buffer containing 20 mM Tris, 100 mM NaCl, 0.1 mM PMSF, 10
μg/ml aprotinin and 1% NP-40. After sonication and
centrifugation (12,000 rpm for 15 min at 4°C), protein
concentrations were measured with the Bradford method (Bio-Rad,
Hercules, CA). SDS-polyacrylamide gel electrophoresis techniques
were used to separate proteins (40 μg/lane) on 4 to 15%
linear gradient gel. Proteins were then transferred to
polyvinylidene difluoride membranes (Immobilon-P, Millipore,
Bedford, MA) by semidry electroblotting and probed with either
rabbit monoclonal anti-human for human studies, or for control
anti-glyceraldehyde-3-phosphate dehydrogenase (GAPDH; Amblion Inc,
Woodward, TX, USA), primary antibodies were used. Bands were
visualized using horseradish peroxidase-conjugated secondary
antibodies goat anti-rabbit. The loading control for the human
samples was performed with GAPDH (1:5,000; rabbit IgG, USA.) Equal
levels of gel loading were confirmed by stripping blots and then
reprobing with GAPDH antibodies, respectively. ATAD2 antibody was
purchased from Abcam company, and PTCH1, SMO, Gli2 antibody
purchased from Santa Cruz Biotechnology.
Immunohistochemistry
Surgical specimens were immediately stored at −80°C.
Serial cryostat sections (5-μm) were fixed with 10% formalin
and embedded in paraffin. After general deparaffinization, antigen
retrieval was carried out for 30 sec with an autoclave using 0.01
mol/l sodium citrate buffer, pH 6.0. H2O2
(0.3%) was used to block endogenous peroxidase activity for 30 min
at 37°C, and non-specific immunoglobulin binding sites were blocked
by normal goat serum for 30 min at 37°C. Sections were then
incubated overnight with primary antibody at 4°C, rinsed with PBS,
and incubated with the appropriate secondary antibody for 30 min.
Sections were counterstained with Mayer’s hematoxylin, dehydrated,
cleared in xylene, and mounted in Permount. Optimal antibody
concentrations were determined by serial dilution in all cases. As
a negative control, normal IgG was used as the primary antibody at
the same dilution.
Semi-quantitative assessment and
scoring
ATAD2 and Hh pathway gene expression levels were
scored semiquantitatively according to the percentage of positively
stained cells combined with the staining intensity. Samples were
considered positive for ATAD2 and the Hh pathway genes if the
nucleus or cytoplasm of the sample cells were positively stained.
The positivity was defined as: 0, 0%; 1, 1–10%; 2, 11–50%; 3,
51–80%; and 4, >80%. The staining intensity was scored as 0, no
staining; 1, weakly stained; 2, moderately stained; and 3, strongly
stained. Both the percent of positivity and the staining intensity
were assessed by two investigators in a blinded manner. The ATAD2
and Hh pathway gene expression scores were calculated from the
value of positivity score x the staining intensity score. This
value thus ranged from 0 to 12, and the tumors were classified into
the following: negative (-), score 0; lower expression (1+), score
1–4; moderate expression (2+), score 5–8; and strong expression
(3+), score 9–12. The immunohistochemical ATAD2 and Hh pathway gene
staining was grouped into two categories: low expression (0/1+) and
high expression (2+/3+).
Construction and identification of the
RNAi lentivirus vector
The HCCLM3 and Huh7 cells were plated and cultured
in 24-well plates until cell fusion reached 60%. Next, the
appropriate amounts of lentivirus were added to the cells according
to MOI values (5×10⁴ TU/well in ATAD2-RNAi group).
Twelve hours later, the medium was removed and replaced with fresh
culture medium. Three days later, the GFP gene expression was
observed under a fluorescence microscope. The effect of the
RNAi-lentivirus on the expression of ATAD2 gene was assessed by
determination of the mRNA and protein levels of ATAD2 in the Huh7
and HCCLM3 cells after infection with lentivirus for 4–7 days;
real-time polymerase chain reaction (PCR) and western immunoblot
analyses were used for these assessments. The liver cancer cell
lines Huh7, HCCLM3 were obtained from the Shanghai Cell Bank
(Shanghai, China). Huh7, HCCLM3 cells were grown in DMEM
(Invitrogen). All media were supplemented with 10% fetal calf serum
(Invitrogen) and 100 IU/ml penicillin (Sigma, St. Louis, MO).
Cell apoptosis and cell cycle
analysis
Huh7 and HCCLM3 cells in 6-well plates were
transfected with ATAD2- RNAi-lentivirus or control. Cells seeded at
a density of 5×10⁵ per well were trypsinized, and
collected and stained using the FITC Annexin V Apoptosis Detection
Kit (Keygene, China). Cell cycle analysis was performed after
staining with propidium iodide (Keygene, China). Both apoptosis and
cell cycle distribution were quantified using a flow cytometer.
Cell invasion and migration assay
Huh7 and HCCLM3 cells were transfected with
ATAD2-RNAi-lentivirus. Cells were then seeded onto a synthetic
basement membrane present in the inset of a 24-well culture plate.
In the invasion assay, polycarbonate filters coated with 50
μl Matrigel (1:9, BD Bioscience) were placed in a Transwell
chamber (Costar). In the migration assay, no Matrigel was placed in
the chambers. Fetal bovine serum was added to the lower chamber as
a chemoattractant. Cells were then incubated at 37°C and allowed to
invade through the Matrigel barrier for several hours. After
incubation, filters were fixed and stained with 0.1% crystal violet
solution. Non-invading cells were removed using a cotton swab, and
invading cells on the underside of the filter were counted with an
inverted microscope.
Tumorigenicity experiments in nude
mice
Forty male nude mice weighing 18 to 20 g, provided
by Shanghai Laboratory Animal Center (Chinese Academy of Science,
China), were bred under aseptic conditions; the animals were housed
in an area with a constant humidity of 60–70% and a room
temperature of 18–20°C. Animal maintenance, husbandry and
experimental procedures were performed in accordance with the rules
of China Medical University for the Use of Experimental Animals and
approved by the Medical Animal Care and Use Committee of China
Medical University (Shenyang, China). All of the mice were
separated into two groups as described above: normal control, and
ATAD2-RNAi groups. Lentivirus transfected cell groups were
administered a subcutaneous injection (0.1 ml of a solution
containing 1×10⁴ cells/ml). The mice were examined every
5 days and were sacrificed 28 days after the initial subcutaneous
injection. The tumors were resected and weighed.
Pharmacological regulation of Hh
signaling
The HCCLM3 line was treated with pharmacological Hh
inhibitors, cyclopamine, or KAAD-cyclopamine dissolved in sterile
DMSO as per the instructions of the manufacturer. For all
experiments, Cyc- and KAAD-treated groups were compared to
blank-control groups.
Statistical analyses
SPSS 19.0 for Windows was used for all analyses. The
χ2 test was used to evaluate associations between
different gene expression and clinicopathologic parameters. A Cox
repression model was performed for the univariate and multivariate
analysis of prognostic variables. A P-value of <0.05 was defined
as significant.
Results
Hh pathway was detected in Human Signal
Transduction PathwayFinder PCR array
To find the downstream related pathway of ATAD2,
which could influence the growth of HCC, we set the two groups as
normal control, and ATAD2-RNAi groups in Human Signal Transduction
PathwayFinder PCR Array. The result showed that the mRNA expression
of Ptch1 was significantly reduced in ATAD2-RNAi groups, compared
with normal control groups (Fig.
1). Therefore, Hh pathway was detected in our study, and we
speculated that ATAD2 might regulate the Hh pathway in HCC.
Altered mRNA levels of ATAD2 and the
genes in Hh pathway in tissues
Mean levels of mRNA expression of ATAD2 and the
genes in Hh pathway was determined by RT-PCR. Of the 80 patients,
ATAD2 mRNA expression showed a 2-fold higher level in liver cancer
tissue specimens, compared with normal tissues. Mean expression
value of ATAD2 mRNA (4.34±1.31 and 1.35±0.79, mean ± SD,
respectively, P<0.05). The Ptch1 mRNA expression in primary HCCs
tissues showed 1.5-fold, compaired with their paired non-tumorous
livers. Mean expression value of Ptch1 mRNA (3.15±1.57 and
1.45±0.79, mean ± SD, respectively, P<0.05). The SMO mRNA
expression in primary HCCs tissues was 1-fold, compaired with their
paired non-tumorous livers. Mean expression value of SMO mRNA
(2.15±0.63 and 1.13±0.42, mean ± SD, respectively, P<0.05). The
Gli2 mRNA expression in primary HCCs tissues was 6.5-fold,
compaired with their paired non-tumorous livers. Mean expression
value of Gli2 mRNA was (6.75±2.54 and 1.5±0.73, mean ± SD,
respectively, P<0.05).
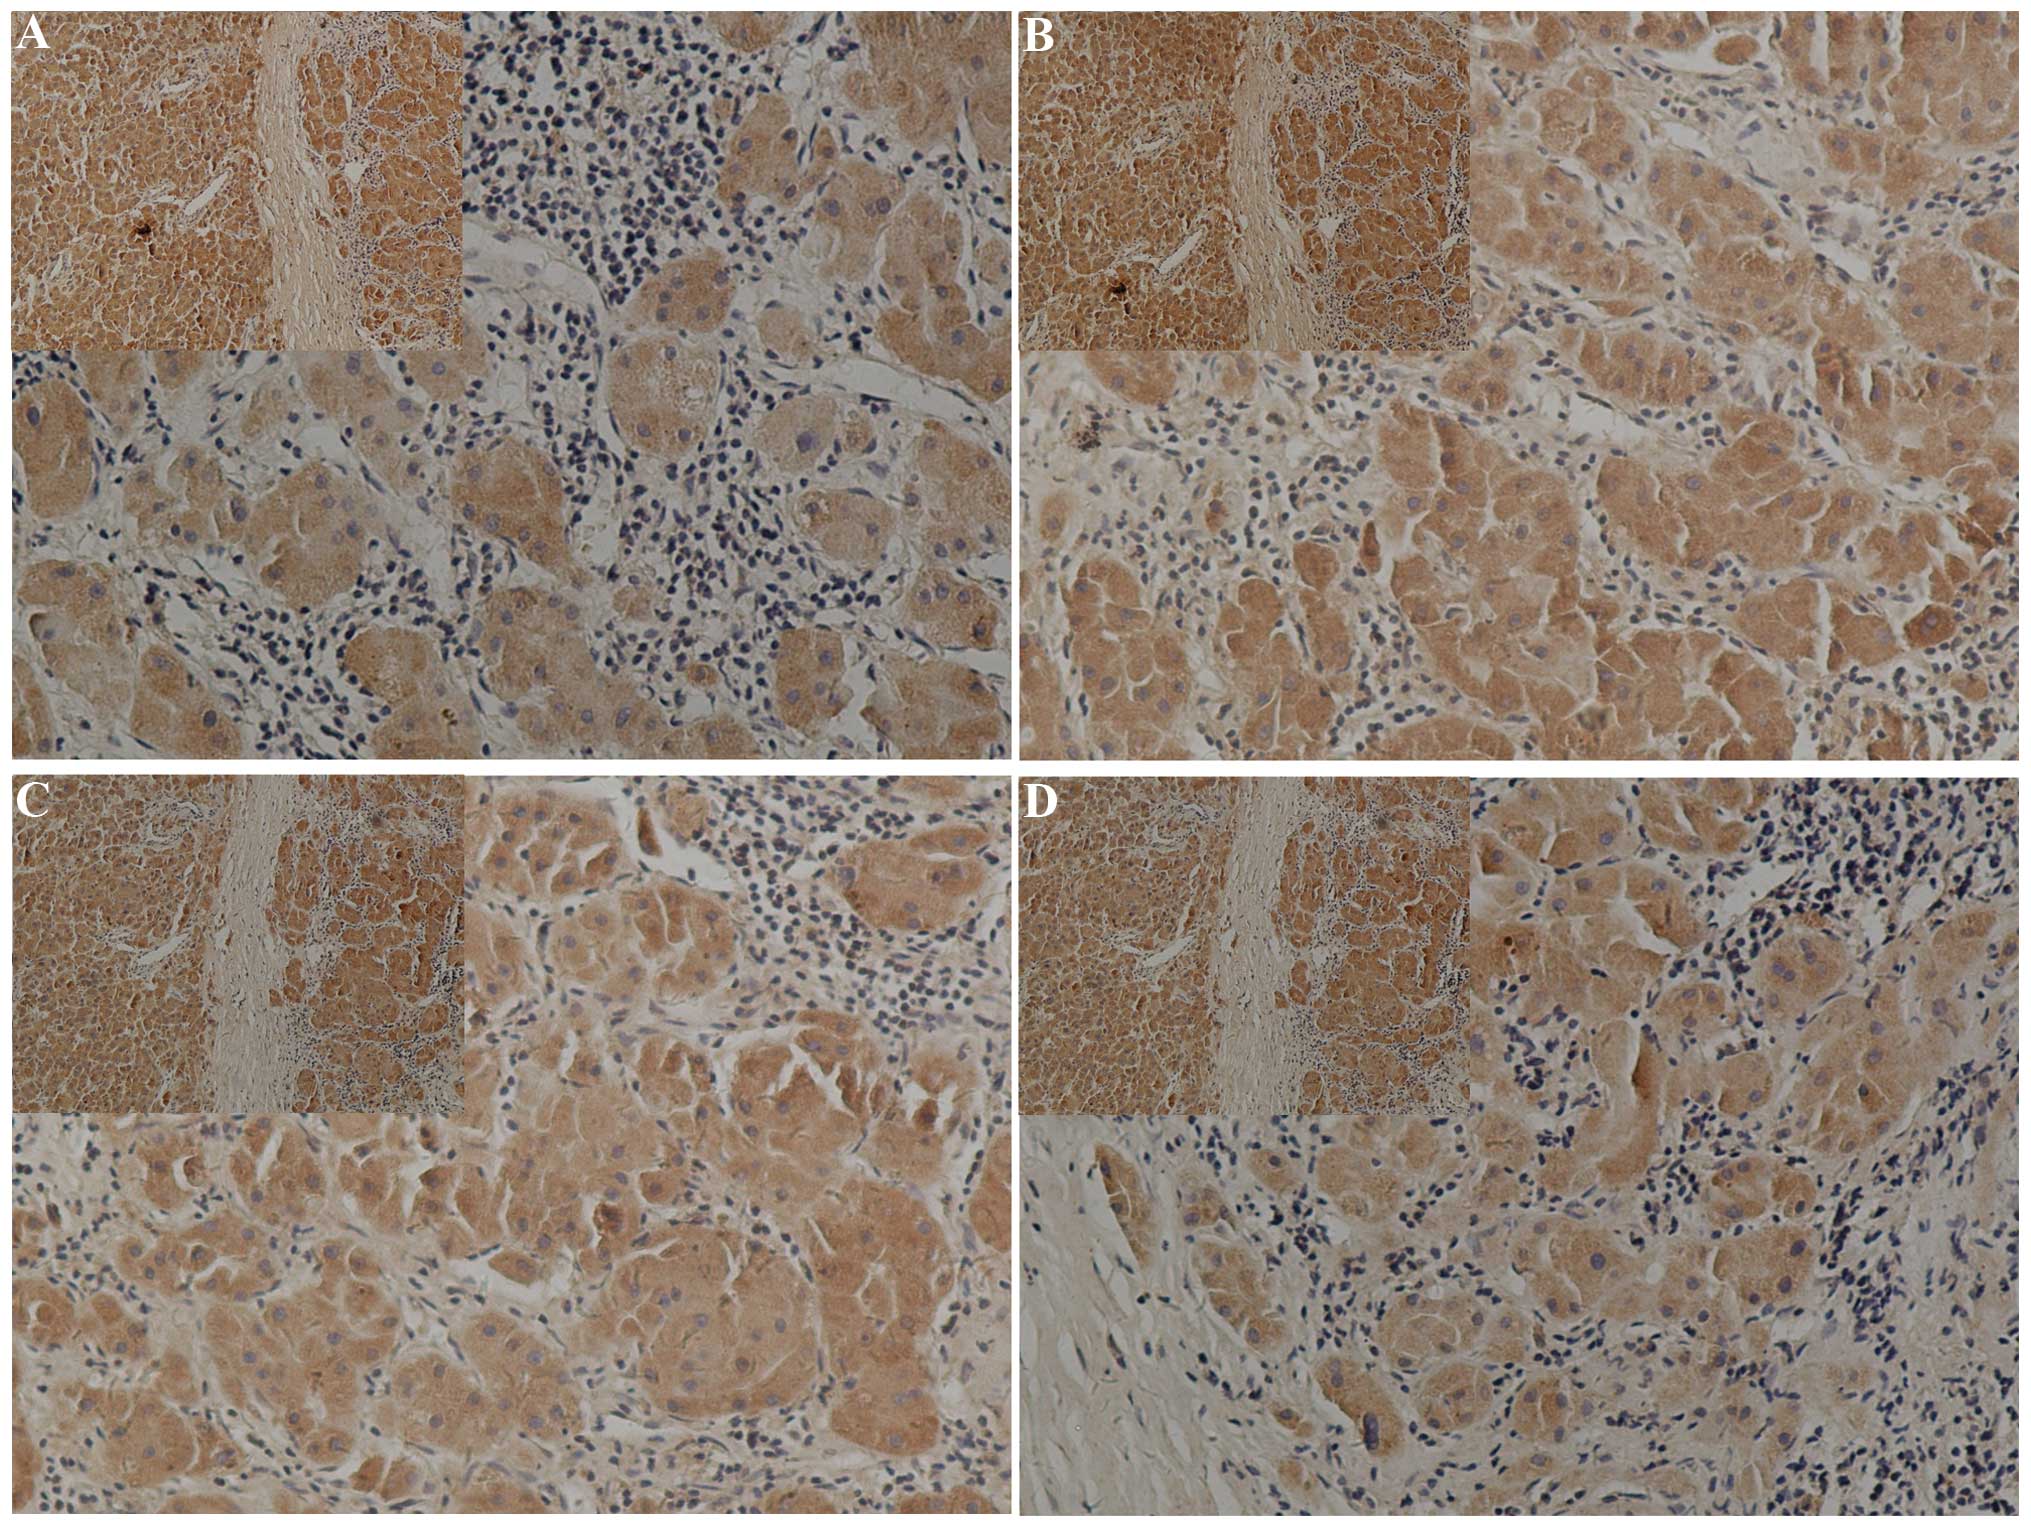
IHC
ATAD2 and the protein of the key genes in Hh pathway
were evaluated by IHC in the 80 HCC specimens. ATAD2 was
overexpressed (2+ to 3+) in 67.5% tumor samples (54/80) and
low-expressed (1+) in the other 11 cases (27.5%). Ptch1 was
overexpressed (2+ to 3+) in 55% of the tumor samples (44/80) and
low-expressed (1+) in the other 11 cases (45%). SMO was
overexpressed (2+ to 3+) in 52.5% of the tumor samples (42/80) and
low-expressed (1+) in the other 11 cases (47.5%). Gli2 was
overexpressed (2+ to 3+) in 72.5% of the tumor samples (58/80) and
low-expressed (1+) in the other 11 cases (27.5%). The specimen
location of ATAD2 was in the cytoplasm and cell nucleus. Ptch1 was
in the cytoplasm and membrane, SOM and Gli1 located in the nucleus
and cytoplasm. The Hh pathway genes were highly expressed in the
same sites as the ATAD2 high expression, such as PTCH1, SMO, Gli2.
There was a significant association between the immune intensity of
ATAD2 and the protein of the key genes in Hh pathway in the same
specimens (Fig. 1).
Clinical significance of ATAD2 protein
expression in HCC
To evaluate the clinical significance of expression
of ATAD2 and Hh pathway genes in HCC samples, we detected their
protein expression by IHC, and found patients with high ATAD2
protein expression had metastases (P<0.05), and patients with
high Ptch1 protein expression correlated with late tumor stage
(P<0.05), and patients with high Gli2 protein expression had
metastasis (P<0.05) (Table I).
Patients with high SMO protein expression tended to correlate with
the tumor size.
 | Table I.Association between ATAD2 expression
and conventional clinicopathological parameters in 80 patients with
HCC. |
Table I.
Association between ATAD2 expression
and conventional clinicopathological parameters in 80 patients with
HCC.
| Characteristics | n=80 | ATAD2 positive
(%) | PTCH1 positive
(%) | SMO positive (%) | Gli2 positive
(%) |
|---|
| Age (years) | | | | | |
| ≥50 | 34 | 23 (67.6) | 16 (47.1) | 18 (52.9) | 25 (73.5) |
| <50 | 46 | 31 (67.3) | 28 (60.9) | 24 (52.2) | 33 (71.7) |
| P-value | | 0.342 | 0.22 | 0.241 | 0.859 |
| Gender | | | | | |
| Male | 58 | 39 (67.2) | 32 (55.2) | 30 (51.7) | 41 (70.7) |
| Female | 22 | 15 (68.2) | 12 (54.5) | 12 (54.5) | 17 (77.3) |
| P-value | | 0.936 | 0.96 | 0.821 | 0.556 |
| Tumor size | | | | | |
| ≥5 cm | 56 | 39 (69.6) | 29 (51.8) | 32 (57.1) | 42 (75.0) |
| <5 cm | 24 | 15 (62.5) | 15 (62.5) | 10 (41.7) | 16 (66.7) |
| P-value | | 0.532 | 0.544 | 0.131 | 0.251 |
| Metastasis | | | | | |
| Yes | 55 | 41 (74.5) | 34 (61.8) | 31 (56.4) | 45 (81.8) |
| No | 25 | 13 (52.0) | 10 (40.0) | 11 (44.0) | 13 (52.0) |
| P-value | | 0.046a | 0.069 | 0.305 | 0.006a |
| HBsAg status | | | | | |
| Positive | 44 | 29 (65.9) | 25 (56.8) | 22 (50.0) | 31 (70.5) |
| Negative | 36 | 25 (69.4) | 19 (25.0) | 20 (55.6) | 27 (75.0) |
| P-value | | 0.737 | 0.91 | 0.463 | 0.412 |
|
Differentiation | | | | | |
| WDa | 25 | 17 (68.0) | 18 (72.0) | 12 (48.0) | 22 (88.0) |
| MDa | 39 | 28 (71.8) | 22 (56.4) | 22 (56.4) | 29 (74.4) |
| PDa | 16 | 9 (56.3) | 4 (25.0) | 8 (50.0) | 7 (43.8) |
| P-value | | 0.534 | 0.073 | 0.648 | 0.12 |
| Cirrhosis | | | | | |
| Yes | 57 | 38 (66.7) | 32 (56.1) | 32 (56.1) | 40 (70.2) |
| No | 23 | 16 (69.6) | 12 (52.2) | 12 (52.2) | 18 (78.3) |
| P-value | | 0.802 | 0.747 | 0.747 | 0.464 |
| Serum AFP | | | | | |
| <200
ng/dl | 33 | 23 (69.7) | 19 (57.6) | 16 (48.5) | 22 (66.7) |
| ≥200 ng/dl | 47 | 31 (65.9) | 25 (53.2) | 26 (55.3) | 36 (76.6) |
| P-value | | 0.725 | 0.698 | 0.547 | 0.328 |
| Tumor stage | | | | | |
| I+II | 31 | 20 (64.5) | 12 (38.7) | 17 (54.8) | 19 (61.3) |
| III+IV | 49 | 34 (69.4) | 32 (65.3) | 25 (51.0) | 38 (77.6) |
| P-value | | 0.65 | 0.02a | 0.749 | 0.117 |
The multivariate analysis demonstrated that ATAD2
status, Ptch 1 status, Gli 2 status, the tumor size, and metastasis
were significant prognostic factors for HCC patients (Table II).
| Table II.Univariate and multivariate analyses
of individual parameters for correlations with overall survival
rate: Cox proportional hazards model. |
Table II.
Univariate and multivariate analyses
of individual parameters for correlations with overall survival
rate: Cox proportional hazards model.
| Variables | Univariate
| Multivariate
|
|---|
| HR | CI (95%) | P-value | HR | CI (95%) | P-value |
|---|
| ATAD2 | 1.787 | 1.150–2.684 | 0.004a | 1.98 | 1.444–2.816 | 0.002a |
| Ptch 1 | 1.565 | 1.027–2.263 | 0.023a | 1.833 | 1.164–2.763 | 0.004a |
| Gli 2 | 1.854 | 1.245–2.764 | 0.002a | 1.876 | 1.274–2.773 | 0.002a |
| Gender | 1.174 | 0.601–1.583 | 0.921 | | | |
| Tumor stage | 1.126 | 0.920–1.367 | 0.255 | | | |
| Tumor
differentiation | 1.029 | 0.784–1.347 | 0.843 | | | |
| Metastasis | 1.826 | 1.232–2.678 | 0.003a | 1.842 | 1.221–2.718 | 0.003a |
| Tumor size | 1.573 | 1.059–2.336 | 0.025a | 1.917 | 1.278–2.856 | 0.002a |
| Liver
cirrhosis | 1.37 | 0.934–2.010 | 0.107 | | | |
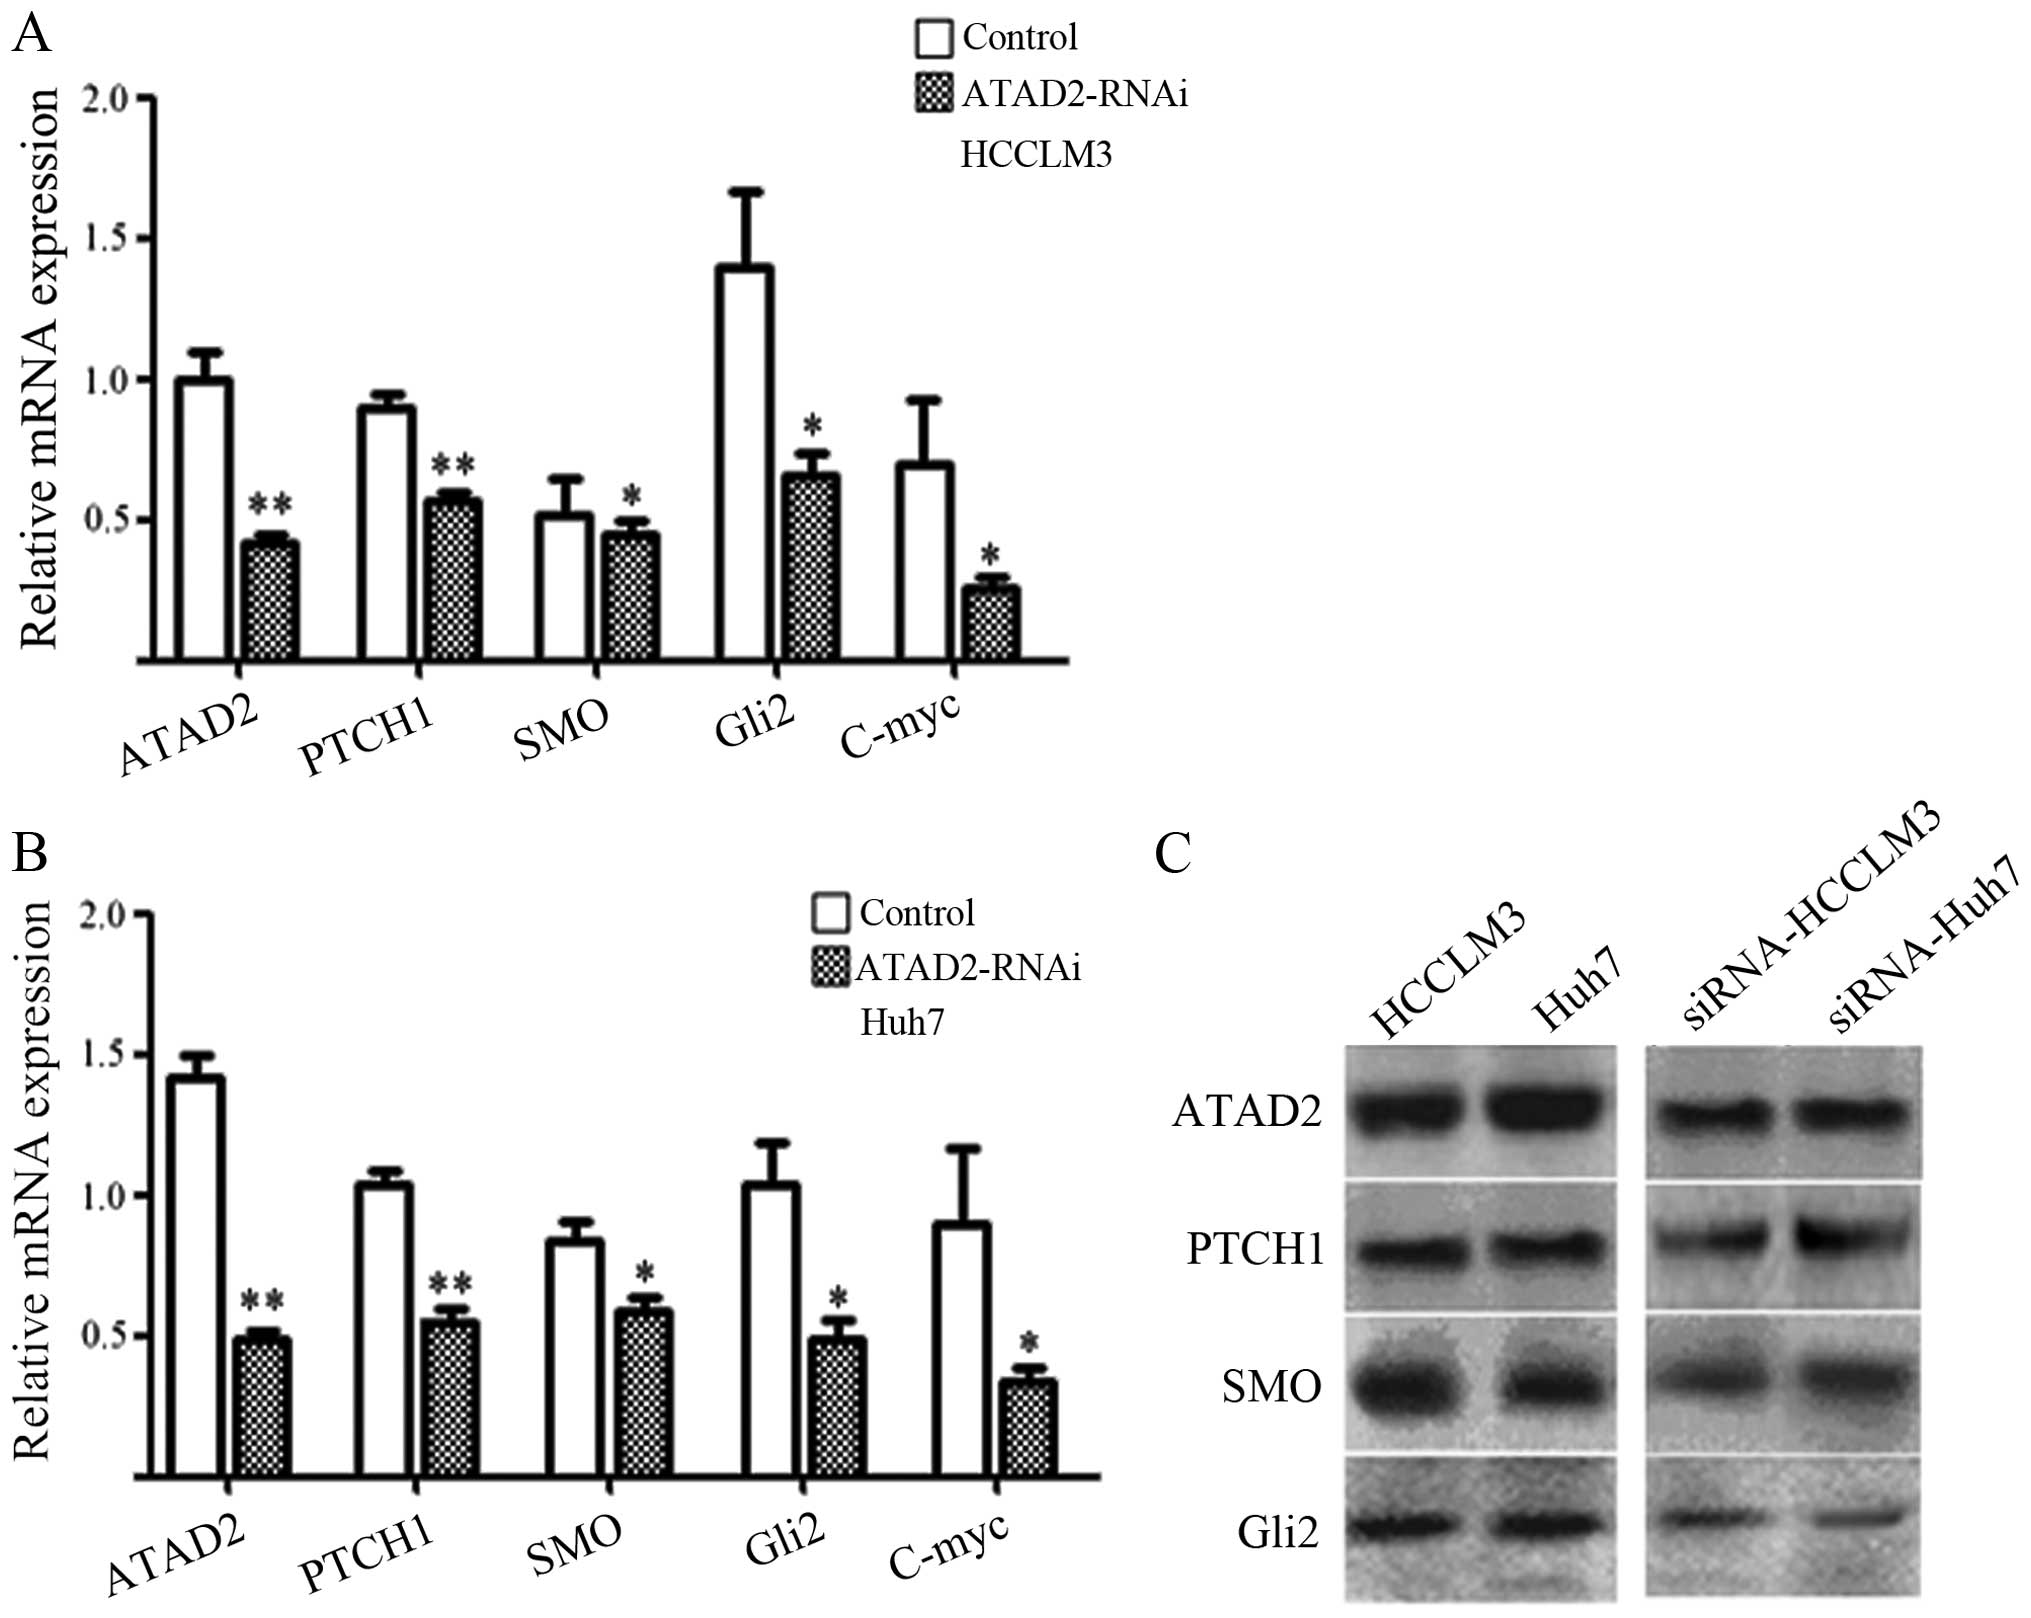
Validation of ATAD2-RNAi-lentivirus and
mRNA and protein expression of the genes in Hh pathway in cell
lines
The studies showed that ATAD2-RNAi transfection
could significantly reduce the level of ATAD2 mRNA (P<0.05,
Fig. 2A and B) and protein
(P<0.05, Fig. 2C) in the
ATAD2-RNAi-lentivirus group in Huh 7 cells and HCCLM3 cells,
compared with the control groups. Moreover, mRNA and protein
expression of the genes in Hh pathway consistently changed
following the downregulation of ATAD2. The protein level in western
blot analysis showed that the ratios between ATAD2 and the key gene
protein in the ATAD2-RNAi-lentivirus groups and normal control
groups. The ATAD2, Ptch 1, SMO, Gli2 protein in ATAD2-RNAi were
1.5, 1.0, 1.25 and 1.25-fold, respectively, compared to normal
control groups (P<0.05, Fig.
2). This result suggests that the mRNA and protein level of Hh
pathway are all reduced, after the transfection of ATAD2-RNAi
lentivirus vector.
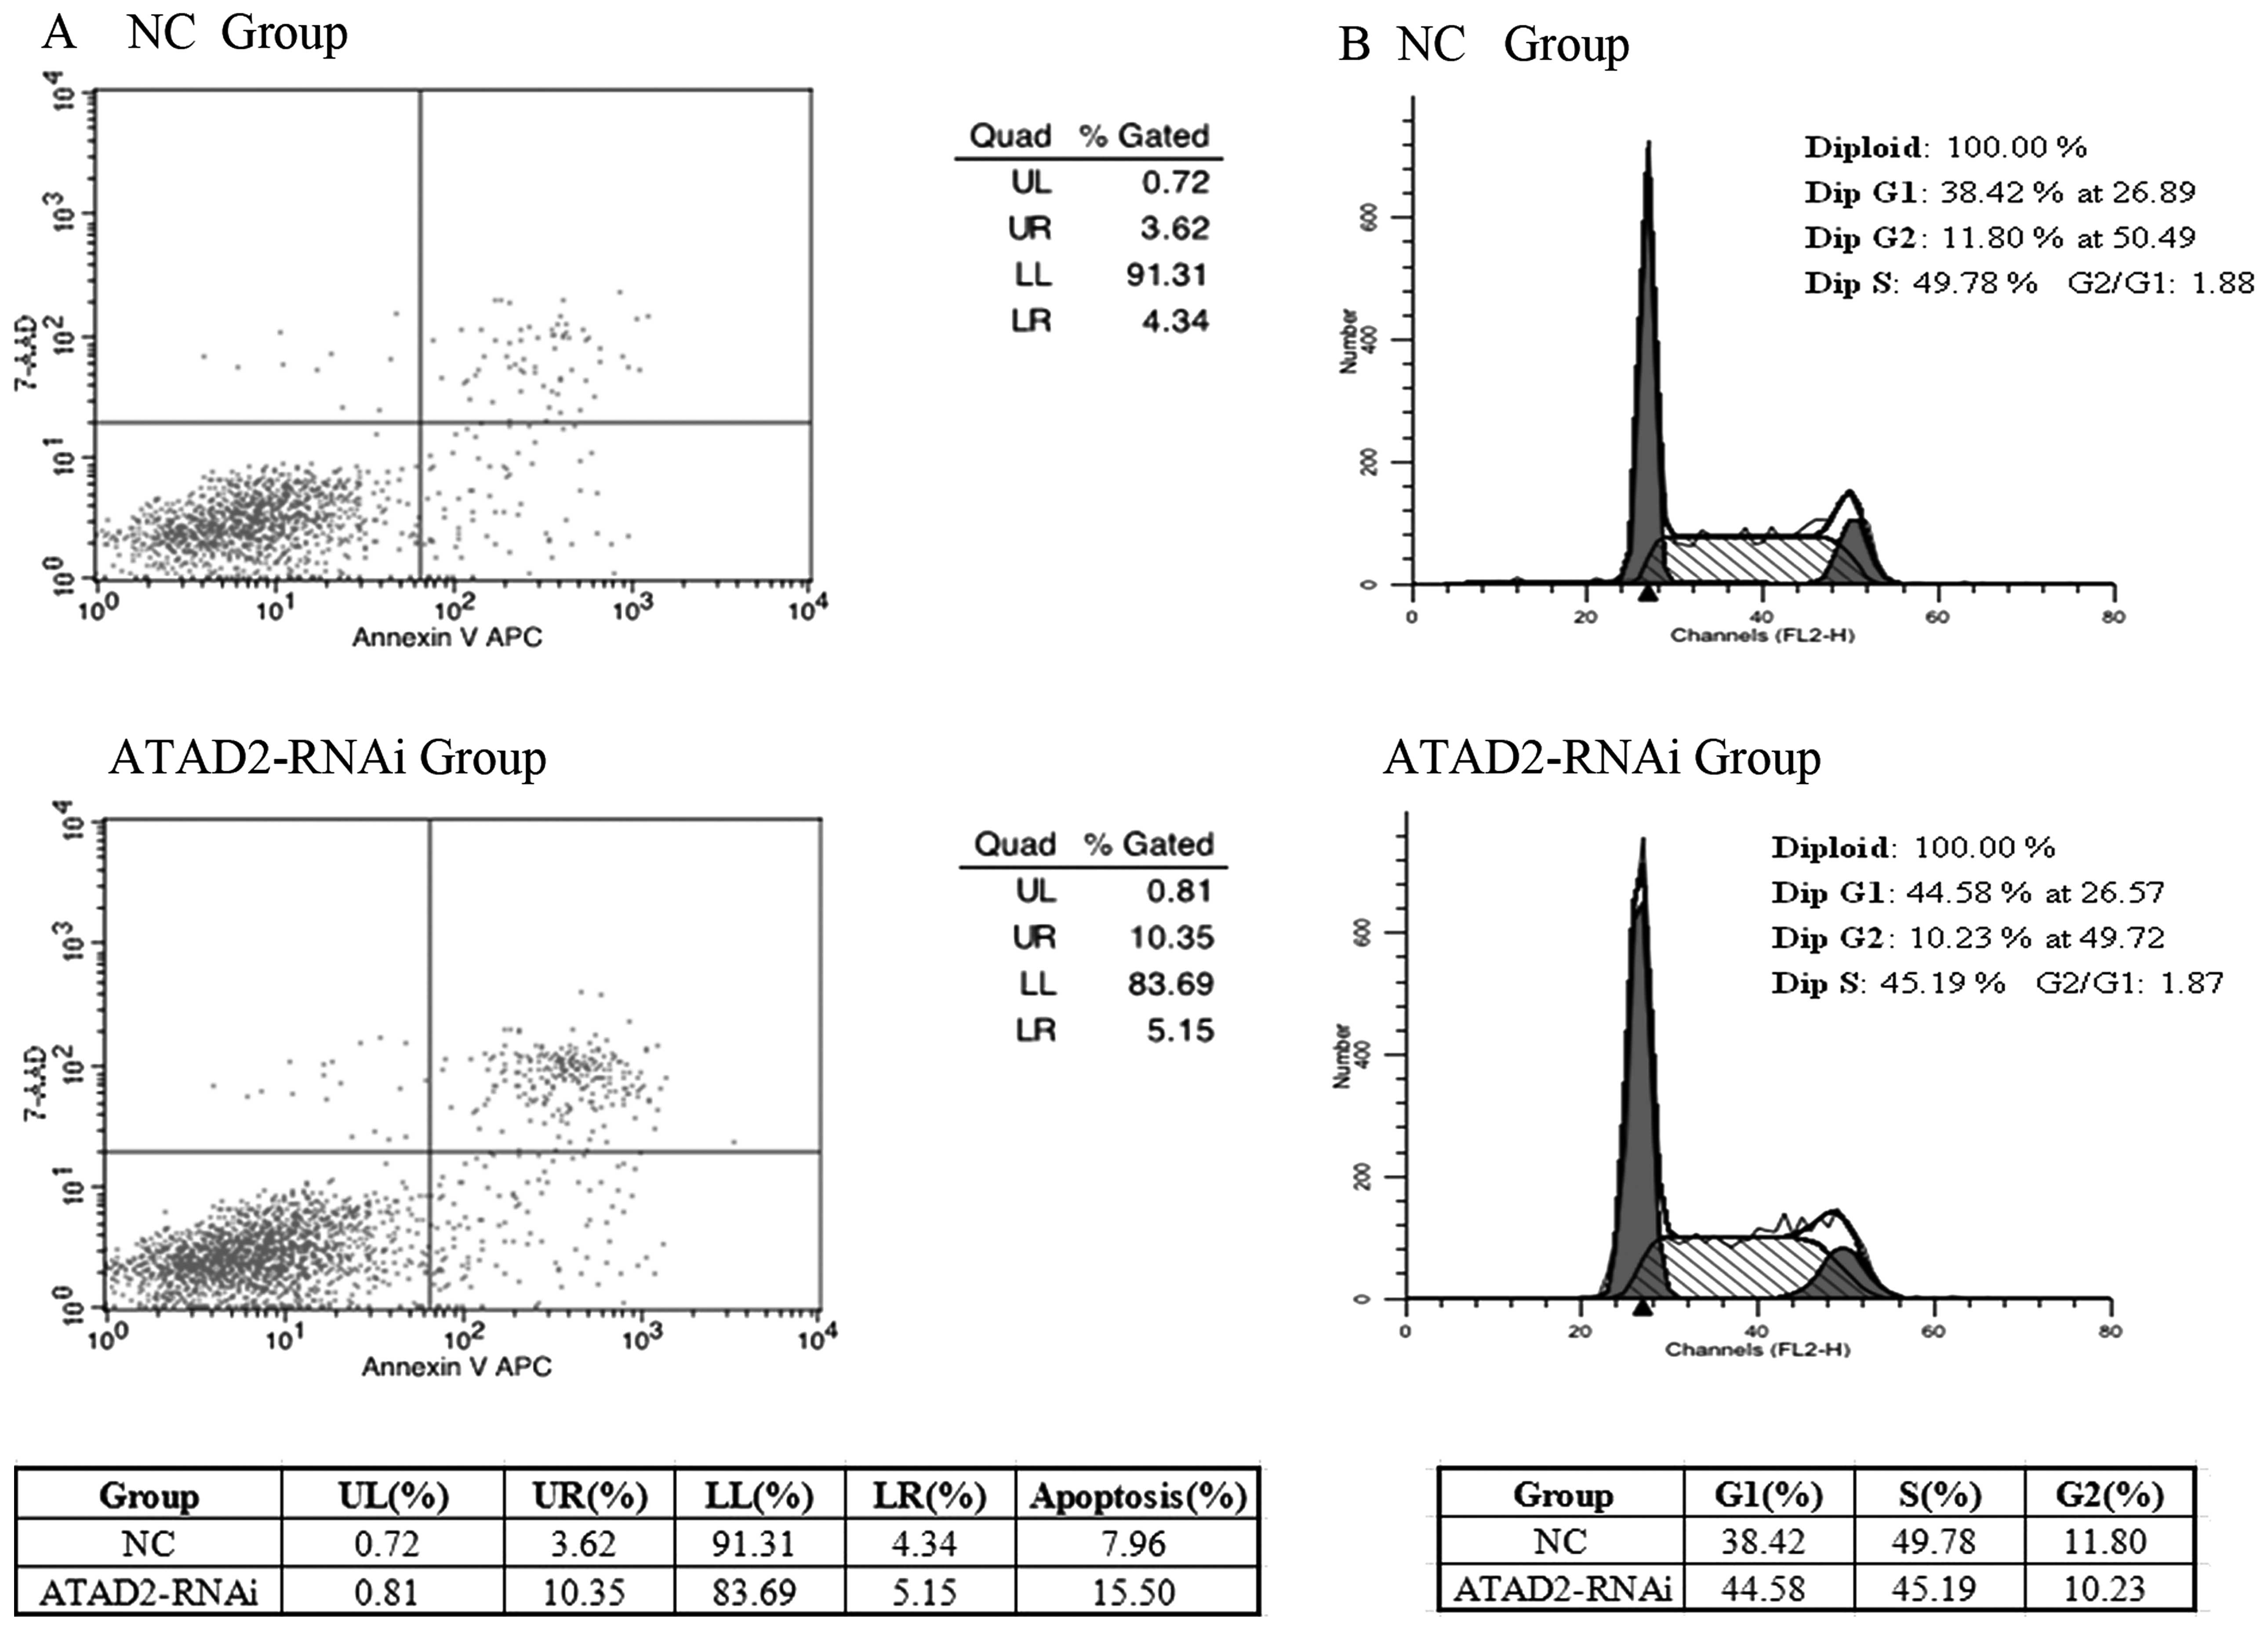
Depletion of ATAD2 influences the cell
apoptosis and the cell cycle
We explored further the ATAD2 functional
significance in HCC cells. To test whether expression of ATAD2
affects apoptosis in HCC cells, we performed an apoptosis assay by
FACS analysis. Transfection of ATAD2-RNAi-lentivirus resulted in a
significant increase in the percentage of apoptotic cells, compared
with the normal control, in HCCLM3 cells (Fig. 3A). To test whether expression of
ATAD2 affects the cell cycle in HCC cells, we performed FACS cell
cycle distribution analysis after 48 h transfection of the
ATAD2-RNAi-lentivirus in HCCLM3 cells, suggesting that knockdown
ATAD2 induced cell cycle arrest (Fig.
3B).
Depletion of ATAD2 influences the
invasive and migratory capacity of liver cancer cells
Cell invasion and migration assays demonstrated that
the Huh7 and HCCLM3 liver cancer cell lines transfected with
ATAD2-RNAi-lentivirus displayed more attenuated invasive and
migratory capacities than those of the normal controls (Fig. 4). The depletion of ATAD2 in Huh7
(control vs. ATAD2-RNAi: 60±11 vs. 28±5, P<0.001) and HCCLM3
(control vs. ATAD2-RNAi: 72±13 vs. 29±7, P<0.001) cells led to a
significant reduction in migratory cells (Fig. 4A). The invasion ability of Huh7
(control vs. ATAD2-RNAi: 85±11 vs. 37±5, P<0. 01) and HCCLM3
(control vs. ATAD2 siRNA: 68±12 vs. 27±6, P<0.001) cells was
also significantly reduced (Fig.
4B).
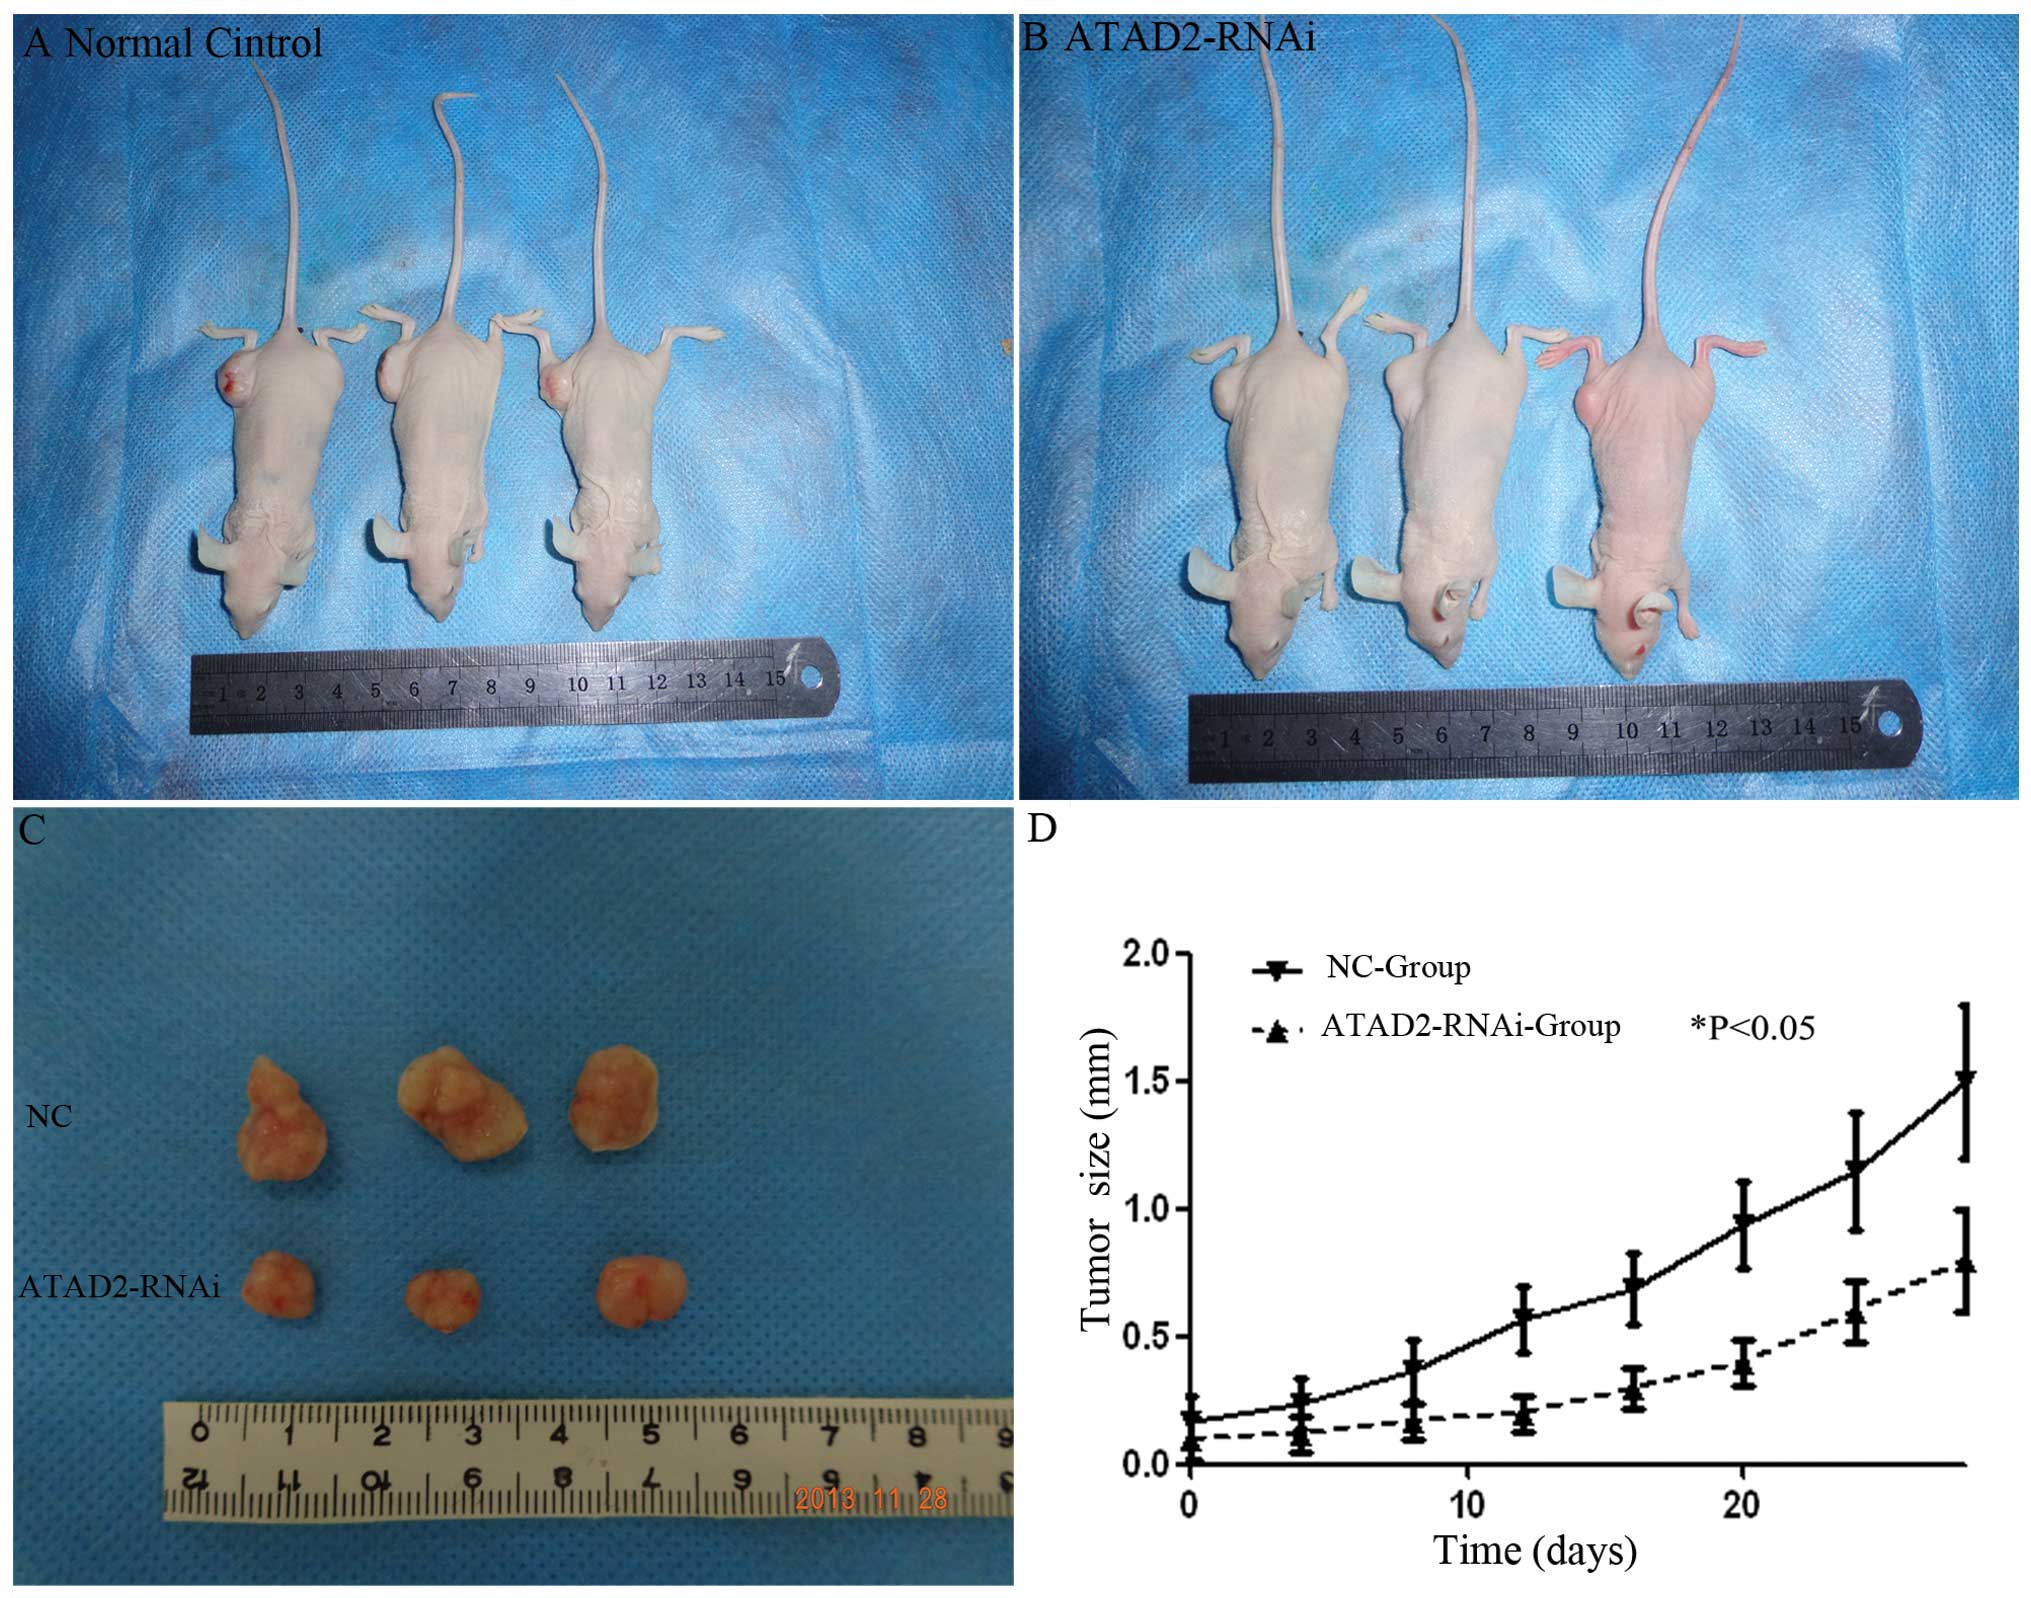
ATAD2-RNAi influences the cell cycle and
inhibits tumor growth in nude mice
To test whether knockdown of ATAD2 could suppress
the tumorigenicity of HCC cells in vivo, a xenograft model
in nude mice was used. Twenty-eight days after the mice were
injected with Huh7 cells and ATAD2-RNAi-lentivirus transfected Huh7
cells, the weights of the tumors in the control, ATAD2-RNAi groups
were 0.56±0.11 and 0.37±0.09 g, respectively. Thus, treatment with
ATAD2-RNAi inhibited the growth of tumors as compared with the
control groups (P<0.05, Fig.
6).
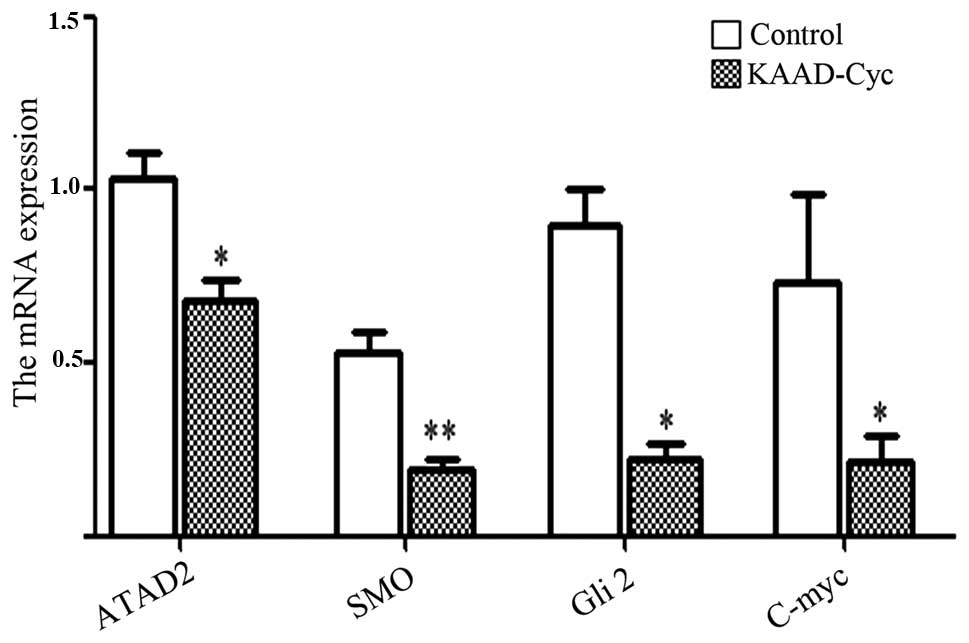
ATAD2 may mediate MYC gene to regulate
the Hh pathway
Some previous research showed that ATAD2 could
cooperate with MYC in activating transcription, and ATAD2 is
limited and required for the efficient transcriptional activation
of a subset of MYC target genes, and Myc-interacting Zinc finger
protein 1 (Miz1) as a Smo and Gli2 binding protein that positively
also could regulate the Hh signaling pathway. Thus, we speculated
that ATAD2 may mediate C-Myc to regulate the Hh pathway.
To investigate this hypothesis, we detected the MYC
mRNA expression after transfection with ATAD2-RNAi-lentivirus. The
mRNA expression of Myc was significantly reduced in Huh7 cells and
HCCLM3 cells, compared with normal control (P<0.05) (Fig. 1), suggesting depletion of ATAD2
could reduce the mRNA expression of Myc and the key genes in the Hh
pathway. Moreover, to test whether the Hh pathway inhibition could
regulate ATAD2 and MYC expression activity, we investigated the
mRNA expression of ATAD2, SMO, Gli2 and found that Myc was reduced
by all treatments with KAAD-Cyc (Fig.
7). Therefore, we speculate there may be a mutual regulation
between ATAD2 and the Hh pathway.
Discussion
ATAD2 has been demonstrated as a novel candidate
oncogene and possibly a therapeutic target for several types of
human cancer (7–10). The Hh pathway has also been
demonstrated to have a strong relationship with the progression of
HCC (12–14). Based on PCR array analysis, we
suggested that there may be a relationship between ATAD2 and the Hh
pathway. In our study, the abnormal expression of ATAD2 and Hh
pathway in HCC were studied. IHC detection showed that ATAD2 was
located in the nucleus and the cytoplasm, Ptch1 was located in the
cytoplasm and membrane, SOM and Gli2 were located in the nucleus
and cytoplasm. Furthermore, ATAD2 and Hh pathway were both
consistently highly expressed in hepatic cancer tissues, but at low
levels in normal liver cells. Moreover, RT-PCR also showed the high
expression of ATAD2 and the Hh pathway at mRNA level. These
findings provide evidence that the upregulation of ATAD2 and Hh
pathway may play an important role in HCC tumorigenesis, and we
speculate there may be a pathway between ATAD2 and the Hh
pathway.
Combined with the clinicopathological
characteristics of all tissue samples, correlation analyses
indicated that the high expression of ATAD2 in the HCC tissues was
positively correlated with tumor metastasis. PTCH1 was positively
correlated with tumor stage, and Gli2 was positively correlated
with tumor metastasis. These results demonstrated that the
upregulation of ATAD2 and Hh pathway in HCC might both play an
important role in promoting malignant tumors, and we suggested that
ATAD2 might regulate the Hh pathway in the metastasis and
proliferation of hepatic malignant tumors. Furthermore, we found
that the high expression of ATAD2 and Ptch1 and Gli2 in HCC was a
strong and independent predictor of shortened overall survival.
Similar results have been observed in other human malignancies,
such as esophageal, gastric, colon and breast cancers (7–14).
To elucidate the expression of ATAD2 and Hh pathway
and the function of ATAD2 in HCC, in further experiments we showed
that the mRNA and protein expression of ATAD2 and Ptch1, SMO and
Gli2 in HCCLM3 and Huh7 cell lines, and the mRNA and protein
expression of ATAD2 and Hh pathway were statistically higher in
Huh7/HCCLM3 cell lines than in the ATAD2-RNAi-lentivirus. ATAD2 was
able to regulate HCC cell proliferation, migration and invasion,
and depletion of ATAD2 could inhibit the tumorigenicity of Huh7
cells in nude mice. These results were in agreement with previous
studies that showed that ATAD2 was closely involved in several key
regulatory mechanisms to control cell proliferation or tumor
metastasis.
The mechanism of the impact of ATAD2 on Hh pathway
is still unknown. But previous study showed that ATAD2 has a
bromodomain that could mediate histone hyperacetylation and is able
to bind acetylated lysines in histones and other proteins (19,20).
ATAD2 bromodomain appears to play a role in supporting the
proliferation of cancer cells. A series of pull-down experiments
suggested that ATAD2 bromodomain mediates the binding of the
protein to histone H3/H4 (7).
However, ATAD2 also has a typical AAA ATPase domain (7). In ATAD2, this ATPase domain, like in
many other members of this family, mediates protein
multimerization. An inactive ATPase domain does not multimerize and
cannot be caught in pull-down assays by acetylated histone, which
means AAA ATPase domain has co-activator functions of ATAD2
(6,21). Above all, it has been reported that
ATAD2 could cooperate with MYC in activating transcription, and
ATAD2 is limited and required for the efficient transcriptional
activation of a subset of MYC target genes (7,23).
Dysregulation of the Hedgehog (Hh) pathway has been
proven as implicated in the genes of hepatic cancer. Research has
demonstrated that overexpression of the Smo proto-oncogene mediates
c-myc-overexpression, which plays a critical role in
hepatocarcinogenesis (13).
Blocking the hedgehog pathway was able to inhibit proliferation,
and repressed c-Myc and cyclin D expression in a subset of HCC cell
lines (13). In addition,
Myc-interacting zinc finger protein 1 (Miz1) as a Smo and Gli2
binding protein that positively regulated the Hh signaling pathway
(22–26). Miz1 could influence Hh activation
in a Smo-dependent manner, and depletion of Miz1 blocks the nuclear
translocation of Gli2 (27–29).
Based on above studies, we speculated ATAD2 may mediate MYC to
regulate the Hh pathway activation, inducing the expression of
numerous target genes, such as Ptch1, Hip, Gli and Wnt, that
regulate proliferation, and differentiation (17,30).
In our present study, we detected the changes in the
expression of PTCH1, SMO, Gli2 and MYC with transfection of
ATAD2-RNAi-lentivirus in Huh7 and HCCLM3 cell lines. The mRNA and
protein of PTCH1, SMO, Gli2 and MYC respectively decreased in Huh7
and HCCLM3 cell lines. Depletion of ATAD2 negatively regulated the
Hh pathway activation. Moreover, we also detected the changes in
the mRNA expression of ATAD2, SMO, and Myc in HCCLM3 cell lines
treated with 1,000 nM KAAD-Cyc. The results indicated that the mRNA
expression of ATAD2, SMO, MYC were all decreased after being
treated with 1,000 nM KAAD-Cyc, compared with the control groups.
Therefore, we speculate that upregulated ATAD2 was limited and
required for MYC to regulated Hh pathway to influence the
proliferation and metastasis of hepatic cancer, and depletion of
ATAD2 was able to inhibit the activation of the Hh pathway, MYC
genes and the growth of cancer. Moreover, blocking the Hh pathway
also could negatively regulate the expression of ATAD2 and MYC
genes. There was an interaction between ATAD2 and the Hh
pathway.
In the present study, we demonstrated the ectopic
upregulation of ATAD2 and Hh pathway in HCC tissues, and ATAD2 and
Gli2 indicated a poor prognosis for HCC patients. We had six
reasons to clarify the relationship and function of ATAD2 and the
Hh pathway in HCC in a systematic, scientific and rigorous manner:
i) the mRNA and protein expression ATAD2 and the Hh pathway were
upregulated in HCC and hepatic cancer cell lines; ii) the
negatively down-regulated mRNA and protein expression of genes in
the Hh pathway in hepatic cancer cell lines, after being treated
with transfection of ATAD2-RNAi-l; iii) depletion of ATAD2 can
inhibit the proliferative and invasive capacity in HCC cell lines
and the growth of hepatic cancers in nude mice; iv) previous
studies proved that ATAD2 could cooperate with MYC in activating
transcription, and ATAD2 is required for the efficient
transcriptional activation of a subset of MYC target genes; v) Myc
was able to regulate SMO and Gli genes in the Hh signaling pathway;
and vi) blocking the Hh pathway also could negatively regulate the
expression of ATAD2 and MYC genes, after treated with 1,000 nM KAAD
or Cyc. However, further studies are needed to determine the
precise mechanism underlying the role of ATAD2 in HCC progression
and to make ATAD2 an attractive target for future cancer
therapeutics.
In summary, we found that ATAD2 and Ptch1 were both
highly expressed in HCC tissues, compared with paired normal
hepatic tissues. Moreover, we found that ATAD2 could affect the
expression of the Hh pathway by PCR and western blot analysis in
HCC cell lines, by observing the outcome before and after
transfection. We speculate that ATAD2 cooperate with MYC-regulated
expression of SMO, and Gli, activating the Hh pathway and inducing
the active feedback of the Hh pathway.
Acknowledgements
This study was supported by the
Liaoning Provincial Committee of Education, Science and Technology
Research (grant 20060903 to G.W.).
References
|
1.
|
But DY, Lai CL and Yuen MF: Natural
history of hepatitis-related hepatocellular carcinoma. World J
Gastroenterol. 14:1652–1656. 2008. View Article : Google Scholar : PubMed/NCBI
|
|
2.
|
Chen HW, et al: Expression of FOXJ1 in
hepatocellular carcinoma: Correlation with patients’ prognosis and
tumor cell proliferation. Mol Carcinog. 52:647–659. 2013.PubMed/NCBI
|
|
3.
|
He H, Wu G, Li W, Cao Y and Liu Y: CIP2A
is highly expressed in hepatocellular carcinoma and predicts poor
prognosis. Diagn Mol Pathol. 21:143–149. 2012. View Article : Google Scholar : PubMed/NCBI
|
|
4.
|
Block TM, Mehta AS, Fimmel CJ and Jordan
R: Molecular viral oncology of hepatocellular carcinoma. Oncogene.
22:5093–5107. 2003. View Article : Google Scholar : PubMed/NCBI
|
|
5.
|
Feng JT, Shang S and Beretta L: Proteomics
for the early detection and treatment of hepatocellular carcinoma.
Oncogene. 25:3810–3817. 2006. View Article : Google Scholar
|
|
6.
|
Zou JX, Revenko AS, Li LB, et al: ANCCA,
an estrogen-regulated AAA+ ATPase coactivator for ERalpha, is
required for coregulator occupancy and chromatin modification. Proc
Natl Acad Sci USA. 104:18067–18072. 2007.PubMed/NCBI
|
|
7.
|
Ciró M, Prosperini E, Quarto M, et al:
ATAD2 is a novel cofactor for MYC, overexpressed and amplified in
aggressive tumors. Cancer Res. 69:8491–8498. 2009.PubMed/NCBI
|
|
8.
|
Alizadeh AA, Eisen MB, Davis RE, et al:
Distinct types of diffuse large B-cell lymphoma identified by gene
expression profiling. Nature. 403:503–511. 2000. View Article : Google Scholar : PubMed/NCBI
|
|
9.
|
Chen X, Cheung ST, So S, et al: Gene
expression patterns in human liver cancers. Mol Biol Cell.
13:1929–1939. 2002. View Article : Google Scholar PubMed/NCBI
|
|
10.
|
Ma XJ, Salunga R, Tuggle JT, et al: Gene
expression profiles of human breast cancer progression. Proc Natl
Acad Sci USA. 100:5974–5979. 2003. View Article : Google Scholar : PubMed/NCBI
|
|
11.
|
Huang Q, Lin B, Liu H, et al: RNA-Seq
analyses generate comprehensive transcriptomic landscape and reveal
complex transcript patterns in hepatocellular carcinoma. PLoS One.
6:e261682011. View Article : Google Scholar
|
|
12.
|
Cheng WT, Xu K, Tian DY, et al: Role of
Hedgehog signaling pathway in proliferation and invasiveness of
hepatocellular carcinoma cells. Int J Oncol. 34:829–836.
2009.PubMed/NCBI
|
|
13.
|
Sicklick JK, Li YX, Jayaraman A, et al:
Dysregulation of the hedgehog pathway in human
hepatocarcinogenesis. Carcinogenesis. 27:748–757. 2006. View Article : Google Scholar : PubMed/NCBI
|
|
14.
|
Patil MA, Zhang J, Ho C, et al: Hedgehog
signaling in human hepatocellular carcinoma. Cancer Biol Ther.
5:111–117. 2006. View Article : Google Scholar : PubMed/NCBI
|
|
15.
|
Ruiz i Altaba A, Sánchez P and Dahmane N:
Gli and hedgehog in cancer: tumours, embryos and stem cells. Nat
Rev Cancer. 2:361–372. 2002.PubMed/NCBI
|
|
16.
|
Ingham PW and McMahon AP: Hedgehog
signaling in animal development: paradigms and principles. Genes
Dev. 15:3059–3087. 2001. View Article : Google Scholar : PubMed/NCBI
|
|
17.
|
Cohen MM Jr: The Hedgehog signaling
network. Am J Med Genet A. 123A:5–28. 2003. View Article : Google Scholar : PubMed/NCBI
|
|
18.
|
Wu G, Liu H, He H, Wang Y, Lu X, et al:
miR-372 down-regulates the oncogene ATAD2 to influence
hepatocellular carcinoma proliferation and metastasis. BMC Cancer.
14:1072014. View Article : Google Scholar : PubMed/NCBI
|
|
19.
|
Pivot-Pajot C, Caron C, Govin J, et al:
Acetylation-dependent chromatin reorganization by BRDT, a
testis-specific bromo-domain-containing protein. Mol Cell Biol.
23:5354–5365. 2003. View Article : Google Scholar : PubMed/NCBI
|
|
20.
|
Filippakopoulos P, Picaud S, Mangos M, et
al: Histone recognition and large-scale structural analysis of the
human bromodomain family. Cell. 149:214–231. 2012. View Article : Google Scholar : PubMed/NCBI
|
|
21.
|
Caron C, Lestrat C, Marsal S, et al:
Functional characterization of ATAD2 as a new cancer/testis factor
and a predictor of poor prognosis in breast and lung cancers.
Oncogene. 29:5171–5181. 2010. View Article : Google Scholar : PubMed/NCBI
|
|
22.
|
Seoane J, Pouponnot C, Staller P, Schader
M, Eilers M, et al: TGFbeta influences Myc, Miz-1 and Smad to
control the CDK inhibitor p15INK4b. Nat Cell Biol. 3:400–408. 2001.
View Article : Google Scholar : PubMed/NCBI
|
|
23.
|
Leachman NT, Brellier F, Ferralli J, et
al: ATAD2B is a phylogenetically conserved nuclear protein
expressed during neuronal differentiation and tumorigenesis. Dev
Growth Differ. 52:747–755. 2010. View Article : Google Scholar : PubMed/NCBI
|
|
24.
|
Lu J, Chen M, Ren XR, et al: Regulation of
Hedgehog signaling by Myc-interacting zinc finger protein 1, Miz1.
PLoS One. 8:e633532013. View Article : Google Scholar : PubMed/NCBI
|
|
25.
|
Peukert K, Staller P, Schneider A, et al:
An alternative pathway for gene regulation by Myc. EMBO J.
16:5672–5686. 1997. View Article : Google Scholar : PubMed/NCBI
|
|
26.
|
Wanzel M, Herold S and Eilers M:
Transcriptional repression by Myc. Trends Cell Biol. 13:146–150.
2003. View Article : Google Scholar : PubMed/NCBI
|
|
27.
|
Patel JH and McMahon SB: BCL2 is a
downstream effector of MIZ-1 essential for blocking c-MYC-induced
apoptosis. J Biol Chem. 282:5–13. 2007. View Article : Google Scholar : PubMed/NCBI
|
|
28.
|
Rao G, Pedone CA, Coffin CM, Holland EC
and Fults DW: c-Myc enhances sonic hedgehog-induced medulloblastoma
formation from nestin-expressing neural progenitors in mice.
Neoplasia. 5:198–204. 2003. View Article : Google Scholar : PubMed/NCBI
|
|
29.
|
Wang Y, Wu MC, Sham JS, et al: Prognostic
significance of c-myc and AIB1 amplification in hepatocellular
carcinoma. A broad survey using high-throughput tissue microarray.
Cancer. 95:2346–2352. 2002. View Article : Google Scholar : PubMed/NCBI
|
|
30.
|
Shachaf CM, Kopelman AM, Arvanitis C, et
al: MYC inactivation uncovers pluripotent differentiation and
tumour dormancy in hepatocellular cancer. Nature. 431:1112–1117.
2004. View Article : Google Scholar : PubMed/NCBI
|