Introduction
GBM is the most common and aggressive primary brain
tumor with high mortality and morbidity. The prognosis for
malignant gliomas has not significantly improved in the last four
decades (1,2). In the past two decades, the molecular
mechanisms, genetics and pathways to treat GBM have extensively
been studied. However, the precise mechanism of GBM is unknown and
its median survival rate is very low (3,4). The
early detection and assessment of GBM pathologies still need to be
solved.
MicroRNAs are 21–25 nucleotide small, non-coding
RNAs that post-transcriptionally repress the expression of
protein-coding genes through binding to the 3′ untranslated regions
(UTR) of the target mRNAs (5–9).
Accumulated evidence indicates that miRNAs are important in the
regulation of many biological processes, such as developmental
timing, cell metabolism, cell differentiation, cell death, cell
proliferation, haematopoiesis and patterning of the nervous system
(10). In the past several years,
the importance of microRNAs (miRNAs) in cancer cells has been
recognized. Proper control of miRNA expression is essential for
maintaining a steady state. The stenoplastic existence of
circulating miRNAs in the blood of cancer patients has raised the
possibility that miRNAs may serve as a novel diagnostic marker
(11).
In this study, we profiled miRNAs expression in the
peripheral blood of GBM and healthy humans by microarray. The
differentially expressed miRNAs were analyzed, then selected to
bioinformatic analyses of target prediction. The predicted target
genes were subjected to bioinformatic analyses, including gene
ontology and pathway analyses. Analyzing the potential molecular
markers and the possible relationship between the differentially
expressed protein-coding genes and miRNAs in periopheral blood of
GBM will help to give further insight into the pathogenesis of
GBM.
Materials and methods
Sample preparation and RNA
extraction
Selection of subjects, study design and blood
sampling. The miRNA profiles from 3 circulating blood samples of
GBM patients and 3 age- and gender-matched healthy controls from
donors without GBM were obtained according to clinical protocols at
the clinical medical college of Yangzhou University. All subjects
were generally in good health, and none had diabetes or any other
serious concomitant diseases. The patients had not received prior
treatment. Following informed consent at the time of acquisition,
the samples were collected, and stored at liquid nitrogen. Blood
for plasma preparation was collected using a 19-gauge needle into
vacutainers containing 0.129 M sodium citrate (1 volume
anticoagulant and 9 volumes whole blood) as anticoagulant,
centrifuged at 2000 g for 15 min at 22°C, transferred into sterile
cryovials in aliquots of 1 ml and stored at −70°C until further
analysis. RNA extractions from plasma and all qPCRs were performed
by Exiqon Services (Vedbaek, Denmark). Total-RNA was extracted from
plasma using miRNeasy Mini kits. Plasma was thawed on ice and
centrifuged (1000 × g; 5 min; 4°C). Plasma (200 μl) was mixed with
750 μl of Qiazol containing 0.94 μg/μl of MS2-bacteriophage
(incubated for 5 min, room temperature). Samples were chloroform
extracted, ethanol precipitated, transferred to RNeasy Mini columns
and washed according to the manufacturer’s protocols. RNA was
eluted in 50 μl RNase-free water.
MicroRNA real-time PCR array
Human panelI+II v3 (the 752 micRNAs) miRCURY LNA™
Universal RT miRNA PCR array were obtained from the manufacturers.
The qRT-PCR-based platforms promise to be more sensitive than
array-based miRNA quantification platforms (12), and their use for analyzing samples
with low miRNA levels, such as human plasma, is increasing
(13–18).
RNA was reversely transcribed using miRCURY LNA
Universal RT microRNA PCR, polyadenylation and cDNA synthesis kit
(Exiqon, Vedbaek, Denmark). PCR reactions (10 μl) were performed
according to the miRCURY LNA Universal RT microRNA PCR protocol;
each miRNA was assayed once on microRNA Ready-to-Use PCR Human
panel I+II (Exiqon, Kangchen, China). Controls included primers for
six independent reference genes, including 3 microRNAs
(hsa-miR-103, hsa-miR-191 and hsa-miR-423-5p), and 3 small RNA (U6,
SNORD38B and SNORD49A).
The amplification profile was denatured at 95.8°C
for 10 min, followed by 40 cycles of 95.8°C for 10 sec and 60.8°C
for 60 sec. At the end of the PCR cycles, melting curve analyses
were performed. All reactions were done in triplicate.
Amplification efficiency was calculated using algorithms similar to
LinReg (Exiqon, Vedbaek, Denmark). All assays were inspected for
distinct melting curves and melting temperatures were checked to be
within known assay specifications. Expression levels of mature
mRNAs were evaluated using comparative CT method (2−ΔCT)
(19). Raw Ct values were
calculated as recommended by Exiqon Negative controls, without
enzymes, from the reverse transcription reaction was treated and
profiled. Data that did not pass these criteria were omitted from
any further analysis.
Statistical analysis
The approximate normal distribution of the measured
data was verified by Shapiro-Wilk test. Data are expressed as the
mean ± SD unless otherwise noted. The differences between groups
were analyzed using by unpaired two-tailed parametric t-test when
only two groups were present and the null hypothesis was rejected
at the 0.05 level. The correlation between two dichotomous
variables was assessed using Fisher’s exact test. The enrichment
P-value of the PathwayID used Fisher’s exact test.
Results
Differentially expressed miRNAs in glioma
patients
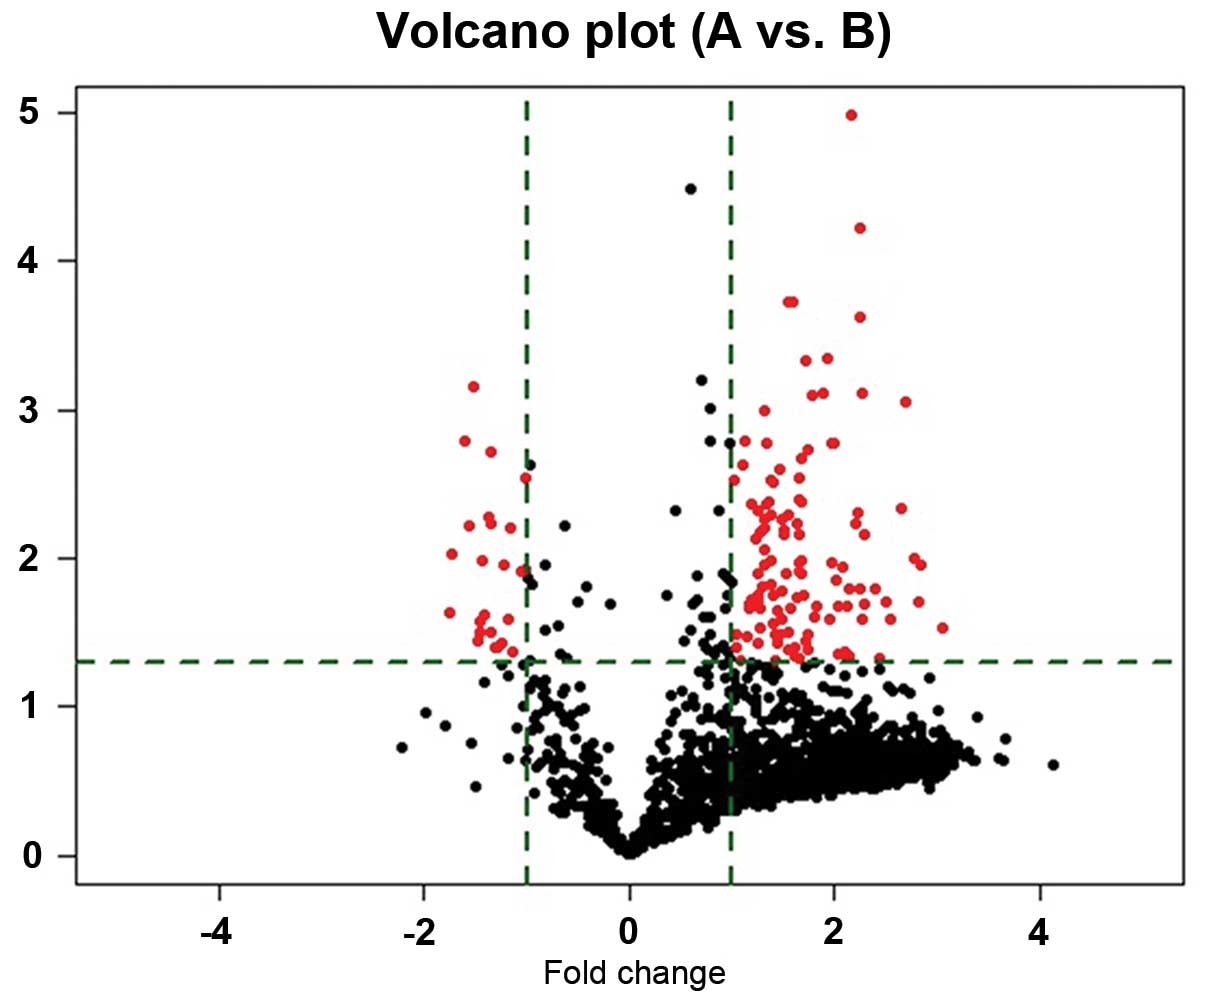
Altogether, 752 mature miRNAs were quantitatively
analyzed using a microarray platform. Following background
subtraction and quantile normalization, all miRNAs with median
intensity below 100 were considered lowly abundant and removed. The
remaining 139 miRNAs (fold change ≥2.0) were then analyzed using
computational approaches (Fig. 1).
Compared to peripheral blood of control cases, we observed
significant deregulation of 139 miRNAs, 115 miRNAs were upregulated
(83%) (Table I), whereas 24 miRNAs
were downregulated (17%) (Table
II). Especially three miRNAs, the miR-576-5p, miR-340, miR-626,
the most upregulated and miR-320, let-7g-5p, miR-7-5P, the most
downregulated miRNA, in glioma patients. Of the six miRNAs,
miR-576-5p displayed a 3.05-fold increased median expression in
samples from glioblastoma patients compared to healthy controls.
The expression level of miR-7-5P was decreased in the glioblastoma
patients to 0.37-fold compared with the healthy donors.
 | Table ISignificant markers for
differentiation of A vs. B 2.0-fold downregulated miRNAs. |
Table I
Significant markers for
differentiation of A vs. B 2.0-fold downregulated miRNAs.
| ID | Name | Fold change
A vs. B | P-value
A vs. B | Mean of B group | Mean of A group | CV-value
B group | CV-value
A group |
|---|
| 146190 | hsa-miR-3927-3p | 3.203477534 | 0.012777 | 10.33333 | 30.66667 | 0.30381 | 0.261223 |
| 148599 | hsa-miR-3680-5p | 3.051520614 | 0.039572 | 56.66667 | 171.6667 | 0.294048 | 0.37474 |
| 148206 | hsa-miR-3664-5p | 2.517210786 | 0.001675 | 64.66667 | 157.5 | 0.249211 | 0.097353 |
| 169031 | hsa-miR-4726-5p | 2.346233498 | 0.018606 | 753 | 1731 | 0.194819 | 0.245785 |
| 46924 | hsa-miR-1252 | 3.271682269 | 0.035915 | 22.83333 | 67.16667 | 0.425179 | 0.364375 |
| 168954 | hsa-miR-5580-5p | 3.283873506 | 0.036384 | 23.83333 | 75 | 0.146777 | 0.38659 |
| 168811 |
hsa-miR-1255b-2-3p | 2.991009789 | 0.000186 | 136.5 | 390 | 0.080275 | 0.082555 |
| 10138 |
hsa-miR-130a-3p | 2.578573273 | 0.002984 | 18.66667 | 45.33333 | 0.293111 | 0.118974 |
| 148640 | hsa-miR-34b-3p | 5.831082399 | 0.025291 | 5.333333 | 30.83333 | 0.200898 | 0.410603 |
| 169132 | hsa-miR-382-3p | 8.247805209 | 0.029701 | 3.166667 | 27.5 | 0.700007 | 0.452172 |
| 169064 |
hsa-miR-4778-3p | 2.806551133 | 0.025484 | 39.33333 | 100.6667 | 0.438363 | 0.280325 |
| 42744 | hsa-miR-23a-3p | 2.726506347 | 0.022091 | 16.83333 | 42.33333 | 0.602761 | 0.205527 |
| 29872 | hsa-miR-340-5p | 2.353775226 | 0.007455 | 137 | 300.8333 | 0.339218 | 0.137188 |
| 11074 | hsa-miR-34c-5p | 7.088329336 | 0.010987 | 5 | 35.16667 | 0.263536 | 0.329962 |
| 146085 | hsa-miR-3170 | 4.894704669 | 0.020575 | 6 | 28.5 | 0.03643 | 0.370965 |
| 145643 | hsa-miR-382-5p | 4.369951187 | 0.016087 | 10.83333 | 45.5 | 0.109142 | 0.332717 |
| 147831 |
kshv-miR-K12-1-3p | 2.659428299 | 0.032152 | 27.5 | 71.66667 | 0.11655 | 0.332325 |
| 147743 | hsa-miR-4275 | 3.889772826 | 0.001654 | 66 | 246.3333 | 0.03748 | 0.170299 |
| 148593 |
hsa-miR-3605-3p | 3.070344638 | 0.045766 | 18 | 52.5 | 0.244884 | 0.39999 |
| 148420 |
hsa-miR-3607-3p | 4.329000571 | 0.020676 | 8.166667 | 34 | 0.094569 | 0.358471 |
| 148382 | hsa-miR-3609 | 4.069918082 | 0.044562 | 5.833333 | 23 | 0.215226 | 0.448962 |
| 148215 |
hsa-miR-3591-3p | 2.77311974 | 0.002476 | 37.83333 | 99 | 0.107459 | 0.158783 |
| 168730 | hsa-miR-4464 | 3.109959132 | 0.005786 | 8.166667 | 24 | 0.170293 | 0.211635 |
| 168644 | hsa-miR-4775 | 2.653797224 | 0.017591 | 17.83333 | 45 | 0.154669 | 0.2708 |
| 168671 |
hsa-miR-3140-5p | 2.73656565 | 0.032136 | 31 | 77.16667 | 0.352385 | 0.315583 |
| 168917 | hsa-miR-4511 | 3.154343491 | 0.002866 | 77.16667 | 223.3333 | 0.440141 | 0.116191 |
| 169023 |
hsa-miR-4712-3p | 2.898882114 | 0.00506 | 113.5 | 300.1667 | 0.348018 | 0.164139 |
| 169247 | hsa-miR-4477a | 2.066080045 | 0.032175 | 26.16667 | 50.66667 | 0.273629 | 0.243579 |
| 169407 | hsa-miR-4301 | 3.147673634 | 0.006956 | 37 | 109.6667 | 0.137091 | 0.227335 |
| 148241 | hsa-miR-3649 | 2.013497623 | 0.002943 | 22 | 42.33333 | 0.068752 | 0.13039 |
| 42446 | hsa-miR-576-5p | 3.184821155 | 0.004122 | 176.1667 | 537.3333 | 0.289242 | 0.179645 |
| 145852 | hsa-miR-210 | 2.258332188 | 0.020024 | 29.66667 | 60.66667 | 0.572146 | 0.04695 |
| 147614 | hsa-miR-4299 | 3.136510824 | 0.047028 | 10.83333 | 32.66667 | 0.112652 | 0.414372 |
| 168727 | hsa-miR-4426 | 2.423405402 | 0.029561 | 100.1667 | 220.3333 | 0.503972 | 0.225886 |
| 169138 | hsa-miR-4504 | 2.383728075 | 0.019578 | 18.33333 | 41.33333 | 0.223376 | 0.24957 |
| 42576 | hsa-miR-342-5p | 2.843331991 | 0.006531 | 24.5 | 63.16667 | 0.570785 | 0.079951 |
| 19588 | hsa-miR-17-3p | 3.077276567 | 0.018349 | 12.33333 | 34.83333 | 0.515709 | 0.253543 |
| 10995 |
hsa-miR-199a-3p/hsa-miR-199b-3p | 4.88116897 | 0.006986 | 7.333333 | 34.33333 | 0.096524 | 0.269352 |
| 46788 | hsa-miR-1299 | 2.473827682 | 0.008765 | 215.3333 | 486.8333 | 0.436409 | 0.124299 |
| 11022 | hsa-miR-221-3p | 2.427402229 | 0.006613 | 30.5 | 68.66667 | 0.326156 | 0.143626 |
| 10936 |
hsa-miR-130b-3p | 2.067075639 | 0.040137 | 35.16667 | 65.66667 | 0.592687 | 0.083123 |
| 147809 |
hsa-miR-514b-3p | 2.579816857 | 0.014999 | 13.66667 | 33.33333 | 0.233535 | 0.243151 |
| 147805 | hsa-miR-3183 | 3.861577136 | 0.025355 | 18.5 | 64.66667 | 0.581673 | 0.336679 |
| 148065 |
hsa-miR-3689b-3p/hsa-miR-3689c | 3.136474117 | 0.010713 | 9.5 | 28 | 0.292469 | 0.244212 |
| 148402 | hsa-miR-3920 | 4.001086173 | 0.001655 | 24.33333 | 87.83333 | 0.604129 | 0.08289 |
| 148064 | hsa-miR-3926 | 2.5086651 | 0.004276 | 28.33333 | 64.83333 | 0.428735 | 0.050641 |
| 168796 |
hsa-miR-3664-3p | 2.369986306 | 0.037827 | 33.5 | 74.83333 | 0.29549 | 0.30304 |
| 169080 |
hsa-miR-4684-5p | 3.284979213 | 0.000461 | 12 | 36.5 | 0.333739 | 0.052713 |
| 169056 | hsa-miR-4669 | 3.826929416 | 0.000454 | 11.83333 | 41.33333 | 0.434247 | 0.042278 |
| 169356 |
hsa-miR-548aa/hsa-miR-548ap-3p/hsa-miR-548t-3p | 2.460868369 | 0.015366 | 29.66667 | 68 | 0.36115 | 0.206501 |
| 6880 | hsa-miR-297 | 2.3954973 | 0.012651 | 21 | 47.66667 | 0.184716 | 0.221655 |
| 169054 | hsa-miR-4422 | 4.445358595 | 1.04E-05 | 8 | 33.33333 | 0.147536 | 0.035785 |
| 17863 | hsa-miR-934 | 2.361722381 | 0.004803 | 23 | 51.5 | 0.131753 | 0.167395 |
| 42929 | hsa-miR-25-5p | 2.671452102 | 0.0491 | 16 | 40.83333 | 0.372552 | 0.361894 |
| 10998 | hsa-miR-19b-3p | 2.107251706 | 0.049556 | 34.83333 | 68.83333 | 0.305903 | 0.292752 |
| 168590 |
hsa-miR-4520a-5p/hsa-miR-4520b-5p | 2.156306634 | 0.002379 | 47.33333 | 97.16667 | 0.080863 | 0.130327 |
| 169038 | hsa-miR-488-3p | 4.769928835 | 0.000239 | 9.166667 | 40 | 0.461345 | 0.052185 |
| 11184 | hsa-miR-99b-5p | 7.001061122 | 0.019742 | 18.5 | 115.5 | 0.512366 | 0.387807 |
| 11093 | hsa-miR-379-5p | 6.293079862 | 0.00468 | 7 | 40.83333 | 0.222742 | 0.253094 |
| 42723 | hsa-miR-195-3p | 2.651388508 | 0.003052 | 25.5 | 63.33333 | 0.219692 | 0.14664 |
| 10997 | hsa-miR-19a-3p | 3.889673823 | 0.01088 | 10.5 | 38.5 | 0.264691 | 0.278187 |
| 146066 | hsa-miR-3116 | 3.178096875 | 0.002139 | 12 | 35 | 0.39386 | 0.114116 |
| 145722 | hsa-miR-520e | 3.149410672 | 0.003969 | 14.5 | 42.66667 | 0.347124 | 0.164727 |
| 147735 | hsa-miR-4289 | 2.916146221 | 0.000189 | 16 | 44.5 | 0.250692 | 0.002877 |
| 147942 | hsa-miR-4268 | 2.285884624 | 0.018923 | 81.66667 | 170.1667 | 0.494251 | 0.136427 |
| 147752 | hsa-miR-4302 | 4.791125482 | 0.025783 | 5.666667 | 26.66667 | 0.159828 | 0.39453 |
| 168682 | hsa-miR-4502 | 3.324822913 | 0.032542 | 17.5 | 52 | 0.458672 | 0.350977 |
| 168773 | hsa-miR-5702 | 4.677848243 | 0.00501 | 6.333333 | 26.83333 | 0.601745 | 0.206642 |
| 169200 |
hsa-miR-4677-5p | 4.41894338 | 0.045959 | 25.33333 | 99.16667 | 0.453865 | 0.457275 |
| 168994 |
hsa-miR-3591-5p | 3.309725618 | 0.041503 | 335.5 | 977.5 | 0.649707 | 0.357879 |
| 169288 | hsa-miR-4730 | 4.709961044 | 0.015959 | 17 | 72 | 0.378501 | 0.330353 |
| 10947 | hsa-miR-142-3p | 2.955428209 | 0.021391 | 30 | 81.33333 | 0.308113 | 0.294342 |
| 147651 | hsa-miR-3123 | 4.735509368 | 5.95E-05 | 14.5 | 66.5 | 0.158066 | 0.069491 |
| 147556 | hsa-miR-4254 | 3.428058179 | 0.000803 | 25.16667 | 81.33333 | 0.182843 | 0.123553 |
| 11073 | hsa-miR-34b-5p | 2.210146571 | 0.033651 | 21.5 | 45.16667 | 0.164206 | 0.289177 |
| 11041 | hsa-miR-29c-3p | 3.158712421 | 0.012225 | 7.833333 | 23.83333 | 0.093391 | 0.270955 |
| 42490 | hsa-miR-505-5p | 2.366701641 | 0.017946 | 31.16667 | 69.83333 | 0.257714 | 0.234164 |
| 17898 | hsa-miR-99b-3p | 3.226226981 | 0.01745 | 19.33333 | 59.66667 | 0.131474 | 0.303247 |
| 168914 | hsa-miR-5689 | 2.403696329 | 0.021583 | 78.33333 | 185.6667 | 0.248793 | 0.256256 |
| 168930 |
hsa-miR-5582-5p | 3.705151644 | 0.000771 | 24.66667 | 90.5 | 0.339369 | 0.102201 |
| 169369 | hsa-miR-4490 | 6.484947988 | 0.000887 | 4.833333 | 29.66667 | 0.271291 | 0.159504 |
| 17613 | hsa-miR-645 | 3.527654767 | 0.02085 | 15.66667 | 52.33333 | 0.342237 | 0.321159 |
| 13178 | hsa-miR-18a-3p | 4.346091391 | 0.046762 | 7.166667 | 30.33333 | 0.190132 | 0.467137 |
| 147584 |
hsa-miR-548t-5p | 2.469465274 | 0.005526 | 25.66667 | 58.5 | 0.329129 | 0.13442 |
| 147187 | hsa-miR-215 | 4.598242139 | 0.005794 | 8.333333 | 36.33333 | 0.213552 | 0.247929 |
| 145670 | hsa-miR-18b-5p | 4.204749209 | 0.011257 | 6.833333 | 27.16667 | 0.242225 | 0.291091 |
| 148168 | hsa-miR-3658 | 6.848703552 | 0.009947 | 3.5 | 23.5 | 0.188594 | 0.319594 |
| 148265 | hsa-miR-3935 | 2.251023577 | 0.021583 | 39 | 79.66667 | 0.466669 | 0.161861 |
| 42702 |
hsa-miR-30c-1-3p | 3.329134928 | 0.001831 | 13.5 | 40.83333 | 0.461954 | 0.08929 |
| 168717 | hsa-miR-5193 | 2.7843813 | 0.005472 | 28.83333 | 73.83333 | 0.391852 | 0.14674 |
| 168686 |
hsa-miR-4768-5p | 5.676106033 | 0.019686 | 30.5 | 153.3333 | 0.577846 | 0.365043 |
| 168557 |
hsa-miR-4777-5p | 2.479209518 | 0.010962 | 179.8333 | 407 | 0.356283 | 0.180226 |
| 169068 |
hsa-miR-513c-3p | 5.261154548 | 0.015784 | 6.333333 | 32.16667 | 0.22337 | 0.345836 |
| 169129 | hsa-miR-4284 | 2.591855924 | 0.005109 | 15.33333 | 36.66667 | 0.292255 | 0.154386 |
| 169026 | hsa-miR-4679 | 4.811020398 | 0.000761 | 10.83333 | 48.83333 | 0.29521 | 0.135146 |
| 13137 |
hsa-miR-518e-5p | 2.182115742 | 0.001646 | 59.16667 | 126 | 0.21226 | 0.077262 |
| 148620 | hsa-miR-454-3p | 2.768247278 | 0.032807 | 11.33333 | 30.16667 | 0.128874 | 0.342265 |
| 148678 |
hsa-miR-301a-5p | 2.467515688 | 0.000997 | 27.66667 | 63.66667 | 0.252293 | 0.06196 |
| 168792 | hsa-miR-4434 | 2.817438302 | 0.006932 | 11.83333 | 31.66667 | 0.160738 | 0.211055 |
| 17668 | hsa-miR-552 | 2.694699994 | 0.037546 | 12.33333 | 32 | 0.098735 | 0.353729 |
| 13143 |
hsa-miR-301a-3p | 4.00378766 | 0.014095 | 6.166667 | 23.66667 | 0.148628 | 0.309825 |
| 17546 | hsa-miR-585 | 2.894857265 | 0.0128 | 13.33333 | 36.33333 | 0.190016 | 0.256328 |
| 42475 | hsa-miR-221-5p | 2.905359198 | 0.041188 | 31.16667 | 87.66667 | 0.113936 | 0.38058 |
| 33407 | hsa-miR-626 | 2.580059334 | 0.010429 | 157 | 376.6667 | 0.221173 | 0.216872 |
| 17636 |
ebv-miR-BART20-5p | 5.387250347 | 0.047521 | 3.333333 | 18.33333 | 0.477962 | 0.491119 |
| 42466 |
ebv-miR-BART18-3p | 2.274976623 | 0.004247 | 80 | 168.6667 | 0.23888 | 0.128316 |
| 17870 | hsa-miR-628-5p | 4.270594044 | 0.042687 | 5.333333 | 22.66667 | 0.188859 | 0.450096 |
| 147792 | hsa-miR-3165 | 2.497683723 | 0.006189 | 18.66667 | 44 | 0.20665 | 0.17864 |
| 148624 | hsa-miR-942 | 2.79071413 | 0.016599 | 65 | 168.5 | 0.395192 | 0.241847 |
| 148059 | hsa-miR-493-5p | 3.188942439 | 0.010476 | 8.333333 | 25.5 | 0.186781 | 0.255087 |
| 168968 | hsa-miR-147b | 2.917356579 | 0.031679 | 24.83333 | 64.83333 | 0.45819 | 0.314305 |
| 46439 | hsa-miR-1243 | 2.636787535 | 0.027878 | 17.33333 | 44.33333 | 0.076252 | 0.317122 |
| 145914 |
hsa-miR-135b-5p | 3.485787586 | 0.024747 | 13.33333 | 46 | 0.232823 | 0.345846 |
| 169198 |
hsa-miR-3145-5p | 2.561803904 | 0.004227 | 27.83333 | 70.33333 | 0.335386 | 0.123721 |
| 169072 |
hsa-miR-3925-3p | 4.106901165 | 0.021254 | 77.16667 | 336 | 0.904449 | 0.280116 |
| Table IISignificant markers for
differentiation of A vs. B 2.0-fold downregulated miRNAs. |
Table II
Significant markers for
differentiation of A vs. B 2.0-fold downregulated miRNAs.
| ID | Name | Fold
change
A vs. B | P-value
A vs. B | Mean of B
group | Mean of A
group | CV-value
B group | CV-value
A group |
|---|
| 168640 | hsa-miR-4475 | 0.3938 | 0.0314 | 220 | 84.5 | 0.320057962 | 0.114365955 |
| 169368 |
hsa-miR-3529-3p | 0.4512 | 0.0421 | 256.8333333 | 105.3333333 | 0.252745746 | 0.444514077 |
| 147821 | hsa-miR-3169 | 0.3728 | 0.0237 | 6285.833333 | 2340 | 0.275801006 | 0.354230901 |
| 169308 | hsa-miR-4503 | 0.4398 | 0.0261 | 97.16666667 | 41.33333333 | 0.264382278 | 0.219747983 |
| 46324 | hsa-miR-320b | 0.4276 | 0.0110 | 1520.666667 | 599 | 0.138085914 | 0.404888839 |
| 46438 | hsa-let-7g-5p | 0.4787 | 0.0120 | 2122.166667 | 957 | 0.168042032 | 0.253336484 |
| 169182 |
hsa-miR-4728-3p | 0.3001 | 0.0093 | 205.8333333 | 60.16666667 | 0.149970516 | 0.70029427 |
| 32946 | hsa-miR-486-5p | 0.4957 | 0.0116 | 1316.166667 | 635 | 0.123127462 | 0.313923832 |
| 169087 | hsa-miR-149-3p | 0.3466 | 0.0006 | 50.33333333 | 16.66666667 | 0.113365131 | 0.108003899 |
| 169255 |
hsa-miR-4708-5p | 0.4236 | 0.0371 | 672.5 | 284 | 0.303906575 | 0.270147743 |
| 42571 |
hsa-miR-129-1-3p | 0.4064 | 0.0400 | 107.8333333 | 43.16666667 | 0.294985703 | 0.430915646 |
| 147613 |
hsa-miR-3145-3p | 0.3897 | 0.0059 | 120.1666667 | 44.83333333 | 0.154426925 | 0.317036901 |
| 42859 | hsa-miR-675-3p | 0.3379 | 0.0060 | 1893.666667 | 622.1666667 | 0.211374742 | 0.136127979 |
| 19596 | hsa-miR-30d-5p | 0.4956 | 0.0029 | 693 | 332.5 | 0.078739567 | 0.220298587 |
| 169285 | hsa-miR-4467 | 0.3290 | 0.0016 | 200.1666667 | 63.33333333 | 0.14789289 | 0.123802767 |
| 168892 | hsa-miR-4424 | 0.3574 | 0.0358 | 85.5 | 29.33333333 | 0.339119811 | 0.319612141 |
| 29490 | hsa-miR-7-5p | 0.3896 | 0.0019 | 2791.666667 | 1038.5 | 0.117173492 | 0.224858694 |
| 169137 |
hsa-miR-4524b-5p | 0.4468 | 0.0062 | 197.6666667 | 86.5 | 0.146863385 | 0.24004705 |
| 11038 | hsa-miR-299-5p | 0.4080 | 0.0398 | 163.1666667 | 62.83333333 | 0.319291192 | 0.296060783 |
| 42902 | hsa-miR-185-5p | 0.3868 | 0.0052 | 2599.666667 | 939.1666667 | 0.038092839 | 0.486170761 |
| 147952 | hsa-miR-3171 | 0.3716 | 0.0104 | 2774.666667 | 981 | 0.191177266 | 0.387816899 |
| 168870 | hsa-miR-1246 | 0.2956 | 0.0230 | 3013 | 863 | 0.330372226 | 0.275463985 |
| 168925 |
hsa-miR-1273g-3p | 0.3623 | 0.0264 | 381.5 | 126.3333333 | 0.278133806 | 0.446720161 |
| 169143 | hsa-miR-4459 | 0.3663 | 0.0311 | 80.66666667 | 28.33333333 | 0.257323615 | 0.593528641 |
| 168640 | hsa-miR-4475 | 0.3938 | 0.0314 | 220 | 84.5 | 0.320057962 | 0.114365955 |
| 169368 |
hsa-miR-3529-3p | 0.4512 | 0.0421 | 256.8333333 | 105.3333333 | 0.252745746 | 0.444514077 |
| 168640 | hsa-miR-4475 | 0.3938 | 0.0314 | 220 | 84.5 | 0.320057962 | 0.114365955 |
| 169368 |
hsa-miR-3529-3p | 0.4512 | 0.0421 | 256.8333333 | 105.3333333 | 0.252745746 | 0.444514077 |
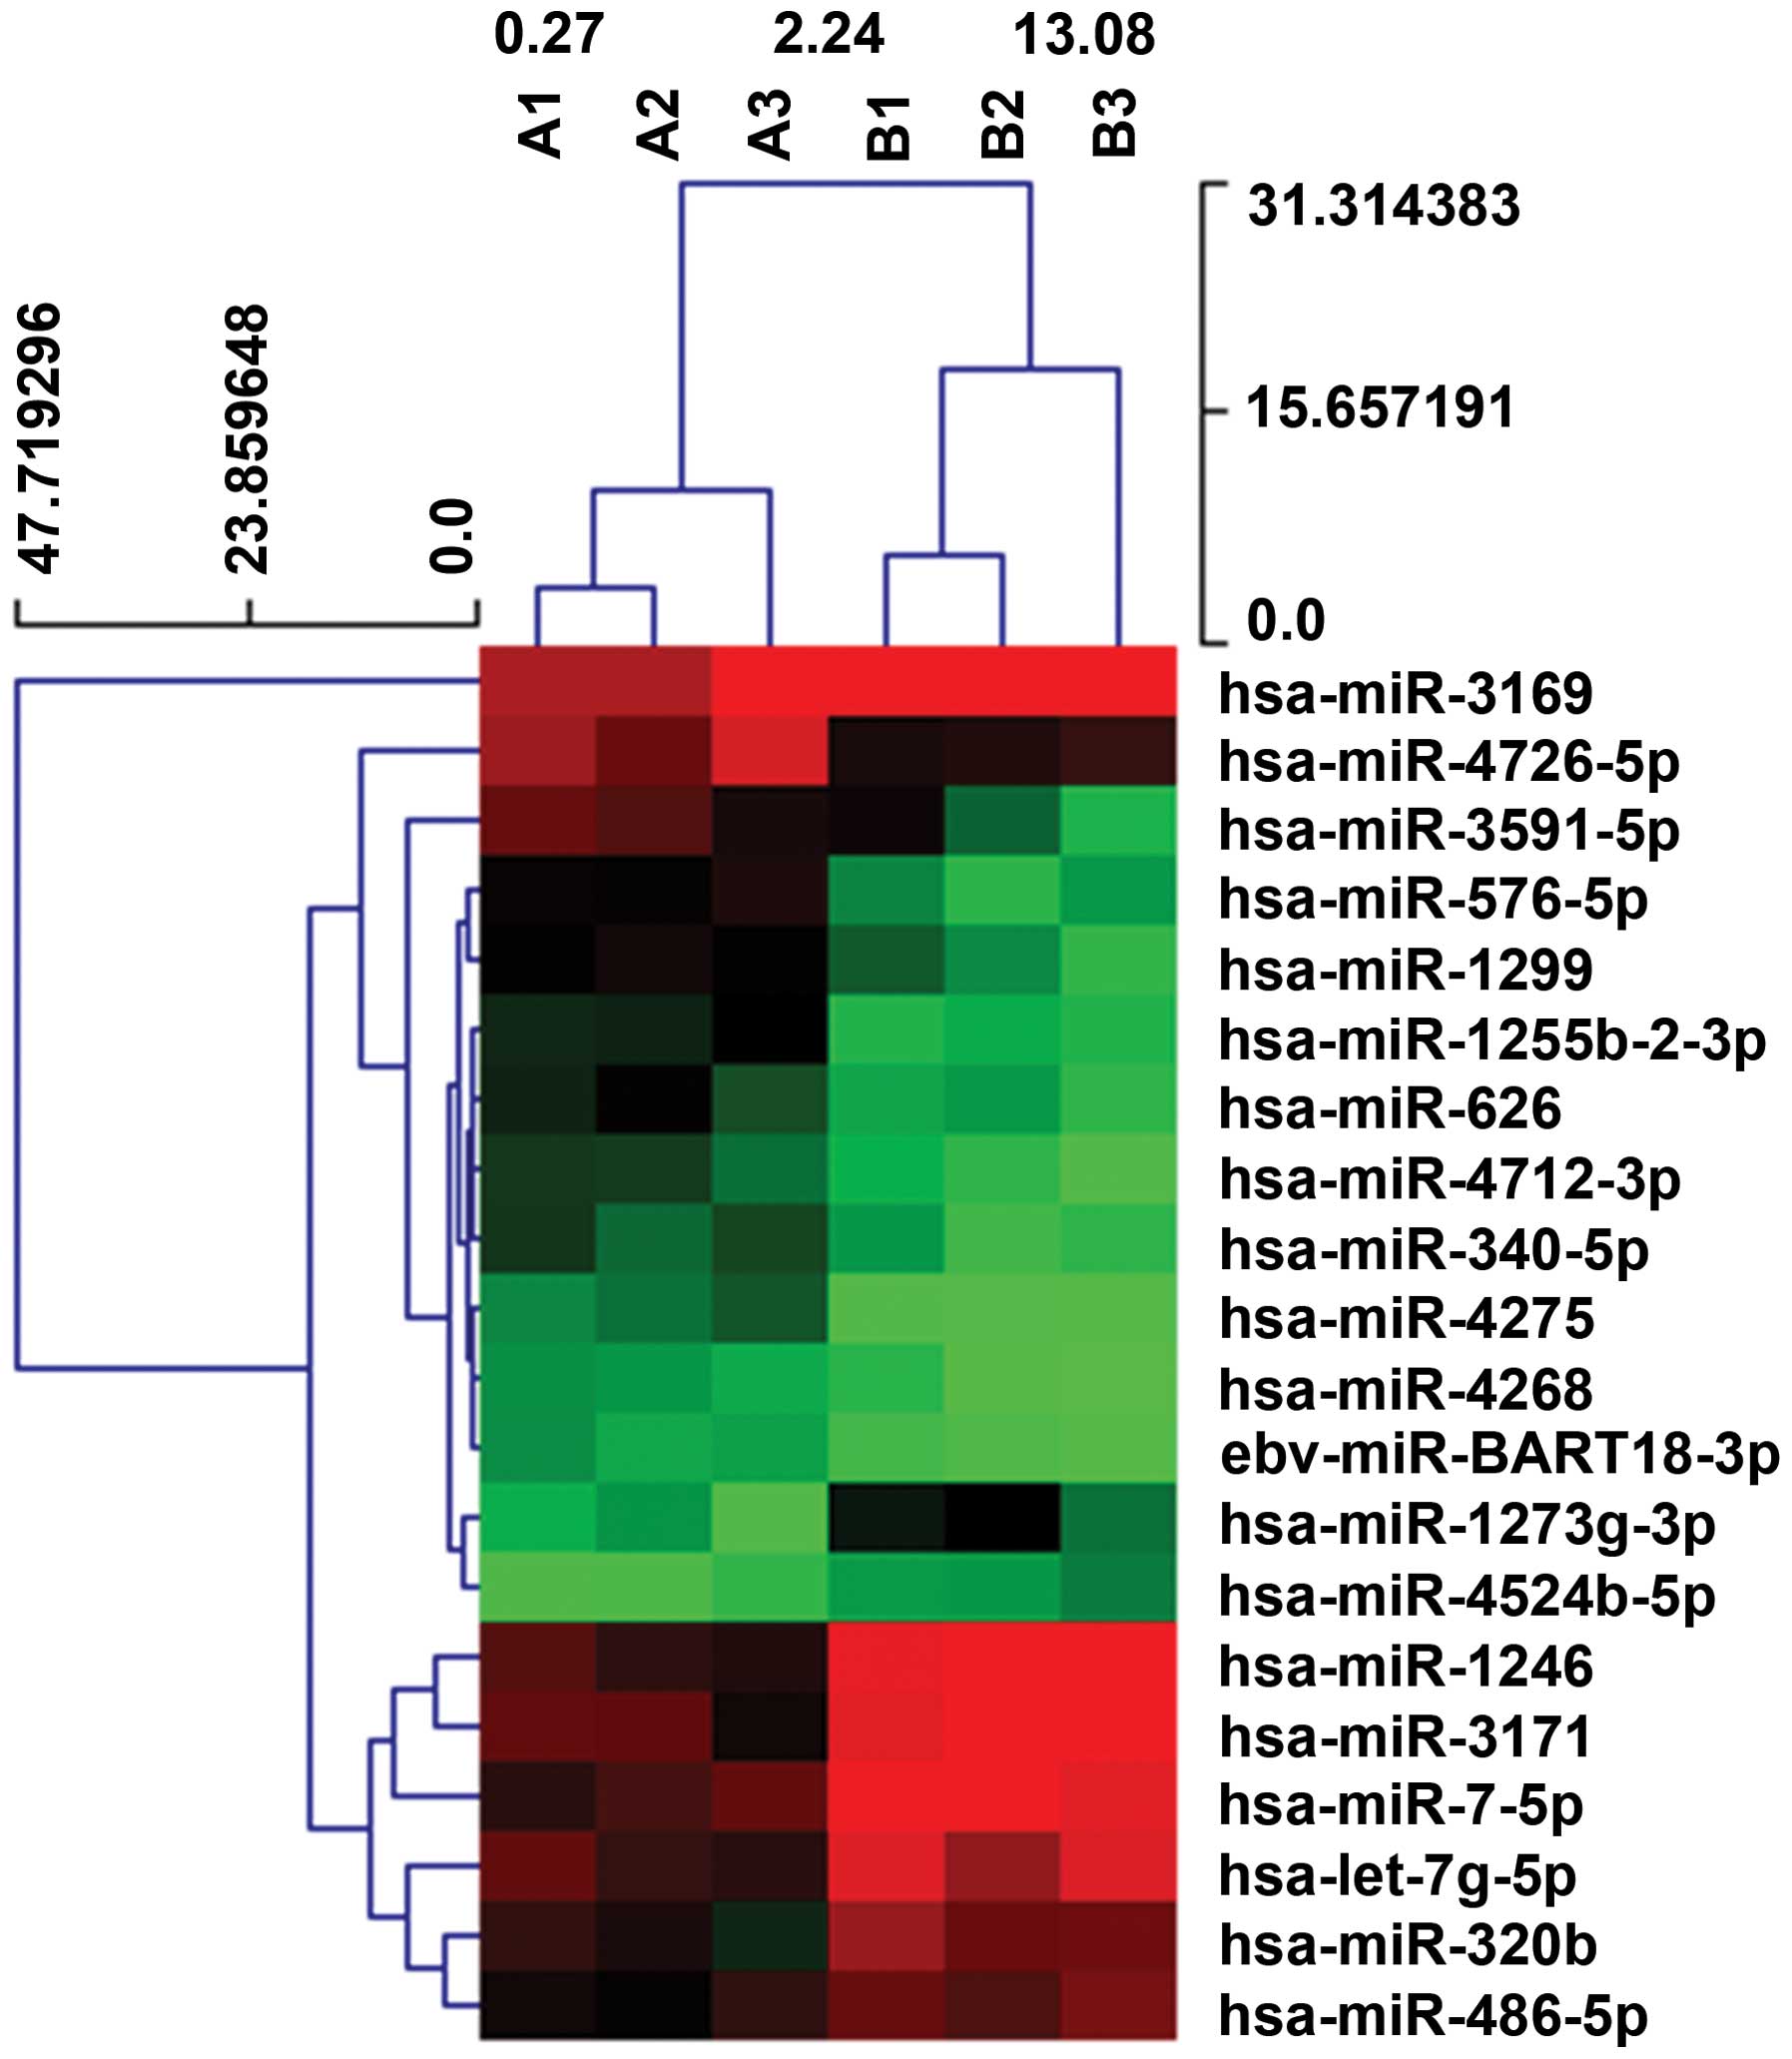
Prediction of targets of differentially
expressed miRNA and function annotation in peripheral blood of GBM
patients
To understand the potential functions of
significantly differentially expressed miRNA in the GBM, and to
further explore the function of these predicted target genes, we
selected the most upregulated coherent 12 miRNAs (hsa-miR-4726-5p,
hsa-miR-1255b-2-3p, hsa-miR-340-5p, hsa-miR-4275, hsa-miR-4712-3p,
hsa-miR-576-5p, hsa-miR-1299, hsa-miR-4268, hsa-miR-3591-5p,
hsa-miR-626, hsa-miR-BART18-3p, hsa-miR-3169), and the most
downregulated coherent 8 miRNAs (hsa-miR-320b, hsa-let-7g-5p,
hsa-miR-486-5p, hsa-miR-7-5p, hsa-miR-4524b-5p, hsa-miR-3171,
hsa-miR-1246, hsa-miR-1273g-3p) to perform Gene Ontology analysis
and pathway analysis.
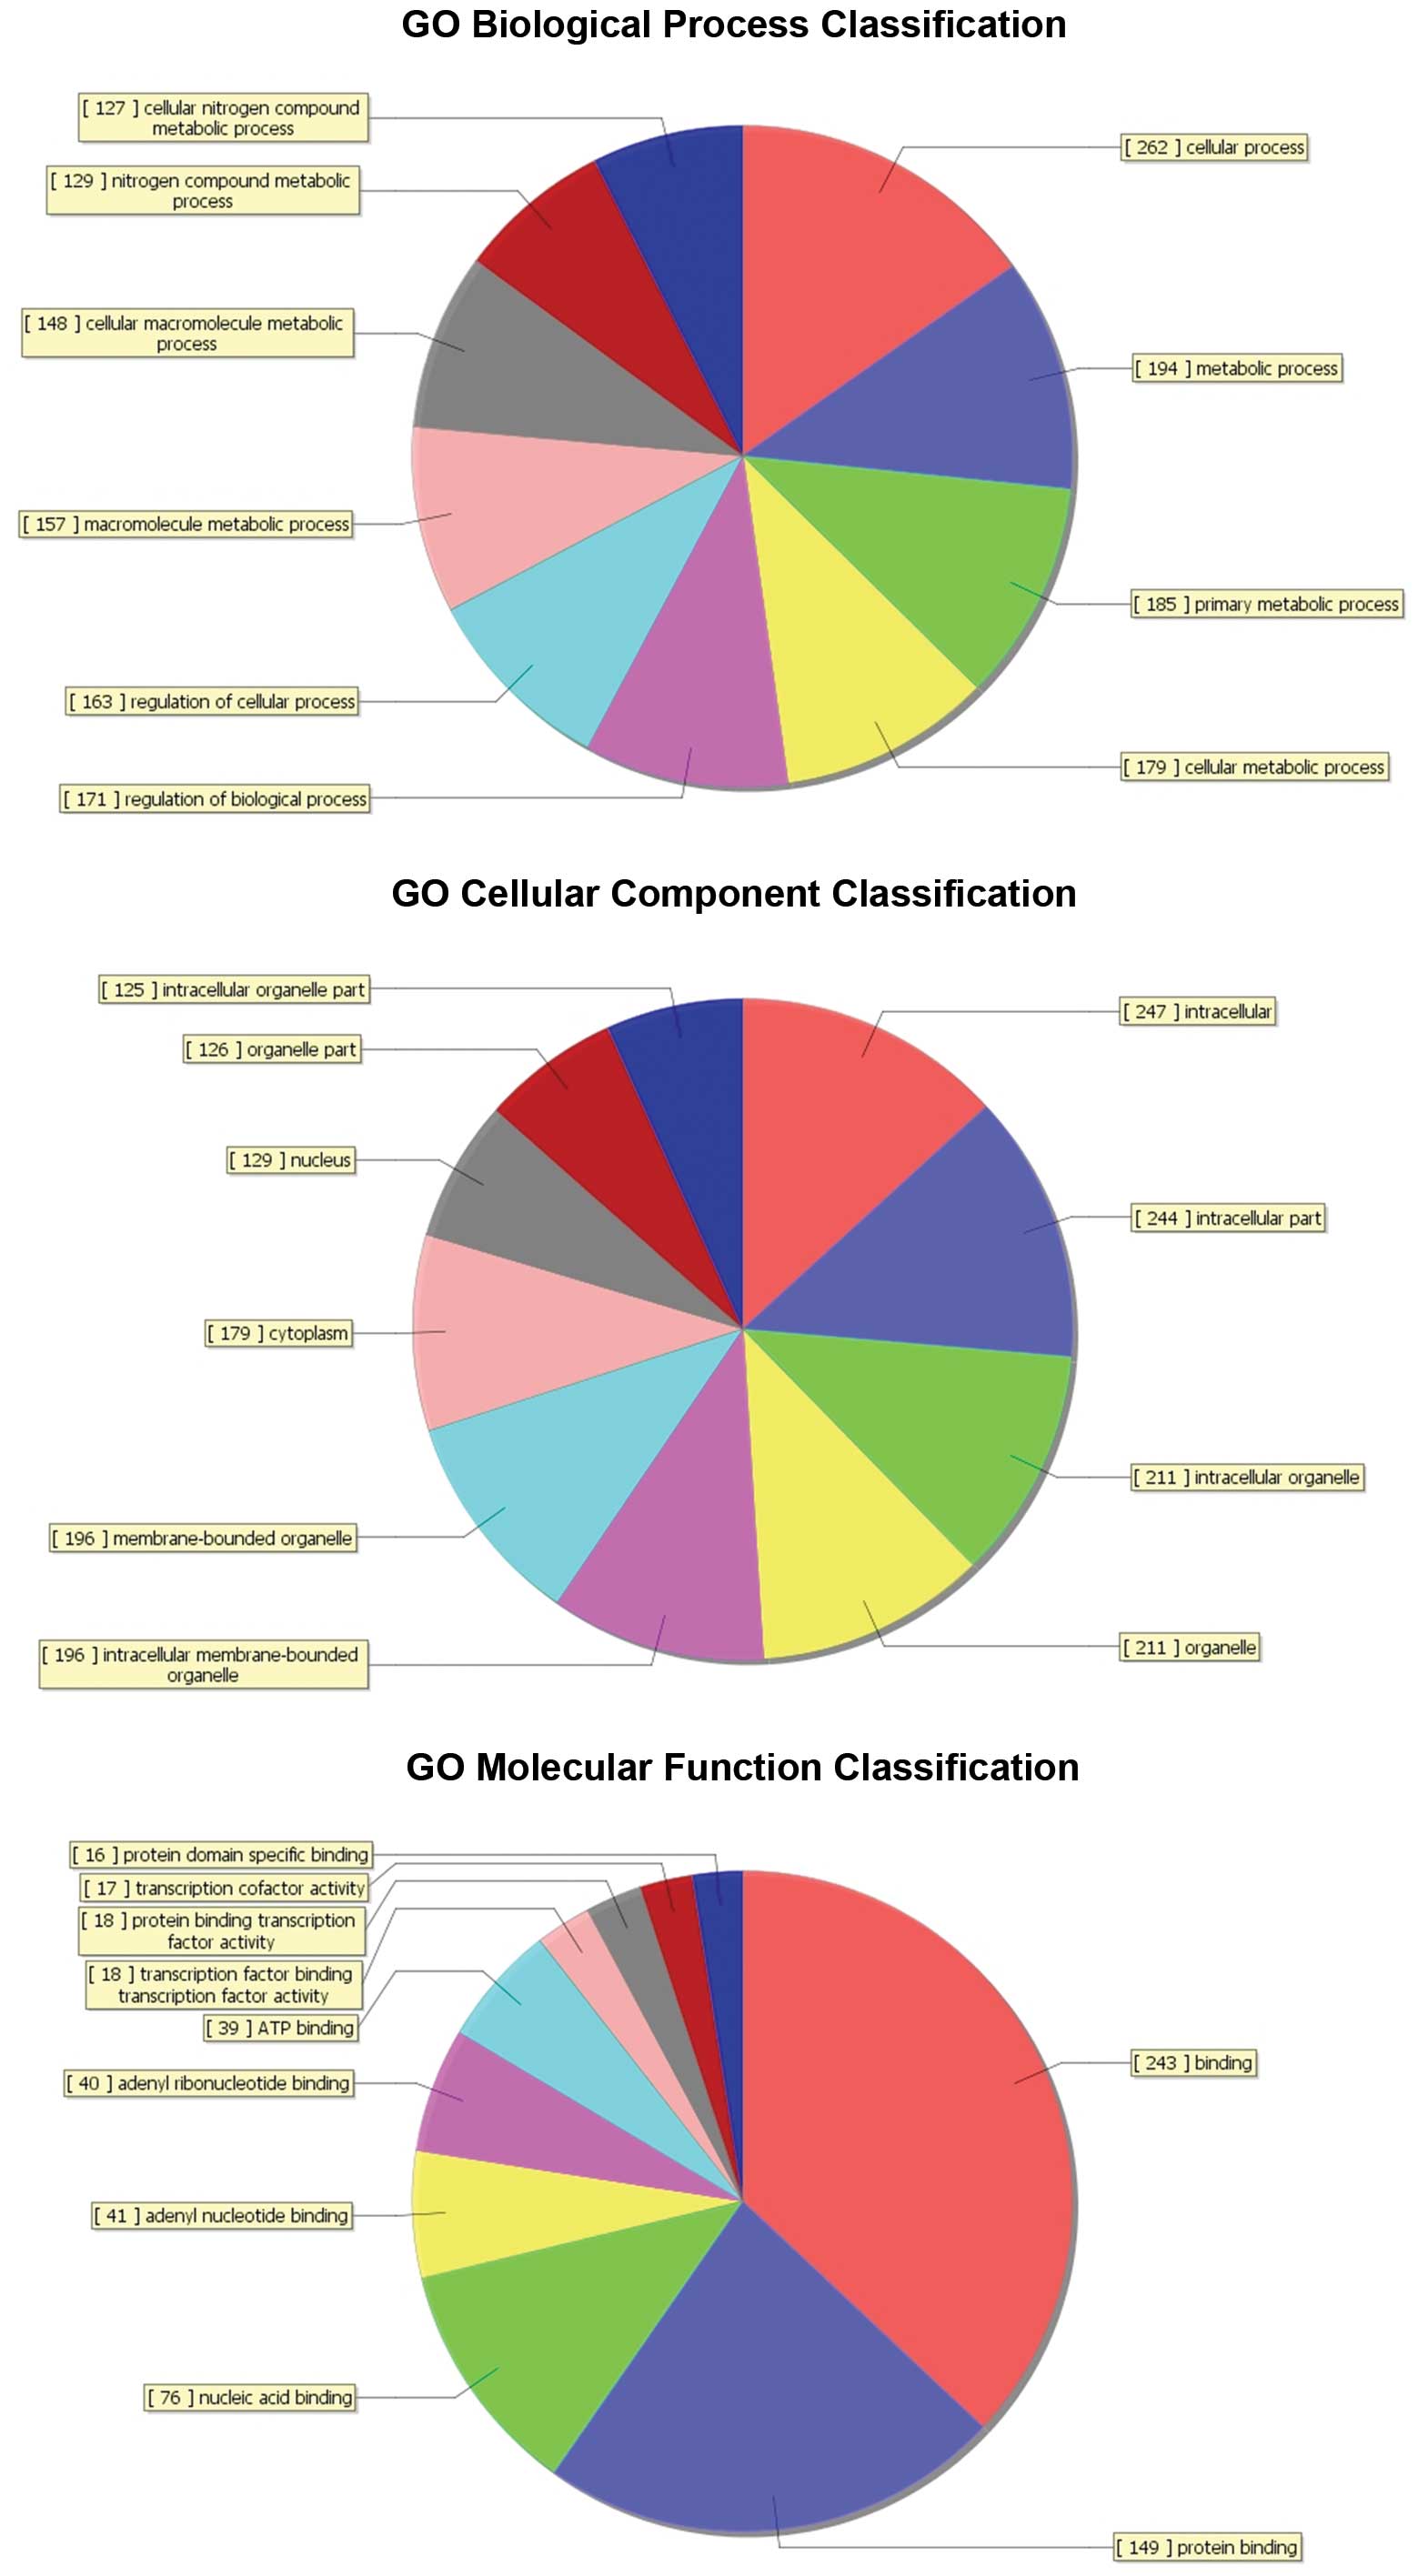
To understand the potential functions of
significantly differentially expressed miRNA in glioma patients,
various biological process terms of genes were predicted as the
potential targets of these 20 miRNAs in the peripheral blood of
glioma patients by using bioinformatics method (Fig. 2). To further explore the function
of these predicted target genes. The predicted target genes in Gene
Ontology (GO) which covers three domains of the 20 miRNAs:
biological process, cellular component and molecular function
(Fig. 3) biological process terms
were enriched with cellular catabolic process and cellular process.
In cellular component category, GO terms related to the cytoplasmic
part, membrane-bounded organelle, intracellular membrane-bound
organelle, organelle, intracellular organelle, cytoplasm and
intracellular organelle part. The molecular function category of GO
terms showed the major functions. Binding, myosin binding, protein
transporter activity, serotonin receptor activity, histone
methyltransferase activity, transcription factor binding,
transcription factor activity, retinoic acid receptor binding,
protein binding transcription factor activity, protein binding,
transcription cofactor activity, protein kinase activator activity,
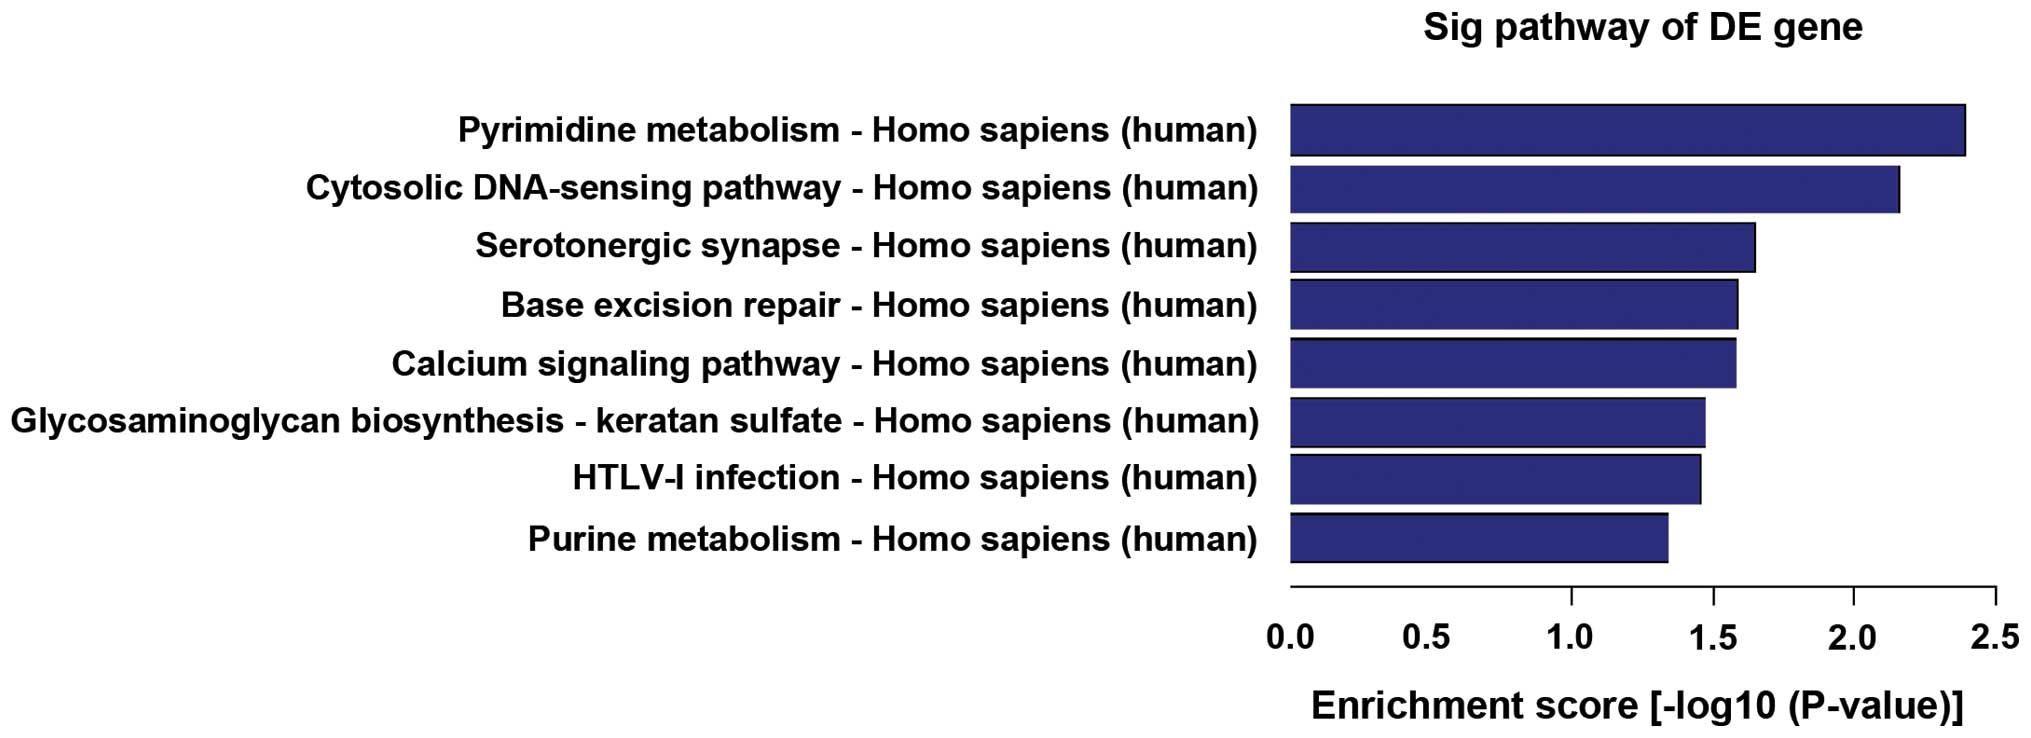
acetylglucosaminyltransferase activity. To detect these 20 miRNA
pathways, whose members are significantly enriched for targets of
the 20 miRNAs being deregulated, we utilized the ‘miRNA to pathway
dictionary’ (20). All the
significant target pathways are listed for the miRNA in Fig. 4 and related to pyrimidine
metabolism, cytosolic DNA-sensing pathway, serotonergic synapse,
base excision repair, calcium signaling pathway, glycosaminoglycan
biosynthesis, keratan sulfate, HTLV-I infection and purine
metabolism. These have been computed by separately applying
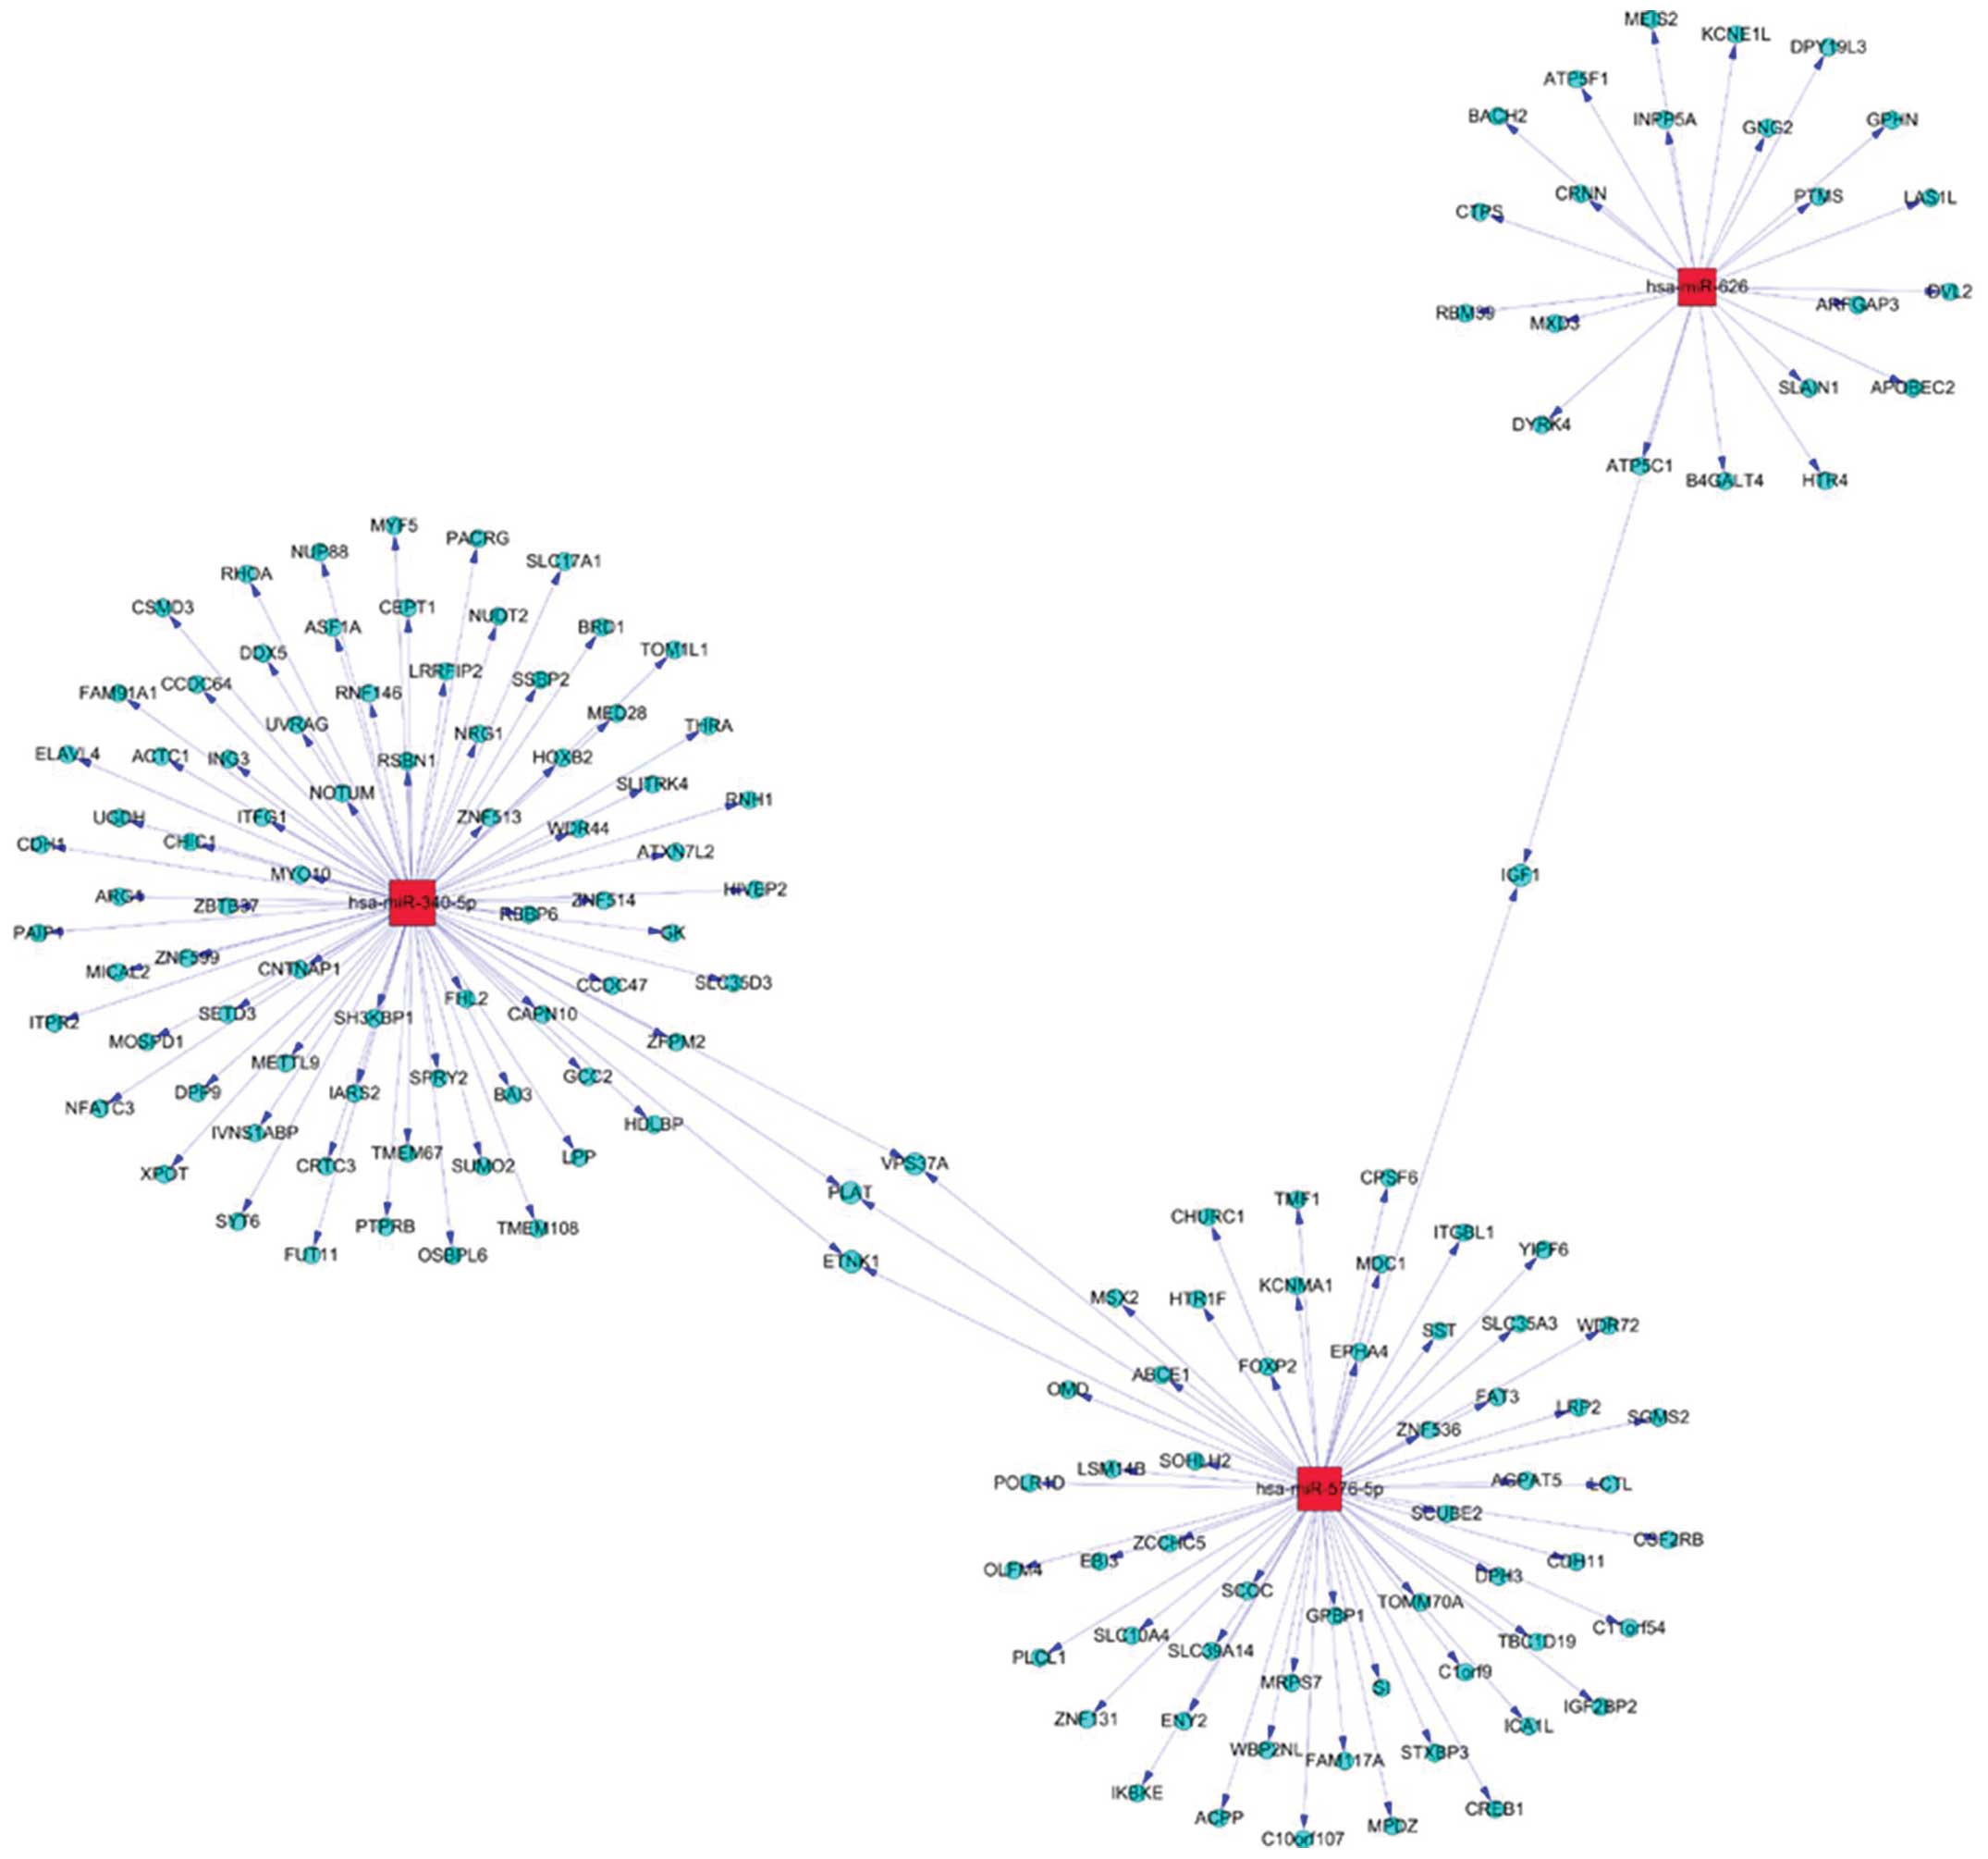
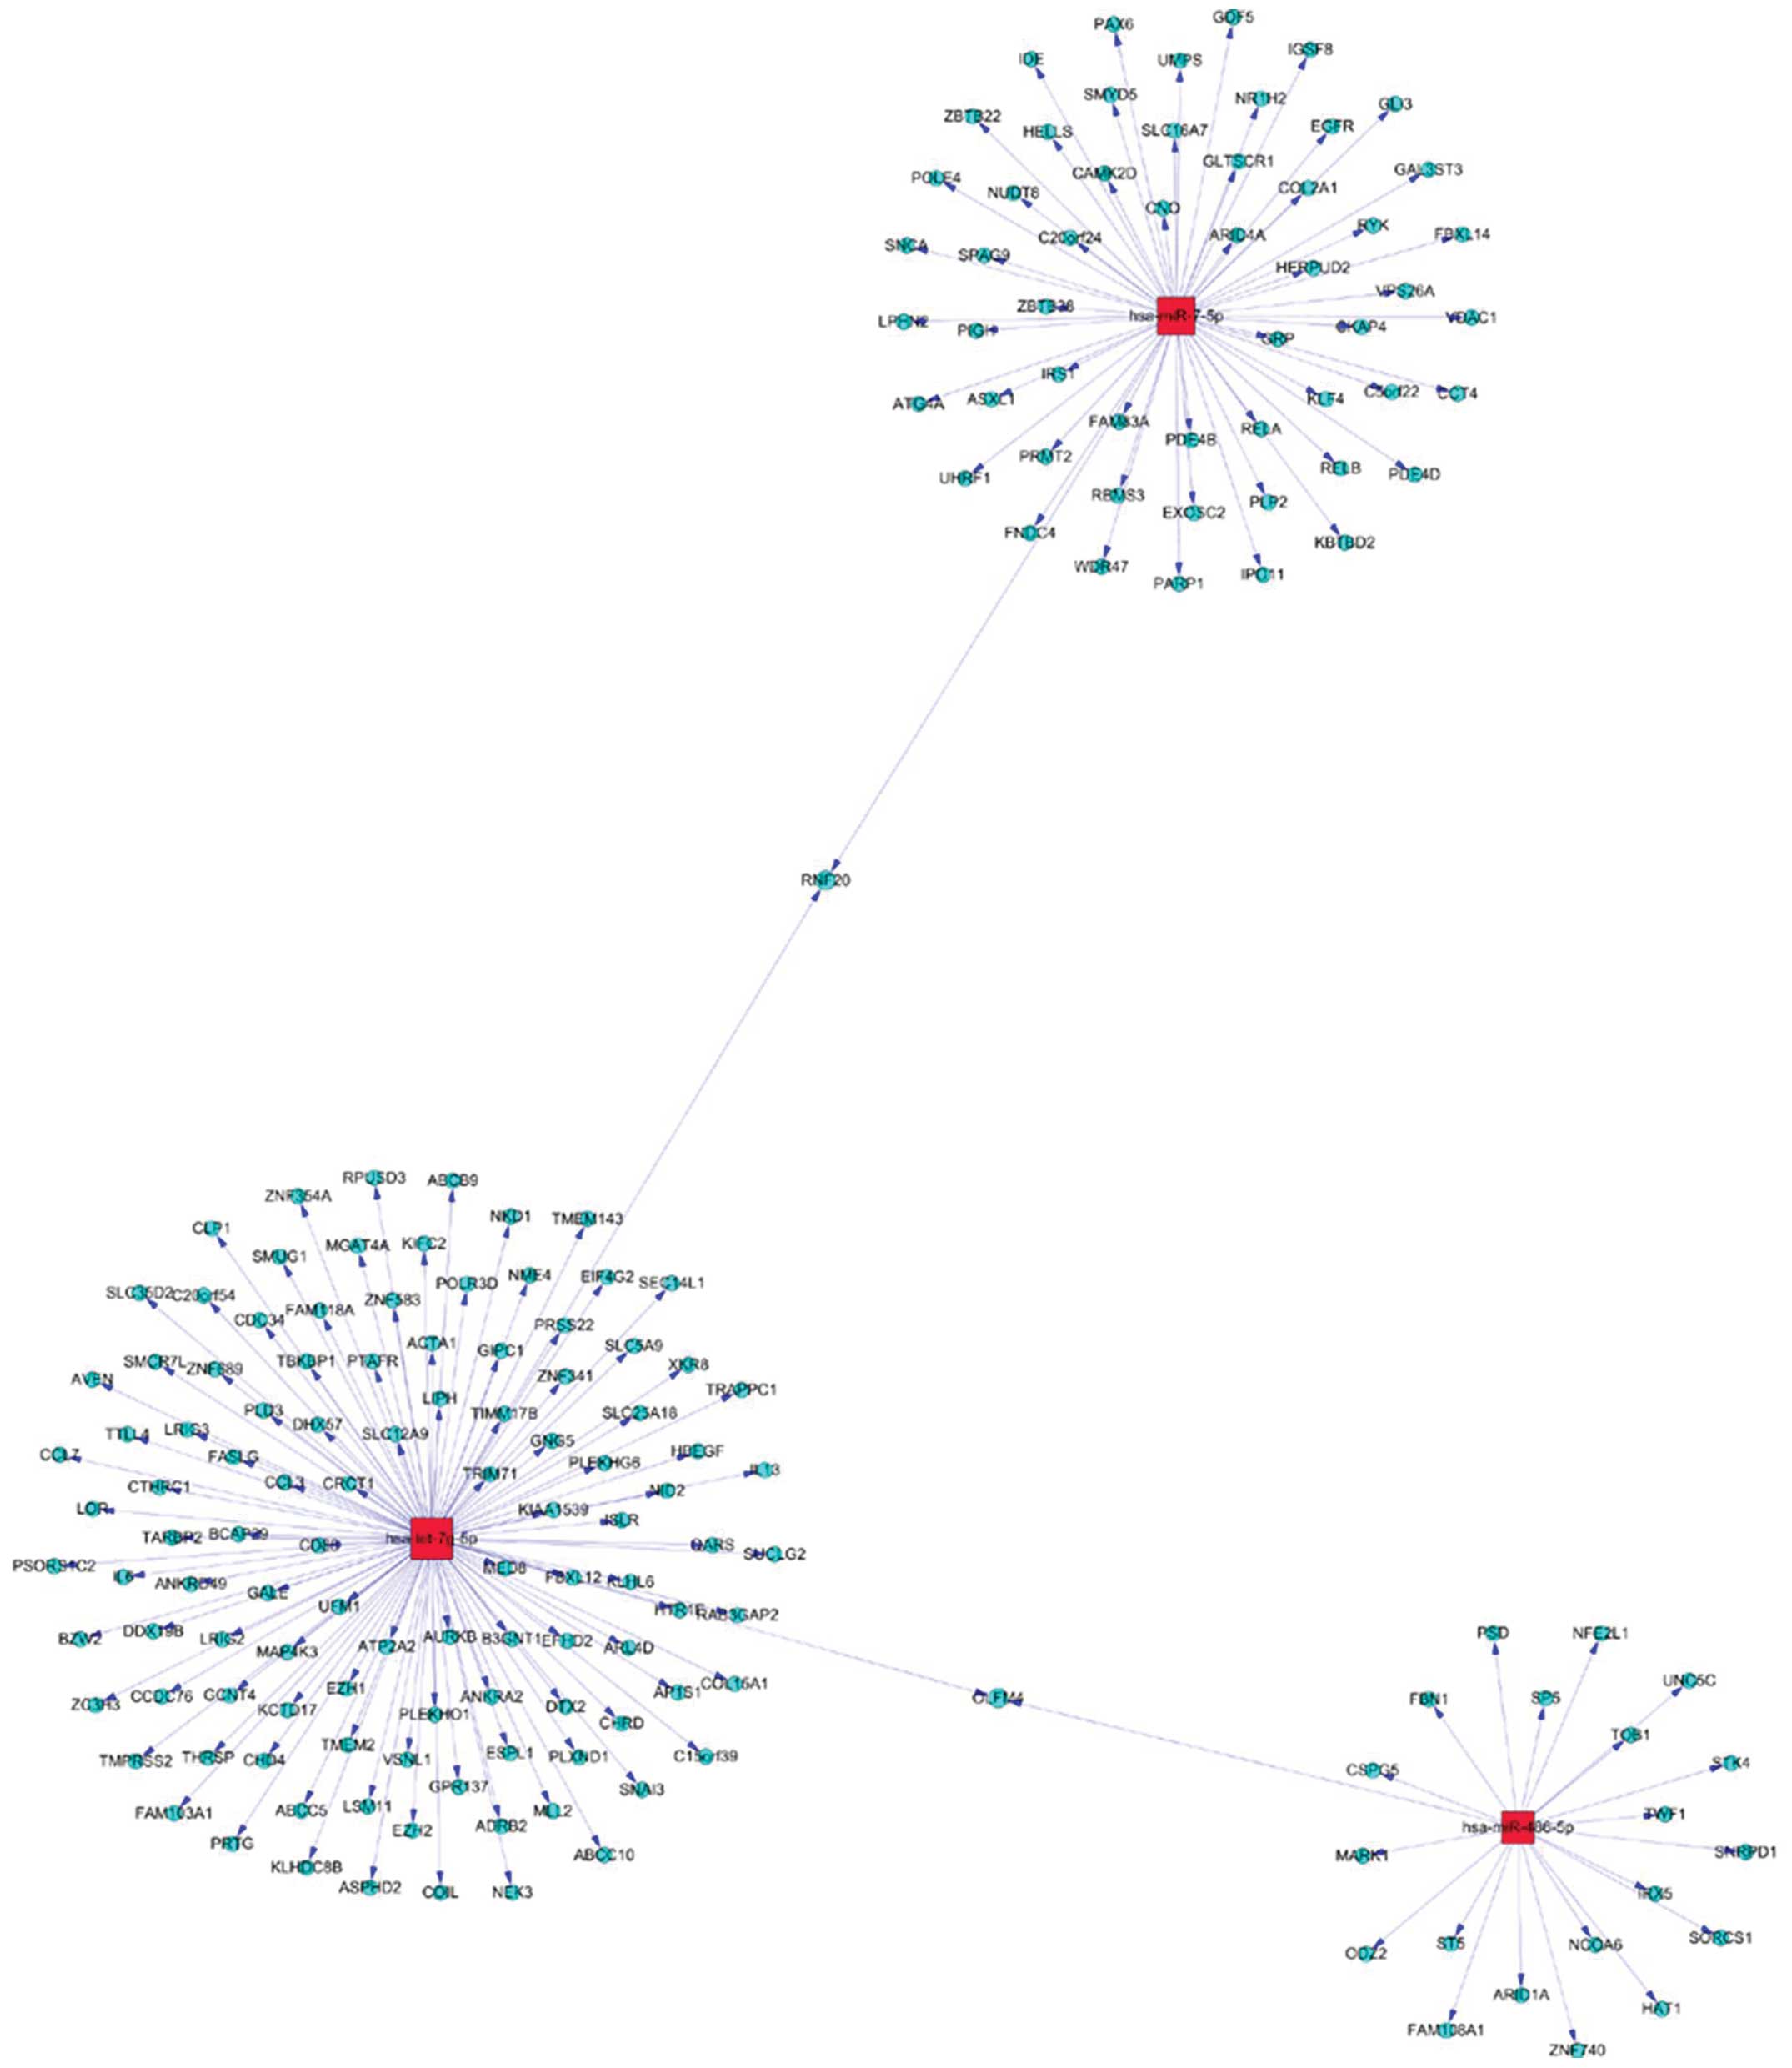
standard over-representation analysis for each set of miRNA
targets, a gene network analysis was applied to the upregulation of
miR-576-5p, miR-340, miR-626 (Fig.
5), and downregulation miR-320, let-7g-5p and miR-7-5P
(Fig. 6).
Discussion
Gliomas are the most commonly diagnosed cancers in
the brain. Following therapy, progression or recurrence is often
observed. In addition to imaging studies, that are normally only
available every 2–3 months, biomarkers might be helpful monitoring
tools to detect tumor recurrence at the earliest time point or to
distinguish between pseudoprogression and substantial tumor
growth.
It has been found that a large part of the human
genome is transcribed into non-coding RNAs with major functions
both in normal physiology and in pathological processes (21,22).
Recent studies have shown the contribution of miRNAs to cancer
pathogenesis (23). miRNAs have
the advantage of being clearly defined markers that can easily be
determined by microarrays or real-time PCR. The function of miRNAs
appears to be in gene regulation where they act as
post-transcriptional regulators and control the target messenger
RNAs (mRNAs). Perfect or near perfect base pairing with the target
RNA promotes cleavage and destruction of the mRNA, whereas miRNAs
that are only partially complementary to the target may inhibit
protein translation of mRNA and also cause the mRNAs to be degraded
sooner (24). The mRNA is thus
‘silenced’ and the protein coded for not produced. miRNAs therefore
generally have an ‘inhibitory’ function (25). In this way, miRNAs appear to have
various functions in physiology, from cell differentiation,
proliferation and apoptosis to the regulation of the endocrine
system and metabolism (12,26).
Although the miRNA analysis can be performed by broadly available
technologies that are already in clinical use, but these
associations are based on studies in tissue samples. However, such
tissue samples are not easily obtained, and a more effective step
forward was found when miRNAs were detected to be remarkably stable
in serum or plasma (27,28). miRNAs have the advantage of being
clearly defined markers that can easily be determined by
microarrays or real-time PCR in peripheral blood. The ease of the
methods further opens the road for the analysis of specific miRNA
patterns that comprise numerous miRNAs.
In this study, initial analysis of the miRNAs
profiling showed that some miRNAs were differentially expressed in
GBM patients and these miRNAs can be distinguished from normal
individuals. We identified 139 miRNAs that were significantly
expressed, 115 miRNAs were found to be upregulated whereas 24 were
downregulated. Our results were partly in disagreement with Roth
et al (20). When comparing
the filtered repertoire of the 310 miRNAs in glioblastoma patients
and healthy controls, they observed a significant deregulation of
52 miRNAs, amounting to 16.8% of analyzed miRNAs. Of these, 27
miRNAs were upregulated (52%) whereas 25 miRNAs were downregulated
(48%). The microarray analysis also showed that there was no
significantly distinct difference in the 613 common miRNA
expression profiles between these two conditions. This could be
explained by the fact that both conditions have undergone genetic
normalities. It is also probable that both conditions share similar
genetic pathways through the regulation of specific gene
expression. We identified that miR-576-5p, miR-340, miR-626 and
miR-320, let-7g-5p and miR-7-5P were significantly deregulated only
in the blood of GBM but not in the blood of normal inviduals,
suggesting a possible role in gliomas cell growth and
proliferation. For example, miR-342-3p, the second most deregulated
miRNA, has not been investigated in glioma tissues. The results of
Li et al indicated that an overexpression of miR-576-5
occurred in brain-metastatic carcinomas (29), whereas, miR-576-5p was
downregulated in osteoarthritis (OA) chondrocyte pellets with the
highest fold-change of 4.74-fold (30), but the miR-576-5p was overexpressed
in the the serum of glioma patient in this study. A number of
recent studies have demonstrated that miR-7 inhibits cell migration
and metastasis in glioblastoma (31,32).
Recent advances in miRNA delivery and targeting suggest that ‘miRNA
replacement therapy’ with miR-7-5p may be a feasible approach to
cancer treatment (33). Giles
et al demonstrated that miR-7-5p expression is reduced in
metastatic melanoma-derived cell lines compared with primary
melanoma cells, and that ectopically expressed miR-7-5p
significantly inhibits melanoma cell migration and invasion.
Additionally, it was reported that insulin receptor substrate-2
(IRS-2) is a target of miR-7-5p in melanoma cells. By using RNA
interference (RNAi) evidence was provided that IRS-2 activates
protein kinase B (Akt), and promotes melanoma cell migration. Thus,
miR-7-5p may represent a novel tumor suppressor miRNA in melanoma,
acting at least in part via its inhibition of IRS-2 expression and
oncogenic Akt signaling (34). In
the present report the miR-7-5p, significantly deregulated miRNA in
the peripheral blood of GBM patient, but has not yet been seriously
investigated in glioma tissues.
Subsequently, a futher step was added to our study,
GO analysis and pathway analysis. The GO analysis included
biological process, molecular function and cellular components.
Pathway analysis was used to generate networks and assess
statistically relevant biofunctions and canonical pathways that
predicted target genes involved. These genes were mapped to
corresponding genes in the Ingenuity knowledge database. The
biofunctional analysis identified the molecular and cellular
function, physiological system development and function. Canonical
pathway analysis identified the most significant pathways in the
dataset.
There were previous reports on expression in plasma
or serum miRNA profile of glioma (20,27).
We found 20 miRNAs either up- or down regulated which were
significant different. We would have preferred to do a complete
miRNA profiling by RT-qPCR in all the 139 subjects, but due to high
costs this was not possible. We only analyzed significantly
different 20 miRNAs in the main study. An additional factor was
that inclusion of more than 100 miRNAs would have made it very much
difficult to evaluate whether an observed change was truly
significant or simply due to chance because of a large number of
miRNA analyzed. Instead we selected the most promising 20 miRNAs
that had shown a significant expression change. Of these 20 miRNAs,
only miR-576-5p, miR-340, miR-626, miR-320, let-7g-5p and miR-7-5P
were included in this GO analysis and pathway analysis.
Furthermore, in a study on glioma where RNA had been extracted and
purified from whole blood, showed different expression. Normal
biological variation of miRNA levels in plasma together with
variation introduced during sample treatments (from blood sampling
to RT-qPCR) may affect the observed expression of miRNAs (35). Also in the initial report on miRNA
in serum, most of the miRNAs were detected in both serum and blood
cells. However, only a small number of miRNAs were uniquely present
in either serum or blood cells, indicating that most serum miRNAs
may be derived from circulating blood cells (28,36).
In addition, the miRCURY LNA RT-qPCR system used for detection of
known plasma miRNAs has been found to be more sensitive and
reproducible than the initial microarray systems and show even more
sensitivity and linearity than TaqMan methods at low concentration
of plasma miRNA (37,38).
Previous studies on identifying serum miRNA-based
biomarkers generally focused on individual miRNA. However, the
specificity of biomarkers based on a single miRNA is generally
questionable and poor (27,28).
In this study, it showed that the combination of six significantly
diverse serum miRNAs would be a more comprehensive indicator for
the diagnosis of GBM, however, it has not yet been precisely
investigated in the tissues or serum of glioma patient. There are
several limitations in our study. Firstly, the sample size is
small. Whether this six-member serum miRNA profile can be
established as a routine biomarker for pertussis diagnosis will
require more investigation. Secondly, the testing of a large number
of clinical samples will be required to compare and confirm the
results of this study. Finally, we only evaluated partially the
dysregulated miRNAs, thus some miRNAs other than those reported
herein might also be identified as serum biomarkers for GBM
diagnosis in future studies.
The secretory mechanism and biological function, as
well as the meaning of the existence of extracellular miRNAs,
remain largely unclear. Because of the lack of any biomarker in
peripheral blood that is in clinical use for glioblastoma, the
findings of our study may provide the scientific basis for further
studies using miRNAs for the follow-up of patients diagnosed with
glioblastoma. Considering the biological relevance of miRNAs to GBM
and recent studies of circulating miRNAs in serum by others, we
hypothesize that the serum miRNAs may serve as novel biomarkers for
the diagnosis and evaluation of GBM.
Collectively, we have demonstrated that a unique
six-member serum miRNA expression profile could serve as a
non-invasive biomarker for GBM diagnosis.
Acknowledgements
The authors thank Shizhu Yu, Department of
Neuropathology, Neurology Institute, Tianjin Medical University
General Hospital, Tianjin Neurological Institute, China, for his
technical assistance.
References
|
1
|
Tzadok S, Beery E, Israeli M, et al: In
vitro novel combinations of psychotropics and anti-cancer
modalities in U87 human glioblastoma cells. Int J Oncol.
37:1043–1051. 2010.
|
|
2
|
Han L, Zhang K, Shi Z, et al: LncRNA
profile of glioblastoma reveals the potential role of lncRNAs in
contributing to glioblastoma pathogenesis. Int J Oncol.
40:2004–2012. 2012.PubMed/NCBI
|
|
3
|
Wang Y, Chen L, Bao Z, et al: Inhibition
of STAT3 reverses alkylator resistance through modulation of the
AKT and β-catenin signaling pathways. Oncol Rep. 5:1173–1180.
2011.PubMed/NCBI
|
|
4
|
Wang LF, Fokas E, Bieker M, et al: An HX
Increased expression of EphA2 correlates with adverse outcome in
primary and recurrent glioblastoma multiforme patients. Oncol Rep.
19:151–156. 2008.
|
|
5
|
Bartel DP: MicroRNAs: genomics,
biogenesis, mechanism, and function. Cell. 23:281–297. 2004.
View Article : Google Scholar : PubMed/NCBI
|
|
6
|
Ambros V: The functions of animal
microRNAs. Nature. 16:350–355. 2004. View Article : Google Scholar
|
|
7
|
Grimson A, Farh KK, Johnston WK, et al:
MicroRNA targeting specificity in mammals: determinants beyond seed
pairing. Mol Cell. 27:91–105. 2007. View Article : Google Scholar : PubMed/NCBI
|
|
8
|
He L and Hannon GJ: MicroRNAs: small RNAs
with a big role in gene regulation. Nat Rev Genet. 5:522–231. 2004.
View Article : Google Scholar : PubMed/NCBI
|
|
9
|
Kim VN: MicroRNA biogenesis: coordinated
cropping and dicing. Nat Rev Mol Cell Biol. 6:376–385. 2005.
View Article : Google Scholar : PubMed/NCBI
|
|
10
|
Zhao C, Tian F, Yu Y, et al:
miRNA-dysregulation associated with tenderness variation induced by
acute stress in Angus cattle. J Anim Sci Biotechnol. 3:12–17. 2012.
View Article : Google Scholar : PubMed/NCBI
|
|
11
|
Cuellar TL and McManus MT: MicroRNAs and
endocrine biology. J Endocrinol. 187:327–332. 2005. View Article : Google Scholar : PubMed/NCBI
|
|
12
|
Poy MN, Eliasson L, Krutzfeldt J, et al: A
pancreatic islet-specific microRNA regulates insulin secretion.
Nature. 432:226–230. 2004. View Article : Google Scholar : PubMed/NCBI
|
|
13
|
Cheng H, Zhang L, Cogdell DE, et al:
Circulating plasma MiR-141 is a novel biomarker for metastatic
colon cancer and predicts poor prognosis. PLoS One. 6:e177452011.
View Article : Google Scholar : PubMed/NCBI
|
|
14
|
Ng EK, Chong WW, Jin H, et al:
Differential expression of microRNAs in plasma of patients with
colorectal cancer: a potential marker for colorectal cancer
screening. Gut. 58:1375–1381. 2009. View Article : Google Scholar : PubMed/NCBI
|
|
15
|
Rabinowits G, Gercel-Taylor C, Day JM, et
al: Exosomal microRNA: a diagnostic marker for lung cancer. Clin
Lung Cancer. 1:42–46. 2009. View Article : Google Scholar : PubMed/NCBI
|
|
16
|
Resnick KE, Alder H, Hagan JP, et al: The
detection of differentially expressed microRNAs from the serum of
ovarian cancer patients using a novel real-time PCR platform.
Gynecol Oncol. 112:55–59. 2009. View Article : Google Scholar : PubMed/NCBI
|
|
17
|
Taylor DD and Gercel-Taylor C: MicroRNA
signatures of tumor-derived exosomes as diagnostic biomarkers of
ovarian cancer. Gynecol Oncol. 110:13–21. 2008. View Article : Google Scholar : PubMed/NCBI
|
|
18
|
Yaman Agaoglu F, Kovancilar M, Dizdar Y,
et al: Investigation of miR-21, miR-141, and miR-221 in blood
circulation of patients with prostate cancer. Tumour Biol.
32:583–588. 2011.PubMed/NCBI
|
|
19
|
Li W1, Yuan Y, Huang L, et al: Metformin
alters the expression profiles of microRNAs in human pancreatic
cancer cells. Diabetes Res Clin Pract. 96:187–195. 2012. View Article : Google Scholar : PubMed/NCBI
|
|
20
|
Roth P, Wischhusen J, Happold C, et al: A
specific miRNA signature in the peripheral blood of glioblastoma
patients. J Neurochem. 118:449–457. 2011. View Article : Google Scholar : PubMed/NCBI
|
|
21
|
Kapranov P, Cheng J, Dike S, et al: RNA
map reveals new RNA classes and a possible function for persvasive
transcription. Science. 316:1484–1488. 2007. View Article : Google Scholar : PubMed/NCBI
|
|
22
|
Taft RJ, Pang KC, Mercer TR, et al:
Non-coding RNAs: regulators of disease. Pathology. 220:126–139.
2010. View Article : Google Scholar : PubMed/NCBI
|
|
23
|
Zhang W, Edwards A, Fan W, et al:
miRNA-mRNA correlation-network modules in human prostate cancer and
the differences between primary and metastatic tumor subtypes. PLoS
One. 7:e401302012. View Article : Google Scholar
|
|
24
|
Williams AE: Functional aspects of animal
microRNAs. Cell Mol Life Sci. 65:545–562. 2008. View Article : Google Scholar : PubMed/NCBI
|
|
25
|
Place RF, Li LC, Pookot D, et al:
MicroRNA-373 induces expression of genes with complementary
promoter sequences. Proc Natl Acad Sci USA. 105:1608–1613. 2008.
View Article : Google Scholar
|
|
26
|
Brennecke J, Hipfner DR, Stark A, et al:
Bantam encodes a developmentally regulated microRNA that controls
cell proliferation and regulates the proapoptotic gene hid in
Drosophila. Cell. 113:25–36. 2003. View Article : Google Scholar : PubMed/NCBI
|
|
27
|
Chen X, Ba Y, Ma L, et al:
Characterization of microRNAs in serum: a novel class of biomarkers
for diagnosis of cancer and other diseases. Cell Res. 18:997–1006.
2008. View Article : Google Scholar : PubMed/NCBI
|
|
28
|
Kosaka N, Iguchi H and Ochiya T:
Circulating microRNA in body fluid: a new potential biomarker for
cancer diagnosis and prognosis. Cancer Sci. 101:2087–2092. 2010.
View Article : Google Scholar : PubMed/NCBI
|
|
29
|
Li Z, Gu X, Fang Y, et al: microRNA
expression profiles in human colorectal cancers with brain
metastases. Oncol Lett. 3:346–350. 2012.PubMed/NCBI
|
|
30
|
Díaz-Prado S, Cicione C, Muiños-López E,
et al: Characterization of microRNA expression profiles in normal
and osteoarthritic human chondrocytes. BMC Musculoskelet Disord.
13:1442012.PubMed/NCBI
|
|
31
|
Giles KM, Brown RA, Epis MR, et al:
miRNA-7-5p inhibits melanoma cell migration and invasion. Biochem
Biophys Res Commun. 430:706–710. 2013. View Article : Google Scholar : PubMed/NCBI
|
|
32
|
Dong L, Han C, Zhang H, et al:
Construction of a recombinant lentivirus containing human
microRNA-7-3 and its inhibitory effects on glioma proliferation.
Neural Regener Res. 7:2144–2150. 2012.PubMed/NCBI
|
|
33
|
Bader AG, Brown D and Winkler M: The
promise of microRNA replacement therapy. Cancer Res. 70:7027–7030.
2010. View Article : Google Scholar : PubMed/NCBI
|
|
34
|
Giles KM, Brown RA, Epis MR, et al:
miRNA-7-5p inhibits melanoma cell migration and invasion. Biochem
Biophys Res Commun. 430:706–710. 2013. View Article : Google Scholar : PubMed/NCBI
|
|
35
|
McDonald JS, Milosevic D, Reddi HV, et al:
Analysis of circulating microRNA: preanalytical and analytical
challenges. Clin Chem. 57:833–840. 2011. View Article : Google Scholar : PubMed/NCBI
|
|
36
|
Jorde R, Svartberg J, Joakimsen RM and
Coucheron DH: Plasma profile of microRNA after supplementation with
high doses of vitamin D3 for 12 months. BMC Res Notes. 5:2452012.
View Article : Google Scholar : PubMed/NCBI
|
|
37
|
Chen Y, Gelfond JA, McManus LM and
Shireman PK: Reproducibility of quantitative RT-PCR array in miRNA
expression profiling and comparison with microarray analysis. BMC
Genomics. 10:4072009. View Article : Google Scholar : PubMed/NCBI
|
|
38
|
Jensen SG, Lamy P, Rasmussen MH, et al:
Evaluation of two commercial global miRNA expression profiling
platforms for detection of less abundant miRNAs. BMC Genomics.
12:4352011. View Article : Google Scholar : PubMed/NCBI
|