Introduction
Randomized clinical trials and observational studies
have shown NSAIDs to reduce the risk for colorectal cancer and
colon adenoma, and also to improve survival in CRC patients, when
starting at the time of diagnosis with intake of aspirin/NSAIDs
(1–3). Aspirin, provided to stage I-III CRC
patients, with or without additional adjuvant chemotherapy, seemed
to be associated with improved outcome (4). This is consistent with our own
research, indicating reduced tumor progression and improved quality
of life following indomethacin treatment (5). Patients with tumors overexpressing
COX-2, were reported to have the greatest improvement of survival
in one study, while the beneficial effects of aspirin could not be
attributed to high expression of COX-2 in another study, where HLA
class I antigen appeared a covariate (4,6).
We have also reported that standard oral
administration of NSAIDs for three days preoperatively to CRC
patients, changed tumor mRNA and protein expression in a
biologically favourable direction, when analyzed on whole human
oligo microarrays and confirmed by Q-PCR and immunohistochemistry
(IHC). Array results, selected for significant up- and
downregulation, as viewed in a chromosomal map, exhibited a
prominent transcriptional activation at position 6p21, confining
the MHC locus. Oral NSAID provision upregulated several genes in
this locus followed by increased tumor infiltration of seemingly
activated immune cells (7). In
further studies based on the same CRC patients, we found mRNA and
the AC133 protein epitope expression of Prominin-1/CD133, a marker
associated with stemness and poor prognosis in several solid
tumors, to be downregulated, including some additional stem
cell-related genes, which belonged to the families of WNTs and bone
morphogenetic proteins (BMPs) (8–10).
In the present study we have continued analyses on
the same patient groups as described earlier, on preoperative NSAID
treatment (7,8). We aimed to evaluate mRNA expression
of two master regulators of stem cells, the transcription factors
OCT4 (POU5F1) and SOX2, as well as BMP7, another gene belonging to
the stem cell niche, in an effort to explain decreased levels of
PROM1/AC133 during NSAID treatment (11,12).
We also aimed to evaluate if NSAIDs would have influence on
microRNAs, reported to act as tumor suppressors or oncomiRs in
solid tumors (13,14).
Materials and methods
Patients
Patients aimed at primary and curative resection of
colorectal cancer were randomized to receive NSAID or
sham-treatment during three days before surgery, between 1998 and
2004 at Sahlgrenska University Hospital, Gothenburg, Sweden, as
reported earlier (7,8). After closure of the study 2004, with
the group comprising 14 NSAID-treated patients and 14 sham-treated
controls, four patients were further randomized to receive
indomethacin or sham-treatment. Two of these patients were included
in the present study, while two patients were omitted due to low
quality of tumor RNA. The original patient group, now extended by
two patients, consisted of 18 females and 12 males with a median
age of 73±11 (SD) years (range, 42–85 years). Tumors were
histologically classified by certified pathologist as Dukes A
(n=5), Dukes B (n=12), Dukes C (n=10) and Dukes D (n=2)
corresponding to stage I–IV. One patient had villous adenoma but
remained in the study. Tumor stages within groups were: in controls
(n=15), Dukes A (n=2), B (n=8), C (n=4), D (n=1) and in
NSAID-treated patients (n=15), Dukes A (n=3), B (n=4), C (n=6), D
(n=1), villous adenoma (n=1); NSAID treatment was indomethacin
(Confortid, 50 mg × 2; Alpharma, n=11) or celebrex (100 mg × 2;
Pfizer, n=4) during three preoperative days together with gastric
prophylaxis (Nexium 40 mg × 1; AstraZeneca, n=15), which was also
provided as sham treatment to all control patients. None of the
patients received radiochemotherapy pre- or postoperatively
according to our local guidelines or patient preferences (Table I).
 | Table IPatient characteristics before
operation in patients randomized to NSAID or sham treatment. |
Table I
Patient characteristics before
operation in patients randomized to NSAID or sham treatment.
| Patients |
|---|
|
|
|---|
| NSAID-treated | Controls |
|---|
| Male/female | 8/7 | 4/11 |
| Age | 70±3 | 75±2 |
| Dukesa |
| A | 3 | 2 |
| B | 4 | 8 |
| C | 6 | 4 |
| D | 1 | 1 |
| Villous
adenoma | 1 | - |
| Weight | 74±3 (n=13) | 75±4 (n=11) |
| Hb | 121±5 (n=12) | 113±5 (n=13) |
| Bi/S | 9±1 (n=11) | 8±1 (n=11) |
| ASAT | 0.58±0.15
(n=10) | 0.43±0.04
(n=11) |
| ALAT | 0.47±0.08
(n=11) | 0.31±0.04
(n=11) |
| S-creatinin | 112±7 (n=12) | 97±4 (n=12) |
| Alive, survival,
years | 10.0±1 (n=8) | 9.6±1.4 (n=4) |
| Tumor
differentiation |
| Low | 5 | 1 |
| Intermediary | 7 | 11 |
| High | 3 | 1 |
| Tumor location |
| Right | 8 | 8 |
| Transverse | 3 | 0 |
| Left,
sigmoideum | 3 | 7 |
| Rectum | 1 | - |
Assessment of medication efficacy
Lymphocyte stimulation was used to confirm the
effect of white peripheral blood cells to produce PGE2
after endotoxin (LPS) challenge in vitro as a surrogate
marker of treatment efficacy, following NSAID provision in
vivo. Peripheral venous blood was drawn from healthy volunteers
before and after three days consumption of NSAID as described
earlier (7).
Tumor tissue material
Tumor tissue samples (down to the serosa layer) were
collected at surgery, snap-frozen in liquid nitrogen and stored at
−70°C until analysis. Recent samples were kept in RNA later
(Ambion) for 24 h at 4°C and kept at −20°C until analysis of RNA
expression. For IHC, biopsies were kept in 4% buffered formaldehyde
solution for three days at 4°C, washed and kept in 70% ethanol
until dehydration and paraffin-embedding.
RNA extraction and cDNA synthesis
Total RNA was extracted with RNeasy Fibrous Tissue
Midi kit (Qiagen), where DNase treatment was included according to
kit protocol. Quality and quantity of RNA were checked in Agilent
2100 BioAnalyzer with RNA 6000 Nano Assay kit (Agilent
Technologies). Concentration of RNA was also measured in a Nano
Drop ND-1000A spectrophotometer (Nano Drop Technologies, Inc.).
Aliquots of total RNA were used for real-time PCR, where 1 μg total
RNA was reverst transcribed with ClonTech First-Strand™ cDNA
Synthesis kit (Becton-Dickinson) and incubated for 1 h at 42°C
followed by 5 min at 94°C. Each sample was diluted to a final
volume of 100 μl. Reactions were run in parallel where the reverse
transcriptase was omitted as control for DNA contamination.
Poly(A+)RNA was selected with mRNA Purification kit
(Amersham Biosciences) for microarray analysis. Selected
poly(A+)mRNA fractions were checked in the BioAnalyzer
and quantified in the NanoDrop.
MicroRNA was extracted with mirVana total RNA
isolation kit (Ambion/Applied Biosystems) and quality and quantity
were checked as described above. cDNA was generated by the miScript
II RT kit, where miScript HiSpec Buffer ensured selective
conversion of mature miRNAs, used as templates for real-time PCR
with the miScript SYBR®-Green PCR kit (Qiagen).
Tumor mRNA was pooled from six indomethacin-treated
patients and from six sham-treated controls, respectively [indo,
71±11 (SD) years; ctrl, 74±5 (SD) years, two males, four females in
each group; Dukes A (n=1), B (n=2), C (n=3) in each group] for
microarray analysis.
Tumor miRNA pools were from the same patients,
indomethacin and controls, respectively, as described above, minus
one in each group due to degradation [indo, 69±10 (SD) years; ctrl,
73±6 (SD) years; celebrex, 72±13 (SD) years]. Tumor miRNA from
three celebrex-treated patients was pooled for microarray
screening.
Microarray expression profiling
Pooled mRNA (400 ng) from indomethacin-treated
patients were labeled with Cyanine 3-dCTP (Amersham BioSciences) in
a cDNA synthesis reaction with Agilent Fluorescent Direct Label kit
(G2557A). Four-hundred nanograms of pooled mRNA from control
patients were labeled with Cyanine 5-dCTP in parallel to the
test-fraction. Expression array (Whole Human Genome Oligo
Microarray, G4112A; Agilent Technologies), containing 44,290
features, including positive and negative control spots, was used.
Hybridization was performed for 18 h with test versus control cDNA
in a dual-color experiment followed by post-hybridization washes
according to ‘in situ Hybridization kit Plus’ instructions
(Agilent Technologies). Microarrays were dried with nitrogen gas in
a laminar flow bench and images were quantified on Agilent G2565 AA
microarray scanner and fluorescence intensities were extracted
using Feature Extraction software program (Agilent Technologies).
Dye-normalized, outlier- and background-subtracted values were
analyzed in GeneSpring software program, imported with the FE
Plug-in (Agilent Technologies). Three technical replicates were run
including dye-swap. Informative features from pooled RNA were
41,059 out of 44,290. Hands-on-variation was checked in a ‘yellow
experiment’ where the same tumor RNA was labeled with both dyes
competing for the same targets.
For miRNA expression profiling, 120 ng of pooled
total RNA was labeled with Agilent Cyanine 3-pCp reagent for direct
labeling by Agilent microRNA Labeling Reagent and Hybridization kit
(Agilent Technologies). Labeled products were hybridized to Agilent
Human microRNA (V2) single color microarrays (G4470A; Agilent
Technologies), washed and scanned on an Agilent scanner. Analyses
of scanned images from single-color microRNA expression were
performed in Feature Extraction 9.5 program (Agilent Technologies).
Three technical replicates were run for indomethacin and two for
celebrex and controls, respectively. The microarray contained 470
human and 64 human viral microRNAs. From the GeneView file, one of
the result files from the one channel Feature Extraction program,
with background adjusted values and microRNAs passing the QC
metrics, some miRNas were chosen for confirmation of expression on
a patient individual basis.
Quantitative real-time PCR
Real-time PCR was performed in a LightCycler 1.5
with either LightCycler FastStart DNA Master (SOX2b, with 2 mM
MgCl2, final concentration); LightCycler FastStart DNA
MasterPlus (both from Roche Diagnostics) [PROM1, BMP7,
OCT4B, OCT4B1, OCT4B/B1, SOX2a and glyceraldehyde-3-phosphate
dehydrogenase (GAPDH)]. Primers for target genes were added to each
capillary in a final concentration of 0.5 μM. Primer sequences,
fragment length and gene accession number are provided in Table II. For each amplification 2 μl
cDNA was used with following PCR conditions: activation for 10 min
at 95°C and denaturation for 10 sec at 95°C, 20°C/sec were the same
for all mRNAs. Annealing: 7 sec at 58°C (PROM1); 4 sec at 64°C
(BMP7, SOX2a, GAPDH); 5 sec at 66°C (OCT4B, OCT4B1, OCT4B/B1); 5
sec at 60°C (SOX2b). Extension and cycle numbers: 22 sec at 72°C,
40 cycles (PROM1); 5 sec at 72°C, 45 cycles (BMP7, SOX2b); 11 sec
at 72°C, 45 cycles (OCT4B, OCT4B/B1); 20 sec at 72°C, 40 cycles
(OCT4B1); 17 sec at 72°C, 40 cycles (SOX2a); 5 sec at 72°C, 40
cycles (GAPDH).
| Table IIGene names and accession numbers,
primer sequences, fragment length and suppliers, used in
qRT-PCR. |
Table II
Gene names and accession numbers,
primer sequences, fragment length and suppliers, used in
qRT-PCR.
| Gene name | Accession no. | Primer
sequences | Fragment length
(bp) | Supplier |
|---|
| Hs_OCT4B, isoform
2 | NM_203289 |
OCT4B-F(OCT-FB)a 5′-AGA CTA TTC CTT GGG GCC ACA
C-3′ | 244 | |
|
OCT4B-R(OCT-RB5)a 5′-GGC TGA ATA CCT TCC CAA ATA
GA-3′ | | CyberGene |
| Hs_OCT4B1, isoform
3 | EU518650 |
OCT4B-F(OCT-FB)a same as above | 272 | |
|
OCT4B1-R(OCT-RB4)a 5′-CTT AGA GGG GAG ATG CGG TCA-3′ | | CyberGene |
| Hs_OCT4B/B1, discr.
isoform 2 and 3 | | OCT4B-F
(OCT-FB)a same as above | 267 resp. | |
| OCT4B/B1
(OCT-RB2)a 5′-CTC AAA GCG GCA
GAT GGT CG-3′ | 492 | CyberGene |
| Hs_SOX2a | NM_003106 | SOX2a-F 5′-AAG TTC
TAG TGG TAC GGT AGG A-3′ | 447 | CyberGene |
| SOX2a-R 5′-ATT ACC
AAC GGT GTC AAC CTG C-3′ | | |
| Hs_SOX2b | NM_003106 | RT2 qPCR
Primer Assay for human SOX2, PPH02471 A | 115 | SABiosciensis |
| Reference position:
base 1091 | | Qiagen |
| Hs_BMP7 | NM_001719 | QuantiTect Primer
Assay for human BMP7, QT00068936 | 128 | Qiagen |
| Hs_Prom1 | NM-006017 | PROM1-F 5′-TGG ATG
CAG AAC TTG ACA ACG T-3′ | 552 | CyberGene |
| PROM1-R 5′-TGC TCG
TGT AAG GTT CAC AGA T-3′ | | |
| Hs_GAPDH | NM_002046 | Hs_GAPDH_1_SG
QuantiTect Primer Assay, QT00079247 | 95 | Qiagen |
| Hs_miR-1 | MIMAT0000416 | miScript Primer
Assay for Human miR-1_2, MS00008358 | 85–87 | Qiagen |
| Hs_miR-133a | MIMAT0000427 | miScript Primer
Assay for Human miR-133a_2, MS00031423 | 85–87 | Qiagen |
| Hs_miR-630 | MIMAT0003299 | QUNTHSMIR-0630 | 85–87 | Quanta
BioSciences |
| Hs_RNU6-2 | Entrez Gene ID:
26826 | miScript Primer
Assay for Human RNU6-2_11, MS00033740 | 85–87 | Qiagen |
PCR conditions for miRNAs were as follows:
activation for 15 min at 95°C; denaturation for 15 sec at 94°C,
1°/sec; annealing for 30 sec at 55°C; extension for 30 sec at 70°C,
45 cycles.
For mRNA, all samples were performed in duplicates
and related to the expression of GAPDH (QuantiTect Primer Assay;
Qiagen) which was the least variable housekeeping gene of 11 tested
candidates (15). For miRNAs,
samples were also performed in duplicates but related to the
expression of RNA, U6 small nuclear 2 (RNU6-2). Quantitative
results were derived by use of the relative standard curve method
where the standard specimen was cDNA from a sham-treated human
colon tumor (intermediate differentiation, Dukes C) or pooled cDNA
from five tumors from sham-treated patients, belonging to the
study. All PCR products had expected size analyzed with Agilents
BioAnalyzer in DNA 1000 Chip and all reactions were confirmed by
means of both positive and negative controls (one dilution of
standard curve cDNA respective water substituted for cDNA).
IHC
Formalin-fixed and paraffin-embedded tissue sections
(4 μm), were deparaffinized and rehydrated according to standard
procedure and rinsed twice in 5 mM Tris-buffered saline (TBS), pH
7.8. Sections were microwave-radiated in 0.01 M Citrate Buffer, pH
6.1 (S1700; DakoCytomation) for target retrieval. Sections were
mounted with Shandon Coverplates. Non-specific protein binding was
initially blocked with TBS containing 5% fat-free dry milk,
followed by the procedure described in EnVision Dual Link
System-HRP (K4065; DakoCytomation) (CD133) or with a mix of the
EnVision kit and BioSite Histo Plus (HRP) Polymer kit (KDB-10003;
Nordic BioSite) (SOX2). Monoclonal mouse anti-human CD133/1 (AC133,
130-090-422; Miltenyi Biotec) and rabbit mAB hSOX-2
(D6D9)xp (BioNordica) were used at 15 and 0.2 μg/ml,
respectively as final concentrations. Normal mouse IgG1
(DakoCytomation, 0931) and normal rabbit IgG (DakoCytomation,
X0903) were used as negative controls, incubated in parallel.
Diaminobenzidine (DAB), included in the EnVision kit, was used as
chromogen. Counterstaining was performed in Mayer’s hematoxylin and
mounting was done in Mountex following dehydration (Histolab
Products AB).
Observations of protein occurrence and distribution
on antibody stained tissue sections were performed in Nikon eclipse
E400 microscope and Digital HyperHAD Color Video Camera (Sony)
using Easy Image Analysis software (Tekno Optik AB). A
semiquantitative scoring system was used, where estimation of
protein distribution area in percent was multiplied with intensity
scores (range, 0–5; maximum score, 100×5) for evaluation of
immunostaining.
PGE2 analysis
Tumor samples were immediately processed as
described earlier and PGE2 was measured by
radioimmunoassay following extraction (16). Tumors from 11/15 patients in each
group were analyzed.
Statistics
Results are presented as mean ± SEM and median
values when appropriate. Non-parametric statistics were used in
group comparisons (Mann-Whitney U test and CHI2 test). P<0.05
was considered significant and p<0.10 a trend to significance in
two-tailed tests.
This study was approved by the Regional Ethics
Review Board, University of Gothenburg, Clinical Trials
(NCT00473980).
Results
Results from indomethacin- and celebrex-treated
patients were considered as one group of NSAID-treated patients,
according to previous reports (7,8).
PGE2
PGE2 concentration in NSAID-treated
tumors was 5.05±2.04 ng/g tissue (n=11) compaired to 34.42±11.18
ng/g tissue (n=11) in sham-treated controls. NSAID reduced
PGE2 levels by 85% (p=0.004).
PROM1/CD133
Prominin1 tumor mRNA expression was re-analyzed in
new biopsies from each of the original tumors to confirm our
earlier results, including the two new patients. PROM1 expression
levels remained significantly lower in patients treated with NSAID
compared to control patients (0.45±0.10 vs. 0.79±0.12; p=0.03)
(Table III) (8).
| Table IIITumor transcript alterations of stem
cell-related genes in colorectal cancer from patients randomized to
preoperative NSAID treatment versus sham treatment. |
Table III
Tumor transcript alterations of stem
cell-related genes in colorectal cancer from patients randomized to
preoperative NSAID treatment versus sham treatment.
| Q-PCR ratio | Sham-treated
controls | NSAID-treated | P-valuea |
|---|
| SOX2a | 0.20 (n=14) | 1.15 (n=14) | 0.03 |
| 0.59±0.26 | 2.07±0.56 | |
| SOX2b | 0.41 (n=15) | 1.18 (n=15) | 0.03 |
| 0.53±0.14 | 2.64±0.88 | |
| SOX2a+b | 0.27 (n=15) | 1.18 (n=15) | 0.002 |
| 0.55±0.14 | 2.36±0.52 | |
| OCT4B | 1.26 (n=14) | 1.17 (n=14) | 0.46 |
| 1.77±0.33 | 1.84±0.51 | |
| OCT4B1 | 0.08 (n=14) | 0.80 (n=14) | 0.14 |
| 0.41±0.13 | 1.17±0.35 | |
| OCT4B/B1 | 0.24 (n=15) | 0.86 (n=15) | 0.43 |
| 0.85±0.29 | 2.36±0.84 | |
| BMP7 | 0.42 (n=15) | 0.22 (n=15) | 0.18 |
| 0.40±0.08 | 0.57±0.36 | |
| PROM1 | 0.64 (n=15) | 0.29 (n=15) | 0.03 |
| 0.79±0.12 | 0.45±0.10 | |
It was confirmed earlier that CD133 protein (AC133
epitope) staining appeared in apical plasma membrane of epithelial
tumor gland formations and mostly in lumina where shed cells seemed
to spread AC133-containing particles (8). Five of 15 NSAID-treated patients
(33%) had tumors that stained positive for AC133 compared to tumors
in control patients, where 11/15 (73%) (p=0.001) stained positive.
The mean rank of staining scores in NSAID-treated tumors was
numerically lower compared to scores in control patients, with a
trend to significance (49±24 vs. 82±28; p=0.07, median values 0 vs.
60).
OCT4B/OCT4B1
Levels of transcription factors OCT4B and OCT4B1
mRNA were not significantly changed by NSAID measured by qRT-PCR
(Table III). The second primer
set for OCT4B/B1, with discriminating capacity between the two
transcripts, confirmed the results obtained with the specific
primers (2.36±0.84 vs. 0.85±0.29; p=0.43) for NSAID-treated and
control patients, respectively. When amplicons were run in Agilent
2100 Bioanalyzer, the gel image with global setting, showed the
relationship between the two isoforms, OCT4B (267 bp) and OCT4B1
(492 bp), based on estimated band intensities. Here, two biopsies
from each patient were individually analyzed to cover intra-tumoral
heterogeneity.
SOX2
Two array-probes differently located in the mRNA
sequence, indicated different signaling from the pooled RNA
fractions, although only one transcript is reported for SOX2. At
individual Q-PCR follow-up, probes were chosen to cover the two
forms, A and B, seen in NCBI AceView. The same increased expression
was seen for both amplicons within the study groups and the results
were therefore grouped together. Thus, SOX2 transcripts were
significantly upregulated by NSAID compared to sham-treatment
(2.36±0.52 vs. 0.55±0.14; p=0.002) (Table III).
IHC confirmed SOX2 protein expression in both tumor
tissue from study and control patients. Total scores were estimated
as 91±52 and 55±29; p=0.75 (median values 40 and 15) for
NSAID-treated versus controls. SOX2 protein was found in tumor
epithelium in 4/5 tumor sections of NSAID-treated as well as in
controls, but differed in cellular localization, where three and
one patient expressed nuclear SOX2, respectively (p=0.03).
BMP7
Tumor BMP7 mRNA was not significantly altered by
NSAID, compared to sham-treatment (0.57±0.36 vs. 0.40±0.08;
p=0.18), respectively (Table
III).
MicroRNA
Around 240 miRNAs out of the 470 human and 64 human
viral miRNAs on the arrays were expressed in tumors from
NSAID-treated patients as well as in control patients. Effects by
celebrex seemed to be most intense, with high amplitudes and
extensive effects on miRNAs. Upregulated expression of the tumor
suppressor miR-630 was confirmed with Q-PCR on individual patient
basis, with an NSAID ratio of 4.41±1.35 vs. 0.88±0.26 (p=0.002) for
controls. Tumor suppressors miR-1 and miR-133a were also evaluated
by Q-PCR on an individual patient basis, without significant
alterations (2.02±0.86 vs. 0.88±0.26; p=0.41, miR-1) and (3.30±2.29
vs. 1.21±0.71; p=0.48, miR-133a) for NSAID-treated patients versus
controls (Table IV).
| Table IVTumor microRNA alterations in
colorectal cancer from patients randomized to preoperative NSAID
treatment versus sham-treatment. |
Table IV
Tumor microRNA alterations in
colorectal cancer from patients randomized to preoperative NSAID
treatment versus sham-treatment.
| Q-PCR ratio | Sham-treated
controls | NSAID-treated | P-valuea |
|---|
| Hsa
miR-630/RNU6 | 0.67 (n=6) | 2.44 (n=9) | 0.002 |
| 0.88±0.26 | 4.41±1.35 | |
| Hsa miR-1/RNU6 | 0.57 (n=6) | 1.22 (n=9) | 0.41 |
| 0.93±0.32 | 2.02±0.86 | |
| Hsa
miR-133a/RNU6 | 0.57 (n=6) | 0.86 (n=9) | 0.48 |
| 1.21±0.73 | 3.30±2.29 | |
Discussion
The stemness associated marker Prominin 1/CD133 was
earlier reported to be decreased at mRNA and AC133 protein epitope
level in colon cancer tissue by NSAID (8); and now further confirmed by
re-analyses of the same but extended patient material. The AC133
antibody (as well as 293C/AC141) recognizes an epitope on the
second extracellular loop of the protein and is frequently used to
isolate cancer stem cells(CSCs). Expression of AC133 may serve as
an independent, significant marker for prognosis and
chemoresistance in colorectal cancer, as well as in other solid
tumor types (17–19). The complex Prom1 gene contains five
promoters and seven splice variants (SVs) and generate distinct
protein isoforms. The AC133 antibody does not specifically
recognize a glycosylated epitope as previously suggested (20). Nevertheless, CD133 is a highly
glycosylated protein with eight putative N-linked glycosylation
sites, and differentiation of cells reflects a change in CD133
glycosylation. Neither promoter activity, nor mRNA- or splice
variant expression differ between CSCs and differentiated cancer
cells (DCCs). CD133 protein expression is unchanged, but the AC133
and 293C/AC141 epitopes are reduced in glycosylation at
differentiation (20). This change
seems to mask the epitopes for the antibodies, due to different
protein folding or by binding to other proteins (20). Changes in the tertiary structure is
also supported as reported (21).
In our study, however, the diminished detection of AC133 epitope
might reflect an event other than differentiation, since mRNA
levels were also reduced.
OCT4 (Chr 6p21.3) and SOX2 (Chr 3q26.3-q27),
considered to be the top regulators of the pluripotent network
during development, as well as in an increasing list of tumors,
form a trimeric complex with target DNA (11,12).
Principally, the expression of these molecules declines at
differentiation of embryonic stem cells (ESCs), while OCT mainly
affects proliferation in CSCs (22). There are multiple isoforms of OCT4
with at least three transcripts (OCT4A, OCT4B and OCT4B1) and four
protein isoforms (OCT4A, OCT4B-190, OCT4B-265 and OCT4B-164)
(23,24). OCT4B1 can be alternatively spliced
and translated into all OCT4B proteins, linking OCT4B1 to
OCT4B-mediated functions such as stress response (25). Overexpression of OCT4B1 has been
related to poor prognosis in cancer in several studies. Expression
of OCT4B1 was upregulated in CRC tissues, compared to adjacent
non-cancerous tissues, which suggested OCT4B1 to represent a
potential biomarker for the initiation, progression and
differentiation of CRC (26). Like
OCT4B1, SOX2 is reported to act as an oncogene, being upregulated
in CRC, and in esophageal squamous cell carcinoma, where it
correlated to poor clinical outcome (27,28).
SOX2 could also act as a tumor suppressor gene, being frequently
downregulated in gastric cancers, some of which appeared due to
epigenetic silencing through DNA methylation. Overexpression of
SOX2 by transfection of human gastric cell lines induced cell cycle
arrest and induced apoptosis (29). Hypermethylation of SOX2 promoter in
endometrial carcinogenesis was correlated to short survival of
patients as reported (30).
Hence, SOX2 shows conflicting results on expression
in different tumor types. Knockdown of SOX2 impaired growth and
tumorigenicity in brain tumor cells, but surprisingly, a 3-fold
elevation above endogenous levels impaired proliferation. In DAOY
medulloblastoma cells, the ectopical elevation of SOX2 reduced cell
density and increased the proportion of quiescent cells and gene
markers associated with a more differentiated phenotype. Similarly,
elevation of SOX2 in prostate and breast tumor cells reduced the
number of viable cells (31). OCT4
and SOX2 induce divergent embryonic developmental programmes, thus
being not just an on-off control system (32). So, apparently, OCT4 and SOX2
modulate their own transcription by both positive and negative
feedback loops in ESCs and CSCs. While SOX2 overexpression in ES
cells was shown to mediate a general inhibitory effect on OCT4:SOX2
target genes, this was not observed with OCT4 overexpression, which
seemed to inhibit only its own promoter and the Nanog promoter
(11,33). Nanog is a partner to OCT4 and SOX2,
cooperating in the stem cell niche (34). We observed no influence by
indomethacin on tumor mRNA levels of Nanog, when screened on the
microarrays, so this gene was not a focus in our study.
In the present study, Q-PCR on individual patient
material showed no significant change of OCT4B transcript variants,
while SOX2, the heterodimer binding partner to OCT4, was
significantly upregulated at mRNA level by NSAIDs. SOX2 protein
levels correlated with mRNA expression, as measured in random
samples from each patient group by IHC. So, increased levels of
SOX2 transcript and protein could imply a negative feedback loop,
resulting in reduced number of CD133 expressing cells. This is in
accordance to the study by Qiu et al, who showed that NSAID
targets oncogenic intestinal stem cells (35). Patients with advanced adenomas were
divided into two groups, one with subjects taking NSAIDs (not
specified) during the preceding year and one group without NSAID
intake. Apoptotic TUNEL-positive cells increased by NSAID and could
be detected in cells staining positive for OLFM4, an intestinal
stem cell marker (35).
Other molecules, closely connected to the stem cell
niche, are the BMPs, acting in the BMP signaling pathway. They are
extracellularly secreted ligands, belonging to the transforming
growth factor β (TGFβ) superfamily. The expression patterns of BMPs
are often altered in several tumors and there may be different
response to any given BMP, depending on tumor and cell types. BMP7
is reported to be upregulated in breast cancer, malignant melanoma,
hepatocellular carcinoma, esophageal squamos cell carcinoma and in
CRC, where it is associated with poor prognosis and low overall
survival (36–39). In one study of human gastric
cancer, BMP7 was downregulated due to promoter methylation, and
reduced levels of BMP7 in lung cancer were correlated to positive
lymph nodes in another study, where the BMP7 protein was shown to
regulate cell motility and progression, with little impact on the
growth of tumor cells (40). A
selective effect by indomethacin on BMP7 mRNA levels was observed
in the present study, with a 3-fold decrease in expression
(0.12±0.04 vs. 0.40±0.08, p=0.02) for indomethacin-treated and
control patients, respectively, while this effect was lost on the
basis of all NSAID-treated patients. This may indicate discrepant
effects by specific and unspecific COX inhibitors.
CSCs are often resistant to chemotherapy and other
treatments. Partly this is due to deregulated miRNAs, which may
function as tumor suppressors or oncomiRs. A retrospective study,
screened for a specific tumor miRNA ‘signature’ correlating with
pathological complete response (pCR) after neoadjuvant
radiochemotherapy of patients with locally advanced rectal cancer.
Fourteen miRNAs were differently expressed in the complete
responders compared to non-responders. Two miRNAs, miR-622 and
miR-630, were upregulated in tumors from patients with good
prognosis and were downregulated in poor responders (41). Two other studies, reported induced
growth inhibition and apoptosis by miR-630 in a human pancreatic
carcinoma cell line, and induced sensitivity of breast cancer cell
lines with resistance to HER-targeting drugs (42,43).
NSAIDs upregulated miR-630 expression in the present study, with a
5-fold increase. There are 2,418 targets predicted for miR-630 by
the miRanda algorithm and NSAID upregulation of miR-630 might thus
influence on tumor growth (44).
Other miRNAs, acting as tumor suppressors and frequently
downregulated in human solid cancers, are miR-1, miR-133a, miR-133b
and miR-206 (45–50). miR-1 and miR-133a form clusters on
two chromosomes, at 20q13 and 18q11, producing mature miRs with
identical sequences, while miR-206 and miR-133b are located at
chromosome 6p12 (51). Within the
clusters, these miRNAs often cooperate in regulation of oncogene
networks as WNT, MAPK and JAK-STAT, with many target genes in
common, but they may also function independently. Due to the
reported regulatory teamwork of miR-1 and miR-133a and since there
were only three informative patients in the celebrex group, we
permitted ourselves to sub-group expression values, where celebrex
upregulated miR-1/miR-133a 5.7× (4.4× median value) (6.13±3.27 vs.
1.07±0.38; p=0.02) compared to controls. Silencing of
miR-1/miR-133a tumor suppressor genes was reported to be caused by
promoter methylation, histone deacetylase (HDAC) activity as well
as disruption of actin cytoskeleton events, the latter leading to
disturbed chromosomal segregation (49). Restoration of miR-1/miR-133a may
induce apoptosis and cell cycle arrest, inhibit migration and
invasion of cancer cells. Similar effects were shown for miR-133b
(48–51).
Microarray analysis in our study, showed tumor
suppressor miR-133b to be upregulated selectively 8.8-fold by
celebrex. Our microarray results also showed the oncomiR-552 to be
downregulated by NSAIDs, compared to sham-treated controls, 2.6-
and 5.0-fold for indomethacin and celebrex, respectively, but they
were not confirmed on individual patient basis. OncomiR-552 is
commonly upregulated in CRC. Overexpression of this miRNA was
associated to lymph node and distant metastasis-positive CRCs
suggesting that overexpression of miR-552 could imply poor
prognosis. When treating HT-29 colon cancer cells with celecoxib,
miR-552 was downregulated 2.1-fold compared to control cells
(52).
Due to complex interactions between factors and
signaling pathways as judged by visual inspection of files from
microarray analyses, we also considered data with indicated
different phenotypes of indomethacin-treated patients with support
from results in other studies, as well as individually based Q-PCR
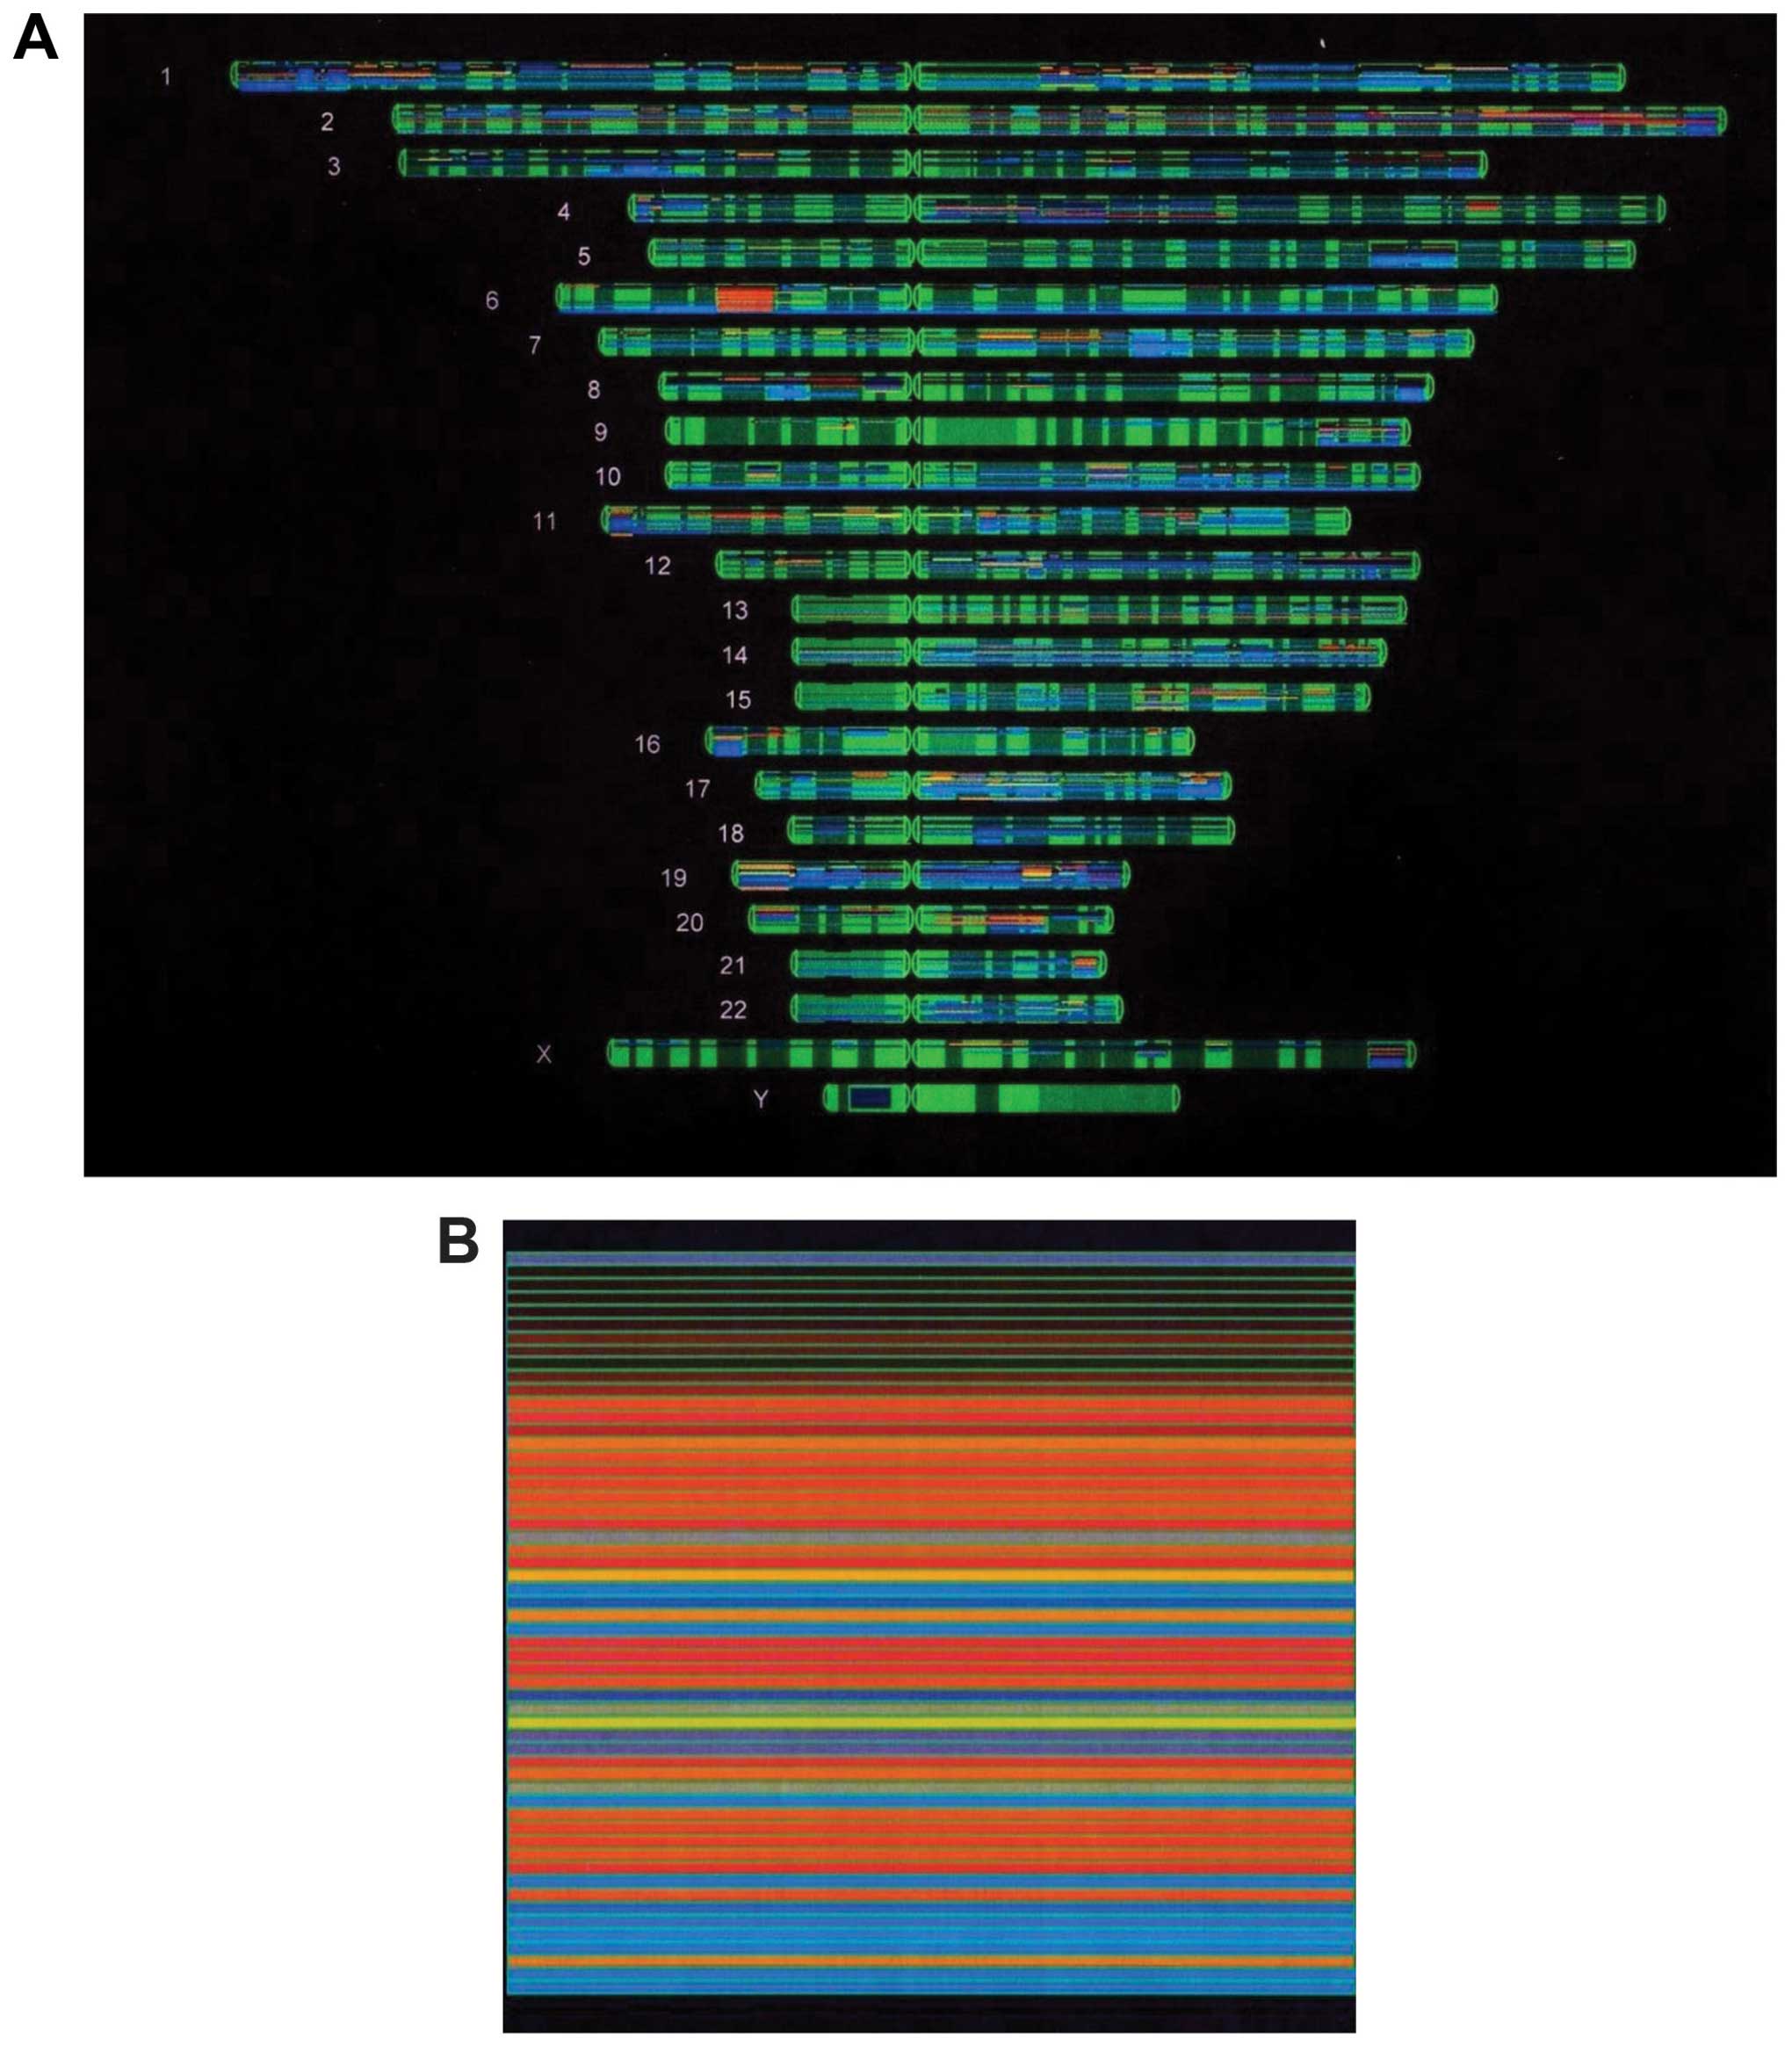
analyses. Some altered genes belong to chromosome 6p21 or the
extended MHC locus (xMHC), covering 7.6 Mb on the short arm of
chromosome 6, represented by POLR1C and MAPK14/p38, as well as
HIST1H2B1, belonging to a histone gene cluster containing 55
histone genes at 6p22-6p21 (Fig.
1). Together with other genes, they represent tumor markers,
growth factors, growth factor receptors, oncogenes, tumor
suppressor genes, glucose transporters and cytoskeletal genes
(36,53–73)
(Table V).
| Table VMicroarray data and tumor gene
expression profiles. |
Table V
Microarray data and tumor gene
expression profiles.
| A, Gene transcript
alterations in microarray analyses of pooled CRC tumors from
patients randomized to preoperative NSAID treatment versus sham
treatment. |
|---|
|
|---|
| Systematic
name | Gene name | Descriptive
name | Array ratio | No. of arrays with
p<0.05 |
|---|
| NM_006017 | PROM1 | Hs prominin 1 | 0.57±0.13 | 2/3 |
| NM_002293 | LAMC1 | Hs laminin γ1
(formerly LAMB2) | 0.45±0.07 | 2/3 |
| NM_002423 | MMP7 | Hs matrix
metalloproteinase 7 | 0.41±0.02 | 3/3 |
| NM_005343 | HRAS | Hs v-Ha-RAS Harvey
rat sarcoma viral oncogene homolog | 0.14±0.04 | 3/3 |
| NM_002747 | MAPK4 | Hs
mitogen-activated protein kinase 4 | 0.28±0.09 | 3/3 |
NM_001315
Z25432 | MAPK14 | Hs
mitogen-activated protein kinase 14, transcript variant 1 | 0.36±0.09 | 3/3 |
| NM_006129 | BMP1 | Hs bone
morphogenetic protein 1, transcript variant BMP1–3 | 0.25±0.04 | 3/3 |
| NM_001718 | BMP6 | Hs bone
morphogenetic protein 6 | 0.58±0.28 | 2/3 |
| NM_001719 | BMP7 | Hs bone
morphogenetic protein 7 | 0.50±0.03 | 3/3 |
| NM_002737 | PRKCA | Hs protein kinase
C, α | 0.26±0.04 | 3/3 |
| NM_173500 | TTBK | Hs τ tubulin kinase
2 | 0.19±0.05 | 3/3 |
| NM_000343 | SLC5A1 | Hs solute carrier
family 5 (sodium/glucose co-transporter), member 1 | 0.64±0.15 | 2/3 |
| NM_001379 | DNMT1 | Hs DNA
(cytosine-5)-methyl-transferase 1 | 0.33±0.15 | 2/3 |
| NM_058197 | CDKN2A/p16 | Hs cyclin-dependent
kinase inhibitor 2A, transcript variant 3 | 2.41±0.27 | 2/3 |
| NM_001759 | CCND2 | Hs cyclin D2 | 0.55±0.03 | 3/3 |
| NM_023110 | FGFR1 | Hs fibroblast
growth factor receptor 1, transcript variant 1 | 0.22±0.07 | 3/3 |
| NM_145040 | PRKCDBP | Hs protein kinase
C, δ binding protein | 4.14±1.62 | 2/3 |
| NM_004935 | CDK5 | Hs cyclin-dependent
kinase 5 | 0.19±0.06 | 3/3 |
| NM_004875 | POLR1C | Hs polymerase (RNA)
I, (DNA directed), polypeptid C, 30 kDa | 0.14±0.06 | 3/3 |
| NM_000149 | FUT3 | Hs
fucosyltransferase 3 | 0.43±0.08 | 3/3 |
| NM_004363 | CEACAM5 | Hs carcinoembryonic
antigen-related cell adhesion molecule 5 | 0.53±0.05 | 2/3 |
| NM_002483 | CEACAM6 | Hs carcinoembryonic
antigen-related cell adhesion molecule 6 | 0.41±0.02 | 3/3 |
| NM_006890 | CEACAM7 | Hs carcinoembryonic
antigen-related cell adhesion molecule 7 | 0.50±0.12 | 2/3 |
| NM_000692 | ALDH1B1 | Hs aldehyde
dehydrogenase 1, family member B1 | 0.36±0.04 | 3/3 |
| NM_012098 | ANGPTL2 | Hs
angiopoietin-like protein 2 | 0.15±0.05 | 3/3 |
| NM_033667 | ITGB1/CD29 | Hs integrin β1,
isoform 1C-1 | 0.10±0.03 | 3/3 |
| NM_003520 | HIST1H2BN | Hs histone 1, H2
bn | 0.23±0.02 | 3/3 |
| NM_080720 | H2AFB3 | Hs histone H2A
variant Barr-body deficient | 0.17±0.07 | 3/3 |
| B, Deduced tumor
gene expression profile with subsequent events following
preoperative indomethacin treatment. |
|---|
|
|---|
| Gene name | Subsequent
events |
|---|
| INDO, PROM1, LAMC1,
MMP7 | Depressed signal
transduction with a reduction in expression of mesenchymal-and
metastasis-associated genes, which also might be involved in
Wnt/β-catenin signaling (54,55). |
| INDO, H-RAS, MAPKs,
MMPs | Depressed signal
transduction with decreased motility and invasiveness (56,57). |
| INDO, BMPs,
BMPR1/2a, MAPKs | Decreased signal
transduction with depressed aggressiveness, less metastases and
improved prognosis (36,58). |
| INDO, PRKCA, TTBK,
SLC5A1 | Decreased
transport, with downregulated protein kinase C and T-tubulin
kinase, which regulate the Na+-coupled glucose
transporter SLC5A1 (SGLT1), able to work at low glucose
concentrations. This results in less glucose uptake in tumor cells,
influencing their survival (59). |
| INDO, DNMT1,
CDKN2A/P16, CyclinD2 | Downregulation of
methylating protein DNMT1 reactivates expression of tumor
suppressor CDKN2A/P16, which inhibits Cyclin D-CDK complexes,
followed by decreased cell proliferation. Less expression of CCND2
at the invasive margins of CRCs probably means lowered risk for
metastases (60,61). |
| INDO, FGFR1 | FGFR1 signal
transduction is involved in several pathways, influencing
angiogenesis, proliferation and cell growth. Downregulation of
FGFR1 in tumors means attenuated growth and less metastases
(62). |
| INDO, PRKCDBP | Protein Kinase C, δ
binding protein, is a proapoptotic tumor suppressor, known to be
frequently downregulated by promoter hyper methylation in CRC.
Upregulation induces G(1) cell
cycle arrest (63). |
| INDO, CDK5 | Cyclin-dependent
kinase 5 is reported to be overexpressed in pancreatic cancer,
colon tumors as well as in colon cancer cells, while normal colonic
mucosa has minimal expression. Downregulation of CDK5 means
decreased cell proliferation (64,65). |
| INDO, POLRC1 | In transcription
regulation, polymerase (RNA) I polypeptide C, 30 kDa (POLR1C)
provides instruction for making one subunit in RNA polymerase I and
III, which are involved in synthesizing rRNA and tRNA. Shortage of
rRNA might trigger apoptosis (61). |
| INDO, CEACAMs | Carcinoembryonic
antigen cell adhesion molecules CEACAM5 (CEA) and 6 are often
overexpressed in CRC. Downregulation of these tumor markers
indicates less invasiveness and metastases. CEACAM7 is reported to
have divergent expression in different tumor types (66–68). |
| INDO, FUT3 | The tumor marker
galactoside 3(4)-L-fucosyltransferase (FUT3/CA19-9) is often
upregulated in CRC and involved in cancer cell adhesion to
endothelial cells, as well as in TGFB-mediated EMT. Downregulation
decreases tumor cell migration, invasion and the metastatic
activity (69). |
| INDO, ALDH1B1 | Aldehyde
dehydrogenase 1 (ALDH1B1) is an enzyme and common marker for stem
cells and cancer stem cells, responsible for the oxidation of
intracellular aldehydes. Downregulation of ALDH1 suggests improved
prognosis for CRC patients (70). |
| INDO, ANGPTL2,
ITGB1/CD29c | Angiopoietin-like
protein 2 is reported to increase inflammatory carcinogenesis in
several cancers, mediated by the integrin receptor α5β1/CD29, with
signaling molecules, e.g., MAPK14/p38 and MMPs. Downregulation of
these genes means less inflammation, less cell migration and
metastases (71,72). |
| INDO,
HIST1H2BN | Histone synthesis
is tightly coupled to chromosomal replication during S-phase of
cell division cycle, and downregulation of histones might
destabilize chromatin organization and induce DNA damage (73). |
| INDO, H2AFB3 | This is an atypical
histone, which can replace conventional H2A in some nucleosomes,
making them less rigid and being associated with active
transcription and RNA processing (GeneCards). |
Treatment with a DNA demethylating agent, such as
5-aza-cytidine (5-AzaC), or the histone deacethylation inhibitor
trichostatin A (TSA), may induce re-expression of miRNAs followed
by expression of protein coding tumor suppressor genes, since
deregulated miRNA expression can be caused by epigenetic silencing
due to DNA methylation of promoter CpG islands or hypoacetylation
of nucleosomal histone proteins (49,51).
Several DNA methyltransferases catalyze DNA methylation, e.g.,
DNMT1, DNMT3a and DNMT3b (74).
DNMT1 controls precise duplication and maintains the pre-existing
global DNA methylation patterns after duplication in addition to
gene-specific methylation in human cancer cells and DNMT3a/b are
involved in de novo methylation (75,76).
Peng et al showed DNMT1 protein expression to increase
significantly and progressively in multistage carcinogenesis of the
pancreas. They analyzed five cell cycle control genes and found
tumor suppressor genes APC and CDKN2A/p16 to be the most frequently
methylated in their study (77).
Selective depletion of DNMT1 was reported to reactivate expression
of CDKN2A/p16 in HCT116 colon cancer cells and re-expression of
CDKN2A/p16 after knockdown of DNMT1 in human lung and breast cancer
cells (74,76,78).
Moreover, p16Ink4 (CDKN2A) methylation in CRC patients
seemed to define a group with poor prognosis (79).
Our microarray data showed that indomethacin
appeared to decrease DNMT1, which seemed to be coordinated with
upregulation of CDKN2A/p16 tumor suppressor gene (Table V). Therefore, we conclude that
upregulation of HLA and accessory molecules, as reported earlier,
in part could be explained by the decrease of DNA methylating
enzymes.
Pair of four core histone proteins, H2A, H2B, H3 and
H4, make up the octameric nucleosomes, around which the DNA is
wrapped, with histone 1 as a linker. Histone modifications, the
‘histone code’, affect chromatin structure and gene expression.
Histone acetyltransferases (HATs) acetylate the N-terminal histone
tail, make a ‘relaxed’ chromatin structure that allows
transcriptional activation, and HDACs make the chromatin condensed
and inactive for DNA transcription (80,81).
In our study, no change in mRNA expression of HATs or HDACs was
seen. We found a direct histone-associated event, the
downregulation of the H2A histone family, member B3 (H2AFB3) and
histone H2B type1-N (HIST1H2BN) at mRNA levels on microarrays
(Table V). Histone synthesis is
tightly coupled to chromosomal replication during S-phase of cell
division (73). H2AFB3 is an
atypical histone and can replace conventional H2A in some
nucleosomes, making them less rigid, and being associated with
active transcription and RNA processing (GeneCards). Inhibition of
histone synthesis during S-phase in mammalian cells destabilizes
chromatin organization and may induce DNA damage (73).
The non-histone modifier HDAC6 associates with
CD133, being the only candidate interaction partner for CD133
(54). CD133, HDAC6 and β-catenin
can associate to a complex and might be directly involved in
promoting WNT/β-catenin signaling. Depletion of CD133 or HDAC6 in
OVCAR-8 cells resulted in reduction of mesenchymal-and
metastasis-associated genes such as SLUG, laminin γ1 (LAMC1) and
matrix metalloproteinase 7 (MMP-7), reported as targets for the
WNT/β-catenin pathway (54). In
our present study, the downregulated level of Prom1/AC133 was
followed by a decrease of LAMC1 and MMP-7 (Table V). Further, HDAC6 has also been
shown to be required for efficient oncogenic RAS-associated
transformation and tumor formation (82). CD133 was shown to have similar
effects and suggested a possible RAS influenced signaling module of
HDAC6 and CD133, for the cell cycle (54,82).
Indomethacin and other amphiphilic NSAIDs stabilize
cholesterol domains in the plasma membrane, thereby influencing on
membrane heterogeneity and protein nanoclustering, with
consequences for cell signaling (56). Ras proteins are anchored to the
inner surface of the plasma membrane, where H-, K-, and N-Ras
proteins assemble into spatially distinct dynamic nanoclusters.
Indomethacin (and other NSAIDs) compromise the GTP-dependent
lateral segregation and disturb nano-cluster separation, thereby
decreasing Ras signal transmission through the MAPK pathway.
Different NSAIDs showed that this membrane stabilizing effect was
independent of COX activity (56).
Our microarray results indicated that H-Ras was
downregulated 7-fold by indomethacin, whereas K-Ras and N-Ras were
unchanged (Table V). Kim et
al showed that H-Ras induced an invasive phenotype in human
breast epithelial cells, by signaling through MAPK/p38 (MAPK14).
The increased cell motility was accompanied with ECM degradation by
increased activity of matrix metalloproteinases (57). MAPK14 and MMP-7 were downregulated
on microarrays by indomethacin in our present study.
The course of events by NSAID treatment is hard to
predict, as shown in studies with celecoxib and anti-inflammatory
plant compounds as curcumin and quercetin (61,83,84).
In vitro experiments with only one type of cells, factors as
drug concentration and time course, influence on expression and
direction. Considering the complex network in colon tumors, with
communication between cancer cells and surrounding stromal cells,
there are still some genes or group of genes that are frequently
occurring as targets for these anti-cancer substances, e.g., POLR1C
(transcription regulation), CDKN2A and cyclins (cell cycle), MHC
class II genes (immune system), MAPKs, PRKC, BMPs and FGFR (signal
transduction), integrins (cell adhesion), CEACAM 5 (oncogene) and
histones (cell cycle control). This is in agreement with our
overall findings and with the NSAID model network (85) (Table
V). Several of these genes belong to the xMHC on chromosome
6p22.2-6p21.32, one of the most polymorphic and gene-dense regions
in the human genome. This was recently confirmed in genome-wide
association studies (GWAS), where the genome was partioned into 200
kb ‘bins’ in a meta-analysis in an effort to map disease loci.
While 92% of bins were not disease-associated, 10 bins (0.06%) were
significantly enriched for susceptibility of multiple diseases. Two
with highly significant ‘hotspots’ mapped to the MHC locus, 6p21
(four bins), and to the CDKN2a/b (INK4/ARF) tumor suppressor locus
on chromosome 9p21.3 (one bin). Surprisingly, 30% of all tested
human diseases mapped to one of these two regions. The 10
significantly enriched bins contained genes associated to
inflammation or cellular scenescence pathways, including cancer
(86).
In our study, tumor PGE2-concentrations
were depressed by NSAIDs to 15% of controls, mostly due to
inactivation of COX enzymes, since no significant changes in mRNA
expression of these molecules could be detected. Thus,
PGE2 downstream signaling through EP-receptors should
have been reduced by 85%, implying a more favourable situation for
patients, consistent with other reports (1–5).
Also, in spite of the NSAID-upregulated mRNA
expression of the pro-pluripotency gene SOX2, other putative stem
cell associated markers found in CRC were not increased (87,88).
Instead, drug-induction suggested decrease for ITGB1/CD29c and
ALDH1B1, while CD24, CD44, CD166, ALDH1A1 and Lgr5 were unchanged
as detected by signals from microarrays with pooled tumor RNA from
indomethacin-treated patients versus pooled tumor RNA from control
patients. Overexpression of these markers correlates to poor
prognosis (Table V).
Taken together, a short preoperative NSAID treatment
of CRC-patients seemed to decrease expression of several genes
responsible for growth, invasion and metastasis and to increase
expression of tumor suppressors as well as to activate the immune
system. This change towards less aggressive tumor cells may be
associated with improved outcome in patients, as reported by us
earlier (5). Thus, a growing list
of evidence supports the use of anti-inflammatory agents as
adjuvant therapy for colorectal cancer patients, improving both
survival and quality of life (89).
Acknowledgements
This study was supported in part by grants from the
Swedish Cancer Society (2014), the Swedish Research Council
(08712), Assar Gabrielsson Foundation (AB Volvo), Jubileumskliniken
Foundation, Inga-Britt and Arne Lundberg Research Foundation,
Swedish and Gothenburg Medical Societies and the Medical Faculty,
University of Gothenburg, Wilhelm and Martina Lundgren
Foundation.
References
|
1
|
Flossmann E and Rothwell PM: British
Doctors Aspirin Trial and the UK-TIA Aspirin Trial: Effect of
aspirin on long-term risk of colorectal cancer: consistent evidence
from randomised and observational studies. Lancet. 369:1603–1613.
2007. View Article : Google Scholar : PubMed/NCBI
|
|
2
|
Din FV, Theodoratou E, Farrington SM,
Tenesa A, Barnetson RA, Cetnarskyj R, Stark L, Porteous ME,
Campbell H and Dunlop MG: Effect of aspirin and NSAIDs on risk and
survival from colorectal cancer. Gut. 59:1670–1679. 2010.
View Article : Google Scholar : PubMed/NCBI
|
|
3
|
Bastiaannet E, Sampieri K, Dekkers OM, de
Craen AJ, van Herk-Sukel MP, Lemmens V, van den Broek CB, Coebergh
JW, Herings RM, van de Velde CJ, et al: Use of aspirin
postdiagnosis improves survival for colon cancer patients. Br J
Cancer. 106:1564–1570. 2012. View Article : Google Scholar : PubMed/NCBI
|
|
4
|
Chan AT, Ogino S and Fuchs CS: Aspirin use
and survival after diagnosis of colorectal cancer. JAMA.
302:649–658. 2009. View Article : Google Scholar : PubMed/NCBI
|
|
5
|
Lundholm K, Gelin J, Hyltander A, Lönnroth
C, Sandström R, Svaninger G, et al: Anti-inflammatory treatment may
prolong survival in undernourished patients with metastatic solid
tumors. Cancer Res. 54:5602–5606. 1994.PubMed/NCBI
|
|
6
|
Reimers MS, Bastiaannet E, Langley RE, van
Eijk R, van Vlierberghe RL, Lemmens VE, van Herk-Sukel MP, van
Wezel T, Fodde R, Kuppen PJ, et al: Expression of HLA class I
antigen, aspirin use, and survival after a diagnosis of colon
cancer. JAMA Intern Med. 174:732–739. 2014. View Article : Google Scholar : PubMed/NCBI
|
|
7
|
Lönnroth C, Andersson M, Arvidsson A,
Nordgren S, Brevinge H, Lagerstedt K and Lundholm K: Preoperative
treatment with a non-steroidal anti-inflammatory drug (NSAID)
increases tumor tissue infiltration of seemingly activated immune
cells in colorectal cancer. Cancer Immun. 8:52008.
|
|
8
|
Lönnroth C, Andersson M, Nordgren S and
Lundholm K: Downregulation of Prominin 1/CD133 expression in
colorectal cancer by NSAIDs following short-term preoperative
treatment. Int J Oncol. 41:15–23. 2012.PubMed/NCBI
|
|
9
|
Blanco Calvo M, Bolós Fernández V, Medina
Villaamil V, Aparicio Gallego G, Díaz Prado S and Grande Pulido E:
Biology of BMP signalling and cancer. Clin Transl Oncol.
11:126–137. 2009.PubMed/NCBI
|
|
10
|
Mizrak D, Brittan M and Alison M: CD133:
molecule of the moment. J Pathol. 214:3–9. 2008. View Article : Google Scholar : PubMed/NCBI
|
|
11
|
Rizzino A: Sox2 and Oct-3/4: a versatile
pair of master regulators that orchestrate the self-renewal and
pluripotency of embryonic stem cells. Wiley Interdiscip Rev Syst
Biol Med. 1:228–236. 2009. View
Article : Google Scholar : PubMed/NCBI
|
|
12
|
Hu T, Liu S, Breiter DR, Wang F, Tang Y
and Sun S: Octamer 4 small interfering RNA results in cancer stem
cell-like cell apoptosis. Cancer Res. 68:6533–6540. 2008.
View Article : Google Scholar : PubMed/NCBI
|
|
13
|
Friedman JM and Jones PA: MicroRNAs:
critical mediators of differentiation, development and disease.
Swiss Med Wkly. 139:466–472. 2009.PubMed/NCBI
|
|
14
|
Slaby O, Svoboda M, Michalek J and Vyzula
R: MicroRNAs in colorectal cancer: translation of molecular biology
into clinical application. Mol Cancer. 8:1022009. View Article : Google Scholar : PubMed/NCBI
|
|
15
|
Gustafsson A, Hansson E, Kressner U,
Nordgren S, Andersson M, Wang W, Lönnroth C and Lundholm K: EP1–4
subtype, COX and PPAR gamma receptor expression in colorectal
cancer in prediction of disease-specific mortality. Int J Cancer.
121:232–240. 2007.
|
|
16
|
Cahlin C, Lönnroth C, Arvidsson A,
Nordgren S and Lundholm K: Growth associated proteins in tumor
cells and stroma related to disease progression of colon cancer
accounting for tumor tissue PGE2 content. Int J Oncol.
32:909–918. 2008.PubMed/NCBI
|
|
17
|
Chen S, Song X, Chen Z, Li X, Li M, Liu H
and Li J: CD133 expression and the prognosis of colorectal cancer:
a systematic review and meta-analysis. PLoS One. 8:e563802013.
View Article : Google Scholar : PubMed/NCBI
|
|
18
|
He A, Qi W, Huang Y, Feng T, Chen J, Sun
Y, Shen Z and Yao Y: CD133 expression predicts lung metastasis and
poor prognosis in osteosarcoma patients: A clinical and
experimental study. Exp Ther Med. 4:435–441. 2012.PubMed/NCBI
|
|
19
|
Hashimoto K, Aoyagi K, Isobe T, Kouhuji K
and Shirouzu K: Expression of CD133 in the cytoplasm is associated
with cancer progression and poor prognosis in gastric cancer.
Gastric Cancer. 17:97–106. 2014. View Article : Google Scholar : PubMed/NCBI
|
|
20
|
Kemper K, Sprick MR, de Bree M, Scopelliti
A, Vermeulen L, Hoek M, Zeilstra J, Pals ST, Mehmet H, Stassi G and
Medema JP: The AC133 epitope, but not the CD133 protein, is lost
upon cancer stem cell differentiation. Cancer Res. 70:719–729.
2010. View Article : Google Scholar : PubMed/NCBI
|
|
21
|
Mak AB, Blakely KM, Williams RA, Penttilä
PA, Shukalyuk AI, Osman KT, Kasimer D, Ketela T and Moffat J: CD133
protein N-glycosylation processing contributes to cell surface
recognition of the primitive cell marker AC133 epitope. J Biol
Chem. 286:41046–41056. 2011. View Article : Google Scholar : PubMed/NCBI
|
|
22
|
Liu A, Yu X and Liu S: Pluripotency
transcription factors and cancer stem cells: small genes make a big
difference. Chin J Cancer. 32:483–487. 2013.PubMed/NCBI
|
|
23
|
Wang X and Dai J: Concise review: isoforms
of OCT4 contribute to the confusing diversity in stem cell biology.
Stem Cells. 28:885–893. 2010.PubMed/NCBI
|
|
24
|
Atlasi Y, Mowla SJ, Ziaee SA, Gokhale PJ
and Andrews PW: OCT4 spliced variants are differentially expressed
in human pluripotent and nonpluripotent cells. Stem Cells.
26:3068–3074. 2008. View Article : Google Scholar : PubMed/NCBI
|
|
25
|
Gao Y, Wang X, Han J, Xiao Z, Chen B, Su G
and Dai J: The novel OCT4 spliced variant OCT4B1 can generate three
protein isoforms by alternative splicing into OCT4B. J Genet
Genomics. 37:461–465. 2010. View Article : Google Scholar
|
|
26
|
Gazouli M, Roubelakis MG, Theodoropoulos
GE, Papailiou J, Vaiopoulou A, Pappa KI, Nikiteas N and Anagnou NP:
OCT4 spliced variant OCT4B1 is expressed in human colorectal
cancer. Mol Carcinog. 51:165–173. 2012. View Article : Google Scholar : PubMed/NCBI
|
|
27
|
Fang X, Yu W, Li L, Shao J, Zhao N, Chen
Q, Ye Z, Lin SC, Zheng S and Lin B: ChIP-seq and functional
analysis of the SOX2 gene in colorectal cancers. OMICS. 14:369–384.
2010. View Article : Google Scholar
|
|
28
|
Wang Q, He W, Lu C, Wang Z, Wang J,
Giercksky KE, Nesland JM and Suo Z: Oct3/4 and Sox2 are
significantly associated with an unfavorable clinical outcome in
human esophageal squamous cell carcinoma. Anticancer Res.
29:1233–1241. 2009.PubMed/NCBI
|
|
29
|
Otsubo T, Akiyama Y, Yanagihara K and
Yuasa Y: SOX2 is frequently downregulated in gastric cancers and
inhibits cell growth through cell-cycle arrest and apoptosis. Br J
Cancer. 98:824–831. 2008. View Article : Google Scholar : PubMed/NCBI
|
|
30
|
Wong OG, Huo Z, Siu MK, Zhang H, Jiang L,
Wong ES and Cheung AN: Hypermethylation of SOX2 promoter in
endometrial carcinogenesis. Obstet Gynecol Int.
2010:6825042010.PubMed/NCBI
|
|
31
|
Cox JL, Wilder PJ, Desler M and Rizzino A:
Elevating SOX2 levels deleteriously affects the growth of
medulloblastoma and glioblastoma cells. PLoS One. 7:e440872012.
View Article : Google Scholar
|
|
32
|
Niwa H, Miyazaki J and Smith AG:
Quantitative expression of Oct-3/4 defines differentiation,
dedifferentiation or self-renewal of ES cells. Nat Genet.
24:372–376. 2000. View
Article : Google Scholar : PubMed/NCBI
|
|
33
|
Boer B, Kopp J, Mallanna S, Desler M,
Chakravarthy H, Wilder PJ, Bernadt C and Rizzino A: Elevating the
levels of Sox2 in embryonal carcinoma cells and embryonic stem
cells inhibits the expression of Sox2:Oct-3/4 target genes. Nucleic
Acids Res. 35:1773–1786. 2007. View Article : Google Scholar : PubMed/NCBI
|
|
34
|
Saunders A, Faiola F and Wang J: Concise
review: pursuing self-renewal and pluripotency with the stem cell
factor Nanog. Stem Cells. 31:1227–1236. 2013. View Article : Google Scholar : PubMed/NCBI
|
|
35
|
Qiu W, Wang X, Leibowitz B, Liu H, Barker
N, Okada H, Oue N, Yasui W, Clevers H, Schoen RE, et al:
Chemoprevention by nonsteroidal anti-inflammatory drugs eliminates
oncogenic intestinal stem cells via SMAC-dependent apoptosis. Proc
Natl Acad Sci USA. 107:20027–20032. 2010. View Article : Google Scholar : PubMed/NCBI
|
|
36
|
Motoyama K, Tanaka F, Kosaka Y, Mimori K,
Uetake H, Inoue H, Sugihara K and Mori M: Clinical significance of
BMP7 in human colorectal cancer. Ann Surg Oncol. 15:1530–1537.
2008. View Article : Google Scholar : PubMed/NCBI
|
|
37
|
Chen J, Ye L, Xie F, Yang Y, Zhang L and
Jiang WG: Expression of bone morphogenetic protein 7 in lung cancer
and its biological impact on lung cancer cells. Anticancer Res.
30:1113–1120. 2010.PubMed/NCBI
|
|
38
|
Li W, Cai HX, Ge XM, Li K, Xu WD and Shi
WH: Prognostic significance of BMP7 as an oncogene in
hepatocellular carcinoma. Tumour Biol. 34:669–674. 2013. View Article : Google Scholar : PubMed/NCBI
|
|
39
|
Megumi K, Ishigami S, Uchikado Y, Kita Y,
Okumura H, Matsumoto M, Uenosono Y, Arigami T, Kijima Y, Kitazono
M, et al: Clinicopathological significance of BMP7 expression in
esophageal squamous cell carcinoma. Ann Surg Onco. 19:2066–2071.
2012. View Article : Google Scholar : PubMed/NCBI
|
|
40
|
Yamashita S, Tsujino Y, Moriguchi K,
Tatematsu M and Ushijima T: Chemical genomic screening for
methylation-silenced genes in gastric cancer cell lines using
5-aza-2′-deoxycytidine treatment and oligonucleotide microarray.
Cancer Sci. 97:64–71. 2006.PubMed/NCBI
|
|
41
|
Della Vittoria Scarpati G, Falcetta F,
Carlomagno C, Ubezio P, Marchini S, De Stefano A, Singh VK,
D’Incalci M, De Placido S and Pepe S: A specific miRNA signature
correlates with complete pathological response to neoadjuvant
chemoradiotherapy in locally advanced rectal cancer. Int J Radiat
Oncol Biol Phys. 83:1113–1119. 2012.
|
|
42
|
Farhana L, Dawson MI, Murshed F, Das JK,
Rishi AK and Fontana JA: Upregulation of miR-150* and
miR-630 induces apoptosis in pancreatic cancer cells by targeting
IGF-1R. PLoS One. 8:e610152013.PubMed/NCBI
|
|
43
|
Corcoran C, Rani S, Breslin S, Gogarty M,
Ghobrial IM, Crown J and O’Driscoll L: miR-630 targets IGF1R to
regulate response to HER-targeting drugs and overall cancer cell
progression in HER2 over-expressing breast cancer. Mol Cancer.
13:712014. View Article : Google Scholar : PubMed/NCBI
|
|
44
|
John B, Enright AJ, Aravin A, Tuschl T,
Sander C and Marks DS: Human MicroRNA targets. PLoS Biol.
2:e3632004. View Article : Google Scholar
|
|
45
|
Kanaan Z, Rai SN, Eichenberger MR, Roberts
H, Keskey B, Pan J and Galandiuk S: Plasma miR-21: a potential
diagnostic marker of colorectal cancer. Ann Surg. 256:544–551.
2012. View Article : Google Scholar : PubMed/NCBI
|
|
46
|
Caruso S1, Bazan V, Rolfo C, Insalaco L,
Fanale D, Bronte G, Corsini LR, Rizzo S, Cicero G and Russo A:
MicroRNAs in colorectal cancer stem cells: new regulators of cancer
stemness? Oncogenesis. 1:e322012. View Article : Google Scholar : PubMed/NCBI
|
|
47
|
Chen WS, Leung CM, Pan HW, Hu LY, Li SC,
Ho MR and Tsai KW: Silencing of miR-1–1 and miR-133a-2 cluster
expression by DNA hypermethylation in colorectal cancer. Oncol Rep.
28:1069–1076. 2012.
|
|
48
|
Nasser MW, Datta J, Nuovo G, Kutay H,
Motiwala T, Majumder S, Wang B, Suster S, Jacob ST and Ghoshal K:
Down-regulation of micro-RNA-1 (miR-1) in lung cancer. Suppression
of tumorigenic property of lung cancer cells and their
sensitization to doxorubicin-induced apoptosis by miR-1. J Biol
Chem. 283:33394–33405. 2008. View Article : Google Scholar : PubMed/NCBI
|
|
49
|
Hudson RS, Yi M, Esposito D, Watkins SK,
Hurwitz AA, Yfantis HG, Lee DH, Borin JF, Naslund MJ, Alexander RB,
et al: MicroRNA-1 is a candidate tumor suppressor and prognostic
marker in human prostate cancer. Nucleic Acids Res. 40:3689–3703.
2012. View Article : Google Scholar : PubMed/NCBI
|
|
50
|
Yamasaki T, Yoshino H, Enokida H, Hidaka
H, Chiyomaru T, Nohata N, Kinoshita T, Fuse M, Seki N and Nakagawa
M: Novel molecular targets regulated by tumor suppressors
microRNA-1 and microRNA-133a in bladder cancer. Int J Oncol.
40:1821–1830. 2012.PubMed/NCBI
|
|
51
|
Nohata N, Hanazawa T, Enokida H and Seki
N: microRNA-1/133a and microRNA-206/133b clusters: dysregulation
and functional roles in human cancers. Oncotarget. 3:9–21.
2012.PubMed/NCBI
|
|
52
|
Chen WC, Lin MS, Ye YL, Gao HJ, Song ZY
and Shen XY: microRNA expression pattern and its alteration
following celecoxib intervention in human colorectal cancer. Exp
Ther Med. 3:1039–1048. 2012.PubMed/NCBI
|
|
53
|
Horton R, Wilming L, Rand V, Lovering RC,
Bruford EA, Khodiyar VK, Lush MJ, Povey S, Talbot CC Jr, Wright MW,
et al: Gene map of the extended human MHC. Nat Rev Genet.
5:889–899. 2004. View Article : Google Scholar : PubMed/NCBI
|
|
54
|
Mak AB, Nixon AM, Kittanakom S, Stewart
JM, Chen GI, Curak J, Gingras AC, Mazitschek R, Neel BG, Stagljar I
and Moffat J: Regulation of CD133 by HDAC6 promotes β-catenin
signaling to suppress cancer cell differentiation. Cell Rep.
2:951–963. 2012.PubMed/NCBI
|
|
55
|
Brandão RD, Veeck J, Van de Vijver KK,
Lindsey P, de Vries B, van Elssen CH, Blok MJ, Keymeulen K, Ayoubi
T, Smeets HJ, et al: A randomised controlled phase II trial of
pre-operative celecoxib treatment reveals anti-tumour
transcriptional response in primary breast cancer. Breast Cancer
Res. 15:R292013.
|
|
56
|
Zhou Y, Cho KJ, Plowman SJ and Hancock JF:
Nonsteroidal anti-inflammatory drugs alter the spatiotemporal
organization of Ras proteins on the plasma membrane. J Biol Chem.
287:16586–16595. 2012. View Article : Google Scholar : PubMed/NCBI
|
|
57
|
Kim MS, Lee EJ, Kim HR and Moon A: p38
kinase is a key signaling molecule for H-Ras-induced cell motility
and invasive phenotype in human breast epithelial cells. Cancer
Res. 63:5454–5461. 2003.PubMed/NCBI
|
|
58
|
Fang JY and Richardson BC: The MAPK
signalling pathways and colorectal cancer. Lancet Oncol. 6:322–327.
2005. View Article : Google Scholar : PubMed/NCBI
|
|
59
|
Alesutan I, Sopjani M, Dërmaku-Sopjani M,
Munoz C, Voelkl J and Lang F: Upregulation of Na-coupled glucose
transporter SGLT1 by Tau tubulin kinase 2. Cell Physiol Biochem.
30:458–465. 2012. View Article : Google Scholar : PubMed/NCBI
|
|
60
|
Sarkar R, Hunter IA, Rajaganeshan R, Perry
SL, Guillou P and Jayne DG: Expression of cyclin D2 is an
independent predictor of the development of hepatic metastasis in
colorectal cancer. Colorectal Dis. 12:316–323. 2010. View Article : Google Scholar : PubMed/NCBI
|
|
61
|
Van Erk MJ, Teuling E, Staal YC, Huybers
S, Van Bladeren PJ, Aarts JM and Van Ommen B: Time- and
dose-dependent effects of curcumin on gene expression in human
colon cancer cells. J Carcinog. 3:82004.PubMed/NCBI
|
|
62
|
Sato T, Oshima T, Yoshihara K, Yamamoto N,
Yamada R, Nagano Y, Fujii S, Kunisaki C, Shiozawa M, Akaike M, et
al: Overexpression of the fibroblast growth factor receptor-1 gene
correlates with liver metastasis in colorectal cancer. Oncol Rep.
21:211–216. 2009.
|
|
63
|
Lee JH, Kang MJ, Han HY, Lee MG, Jeong SI,
Ryu BK, Ha TK, Her NG, Han J, Park SJ, et al: Epigenetic alteration
of PRKCDBP in colorectal cancers and its implication in tumor cell
resistance to TNFα-induced apoptosis. Clin Cancer Res.
17:7551–7562. 2011.PubMed/NCBI
|
|
64
|
Kim E, Chen F, Wang CC and Harrison LE:
CDK5 is a novel regulatory protein in PPARgamma ligand-induced
antiproliferation. Int J Oncol. 28:191–194. 2006.PubMed/NCBI
|
|
65
|
Eggers JP, Grandgenett PM, Collisson EC,
Lewallen ME, Tremayne J, Singh PK, Swanson BJ, Andersen JM, Caffrey
TC, High RR, et al: Cyclin-dependent kinase 5 is amplified and
over-expressed in pancreatic cancer and activated by mutant K-Ras.
Clin Cancer Res. 17:6140–6150. 2011. View Article : Google Scholar : PubMed/NCBI
|
|
66
|
Blumenthal RD, Leon E, Hansen HJ and
Goldenberg DM: Expression patterns of CEACAM5 and CEACAM6 in
primary and metastatic cancers. BMC Cancer. 7:22007. View Article : Google Scholar : PubMed/NCBI
|
|
67
|
Jantscheff P, Terracciano L, Lowy A,
Glatz-Krieger K, Grunert F, Micheel B, Brümmer J, Laffer U, Metzger
U, Herrmann R and Rochlitz C: Expression of CEACAM6 in resectable
colorectal cancer: a factor of independent prognostic significance.
J Clin Oncol. 21:3638–3646. 2003. View Article : Google Scholar : PubMed/NCBI
|
|
68
|
Beauchemin N and Arabzadeh A:
Carcinoembryonic antigen-related cell adhesion molecules (CEACAMs)
in cancer progression and metastasis. Cancer Metastasis Rev.
32:643–671. 2013. View Article : Google Scholar : PubMed/NCBI
|
|
69
|
Hirakawa M, Takimoto R, Tamura F, Yoshida
M, Ono M, Murase K, Sato Y, Osuga T, Sato T, Iyama S, et al:
Fucosylated TGF-β receptors transduces a signal for
epithelial-mesenchymal transition in colorectal cancer cells. Br J
Cancer. 110:156–163. 2014.
|
|
70
|
Zhou F, Mu YD, Liang J, Liu ZX, Chen HS
and Zhang JF: Expression and prognostic value of tumor stem cell
markers ALDH1 and CD133 in colorectal carcinoma. Oncol Lett.
7:507–512. 2014.PubMed/NCBI
|
|
71
|
Aoi J, Endo M, Kadomatsu T, Miyata K,
Ogata A, Horiguchi H, Odagiri H, Masuda T, Fukushima S, Jinnin M,
et al: Angiopoietin-like protein 2 accelerates carcinogenesis by
activating chronic inflammation and oxidative stress. Mol Cancer
Res. 12:239–249. 2014. View Article : Google Scholar
|
|
72
|
Fanali C, Lucchetti D, Farina M, Corbi M,
Cufino V, Cittadini A and Sgambato A: Cancer stem cells in
colorectal cancer from pathogenesis to therapy: controversies and
perspectives. World J Gastroenterol. 20:923–942. 2014. View Article : Google Scholar : PubMed/NCBI
|
|
73
|
Zhao J: Coordination of DNA synthesis and
histone gene expression during normal cell cycle progression and
after DNA damage. Cell Cycle. 3:695–697. 2004. View Article : Google Scholar : PubMed/NCBI
|
|
74
|
Zhang Y, Chen FQ, Sun YH, Zhou SY, Li TY
and Chen R: Effects of DNMT1 silencing on malignant phenotype and
methylated gene expression in cervical cancer cells. J Exp Clin
Cancer Res. 30:982011. View Article : Google Scholar : PubMed/NCBI
|
|
75
|
Szyf M: The role of DNA methyltransferase
1 in growth control. Front Biosci. 6:D599–D609. 2001. View Article : Google Scholar : PubMed/NCBI
|
|
76
|
Robert MF, Morin S, Beaulieu N, Gauthier
F, Chute IC, Barsalou A and MacLeod AR: DNMT1 is required to
maintain CpG methylation and aberrant gene silencing in human
cancer cells. Nat Genet. 33:61–65. 2003. View Article : Google Scholar : PubMed/NCBI
|
|
77
|
Peng DF, Kanai Y, Sawada M, Ushijima S,
Hiraoka N, Kitazawa S and Hirohashi S: DNA methylation of multiple
tumor-related genes in association with overexpression of DNA
methyltransferase 1 (DNMT1) during multistage carcinogenesis of the
pancreas. Carcinogenesis. 27:1160–1168. 2006. View Article : Google Scholar : PubMed/NCBI
|
|
78
|
Suzuki M, Sunaga N, Shames DS, Toyooka S,
Gazdar AF and Minna JD: RNA interference-mediated knockdown of DNA
methyltransferase 1 leads to promoter demethylation and gene
re-expression in human lung and breast cancer cells. Cancer Res.
64:3137–3143. 2004. View Article : Google Scholar : PubMed/NCBI
|
|
79
|
Mitomi H, Fukui N, Tanaka N, Kanazawa H,
Saito T, Matsuoka T and Yao T: Aberrant p16INK4a
methylation is a frequent event in colorectal cancers: prognostic
value and relation to mRNA expression and immunoreactivity. J
Cancer Res Clin Oncol. 136:323–331. 2010.
|
|
80
|
Licciardi PV and Karagiannis TC:
Regulation of immune responses by histone deacetylase inhibitors.
ISRN Hematol. 2012:6909012012. View Article : Google Scholar : PubMed/NCBI
|
|
81
|
Ho AS, Turcan S and Chan TA: Epigenetic
therapy: use of agents targeting deacetylation and methylation in
cancer management. Onco Targets Ther. 6:223–232. 2013.PubMed/NCBI
|
|
82
|
Lee YS, Lim KH, Guo X, Kawaguchi Y, Gao Y,
Barrientos T, Ordentlich P, Wang XF, Counter CM and Yao TP: The
cytoplasmic deacetylase HDAC6 is required for efficient oncogenic
tumorigenesis. Cancer Res. 68:7561–7569. 2008. View Article : Google Scholar : PubMed/NCBI
|
|
83
|
Fatima N, Yi M, Ajaz S, Stephens RM,
Stauffer S, Greenwald P, Munroe DJ and Ali IU: Altered gene
expression profiles define pathways in colorectal cancer cell lines
affected by celecoxib. Cancer Epidemiol Biomarkers Prev.
17:3051–3061. 2008. View Article : Google Scholar : PubMed/NCBI
|
|
84
|
van Erk MJ, Roepman P, van der Lende TR,
Stierum RH, Aarts JM, van Bladeren PJ and van Ommen B: Integrated
assessment by multiple gene expression analysis of quercetin
bioactivity on anticancer-related mechanisms in colon cancer cells
in vitro. Eur J Nutr. 44:143–156. 2005.PubMed/NCBI
|
|
85
|
Li J and Mansmann UR: Modeling of
non-steroidal anti-inflammatory drug effect within signaling
pathways and mirna-regulation pathways. PLoS One. 8:e724772013.
View Article : Google Scholar : PubMed/NCBI
|
|
86
|
Jeck WR, Siebold AP and Sharpless NE:
Review: a meta-analysis of GWAS and age-associated diseases. Aging
Cell. 11:727–731. 2012. View Article : Google Scholar : PubMed/NCBI
|
|
87
|
Langan RC, Mullinax JE, Raiji MT, Upham T,
Summers T, Stojadinovic A and Avital I: Colorectal cancer
biomarkers and the potential role of cancer stem cells. J Cancer.
4:241–250. 2013. View Article : Google Scholar : PubMed/NCBI
|
|
88
|
Tabarestani S and Ghafouri-Fard S: Cancer
stem cells and response to therapy. Asian Pac J Cancer Prev.
13:5951–5958. 2012. View Article : Google Scholar : PubMed/NCBI
|
|
89
|
Park JH, McMillan DC, Horgan PG and
Roxburgh CS: The impact of anti-inflammatory agents on the outcome
of patients with colorectal cancer. Cancer Treat Rev. 40:68–77.
2014. View Article : Google Scholar : PubMed/NCBI
|