Introduction
Transforming growth factor β (TGF-β) comprises 3
specific isoforms (-β1, -β2 and -β3) that are part of the TGF-β
super family. These cytokines regulate diverse biological functions
including cell proliferation, differentiation, motility, survival
and apoptosis (1). The role of
TGF-β in tumor biology is complex because it can act as both a
tumor suppressor and a tumor promoter (2,3).
TGF-β functions as a tumor suppressor by inhibiting cell growth in
normal tissues, particularly in epithelial and lymphoid tissues
(3). However, in the tumor cells
it acts as an autocrine growth factor, creating an angiogenic,
local immunosuppressive environment that enhances tumor growth and
aggravates the invasive and metastatic tumor-cell behavior
(4). The dual and opposing
functions of TGF-β, including its ability to activate signaling
molecules (5) other than the
canonical SMAD pathway (6), has
been implicated in the growth of a variety of human tumors, such as
prostate, colon, breast, gastric, liver, renal and melanoma
(7). Elevated plasma TGF-β1
concentration, the most prevalent TGF-β isoform in the systemic
circulation in patients with invasive metastatic disease, are
correlated with adverse outcomes (8–22).
Three approaches to inhibit the TGF-β pathway have
been investigated, including the use of antisense oligonucleotides
(ASOs), neutralizing monoclonal antibodies (mAb) against
ligand-receptor interactions, and inhibitors of TGF-β receptor I
kinases against the receptor-mediated signaling cascade. Though
ASOs are highly specific inhibitors of TGF-β (23), they are limited by their organ and
tissue penetration (24). The
small-molecule kinase inhibitors (25,26),
despite their advantages of high pathway selectivity and oral
administration, are liable to cause toxicity and the cause of this
toxicity is under investigation (27). The mAbs, designed specifically to
block active TGF-β ligands and prevent their interaction with the
type II receptor (28), are
expected to inhibit tumor progression in patients with metastatic
cancer (28). This concept has
been tested in animal models using neutralization of TGF-β with
mAbs (29,30). For example, the systemic and
transgenic administration of the soluble TGF-β RII/Fc dimer that
binds all 3 TGF-β isoforms, reduced the tumor burden as well as
intravasation and metastasis in tumor animal models and in
transgenic breast cancer mammary tumor virus (MMTV)-neu mice
models, respectively (29).
TβM1 is a humanized mAb highly selective for
neutralizing only active TGF-β1. Studies on the 4T1 Balb/c mice
model demonstrated antitumor activity for both TGF-β1-specific
mouse surrogate mAb and -neutralizing mAb 1D11 that neutralizes all
3 isoforms. The primary objective of this phase I clinical trial
was to assess the safety and tolerability of TβM1 administered as
monthly intravenous monotherapy in patients with metastatic cancer.
The tested dose range of TβM1 was chosen to provide systemic TβM1
exposure predicted to have antitumor effects based on murine
surrogate mAb data efficacy in a mouse model in vivo.
Secondary objectives were to assess TβM1 systemic exposure and
explore pharmacodynamic (PD) markers in whole blood by measuring
global and specific changes in the expression of genes known to be
associated with TGF-β pathway activation (29,31).
Materials and methods
Antibody
TβM1 is an IgG4 mAb with a preferential binding
affinity to active TGF-β1. The in vitro ligand binding
properties of TβM1 were determined using surface plasma resonance
(SPR) to assess the binding specificity of the antibody to the 3
TGF-β ligands. TβM1 showed no binding to TGF-β2 and greater than
700-fold selectivity for TGF-β1 over TGF-β3.
Dose selection
One rat PK/PD study was performed in 13762 (mammary
carcinoma) syngeneic model with TβM1 at different dose levels. This
was used to establish the EC50 value based on the SMAD2
phosphorylation in tumors. The choice of the doses was decided
after a review of the preclinical package (rat PK/PD data with TβM1
and mouse efficacy data with the surrogate antibody), and animal
toxicology data. The intravenous dose range of 20 to 240 mg was
expected to be safe. Because TβM1 binds to active TGF-β1 at low
concentrations, it was projected that doses of 120 and 240 mg would
provide sufficient TGF-β1 blockade in cancer patients as assessed
by systemic PD effects. Hence, the PD effects were expected to
translate to clinical signals, such as tumor responses. This more
focused approach for TGF-β inhibition may provide safety advantages
over the non-selective-TGF-β mAb fresolimumab (32,33)
which has produced antitumor responses in patients with melanoma
and renal cell carcinoma (RCC) at similar doses.
Study design
This was a phase I, multicenter open-label,
uncontrolled, non-randomized, dose-escalation study of
intravenously (IV) administered TβM1 in patients with metastatic
cancer for whom no treatment of higher priority existed. At least 3
patients were enrolled in 1 of 4 cohorts receiving TβM1 flat doses
of 20, 60, 120 and 240 mg, respectively, on day 1 of each 28-day
cycle. Dose escalation to the next cohort proceeded only after 3
patients completed 1 treatment cycle without a dose-limiting
toxicity (DLT) and after careful assessment of serum drug
concentration and safety information. Hematologic or
non-hematologic toxicity with a grade ≥3 was considered as a DLT in
patients treated with the study medication at different dose levels
according to the National Cancer Institute (NCI) and the Common
Terminology Criteria for Adverse Events (CTCAE), version 3.0.
Patients
Adult patients who provided written informed consent
and had a histologic or cytologic diagnosis of cancer for which no
proven effective therapy existed were included in the study.
Eligible patients were required to have disease that was measurable
or nonmeasurable as defined by the Response Evaluation Criteria in
Solid Tumors (RECIST) and to have a performance status of ≤2 on the
Eastern Cooperative Oncology Group (ECOG) scale. Patients were
required to have adequate hematologic, hepatic, and renal functions
and to have discontinued all previous therapies for cancer at least
4 weeks prior to study enrolment.
Exclusion criteria included medically uncontrolled
cardiovascular illness, electrocardiogram anomalies, history of
gastrointestinal (GI) bleeding, significant hemoptysis, hematuria
within 3 months prior to study entry, serious pre-existing medical
conditions (at the discretion of the investigator), unhealed
wounds, history of autoimmune disease, symptomatic central nervous
system (CNS) primary or metastatic malignancy, CNS active
infection, human immunodeficiency virus (HIV), hepatitis, or
immunosuppressive disease or hematological malignancies.
Treatment
Lyophilized TβM1 at all doses (20, 60, 120 and 240
mg) was reconstituted in saline and administered as a 10-ml IV
infusion via infusion pump at 10 ml per 10 min on day 1 of each
28-day cycle. Patients were monitored for any signs or symptoms of
allergic reactions for at least 1 h after the administration of the
study drug. No dose adjustments or reductions were allowed.
Safety analysis
Safety was evaluated in patients who received at
least one dose of TβM1. Safety assessment was based on the
summaries of adverse events including severity (as defined by CTCAE
version 3.0) and possible relationship to the study drug, DLTs and
laboratory changes at each dose level. Safety was also analyzed by
bone pain (level of pain and location) assessment, oral examination
of the gingiva (to detect hyperplasia), skin assessment, evaluation
of ECOG performance status, electrocardiogram (ECG), and
echocardiography/Doppler. Clinically significant abnormal results
were recorded as adverse events. Standard laboratory tests
including chemistry, hematology and urinalysis panels were also
performed. All concomitant medications were documented throughout
the patient’s participation in the study.
Efficacy analysis
Data on any clinical benefit and tumor response were
tabulated. No formal efficacy analysis was performed.
Bioanalytical methods
A validated enzyme-linked immunosorbent assay
(ELISA) method (ALTA Analytical Laboratory, San Diego, CA, USA) was
used to analyze the human serum samples for TβM1. The lower and
upper limits of quantification were 7.5 and 90.0 ng/ml,
respectively. In order to yield results within the calibrated
range, samples above the limit of quantification were diluted and
reanalyzed. During validation, the inter-assay accuracy (% relative
error) ranged from −13.5% to 2.0% while the inter-assay precision
(% relative standard deviation) ranged from 12.5 to 13.4%. TβM1 was
stable for up to 365 days when stored at approximately −70°C.
Pharmacokinetic (PK) methods
All patients who received at least one dose of TβM1
and had serum samples collected were subject to pharmacokinetic
analyses. The PK parameters, area under the concentration-time
curve (AUC) and half-life for TβM1 were computed by standard
noncompartmental methods of analysis using Win Nonlin Professional
Edition (version 5.3) on a computer that met or exceeded the
minimum system requirements for this program with appropriate and
validated software. The extent of dose proportionality was assessed
using estimated AUC. AUC estimates were log-transformed prior to
analysis and ratios of dose-normalized geometric means and the
corresponding 90% confidence intervals were provided.
Pharmacodynamic methods
Pharmacodynamic assessments included quantitative
reverse transcriptase-polymerase chain reaction (RT-PCR) assays,
multianalyte immunoassay panels (MAIP) [Rules-based Medicine
(Myriad RBM), Austin, TX, USA], and gene expression microarrays
(Affymetrix®, Santa Clara, CA, USA). Blood for serum
collection was collected prior to initiation of treatment and at
various times for up to 12 days following treatment. Normal blood
collected from five healthy volunteers was used for bioanalytical
comparison of microarray profiles between patients with disease and
healthy subjects. This collection of normal blood samples was not
part of the current study and was part of a previous publication
(34). Additionally,
CD4+CD25+ T-cell counts and total T cells for
the lymphocyte population were monitored to evaluate immune
function by standard flow cytometry. All patients undergoing PD
assessments who yielded data from RT-PCR, MAIP and gene expression
microarrays were included in the analyses.
RT-PCR assay of gene expression
Measurements observed with repeated qRT-PCR
normalized to glyceraldehyde-3-phosphate dehydrogenase,
housekeeping gene, were recorded for SMAD7, TMEPAI, OCIAD2 and CA1
and analyzed using a linear mixed model since the normality
assumption was appropriate. Dose, nominal time point, and
dose-by-time-point interaction were included as fixed effects,
baseline (predose) value as covariate, and subject as random effect
in the model, which allowed the formal pre-post dosing comparison
of the gene expression. Similarly, observed percentage changes from
baseline (predose) of postdose qRT-PCR measurements were analyzed
with dose, nominal time point, and dose-by-time-point interaction
as fixed effects, screening value as covariate, and subject as
random effect, and derived model percentage changes plotted against
time. The assumed covariance structure for both models was compound
symmetry, which was deemed more appropriate for the data, while the
degrees of freedom for the tests of fixed effects were calculated
using the Kenward and Roger method.
Multianalyte immunoassay panel
(MAIP)
The MAIP repeated measurements data from 89 analytes
were plotted over time by dose groups to which logarithmic
transformation was applied, as appropriate to the data.
Affymetrix analysis
Gene-expression profiling using Affymetrix U133
microarray data was analyzed. Previously, evaluation of the effects
of TGF-β1 with cell-lines and isolated normal peripheral blood
mononuclear cells (PBMCs) revealed that the difference between
TGF-β1 stimulated and unstimulated conditions was best captured by
8 genes from the array: SMAD7, CRYBB1, ATF3, TFDP2, CA1, OCIAD2,
TMEPAI, and TMCC2, GAPDH was used as a normalizer. A linear mixed
model with random patient effect was used to analyze the change
from pre-TβM1 treatment baseline in the repeated expression
measures (log scale). Nominal time point and ex vivo-based
prediction of TGF-β1 stimulated versus TGF-β1 unstimulated at
baseline were treated as fixed effects. The model LS means and
p-values at nominal time points were reported. Additionally, we
evaluated an extended set of 37 genes previously shown to be
associated with TGF-β1 pathway activation in the ex vivo
PBMC stimulation and expression measurement assay (35). Signal values for the probe sets
corresponding to the 37 genes were normalized and represented as an
expression index according to Zhaou and Rocke (36).
Results
Patient disposition
A total of 18 patients entered the study and
received at least 1 dose of TβM1. The majority of patients were
treated for 2 cycles (n=14). Among the reasons for discontinuation,
the most common reason was progressive disease (n=16). One patient
died from his bladder cancer during the study and 1 patient
discontinued per own decision.
The second dose cohort (60 mg) was expanded to a
total of 8 patients due to a grade 3 diarrhea DLT in one of the
initial 3 participants. Following confirmation that there were no
additional DLTs and assessment of the systemic exposure and safety
information, the study continued with escalation up to the
predefined 240-mg dose.
Patient demographics, disease
characteristics and disposition
The patient baseline demographics by TβM1 dose are
described in Table I. The mean age
of the patient population was 62 years. Female patients comprised
50% (n=9) of the study population. A majority of study population
was Caucasian (n=17, 94%). In general, the baseline demographics
were similar between the dose groups.
 | Table IPatient demographics and disease
characteristics of all enrolled and treated patients by dose. |
Table I
Patient demographics and disease
characteristics of all enrolled and treated patients by dose.
| Part A |
|---|
|
|
|---|
| Parameter | 20 mg, N=3 | 60 mg, N=8 | 120 mg, N=3 | 240 mg, N=4 | Total, N=18 |
|---|
| Age, years |
| Mean (SD) | 73 (7.6) | 61 (20.7) | 61 (12.1) | 57 (15.5) | 62 (16.5) |
| Median (range) | 75 (65, 80) | 71 (23, 81) | 65 (47, 70) | 53 (43, 79) | 68 (23, 81) |
| Gender, n (%) |
| Female | 2 (67) | 4 (50) | 1 (33) | 2 (50) | 9 (50) |
| Male | 1 (33) | 4 (50) | 2 (67) | 2 (50) | 9 (50) |
| Race, n (%) |
| Caucasian | 3 (100) | 8 (100) | 2 (67) | 4 (100) | 17 (94) |
| African
American | 0 (0) | 0 (0) | 1 (33) | 0 (0) | 1 (6) |
| ECOG PS, n (%) |
| 0 | 0 (0) | 1 (13) | 1 (33) | 1 (25) | 3 (17) |
| 1 | 3 (100) | 7 (88) | 2 (67) | 3 (75) | 15 (83) |
| Basis of initial
pathological diagnosis, n (%) |
|
Histopathological | 3 (100) | 7 (88) | 3 (100) | 4 (100) | 17 (94) |
| Cytological | 0 (0) | 1 (13) | 0 (0) | 0 (0) | 1 (6) |
| Initial
pathological diagnosis, n (%) |
| Adenocarcinoma,
colon | 2 (67) | 2 (25) | 2 (67) | 0 (0) | 6 (33) |
| Adenocarcinoma,
rectum | 0 (0) | 1 (13) | 1 (33) | 1 (25) | 3 (17) |
| Sarcoma, NOS | 1 (33) | 1 (13) | 0 (0) | 0 (0) | 2 (11) |
| Othera | 0 (0) | 4 (50) | 0 (0) | 3 (75) | 7 (39) |
All 18 patients who entered the study had an ECOG
performance status ≤2, with the majority of patients (n=15, 83%)
having a score of 1 (Table I). Six
patients (33%) had an initial pathological diagnosis of
adenocarcinoma of colon, 3 (17%) had adenocarcinoma of rectum, and
2 (11%) had not-otherwise-specified sarcoma. The 7 remaining
patients (39%) each had unique cancer diagnoses.
Safety measures
Table II describes
the AEs, TEAEs, CTCAE grade toxicity, SAEs and discontinuations.
One patient with bladder cancer died during the study due to
progressive disease and 8 reported at least 1 SAE. Two of the 8
patients (11%) with an SAE had, in the investigator’s opinion, an
SAE possibly related to the study drug. None of the patients
discontinued due to adverse events. Nine patients (50%) had at
least one TEAE that in the opinion of the investigators was
treatment related. Regardless of CTC grade, fatigue, nausea and
diarrhea were the most frequently reported possibly drug-related
TEAEs. Each of these events occurred in 3 patients, which
corresponds to 17% of the treated patients.
| Table IISummary of adverse events in all
enrolled and treated patients by dose. |
Table II
Summary of adverse events in all
enrolled and treated patients by dose.
| 20 mg,
N=3
n (%) | 60 mg,
N=8
n (%) | 120 mg,
N=3
n (%) | 240 mg,
N=4
n (%) | Total,
N=18
n (%) |
|---|
| Patients with ≥1
AE | 3 (100) | 8 (100) | 3 (100) | 4 (100) | 18 (100) |
| Possibly related to
study drug | 2 (67) | 4 (50) | 1 (33) | 2 (50) | 9 (50) |
| Patients with ≥1
TEAE | 3 (100) | 8 (100) | 3 (100) | 4 (100) | 18 (100) |
| Possibly related to
study drug | 2 (67) | 4 (50) | 1 (33) | 2 (50) | 9 (50) |
| Patients with ≥1
Grade 3/4 CTCAE | 1 (33) | 8 (100) | 0 (0) | 4 (100) | 13 (72) |
| Possibly related to
study drug | 0 (0) | 1 (13) | 0 (0) | 1 (25) | 2 (11) |
| Patients with ≥1
SAE | 0 (0) | 6 (75) | 0 (0) | 2 (50) | 8 (44) |
| Possibly related to
study drug | 0 (0) | 1 (13) | 0 (0) | 1 (25) | 2 (11) |
| Patients who
discontinued due to AE | 0 (0) | 0 (0) | 0 (0) | 0 (0) | 0 (0) |
| Patients who
discontinued due to SAE | 0 (0) | 0 (0) | 0 (0) | 0 (0) | 0 (0) |
Thirteen patients (72%) reported at least 1 grade
3/4 CTCAE toxicity (Table II).
The majority of possibly drug-related TEAEs were assessed as grade
1 or 2. Two grade 3 toxicities related to the study drug were
reported including diarrhea (n=1 at 60 mg in cycle 1) and
generalized muscle weakness (n=1 at 240 mg in cycle 1). No grade 4
toxicities related to the study drug were reported. The grade 3
diarrhea was both an SAE and a DLT that ultimately led to the
expansion of the 60-mg group (cohort 2). The event resolved and the
patient remained on the study until later discontinuation due to
progressive disease. The grade 3 muscle weakness was also an SAE
and the event had not resolved when the patient discontinued from
the study due to patient decision and was placed in hospice care.
In addition, 1 patient at the 240-mg dose level (cohort 4) had a
treatment-emergent grade 2 CTCAE laboratory abnormality (low
hemoglobin) that was considered, in the opinion of investigator, as
a possibly study-drug-related.
There were no changes reported in vital signs with
regard to temperature, heart rate, or blood pressure after
administration of TβM1 in any of the patients on therapy and by
dose. No clinically relevant changes in ECGs were observed.
Other safety measures determined were: skin
assessments, oral examinations and bone-pain assessments. One
drug-related dry mouth was reported and 1 related TEAE was reported
for each including intermittent lip peeling, facial ulceration and
rash. All events resolved during the study.
Pharmacokinetic measures
The systemic exposure after IV administration of
TβM1 is presented in Table III
across 20 to 240 mg dose ranges (cohorts 1 to 4). The terminal
half-life (t1/2) remained relatively constant (at
approximately 9 days) and ranged from approximately 5.67 to 15.38
days. Following a 10-min infusion, TβM1 AUC increased with dose.
Table IV presents the results of
the statistical analysis of dose proportionality for AUC from zero
extrapolated to infinity (AUC0-∞ in cycle 1) using the
power model for TβM1.
| Table IIIPharmacokinetics parameters per dose
group and per cycle reported as median (range) or geomean and CV%
when n >3. |
Table III
Pharmacokinetics parameters per dose
group and per cycle reported as median (range) or geomean and CV%
when n >3.
| 20 mg | 60 mg | 120 mg | 240 mg |
|---|
|
|
|
|
|
|---|
| Parameter | Cycle 1
N=3 | Cycle 2
N=3 | Cycle 1
N=8 | Cycle 2
N=4 | Cycle 3
N=1 | Cycle 1
N=3 | Cycle 2
N=3 | Cycle 3
N=1 | Cycle 4
N=1 | Cycle 1
N=4 | Cycle 2
N=2 |
|---|
| T1/2,
(day) | 10.50
(6.30–14.00) | 11.50
(7.63–13.40) | 7.63 (40.51) | 8.21 (18.02) | 10.04 | 8.46 (50.64) | 8.88 (22.30) | 11.90 | 15.38 | 7.33 (8.23) | 5.67
(4.83–6.54) |
| AUC0-∞
(μg·h/ml) | 1,490
(468–1,722) | 1,313
(446–2,004) | 2,922 (43.80) | 3,303 (42.90) | 2,656 | 5,117 (33.60) | 5,061 (21.70) | 4,889 | 6,707 | 8,987 (31.00) | 8,118
(6,025–10,210) |
| Table IVStatistical analysis of dose
proportionality for AUC0-∞. |
Table IV
Statistical analysis of dose
proportionality for AUC0-∞.
| PK variable | Doses ratio | Predicted geometric
mean PK parameter values | Rdnm 90%
confidence interval |
|---|
|
AUC0-∞ | 12 | 1,112 to 9,232 | 0.69 (0.41,
1.17) |
| 6 | | 0.77 (0.52,
1.12) |
| 4 | | 0.81 (0.61,
1.09) |
| 2 | | 0.90 (0.78,
1.04) |
Pharmacodynamic measures
While IL-2 levels were increased approximately 2 h
after IV administration of TβM1, other plasma protein were
decreased or not changed after dosing of TβM1 (Fig. 1A–C). Vascular endothelial growth
factor (VEGF) levels were decreased at the 60-mg and 240-mg doses
of TβM1 and basic fibroblast growth factor (bFGF) levels were also
reduced at 60-mg and 240-mg doses of TβM1. These effects were seen
consistently in patient cohorts.
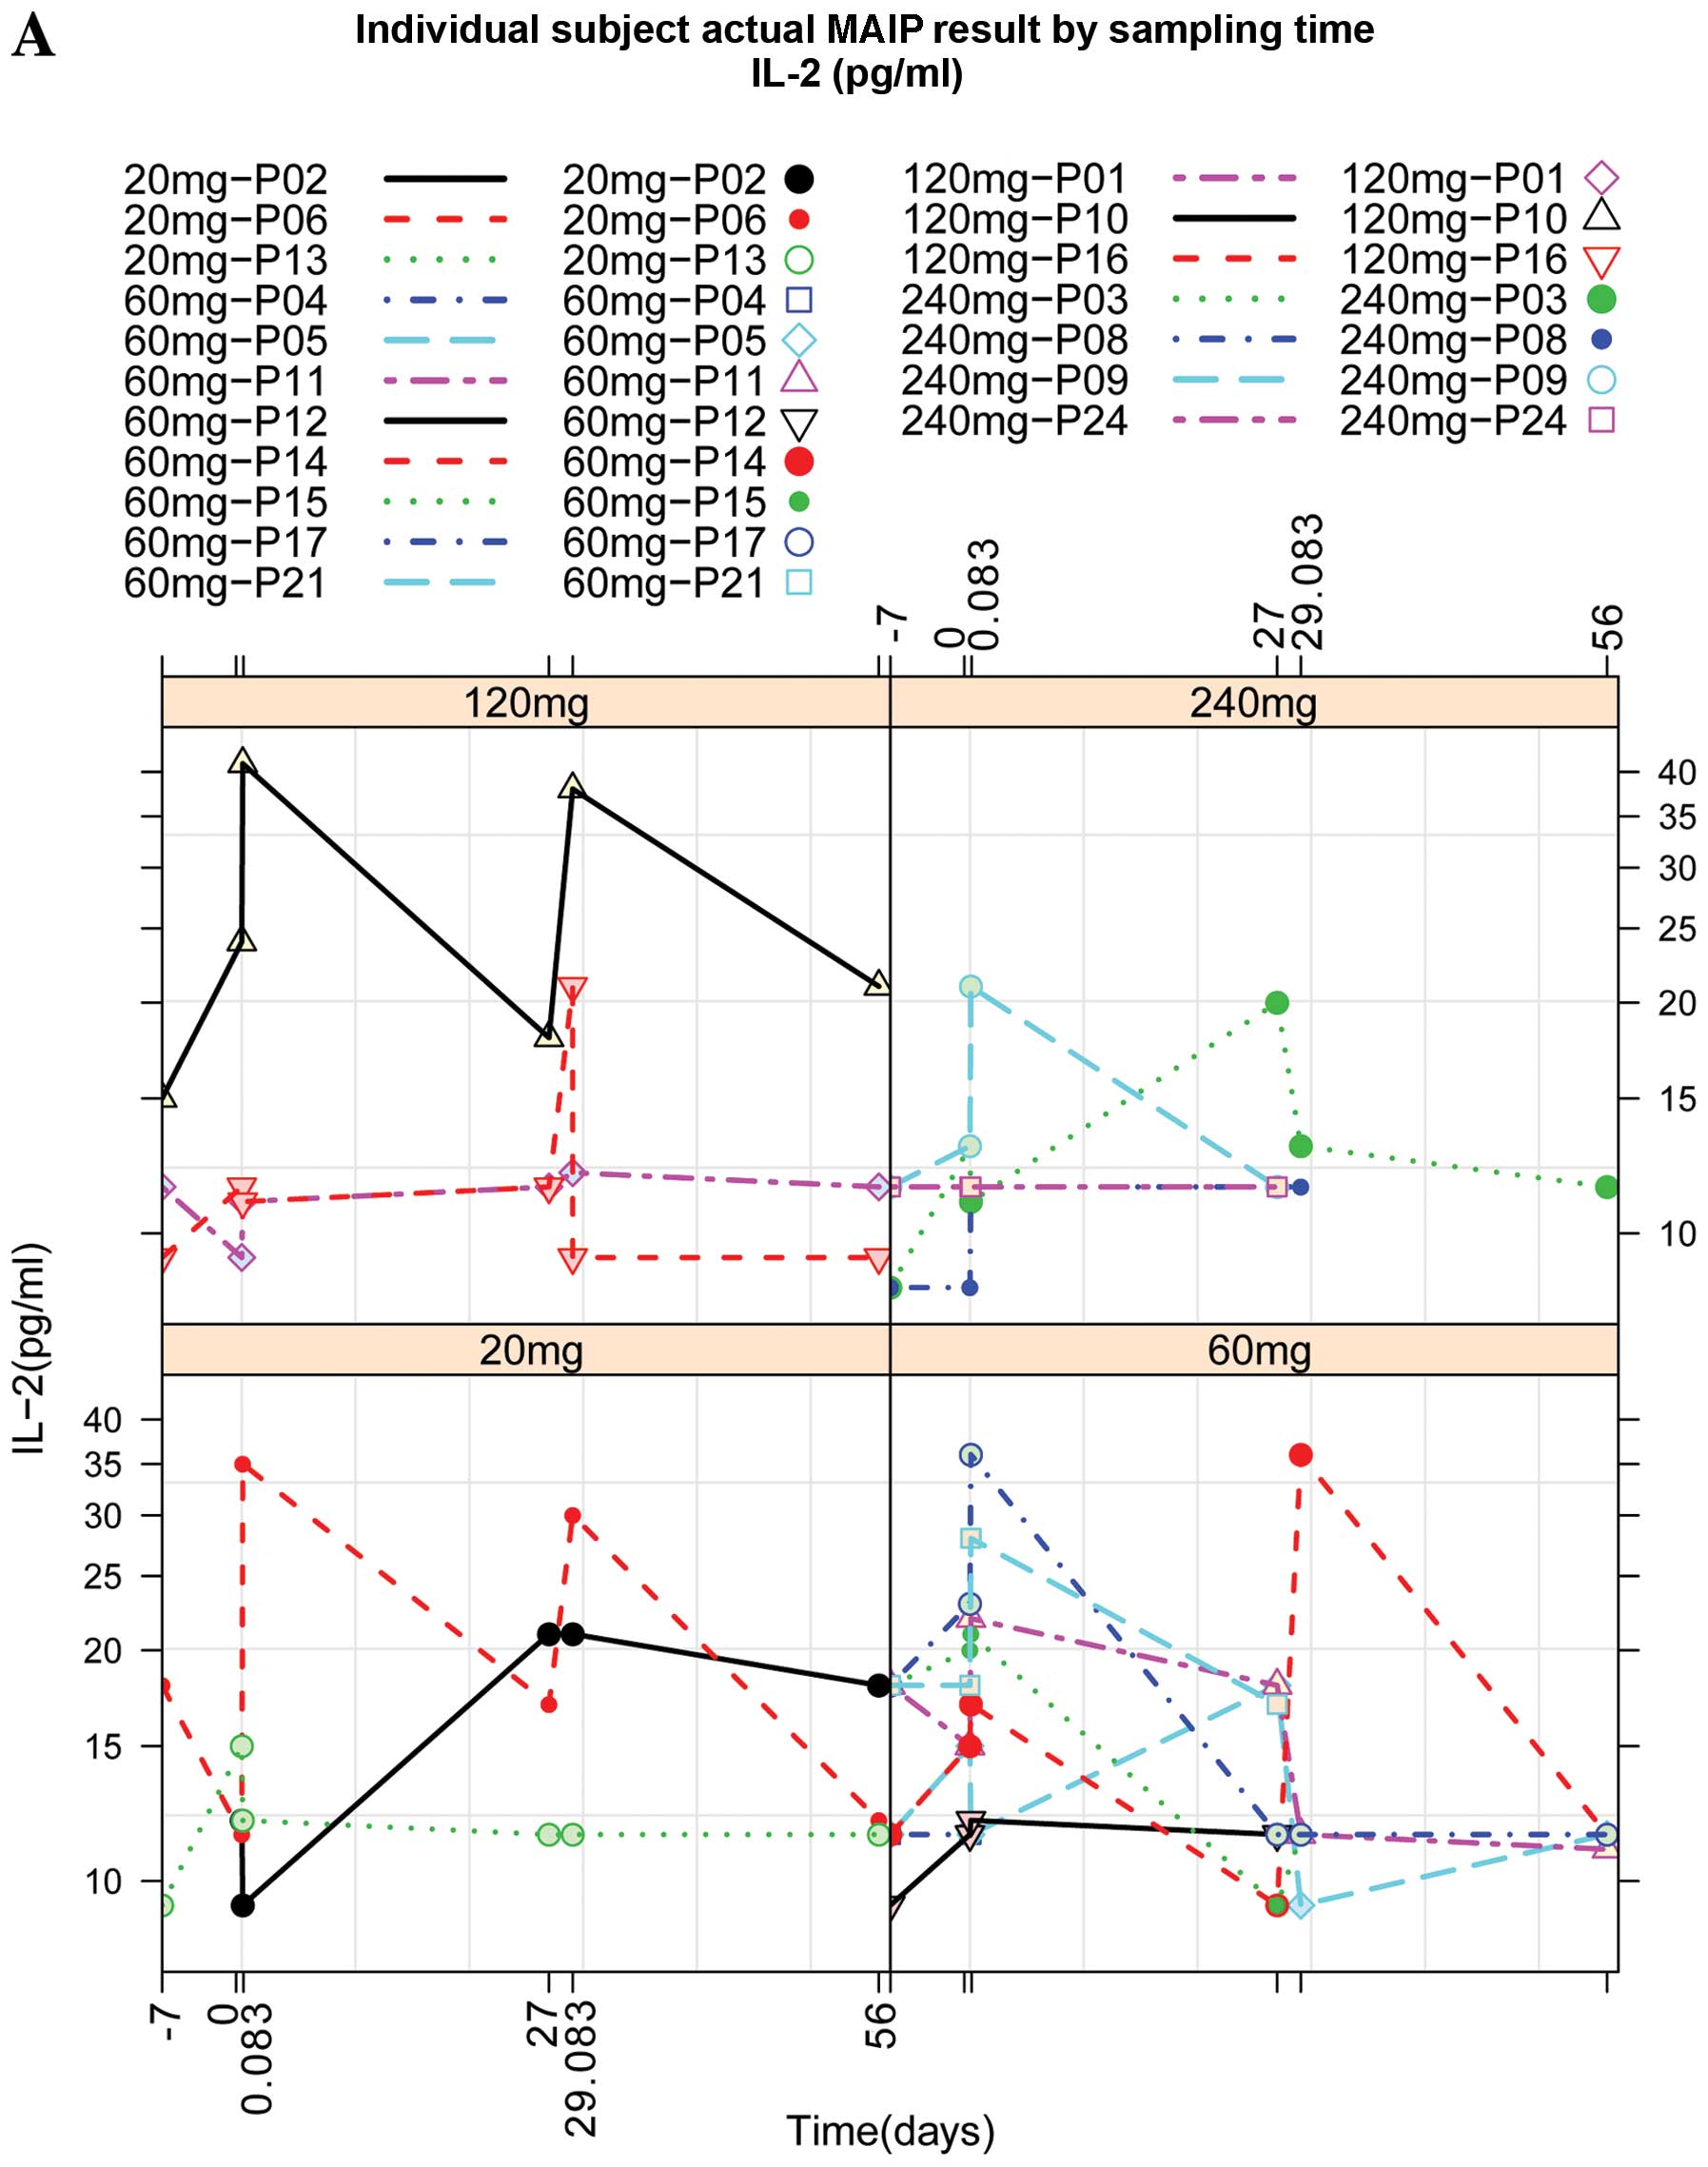 | Figure 1Individual patient profiles of
multianalyte immunoassay panel test results over sampling time
points. (A) Levels of IL-2 at different doses (20, 60, 120 and 240
mg) of TβM1. The levels of these biomarkers were measured at
different time points after administration as shown on X-axis. Time
point 1, ≤7 days prior to first dose; time point 2, cycle 1,
predose; time point 3, cycle 1, 2 h post-dose; time point 4, cycle
1, 27th day; time point 5, cycle 2, 2 h post-dose; time point 6,
cycle 2, 27th day. (B) Levels of bFGF at different doses (20, 60,
120 and 240 mg) of TβM1. The levels of these biomarkers were
measured at different time points after administration as shown on
X-axis. Time point 1, ≤7 days prior to first dose; time point 2,
cycle 1, predose; time point 3, cycle 1, 2 h post-dose; time point
4, cycle 1, 27th day; time point 5, cycle 2, 2 h post-dose; time
point 6, cycle 2, 27th day. (C) Levels of VEGF at different doses
(20, 60, 120 and 240 mg) of TβM1. The levels of these biomarkers
were measured at different time points after administration as
shown on X-axis. Time point 1, ≤7 days prior to first dose; time
point 2, cycle 1, predose; time point 3, cycle 1, 2 h post-dose;
time point 4, cycle 1, 27th day; time point 5, cycle 2, 2 h
post-dose; time point 6, cycle 2, 27th day. IL-2, interleukin-2;
bFGF, basic fibroblast growth factor; VEGF, vascular endothelial
growth factor. |
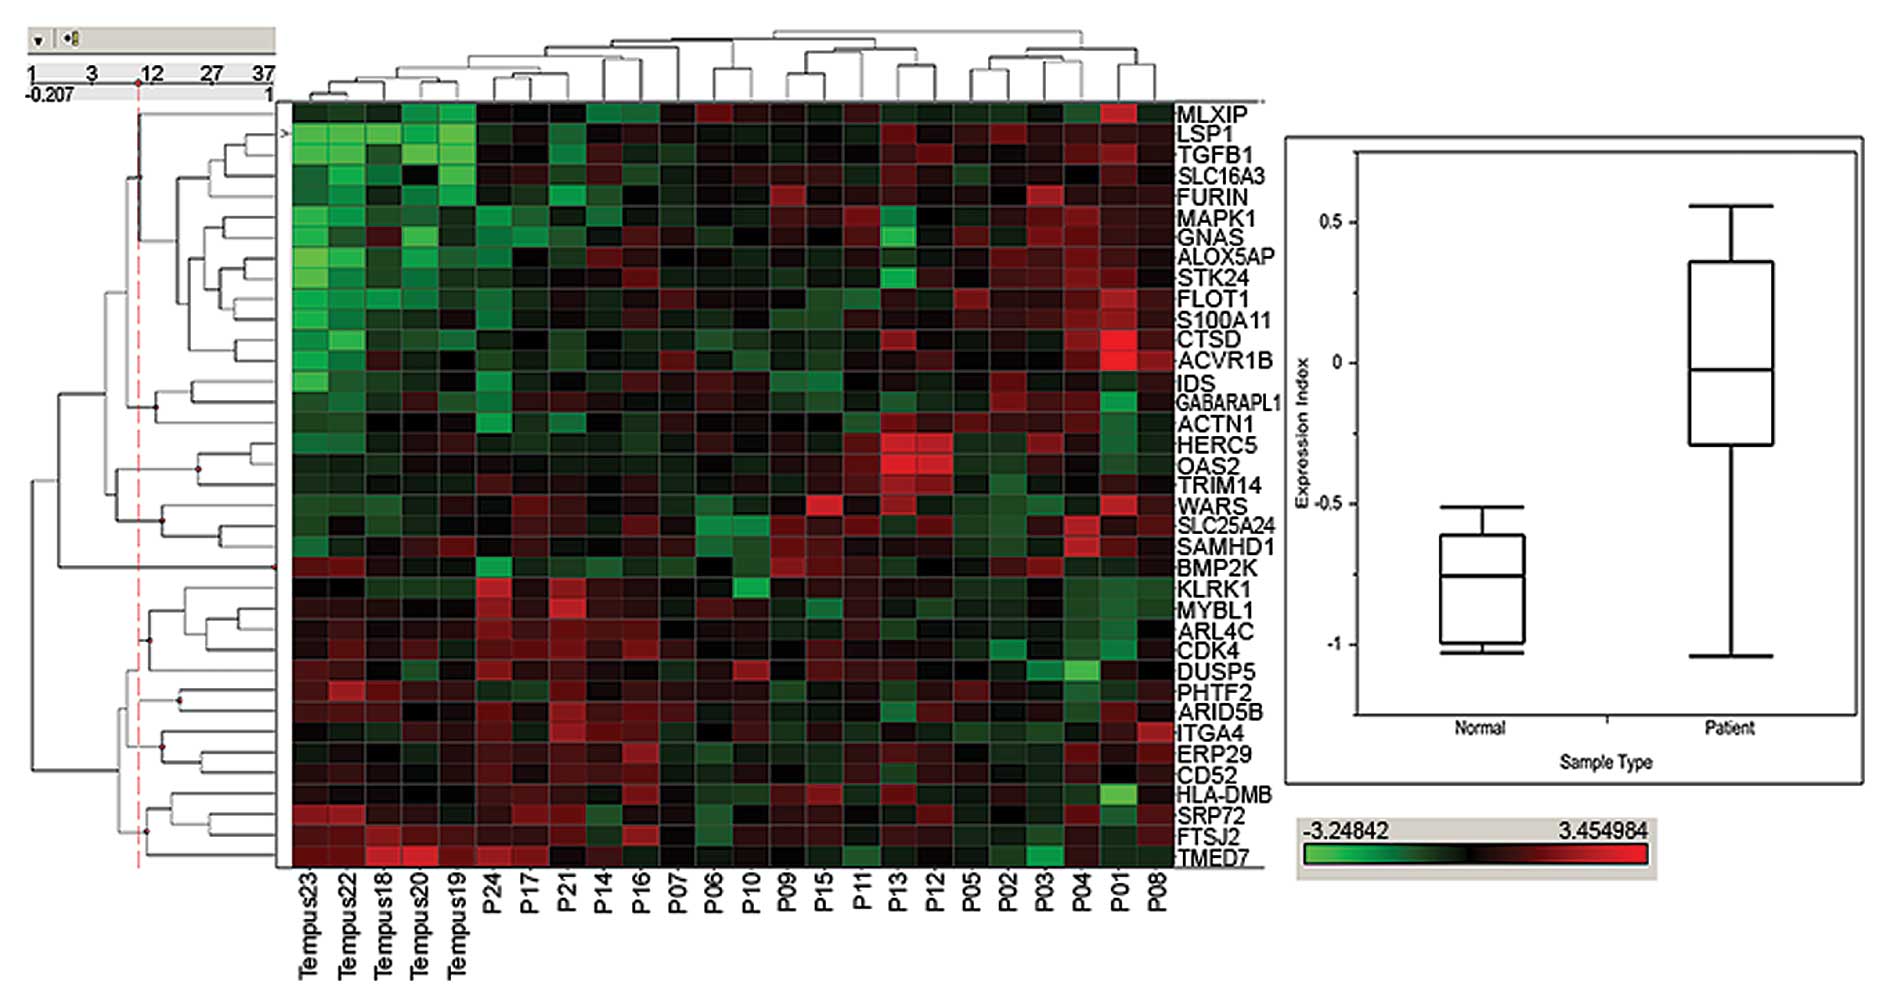
Changes in expression of genes associated with the
TGF-β1 pathway activation have been reported to influence
tumorigenesis in genetically altered animals (37). We previously observed (35) changes in global gene expression and
associated a 37-gene whole blood expression profile that was
associated with markers of systemic TGF-β1-dependent pathway
activation. Here, we show the measurement of whole blood expression
signals for the 37 genes and their association with TGF-β1 pathway
activation status compared with whole blood from normal subjects
(Fig. 2). A hierarchically
clustered heat map of the corresponding probe set signals in
pretreatment patient whole blood clearly separated certain patient
samples from normal samples collected in Tempus tubes. In normal
samples designated Tempus 18–23 (upper left region of left panel)
there is a region where several genes are expressed at lower level
(green) in normal subjects compared with increasing expression
(going from green to red) in patients. Similarly there is a set of
genes in the lower left where expression in patient samples is
higher than in normal subjects. The median expression index of the
study samples from both populations of subjects represented in the
box and whisker plot (Fig. 2,
right panel) was almost 2-fold higher in cancer patients than
normal subjects, suggesting increased systemic TGF-β1 activation
status in patients. In each case, the area in the box represents
the upper and lower 75th and 25th percentile and the line within it
represent the median. The upper and lower maximal values are
represented by the outward directional extensions. Taken together,
these data show that in cancer patients, there is a trend where the
whole blood expression, represented by the calculated expression
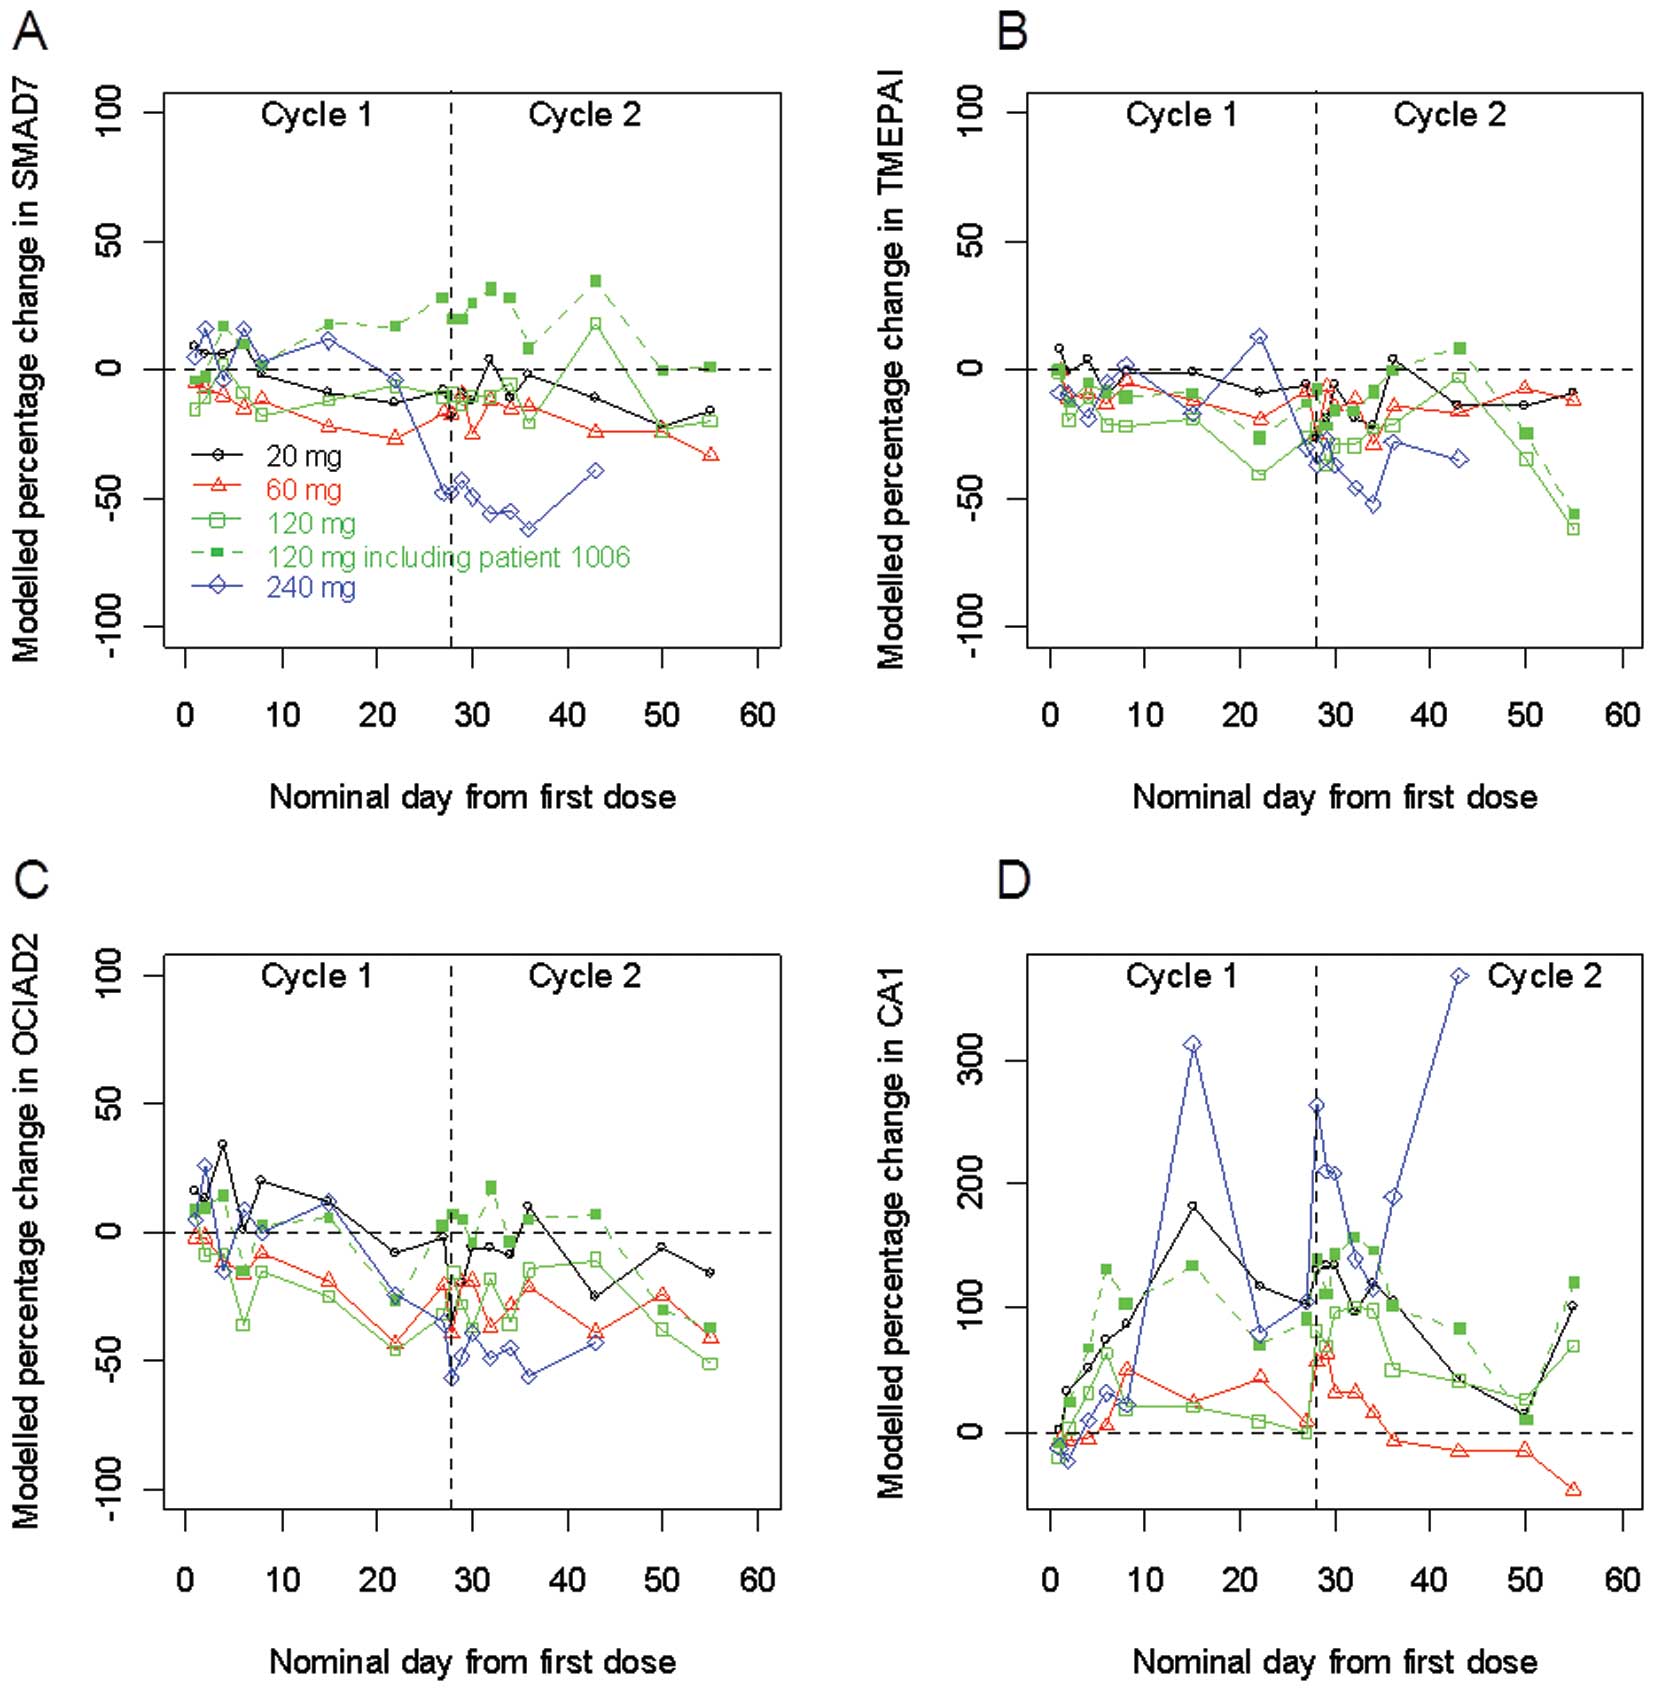
index, is shifted toward a more activated TGF-β1 system. We also
measured the expression of selected genes known to be regulated by
TGF-β1 exposure to cultured cells and/or ex vivo peripheral
blood mononuclear cells (PBMCs). Fig.
3 depicts the expression of selected genes using qRT-PCR. Of
the selected genes, SMAD7, TMEPAI and OCIAD2 were normally
upregulated in vitro with TGF-β1 addition while CA1 was
downregulated (data not shown). The expression of CA1 increased
after TβM1 treatment, especially at the 240-mg dose (panel D). The
gene expression measurement of SMAD7 and TMEPAI, both known to be
negative regulators of TGF-β1 activation, were generally negative
in post-treatment especially at the highest dose, indicating
reduced TGF-β1 activation and pointing to a possible PD effect with
TβM1 treatment (panels A and B). Additionally, the level of OCIAD2
expression in whole blood appeared to be reduced upon treatment at
all doses (panel C). Despite hints of a PD effect, the changes
noted were not consistent across treatment groups.
Clinical efficacy measures
Clinical efficacy was a secondary objective in this
study. Of 18 patients who received at least 1 dose of TβM1, 13 had
at least 1 postdose for tumor response. Based on RECIST response
assessment, the best overall study response was stable disease for
7 patients and progressive disease for 6 patients. The tumor
markers in all patients, including lactate dehydrogenase (LDH),
increased or were only briefly reduced (less than 1 cycle).
Discussion
TGF-β inhibitors target a complex biology in cancer.
Patients with advanced or metastatic conditions seem to have
particularly high tumor expression, or produce large amounts of
TGF-β ligands (17). Although
inhibiting only one isoform may not be sufficient to achieve
antitumor efficacy, we hypothesized that targeting TGF-β1 would be
sufficient to obtain tumor responses, because it is the most
prevalent ligand in plasma or serum of patients with invasive
metastatic disease and correlates with adverse outcomes (8–22).
The present study was designed to evaluate the
safety, PK and PD effects of TβM1 at a prespecified dose range in
patients with advanced metastatic cancer. In contrast to typical
phase I dose-escalation studies in oncology, the objective of this
study was not to investigate a maximum tolerated dose (MTD). Given
that TβM1 is hypothesized to bind and neutralize TGF-β1 at low
concentrations, it was proposed that the consequence of blocking
TGF-β1 would result in significant PD effects in cancer patients at
monthly intravenous doses of 120 to 240 mg. The PD effects were
expected to translate to clinical signals such as tumor responses,
because a neutralizing mAb with a lower affinity to all three TGF-β
ligands (32,33) produced antitumor responses in
patients with melanoma and renal cell carcinoma (RCC) at similar
doses.
Safety
Overall, TβM1 was well tolerated across the 20 to
240 mg dose range. No pattern of a dose-response relationship with
AEs was noted and no patient discontinued due to AEs or SAEs.
Sixteen of the 18 cancer patients discontinued study treatment due
to progressive disease. The only death was a patient in the 60-mg
cohort who died due to his bladder cancer. One patient who received
240 mg discontinued study treatment per own decision. Except for
the escalation from the first to second dose cohort (20 and 60 mg,
respectively), dose escalation of TβM1 preceded as planned and the
only DLT identified was a self-limited grade 3 diarrhea observed in
one of the initial 3 patients in the 60-mg cohort. Logistic
regression analysis for the probability of experiencing a DLT was
not performed, as there was only one occurrence of a DLT.
Pharmacokinetic profile of TβM1
The PK profile is consistent with other known
monoclonal antibodies (38). Since
this agent is an IgG4 and is given IV, these study data provide
additional information on the PK behavior of this class of mAb
compared with the IgG1 and IgG2 backbone. TβM1 measurements of
anti-drug antibody (ADA) confirmed that less than 1% of the
patients developed antibodies against TβM1 (one patient in this
study).
Pharmacodynamics of TβM1
The small sample size limits assessments of PD
effects at individual doses. Regarding the specific gene expression
panel that was previously identified to be regulated by TGF-β
inhibition (39), there was
non-significant reduction of SMAD7, TMEPAI and OCIAD2 at the 240-mg
dose. Significant effects might have occurred with a larger sample
size, more frequent dosing or higher doses. This would suggest that
the dose of TβM1 was not effective enough in blocking TGF-β1 levels
in humans to achieve a reduction in gene expression in PBMCs.
Notably, there was no dose-related decrease; rather the reduction
for all dose levels was similar. Hence, it is also possible that
the observations for the 240-mg dose level were chance events. The
comprehensive gene expression profiling also suggested that the
doses were not sufficient to decrease the TGF-β1-associated
signaling as determined by the STK24 gene expression. After
TβM1 administration, VEGF and bFGF were reduced in some patients as
detected by the MAIP. While this indicates a possible TβM1
treatment effect, other markers of tumor progression were increased
in the same and other patients. For instance, IL-6 was increased in
a patient with RCC and IL-8 was increased in 5 patients (data not
shown). In addition to these pro-inflammatory markers, PAI-1 and
TIMP-1 were increased (data not shown). The MAIP detects tumor
markers which can be compared to standard chemistry tests. For
instance, the carcinoembryonic antigen (CEA) values obtained by
standard serum chemistry were correlated with the elevated CEA
values detected by the MAIP. Unfortunately, as already shown in
some patients with standard tumor marker evaluation, all the
MAIP-based tumor markers increased during treatment with TβM1.
Overall, the MAIP panel depicts a situation that is consistent with
tumor growth and not with tumor response and in some instances is
expected based on previous evaluations (40).
Clinical response of TβM1
The best clinical response in this study was stable
disease. There were 4 patients who received 3 cycles and only 1
patient who was treated for 4 cycles. While this result is
consistent with the benefits observed in general phase I oncology
patients (41), the results on
balance do not favor further clinical development of TβM1 as a
treatment for non-specific types of cancer. The tumor markers in
all patients, including lactate dehydrogenase levels, increased or
were only briefly reduced (less than 1 cycle). All this suggests
that the TGF-β1 blockade by the dosing regimens employed was either
inadequate, that TGF-β1 is not sufficiently active in tumor growth,
or that its inhibition leads to activation of other pro-growth
pathways in patients where the relevance of TGF-β-dependent growth
has not been predetermined at study entry. Compared with the
fresolimumab (GC-1008) clinical observation, another IgG4 mAb but
directed against all 3 ligands (32), it is possible that TβM1 may have
been active in patients with melanoma. However, no melanoma
patients were included in this study.
In summary, TβM1 is safe when administered once
monthly by IV for 10 min. No MTD was observed. Reduction in PD
marker levels of VEGF and bFGF suggests minor activity of TβM1 on
the targeted pathway at the dose regimens investigated. PD effects
on gene expression profiles do not translate into significant
antitumor effects in patients. This lack of a consistent PD
response and a clinical antitumor effect in the various cancers
included in this trial failed to identify a tumor type responsive
to isolated TGF-β1 suppression that warrants further study.
Acknowledgements
This study was sponsored by Eli Lilly and Company,
IN, USA. The authors wish to express their appreciation to
investigators, coordinators and patients for their participation in
this study. Dr M. Lahn, Dr D. Desaiah and Ms. K. Williams are
employees of Eli Lilly and Company, Indianapolis, IN, USA and hold
company stock. Ms. A. Cleverly and Ms. C. Pitou are employees of
Eli Lilly and Company, Windlesham, Surrey, UK and hold company
stock options. Dr A. Cohn, Dr P. Conkling, Dr R. Raju and Dr D.
Richards have no financial disclosures.
References
|
1
|
Massagué J: TGFβ signal transduction. Annu
Rev Biochem. 67:753–791. 1998.
|
|
2
|
Muraoka-Cook RS, Dumont N and Arteaga CL:
Dual role of transforming growth factor beta in mammary
tumorigenesis and metastatic progression. Clin Cancer Res.
11:937s–943s. 2005.PubMed/NCBI
|
|
3
|
Sun L: Tumour-suppressive and promoting
function of transforming growth factor beta. Front Biosci.
9:1925–1935. 2004. View
Article : Google Scholar : PubMed/NCBI
|
|
4
|
De Caestecker MP, Piek E and Robers AB:
Role of transforming growth factor-beta signaling in cancer. J Natl
Cancer Inst. 92:1388–1402. 2000.PubMed/NCBI
|
|
5
|
Park BJ, Park JI, Byun DS, Park JH and Chi
SG: Mitogenic conversion of transforming growth factor-beta1 effect
by oncogenic Ha-Ras-induced activation of the mitogen-activated
protein kinase-signaling pathway in human prostate cancer. Cancer
Res. 60:3031–3038. 2000.
|
|
6
|
Chen YG, Hata A, Lo RS, Wotton D, Shi Y,
Pavletich N and Massagué J: Determinants of specificity in TGF-beta
signal transduction. Genes Dev. 12:2144–2152. 1998. View Article : Google Scholar : PubMed/NCBI
|
|
7
|
Siegel PM, Shu W, Cardiff RD, Muller WJ
and Massagué J: Transforming growth factor beta signaling impairs
neuinduced mammary tumorigenesis while promoting pulmonary
metastasis. Proc Natl Acad Sci USA. 100:8430–8435. 2003. View Article : Google Scholar : PubMed/NCBI
|
|
8
|
Adler H, McCurdy M, Kattan M, Timme T,
Scardino P and Thompson T: Elevated levels of circulating
interleukin-6 and transforming growth factor-beta 1 in patients
with metastatic prostatic carcinoma. J Urol. 161:182–187. 1999.
View Article : Google Scholar : PubMed/NCBI
|
|
9
|
Shariat SF, Shaler M, Menesses-Diaz A, Kim
IY, Kattan MW, Wheeler TM and Slawin KM: Preoperative plasma levels
of transforming growth factor β-1 (TGF-β1) strongly predict
progression in patients undergoing radical prostatectomy. J Clin
Oncol. 19:2856–2864. 2001.
|
|
10
|
Shariat SF, Kattan MW, Traxel E, Andrews
B, Zhu K, Wheeler TM and Slawin KM: Association of pre- and
postoperative plasma levels of transforming growth factor beta (1)
and interleukin 6 and its soluble receptor with prostate cancer
progression. Clin Cancer Res. 10:1992–1999. 2004. View Article : Google Scholar : PubMed/NCBI
|
|
11
|
Kattan M, Shariat SF, Andrews B, et al:
The addition of interleukin-6 soluble receptor and transforming
growth factor-beta1 improves a preoperative nomogram for predicting
biochemical progression in patients with clinically localized
prostate cancer. J Clin Oncol. 21:3573–3579. 2003. View Article : Google Scholar
|
|
12
|
Kakehi Y, Oka H, Mitsumori K, Itoh N,
Ogawa O and Yoshida O: Elevation of serum transforming growth
factor-β1 level in patients with metastatic prostate cancer. Urol
Oncol. 2:131–135. 1996.
|
|
13
|
Ivanovic V, Melman A, Davis-Joseph B,
Valcic M and Geliebter J: Elevated plasma levels of TGF-beta 1 in
patients with invasive prostate cancer. Nat Med. 1:282–284. 1995.
View Article : Google Scholar : PubMed/NCBI
|
|
14
|
Kong F, Jirtle RL, Huang DH, Clough RW and
Anscher MS: Plasma transforming growth factor-beta1 level before
radiotherapy correlates with long term outcome of patients with
lung carcinoma. Cancer. 86:1712–1719. 1999. View Article : Google Scholar : PubMed/NCBI
|
|
15
|
Kong FM, Anscher MS, Murase T, Abbott BD,
Iglehart JD and Jirtle RL: Elevated plasma transforming growth
factor-beta 1 levels in breast cancer patients decrease after
surgical removal of the tumor. Ann Surg. 222:155–162. 1995.
View Article : Google Scholar
|
|
16
|
Kong FM, Washington MK, Jirtle RL and
Anscher MS: Plasma transforming growth factor-beta 1 reflects
disease status in patients with lung cancer after radiotherapy: a
possible tumor marker. Lung Cancer. 16:47–59. 1996. View Article : Google Scholar : PubMed/NCBI
|
|
17
|
Lahn M, Berry B, Kloeker S and Yingling J:
TGF-β receptor kinase inhibitors for the treatment of cancer. Smad
Signal Transduction: Smads in Proliferation, Differentiation and
Disease. Ten Dijke P and Heldin C-H: Springer-Verlad; New York, NY:
pp. 415–442. 2006
|
|
18
|
Shim KS, Kim KH, Han WS and Park EB:
Elevated serum levels of transforming growth factor-beta 1 in
patients with colorectal carcinoma: its association with tumor
progression and its significant decrease after curative surgery
resection. Cancer. 85:554–561. 1999. View Article : Google Scholar
|
|
19
|
Sheen-Chen SM, Chen HS, Sheen CW, Eng HL
and Chen WJ: Serum levels of transforming growth factor beta 1 in
patients with breast cancer. Arch Surg. 136:937–940. 2001.
View Article : Google Scholar : PubMed/NCBI
|
|
20
|
Tsushima H, Ito N, Tamura S, et al:
Circulating transforming growth factor beta1 as a predictor of
liver metastasis after resection in colorectal cancer. Clin Cancer
Res. 7:1258–1262. 2001.PubMed/NCBI
|
|
21
|
Barthelemy-Brichant N, David JL, Bosquee
L, et al: Increased TGF-beta 1 plasma level in patients with lung
cancer: potential mechanisms. Eur J Clin Invest. 32:193–198. 2002.
View Article : Google Scholar : PubMed/NCBI
|
|
22
|
Xiong B, Yuan HY, Hu MB, Zhang F, Wei ZZ,
Gong LL and Yang GL: Transforming growth factor-beta1 in invasion
and metastasis in colorectal cancer. World J Gastroenterol.
8:674–678. 2002.PubMed/NCBI
|
|
23
|
Hau P, Bogdahn U, Stauder G, Kunst M and
Schlingensiepen KH: TGF-β2 specific antisense oligonucleotide
(AP-12009) as continuous intratumoural treatment of recurrent
high-grade glioma patients. Arzneim-Forsch Drug Res.
53:4642003.
|
|
24
|
Dvorchik BH: The disposition (ADME) of
antisense oligonucleotides. Curr Opin Mol Ther. 2:253–257.
2000.PubMed/NCBI
|
|
25
|
Sawyer JS, Anderson BD, Beight DW, et al:
Synthesis and activity of new aryl- and heteroaryl-substituted
pyrazole inhibitors of the transforming growth factor-beta type I
receptor kinase domain. J Med Chem. 46:3953–3956. 2003. View Article : Google Scholar
|
|
26
|
Yingling JM, Blanchard KL and Sawyer JS:
Development of TGF-beta signaling inhibitors for cancer therapy.
Nat Rev Drug Discov. 3:1011–1022. 2004. View Article : Google Scholar : PubMed/NCBI
|
|
27
|
Robinson S, Pool R and Giffin R: Forum on
Drug Discovery, Development, and Translation: Emerging Safety
Science: Workshop Summary. National Academies Press; Washington,
DC: 2008
|
|
28
|
Lonning S, Mannick J and McPherson JM:
Antibody targeting of TGF-β in cancer patients. Curr Pharm
Biotechnol. 12:2176–2189. 2011.
|
|
29
|
Gatto B: Monoclonal antibodies in cancer
therapy. Curr Med Chem Anticancer Agents. 4:411–414. 2004.
View Article : Google Scholar
|
|
30
|
Muraoka RS, Dumont N, Ritter CA, et al:
Blockade of TGF-β inhibits mammary tumor cell viability, migration,
and metastases. J Clin Invest. 109:1551–1559. 2002.
|
|
31
|
Yang Y, Dukhanina O, Tang B, et al:
Lifetime exposure to a soluble TGF-β antagonist protects mice
against metastasis without adverse side effects. J Clin Invest.
109:1607–1615. 2002.PubMed/NCBI
|
|
32
|
Morris JC, Shapiro GI, Tan AR, et al:
Phase I study of GC1008: A human anti-transforming growth
factor-beta (TGFβ) monoclonal antibody (MAb) in patients with
advanced malignant melanoma (MM) or renal cell carcinoma (RCC). J
Clin Oncol. 26:90282008.PubMed/NCBI
|
|
33
|
Trachtman H, Fervenza FC, Gipson DS, et
al: A phase 1, single-dose study of fresolimumab, an anti-TGF-β
antibody, in treatment-resistant primary focal segmental
glomerulosclerosis. Kidney Int. 79:1236–1243. 2011.PubMed/NCBI
|
|
34
|
O’Brien PJ, Ramanathan R, Yingling JM, et
al: Analysis and variability of TGF-beta measurements in cancer
patients with skeletal metastases. Biologics. 2:563–569.
2008.PubMed/NCBI
|
|
35
|
Kadam S, Cleverly AL, Farmen M, et al: A
canonical transforming growth factor beta-dependent signaling
pathway is present in peripheral blood cells of cancer patients
with skeletal metastasis. J Mol Biomark Diagn. 4:1532005.
|
|
36
|
Zhaou L and Rocke DM: An expression index
for Affymetrix GeneChips based on the generalized logarithm.
Bioinformatics. 21:3983–3969. 2005. View Article : Google Scholar : PubMed/NCBI
|
|
37
|
Kang Y, Mariano JM, Angdisen J, Moody TW,
Diwan BA, Wakefield LM and Jakowlew SB: Enhanced tumorigenesis and
reduced transforming growth factor-β type II receptor in lung
tumors from mice with reduced gene dosage of transforming growth
factor-beta1. Mol Carcinog. 29:112–126. 2000.
|
|
38
|
Lobo ED, Hansen RJ and Balthsar JP:
Antibody pharmacokinetics and pharmacodynamics. J Pharmacol Sci.
93:2645–2668. 2004. View Article : Google Scholar
|
|
39
|
Classen S, Muth C, Debey-Pascher S, et al:
Application of T cell-based transcriptomics to identify three
candidate biomarkers for monitoring anti-TGF-βR therapy.
Pharmacogenet Genomics. 20:147–156. 2010.PubMed/NCBI
|
|
40
|
Baselga J, Rothenberg ML, Tabernero J, et
al: TGF-β signalling related markers in cancer patients with bone
metastasis. Biomarkers. 13:217–236. 2008.
|
|
41
|
Horstmann E, McCabe MS, Grochow L, et al:
Risks and benefits of phase 1 oncology trials, 1991 through 2002. N
Engl J Med. 352:895–904. 2005. View Article : Google Scholar : PubMed/NCBI
|