Introduction
Pancreatic ductal adenocarcinoma (PDAC) is a highly
lethal disease characterized by early spread to local and distant
organs, and most patients having an unresectable tumor at the time
of diagnosis (1). Even for
patients who initially present with localized disease and undergo
curative surgery, the median survival is only 18 months (2). Although the improved understanding of
pancreatic cancer biology and genetics, no significant advances in
treatment have been realized in >10 years (2).
Recently, gene expression analyses of highly
aggressive tumors have shown a compelling overlap of their gene
expression profiles with those of normal stem cells (3). This observation strongly supports the
relevance of cancer stem cell (CSC) isolation, first described in
the early 1990s in hematologic malignancies (4). Since then, CSCs have been identified
in a growing number of malignancies, including pancreatic
adenocarcinoma (5,6). The unique functional properties of
CSCs, such as self-renewal, anchorage-independent growth, long-term
proliferative capacity, and chemotherapy resistance, suggest that
they play an important role in tumor relapse. Their phenotype is
generally associated with epithelial-to-mesenchymal transition
(EMT) in which epithelial cells lose their characteristics,
acquiring stem cell-like features. Recent data have demonstrated
that, in a mouse model, pancreatic CSCs circulate in the blood
before tumor growth and lead to metastasis formation (7). Furthermore, a growing number of
studies have demonstrated an association between the presence of
CSCs and worse clinical outcomes (8,9).
Therefore, the identification of the specific molecular features of
pancreatic CSCs is of crucial relevance for the development of more
efficient therapies and for the discovery of specific markers.
The high level of heterogeneity of CSCs, which
originates from genotypic and phenotypic plasticity, and their low
presence in cancer sample tissues, make their isolation and
identification a strong limitation for the realization of
biochemical studies. Thus, in order to obtain valid and
reproducible results, the biochemical approach to study CSC
pathophysiology can take advantage from the observation that CSCs
can be isolated and enriched from several human cancer cell lines
(5,10–12),
in agreement with the recently proposed concept of CSC plasticity.
Indeed, it has been shown that CSCs and non-CSCs exist in the tumor
in a dynamic equilibrium and that both types of cells are capable
to interconvert in response to environmental cues (3,8,13,14).
Therefore, identification of factors responsible for bi-directional
conversion of tumor cells will be of fundamental importance not
only to target CSCs but also to prevent CSC generation from
non-CSCs.
The present study was conducted to achieve the
following three primary goals: i) to test the capacity of several
PDAC cell lines to generate CSCs in selective medium; ii) to
characterize biological features of the obtained CSCs, both in
vitro and in vivo; and iii) to analyse CSCs for their
sensitivity to different chemotherapeutic drugs in order to
identify various CSC models for biochemical drug resistance
studies. Interestingly, only five out of nine PDAC cell lines were
able to form tumorspheres in selective medium and each of them
showed a distinctive pattern of sensitivity to drugs. These
findings suggest that the potentiality of PDAC cell lines to
dedifferentiate depends on the origin of the cell line and that
each cell line dedifferentiates into cells with a different
phenotype and expression profile that determine the differential
drug sensitivity.
Materials and methods
Drugs and chemicals
Gemcitabine (Jemta; Sandoz) and zoledronic acid
(Zometa; Novartis) were solubilized in water, sorafenib
(BAY43-9006; Bayer AG), tipifarnib (Zarnestra; Johnson &
Johnson), and everolimus (RAD001; Novartis) were solubilized in
DMSO. Gemcitabine was stored at −80°C, zoledronic acid, everolimus
and tipifarnib at −20°C, sorafenib at room temperature until
use.
Cell lines
The human cell lines PaCa44, HPAF-II, PT45P1,
CFPAC1, PSN1, PC1J, PaCa3, Panc1, MiaPaCa2 (pancreatic
adenocarcinoma cell lines), and VIT-1 (normal primary pancreatic
mesenchymal cells) were grown in RPMI-1640 supplemented with 10%
FBS, 2 mM glutamine, and 50 μg/ml gentamicin sulfate (Gibco/Life
Technologies). Adherent cells were maintained in standard
conditions for a few passages at 37 °C with 5% CO2. To
generate suspension cells and separate stem-like sphere-growing
cells, adherent cells were washed twice in 1X PBS (Gibco/Life
Technologies) and then cultured in CSC medium, i.e., DMEM/F-12
without glucose (US Biological Life Sciences) supplemented with 1
g/l glucose, B27, 1 μg/ml fungizone, 1% penicillin/streptomycin
(all from Gibco/Life Technologies), 5 μg/ml heparin (Sigma), 20
ng/ml epidermal growth factor (EGF), and 20 ng/ml fibroblast growth
factor (FGF) (both from PeproTech). Adherent cells were left in CSC
medium for at least 1–3 weeks or until the appearance of floating
cell aggregates, referred to as tumorspheres. Tumorspheres were
cultured in CSC medium for at least three passages before
initiating the characterization experiments.
Tumorsphere formation assay/vitality
assay
PSN1, PC1J, PaCa3, Panc1, and MiaPaCa2 CSCs were
plated in 96-well cell culture plates (3×10³ cells/well)
and incubated at 37°C with 5% CO2 in CSC medium.
Tumorspheres were counted after 5 days.
PSN1, PC1J, PaCa3, Panc1, and MiaPaCa2 parental cell
lines, CSCs, and ex-CSCs were plated in 96-well cell culture plates
(5×10³ cells/well) and incubated at 37°C with 5%
CO2. After 24 h the cells were treated with increasing
dose of five drugs (gemcitabine, zoledronic acid, sorafenib,
tipifarnib, and everolimus). After 72 h, cell viability was
measured by Cell Proliferation Reagent WST-1 (Roche
Diagnostics).
For proliferation cell assay, Panc1 parental cell
line and CSCs were plated in 96-well cell culture plates
(5×10³ cells/well) and incubated at 37°C with 5%
CO2. Viable cells were counted by Trypan Blue dye
exclusion after 1, 2, 3, 4, and 7 days. The doubling time was
calculated using the formula T = (T2-T1) ×
log 2/log (Q2/Q1), where: T1, day
3; T2, day 7; Q1, cell number at day 3; and
Q2, cell number at day 7. For CSCs, this experiment was
performed using CSC medium containing 1 or 3 g/l glucose and
similar results were obtained.
Flow cytometry analysis
Panc1 parental cell line and CSCs were harvested,
washed, resuspended in 1X PBS and stained for 30 min on ice with
FITC-conjugated monoclonal anti-CD326 (anti-EpCAM, no.
130-098-113), PE-conjugated monoclonal anti-CD133/2 (no.
130-090-853) (both from Miltenyi Biotech), PE-Cy7-conjugated
polyclonal anti-CD66c (no. bs-6032R; Bioss, Inc.),
APC-H7-conjugated monoclonal anti-CD44 (no. 560532; BD
Biosciences), FITC-conjugated monoclonal anti-CD44v6 (no. ab30437;
Abcam), and PE-Cy7-conjugated monoclonal anti-CD24 (no. 311119;
BioLegend). Isotype- matched irrelevant antibodies were used as
negative controls.
Approximately 20,000 gated events were acquired for
each sample on a BD FACSCanto (BD Biosciences) and analyzed using
FlowJo software (TreeStar, Inc.). Dead cells and debris were
excluded based upon forward scatter and side scatter
measurements.
RNA extraction and qPCR
Total RNA was extracted from 106 cells
using TRIzol Reagent (Life Technologies) and 1 μg of RNA was
reverse transcribed using first-strand cDNA synthesis. Real-time
quantification was performed in triplicate samples by SYBR-Green
detection chemistry with Power SYBR-Green PCR Master Mix (Applied
Biosystems) on a 7000 Sequence Detection System. The primers used
were: E-cadherin forward, 5′-GAC ACC AAC GAT AAT CCT CCG A-3′ and
reverse, 5′-GGC ACC TGA CCC TTG TAC GT-3′; ribosomal protein large
P0 (RPLP0) forward, 5′-ACA TGT TGC TGG CCA ATA AGG T-3′ and
reverse, 5′-CCT AAA GCC TGG AAA AAG GAG G-3′.
The following cycling conditions were used: 95°C for
10 min, 40 cycles at 95°C for 15 sec, 60°C for 1 min, 95°C for 15
sec, and 60°C for 15 sec. The average of cycle threshold of each
triplicate was analyzed according to the 2−ΔΔCt
method.
Immunoblot analysis
Cells were collected, washed in 1X PBS, and
resuspended in RIPA buffer, pH 8.0 (150 mM NaCl, pH 8.0; 50 mM
Tris-HCl; 1% Igepal; 0.5% Na-Doc; and 0.1% SDS), 1 mM PMSF, 1 mM
Na3VO4, 1 mM NaF, 2.5 mM EDTA, and 1X
protease inhibitor cocktail (Calbiochem; Merck Millipore) for 30
min on ice. The lysate was centrifuged at 2,300 × g for 10 min at
4°C and the supernatant was used for western blot analysis. Protein
concentration was measured with the Bradford Protein Assay Reagent
(Thermo Fisher Scientific) using bovine serum albumin as a
standard. Thirty micrograms of protein extracts were
electrophoresed through a 10% SDS-polyacrylamide gel and
electroblotted onto PVDF membranes (Merck Millipore). Membranes
were then incubated for 1 h at room temperature with blocking
solution, i.e., 3% low-fat milk in TBST (100 mM Tris, pH 7.5, 0.9%
NaCl, and 0.1% Tween-20), and probed overnight at 4°C with the
monoclonal rabbit E-cadherin primary antibody (1:20,000 in blocking
solution, no. ab40772; Abcam). Horseradish peroxidase conjugated
IgG polyclonal (1:8,000 in blocking solution, no. 12348; Merck
Millipore) was used to detect specific proteins. Immunodetection
was carried out using chemiluminescent HRP substrates (Merck
Millipore) and recorded using an Amersham Hyperfilm ECL (GE
Healthcare). To quantify E-cadherin expression, bands were scanned
as digital peaks and the areas of the peaks were calculated in
arbitrary units using the public domain NIH Image software
(http://rsb.info.nih.gov/nihimage/),
normalized with Ponceau S, and reported as fold induction relative
to controls.
Subcutaneous in vivo model
Panc1 parental cell line and CSCs at three different
dilutions (1×10⁴, 1×10⁵ and 1×10⁶
cells/mice) were s.c. injected into the dorsal flank of five nude
female mice for each condition (5 weeks of age; Charles River
Laboratories, Inc.). For the control groups, mice received 100 μl
injections of 1X PBS. Body mass was recorded weekly for each
animal. Tumor size was monitored weekly in two perpendicular
dimensions parallel to the surface of the mouse using a caliper.
Tumor volume was calculated using the formula of V = π/6 × [(w ×
L)^(3/2)]. Animals were sacrificed at the volume of 2
cm3. Immediately after death, neoplastic masses were
collected for flow cytometry and histological assessment. To
perform flow cytometry analysis, tumor masses were dissociated
enzymatically and mechanically (MACS Dissociation kit; Miltenyi
Biotech) and 5×10⁵ of the obtained cells were
resuspended in 100 μl of RPMI without phenol red (Gibco/Life
Techonologies) and then analyzed with 7-AAD (BD Biosciences) and
with the antibodies described in flow cytometry analysis section.
To perform histological analysis, tissue samples not used in the
cytometry analysis were fixed in 10% (v/v) neutral-buffered
formalin for 24–48 h and were processed routinely. Serial
histological sections (4–6 μm thick) were obtained from each
paraffin block and stained with hematoxylin and eosin (H&E) for
histology assessment. Animal studies were approved by the Verona
University Review Board.
Metastasis in vivo model and optical
imaging (OI) acquisition
Mice were randomly allocated into the two groups
(n=5 mice/group) and were anesthetized with 1.5% isofluorane-air
mixture. As previously described (15), a small left abdominal flank
incision was created, and the spleen was carefully exteriorized.
MiaPaCa2-RFP (1×10⁶) (expressing the red fluorescence
protein) parental cells and CSCs were inoculated into the spleen
with a 30-gauge needle. After 5 min, the spleen was removed using a
high-temperature cautery (Aaron; Bovie Medical Corp.), in order to
avoid the formation of a primary tumor. The abdominal wall was
closed in one layer with wound clips. MiaPaCa2 RFP parental cells
were a kind gift from Professor Turco (University of Fisciano).
Optical images were performed using the IVIS Spectrum optical
imager (Perkin-Elmer). The instrument is equipped with a
charge-coupled device (CCD) camera cooled at −90°C. Images were
collected every 4 days, starting on the 14th day and up to the 36th
day after the cancer cell injection. The image parameters were:
exposure time = 1 sec, binning (B) = 8, diaphragm f/2 and field of
view (FoV) = 19 cm. Four combinations of excitation/emission
filters were used: 535 nm/580 nm, 535 nm/600 nm, 535 nm/620 nm and
570 nm/620 nm. The last combination showed the best signal to
background ratio, thus the reported results refer to this modality.
The measures were done on regions of interest (ROIs) traced on the
optical images. During the acquisitions the animals were
anaesthetized with 1.5% isofluorane-air mixture and placed on the
heated stage of the optical device. Animal studies were approved by
the Verona University Review Board.
Statistical analysis
ANOVA (post hoc Bonferroni) analysis was performed
by GraphPad Prism 5 (GraphPad Software, Inc.). P-values <0.05,
0.01, or 0.001 show significant difference.
Results
The ability of PDAC cell lines to form
tumorspheres and to reconvert to the adherent phenotype
In order to evaluate whether PDAC cell lines were
able to dedifferentiate into cancer stem-like cells, we cultured
nine PDAC cell lines (PaCa44, HPAF-II, PT45P1, CFPAC1, PSN1, PC1J,
PaCa3, Panc1, MiaPaCa2), and one normal primary pancreatic
mesenchymal cell line (VIT-1) in a selective medium containing EGF,
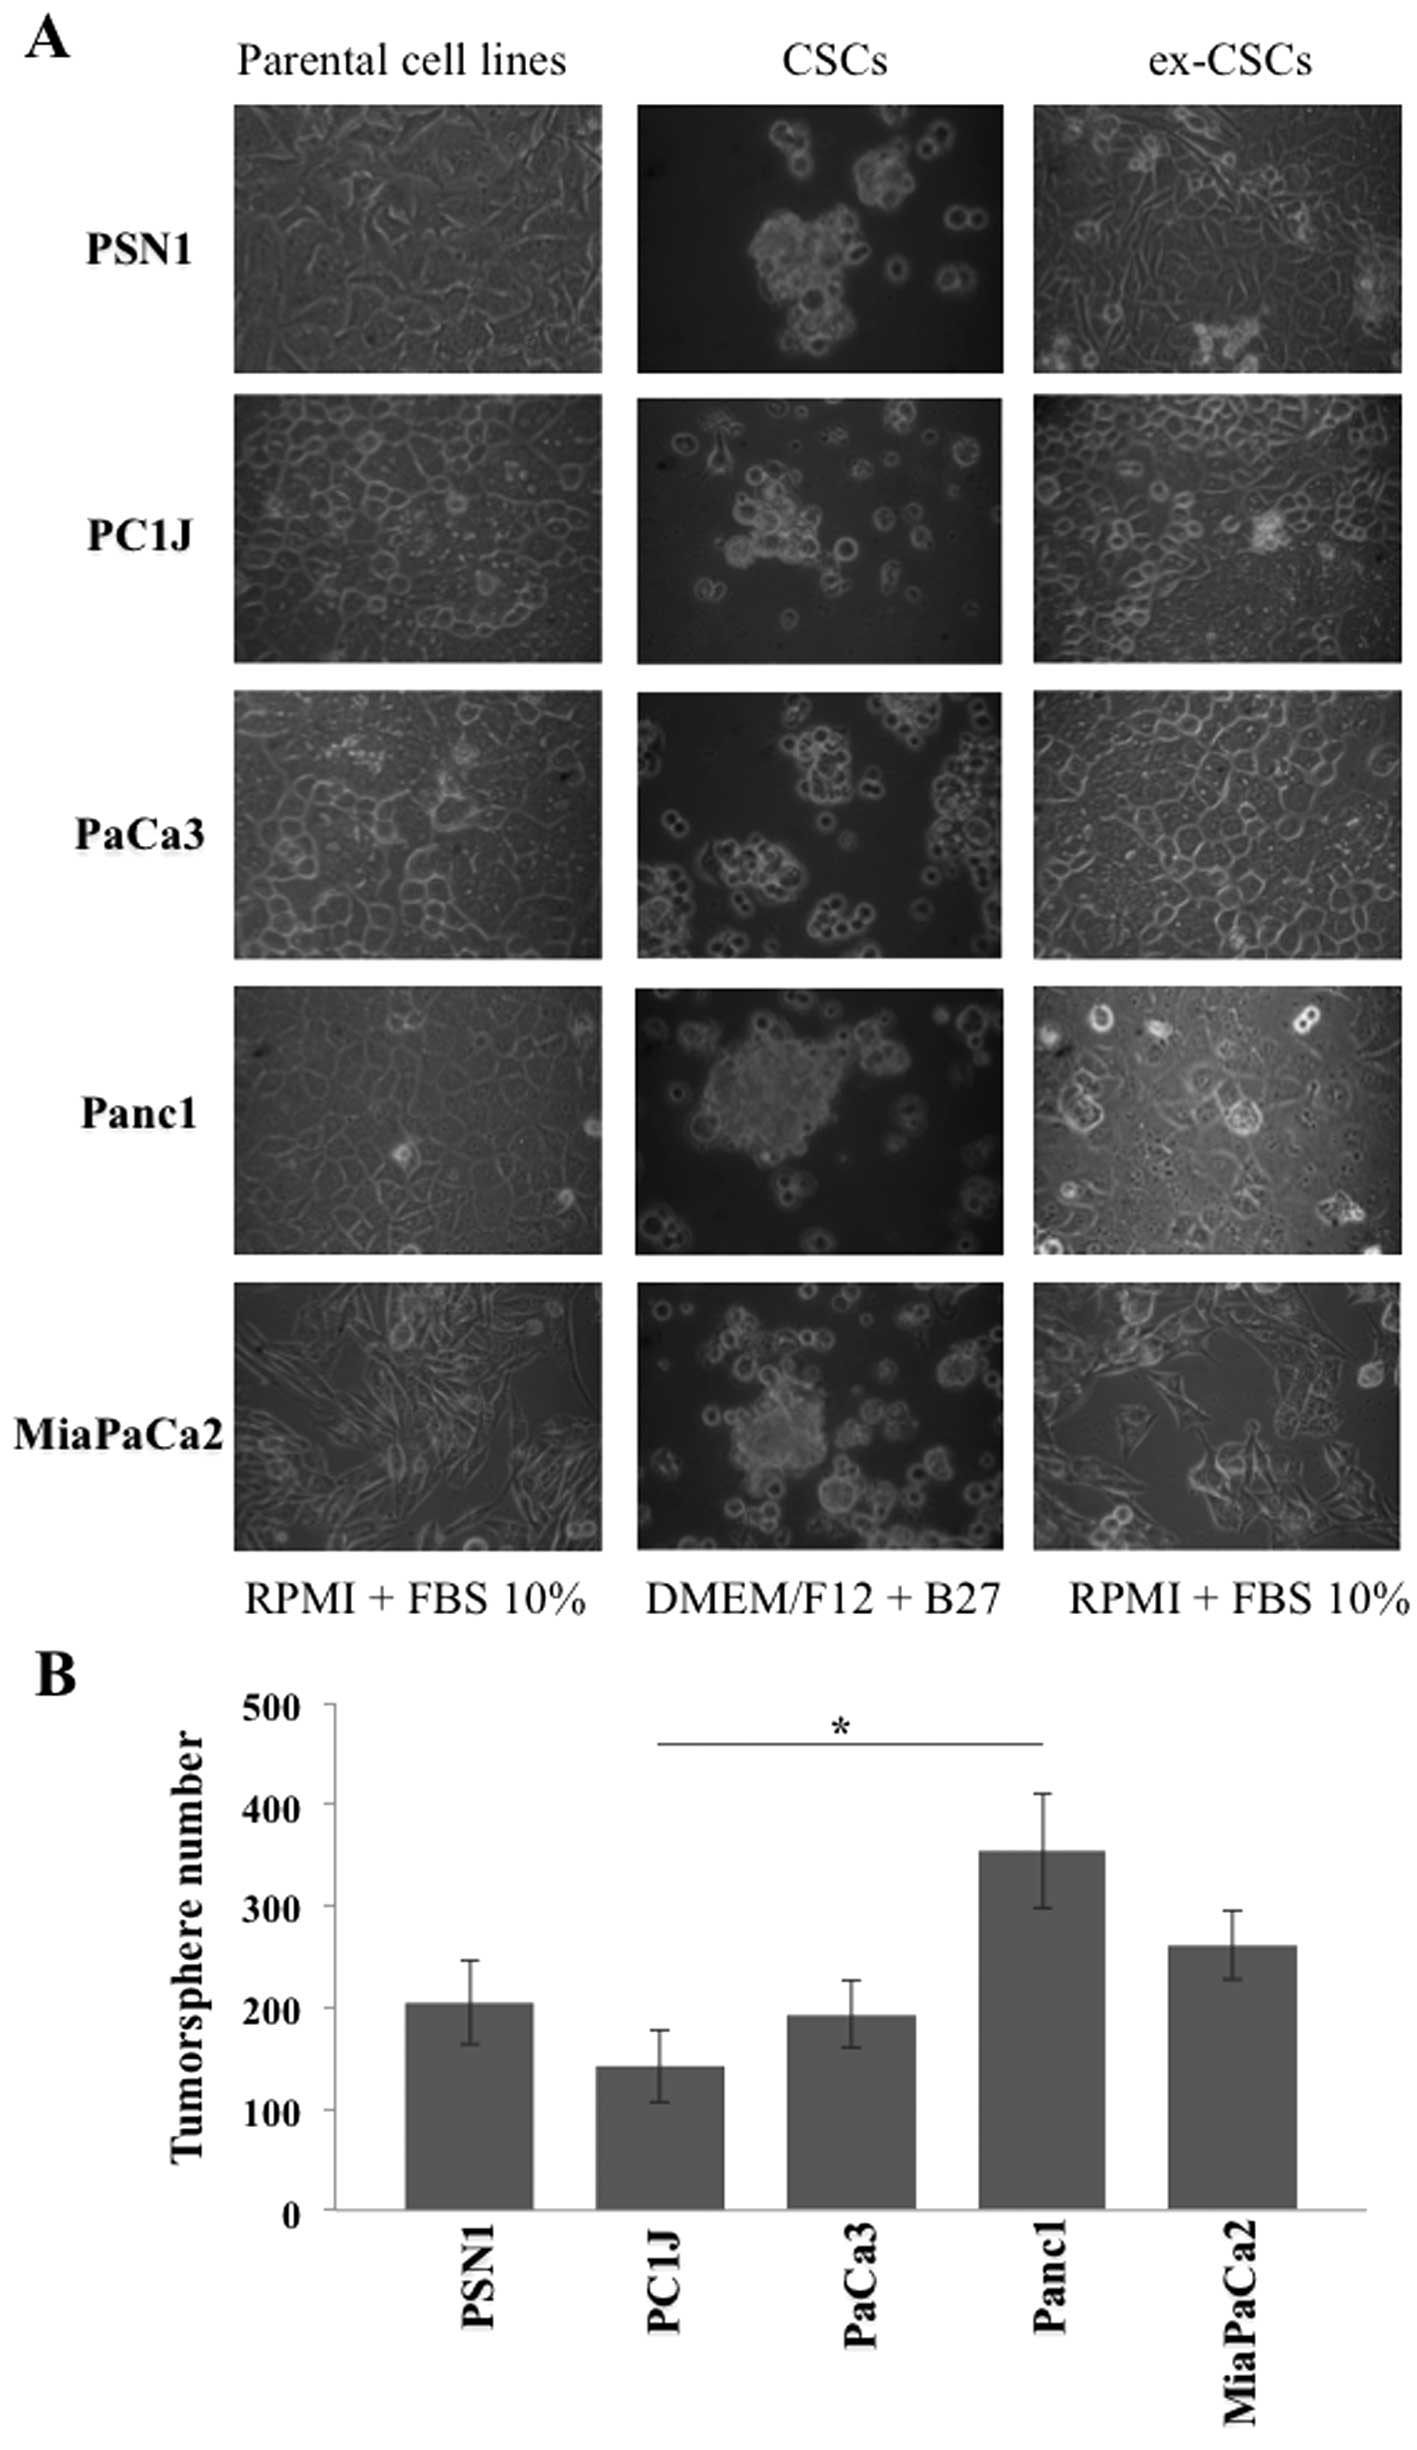
FGF, and low glucose (1 g/l). Only five of them, all of tumoral
origin (PSN1, PC1J, PaCa3, Panc1, MiaPaCa2), lost their
characteristic epithelial morphology and were able to form
tumorspheres after 1–3 weeks of culturing (Fig. 1A), preserving the undifferentiated
state throughout numerous cycles of cell division. The CFPAC1 cell
line was able to form tumorspheres, which however died after the
first cell division. The remaining cell lines maintained their
epithelial morphology or died, even when they were grown in diverse
media, used to obtain CSCs from other tumor types. In order to test
the in vitro capacity to form spheres, we counted the number
of tumorspheres of PSN1, PC1J, PaCa3, Panc1 and MiaPaCa2 after 5
days of incubation (Fig. 1B).
Interestingly, Panc1 cancer stem-like cells showed a 2-fold higher
tumorsphere-forming ability relative to the least active PC1J
cancer stem-like cells. As expected, parental cell lines grown in
RPMI-1640 supplemented with FBS did not show any
tumorsphere-forming ability (data not shown). PDAC cancer stem-like
cells were able to re-differentiate into adherent cells (ex-CSCs)
re-acquiring epithelial morphology after 2–7 days of culturing in
RPMI medium supplemented with FBS (Fig. 1A).
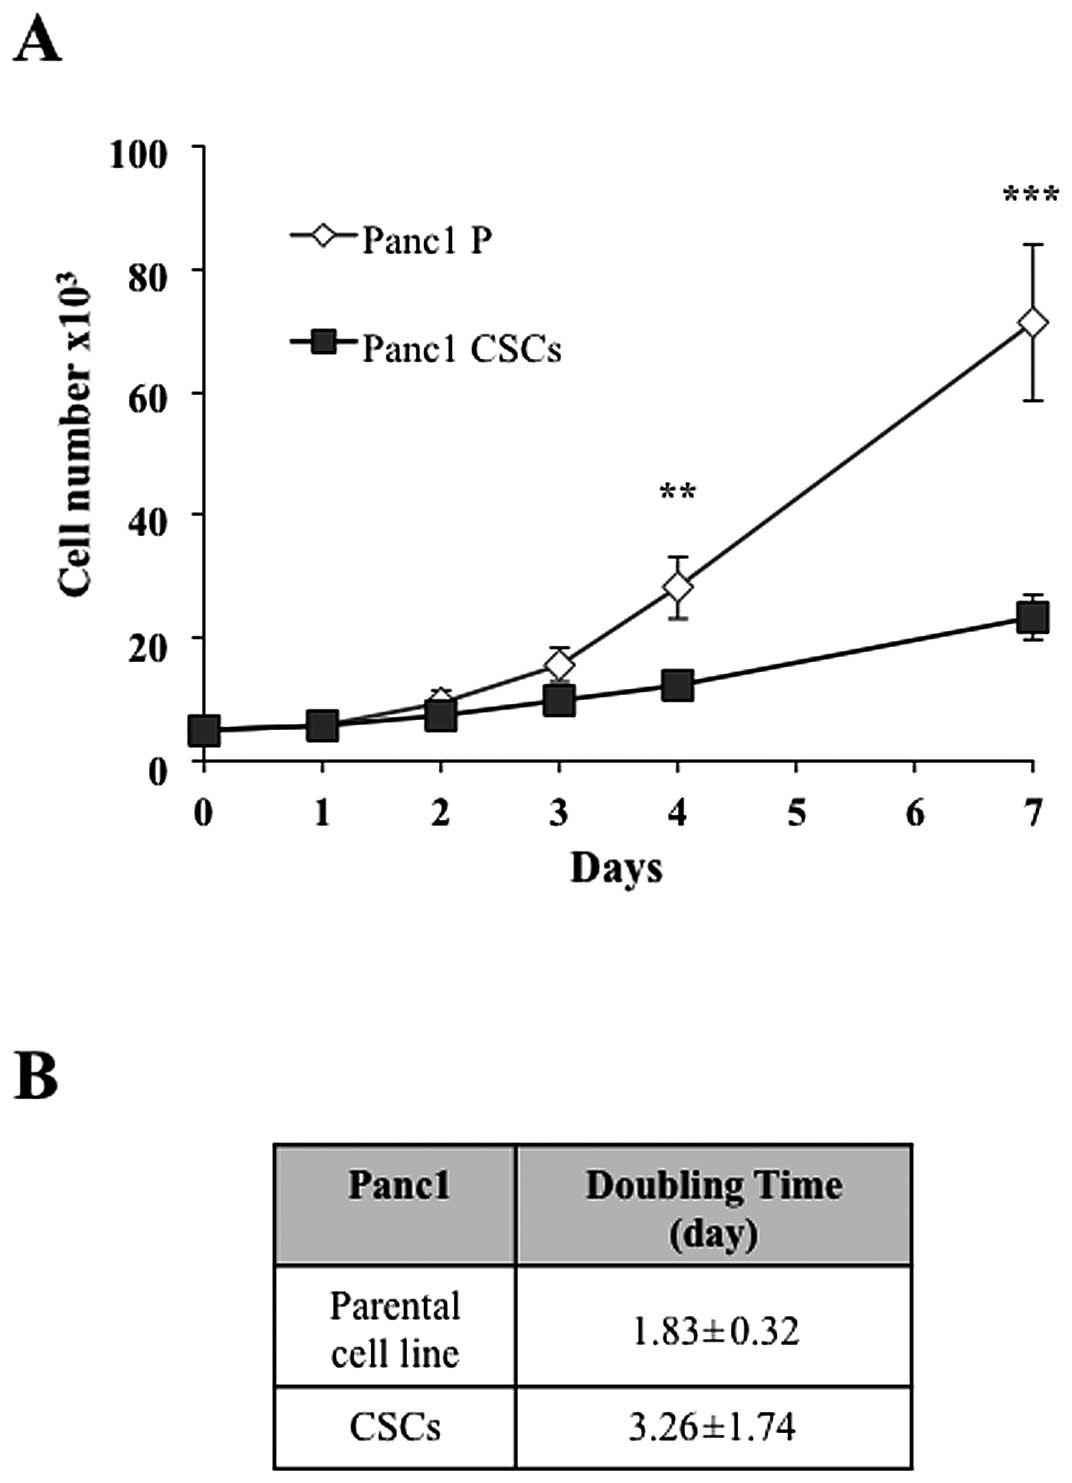
To evaluate the effect of the phenotypic
transformation from epithelial to sphere morphology on cell growth,
we measured the proliferation time of Panc1 cancer stem-like cells
compared to the parental cell line and we observed that the
doubling time was 3.26 and 1.83 days, respectively (Fig. 2A and B), suggesting a significant
alteration of the mechanisms regulating the metabolic and cell
division pathways.
Increased resistance of cancer stem-like
cells to chemotherapeutic agents
Since it is known that CSCs are more resistant to
chemotherapeutic treatments, to compare the chemosensitivity of the
parental cell lines and the corresponding cancer stem-like cells,
we evaluated the anti-proliferative activity of a panel of five
anticancer compounds, gemcitabine (pyrimidine nucleoside analogue,
gold standard treatment for PDAC), ti pifarnib (farnesyl
transferase inhibitor), sorafenib (multi-kinase inhibitor),
everolimus (mTOR inhibitor), and zoledronic acid (farnesyl
diphosphate synthase inhibitor). We treated PSN1, PC1J, PaCa3,
MiaPaCa2, Panc1 parental cells, the corresponding cancer stem-like
cells, and ex-CSCs for 72 h with the compounds and we determined
the IC50 values, which are shown in Table I. These data indicated that cancer
stem-like cells, in particular those obtained from PaCa3 and Panc1
cell lines, were more resistant to the action of the anticancer
drugs than parental cell lines and that four out of five cancer
stem-like cells were more resistant to the action of sorafenib than
parental cell lines. Furthermore, ex-CSCs showed IC50
values statistically comparable to those of parental cells for all
the drugs.
 | Table IIC50 ± SEM values at 72 h
in CSCs, parental cell lines and ex-CSCs. |
Table I
IC50 ± SEM values at 72 h
in CSCs, parental cell lines and ex-CSCs.
|
IC50 | Gemcitabine
(μM) | Tipifarnib
(μM) | Sorafenib (μM) | Everolimus
(μM) | Zoledronic acid
(μM) |
|---|
| PSN1 |
| CSC | >2.5a | 3.1±2.7a | 20±3.9a | 8.2±0.3 | >500a |
| Parental cell
line | 1±0.13 | 17±2.5 | 2.4±0.05 | 7.9±1.3 | 395±57 |
| ex-CSC | 1.1±0.15 | 11.8±0.71 | 4.7±0.34 | 13.8±3.6 | 455±64 |
| PC1J |
| CSC | >5 | 16±0.6 | 18.9±0.55a | 15.7±0.4 | 87±4.1a |
| Parental cell
line | >5 | 20.5±3.3 | 10±1.2 | 15.7±0.3 | >250 |
| ex-CSC | >5 | 23±0.83 | 13.7±1.3 | 18±1.3 | >250 |
| PaCa3 |
| CSC | 2.5±0.78 | 9.3±2.5a | >25a | 17.9±0.9a | 80±31 |
| Parental cell
line | 3.5±0.24 | 1±1.5 | 12.6±3.1 | 9.6±0.8 | 45±26 |
| ex-CSC | 3.4±0.58 | 2.8±0.61 | 13.4±3.2 | 9.9±1.3 | 62±71 |
| MiaPaCa2 |
| CSC | 4.8±0.82 | 16.8±1.7 | 10.3±1.6 | 11.5±3.3 | 80±17a |
| Parental cell
line | 5±0.74 | 18.4±1.2 | 8.6±1.1 | 15.3±0.8 | >500 |
| ex-CSC | >5 | 16±1.3 | 8.2±0.95 | 15.8±0.26 | >500 |
| Panc1 |
| CSC | >5 | >25a | 24±0.8a | 20±1.6a | 237±97 |
| Parental cell
line | >5 | 17.5±0.89 | 8.5±0.7 | 11.6±1.6 | 250±87 |
| ex-CSC | >5 | 19.7±2.7 | 15.7±3.0 | 18.8±1.7 | >250 |
Increased expression of EpCAM and CD44v6
on cancer stem-like cells
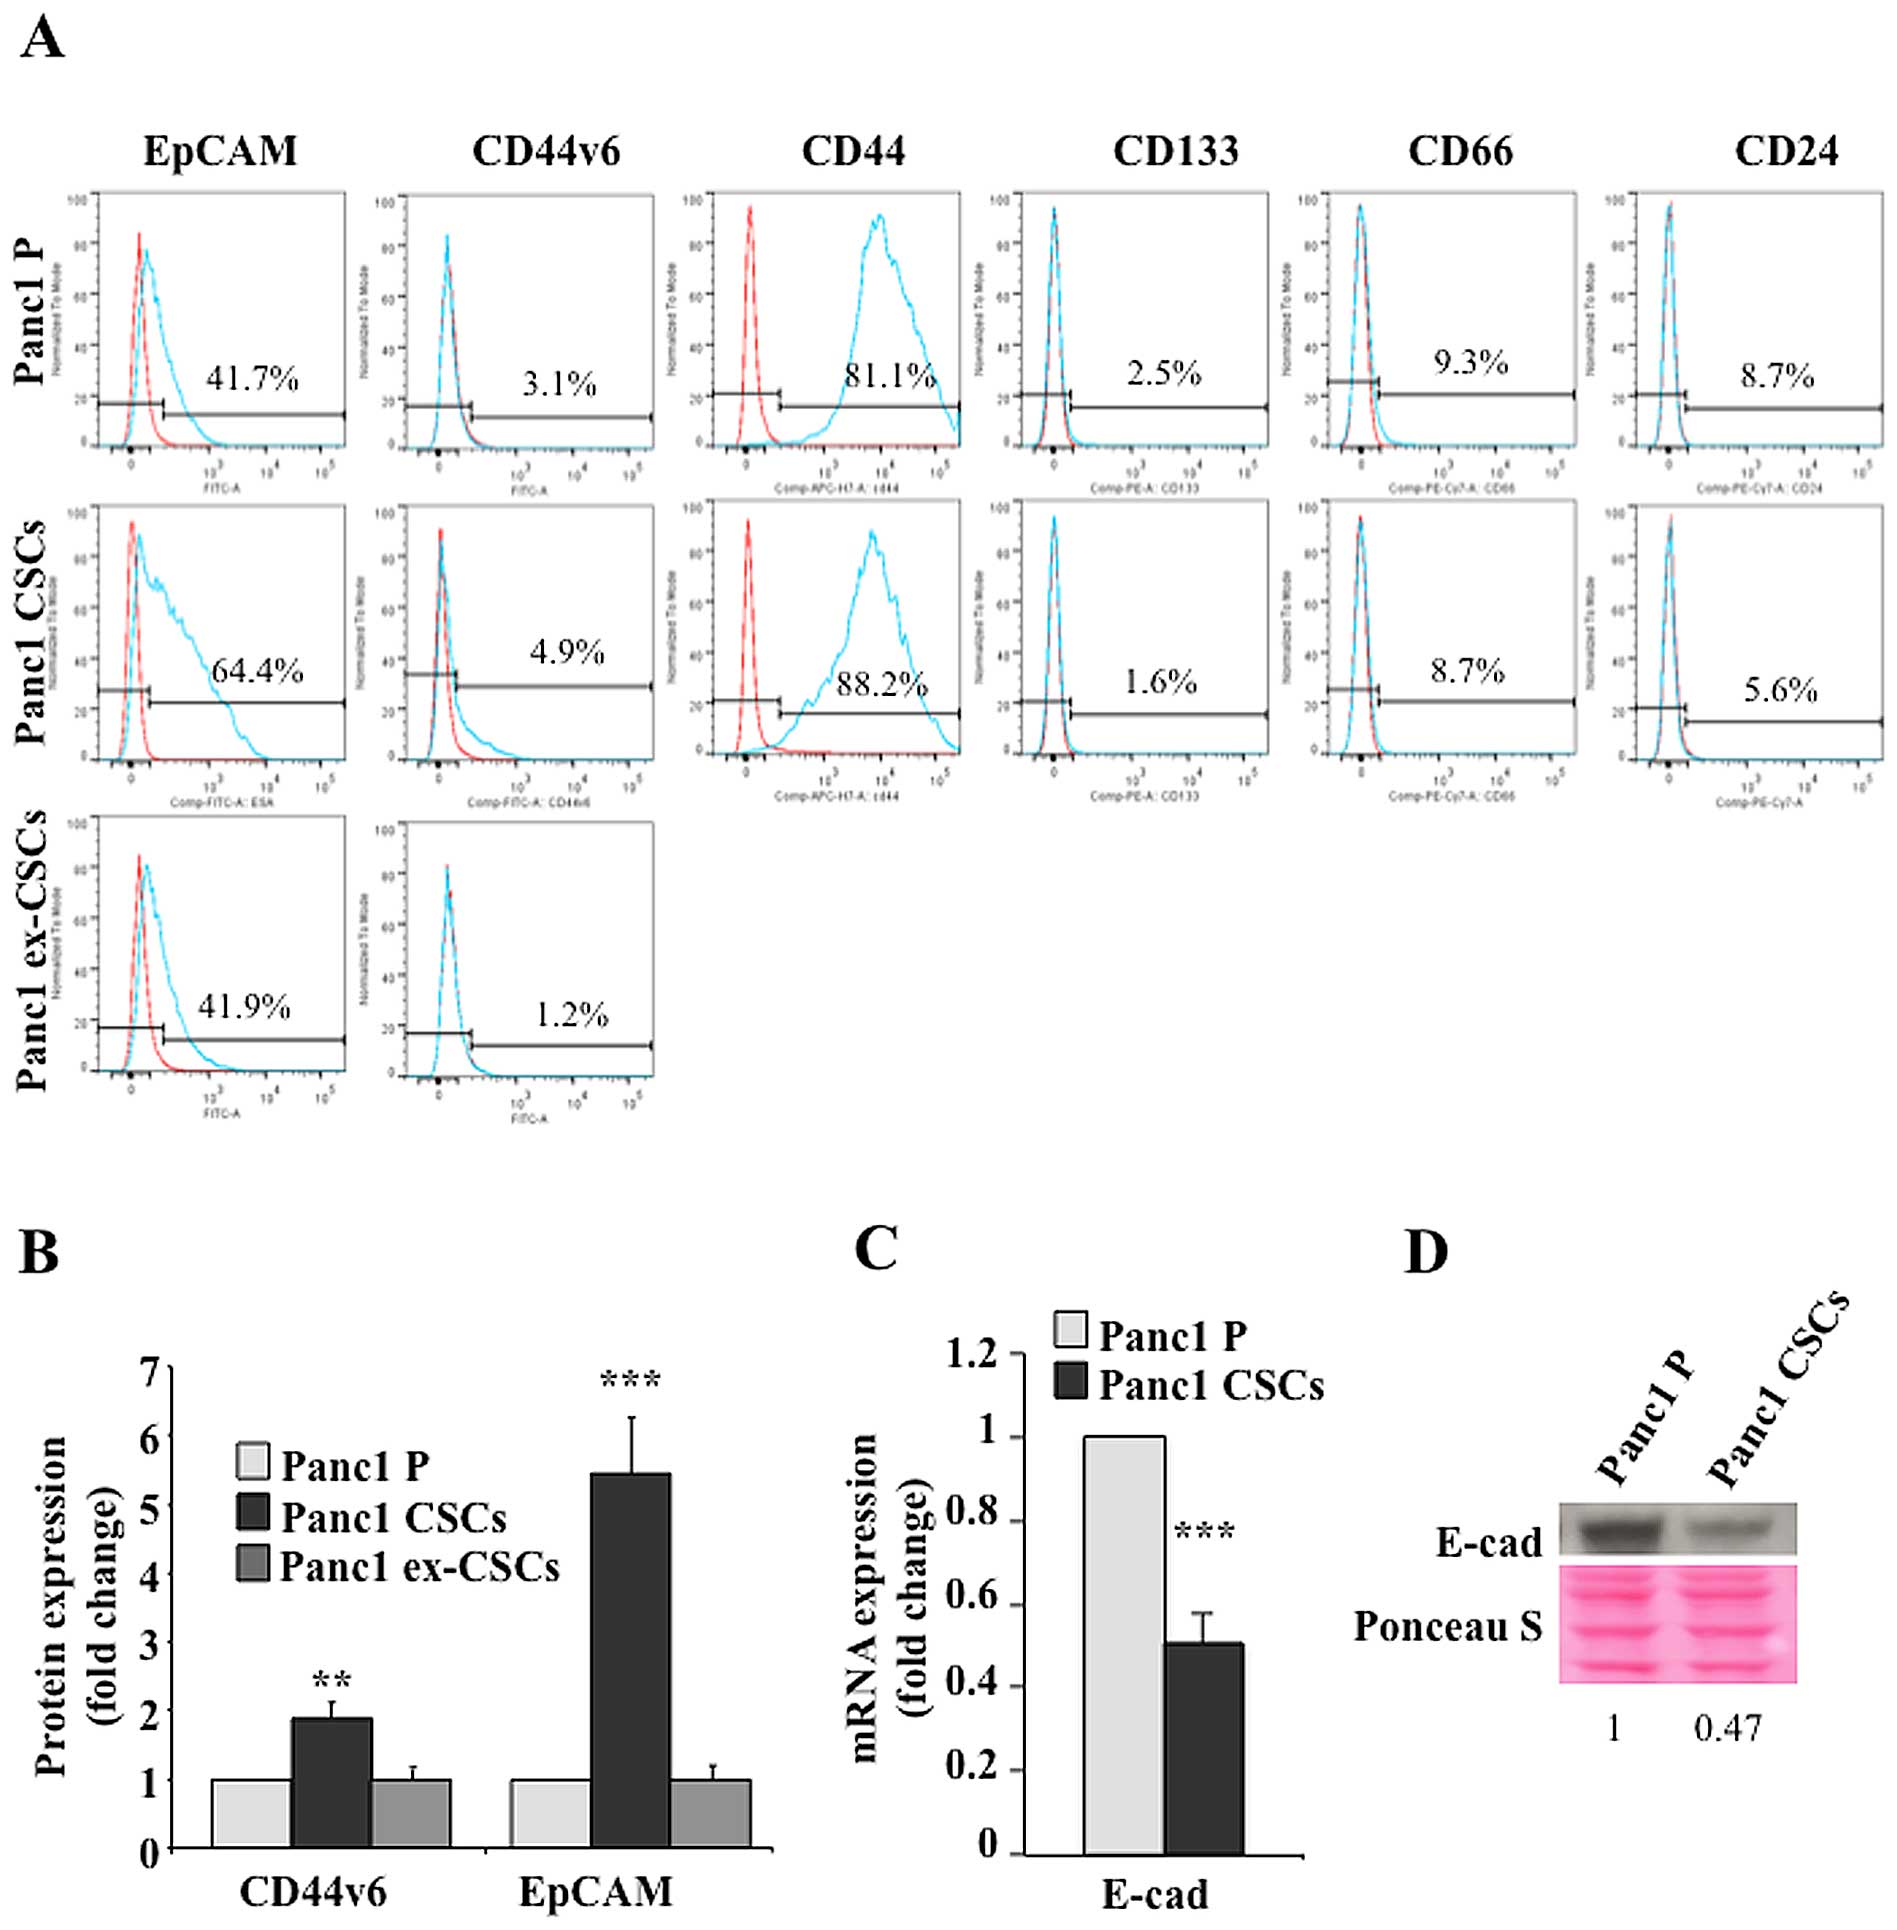
We characterized Panc1 cancer stem-like cells for
the expression of various typical surface stem cell markers. The
percentage of cells expressing EpCAM, CD44v6, CD44, CD133, CD66,
and CD24 was determined in comparison to the parental cell line
(Fig. 3A). As shown in Fig. 3B, EpCAM and CD44v6 expression
increased 5- and 2-fold, respectively, in Panc1 cancer stem-like
cells with respect to the corresponding parental cells. CD44 was
expressed on parental cell line surface at high level and did not
increase in cancer stem-like cells. CD133, CD66, and CD24 were
expressed at low levels in both Panc1 parental and cancer stem-like
cells.
In order to evaluate whether in the transition
non-CSC to CSC the Panc1 cancer stem-like cells were subjected to
EMT, we analyzed the expression of E-cadherin, the main marker of
the epithelial state (14,16). Fig. 3C
and D shows that E-cad decreased about 2-fold, both at mRNA and
protein levels, in Panc1 cancer stem-like cells in comparison to
the parental cell line. Taken together, all the above results
strongly suggest that cells derived from PDAC cell lines by using
the CSC selective medium possess CSC features, both phenotypically
and genotypically.
Re-differentiation of PDAC CSCs into adherent cells
(ex-CSCs), morphologically observed in Fig. 1A, was associated with the
re-establishment of the marker expression level measured in
parental cells (Fig. 3A and
B).
CSC tumorigenicity and stem cell marker
expression in nude mice
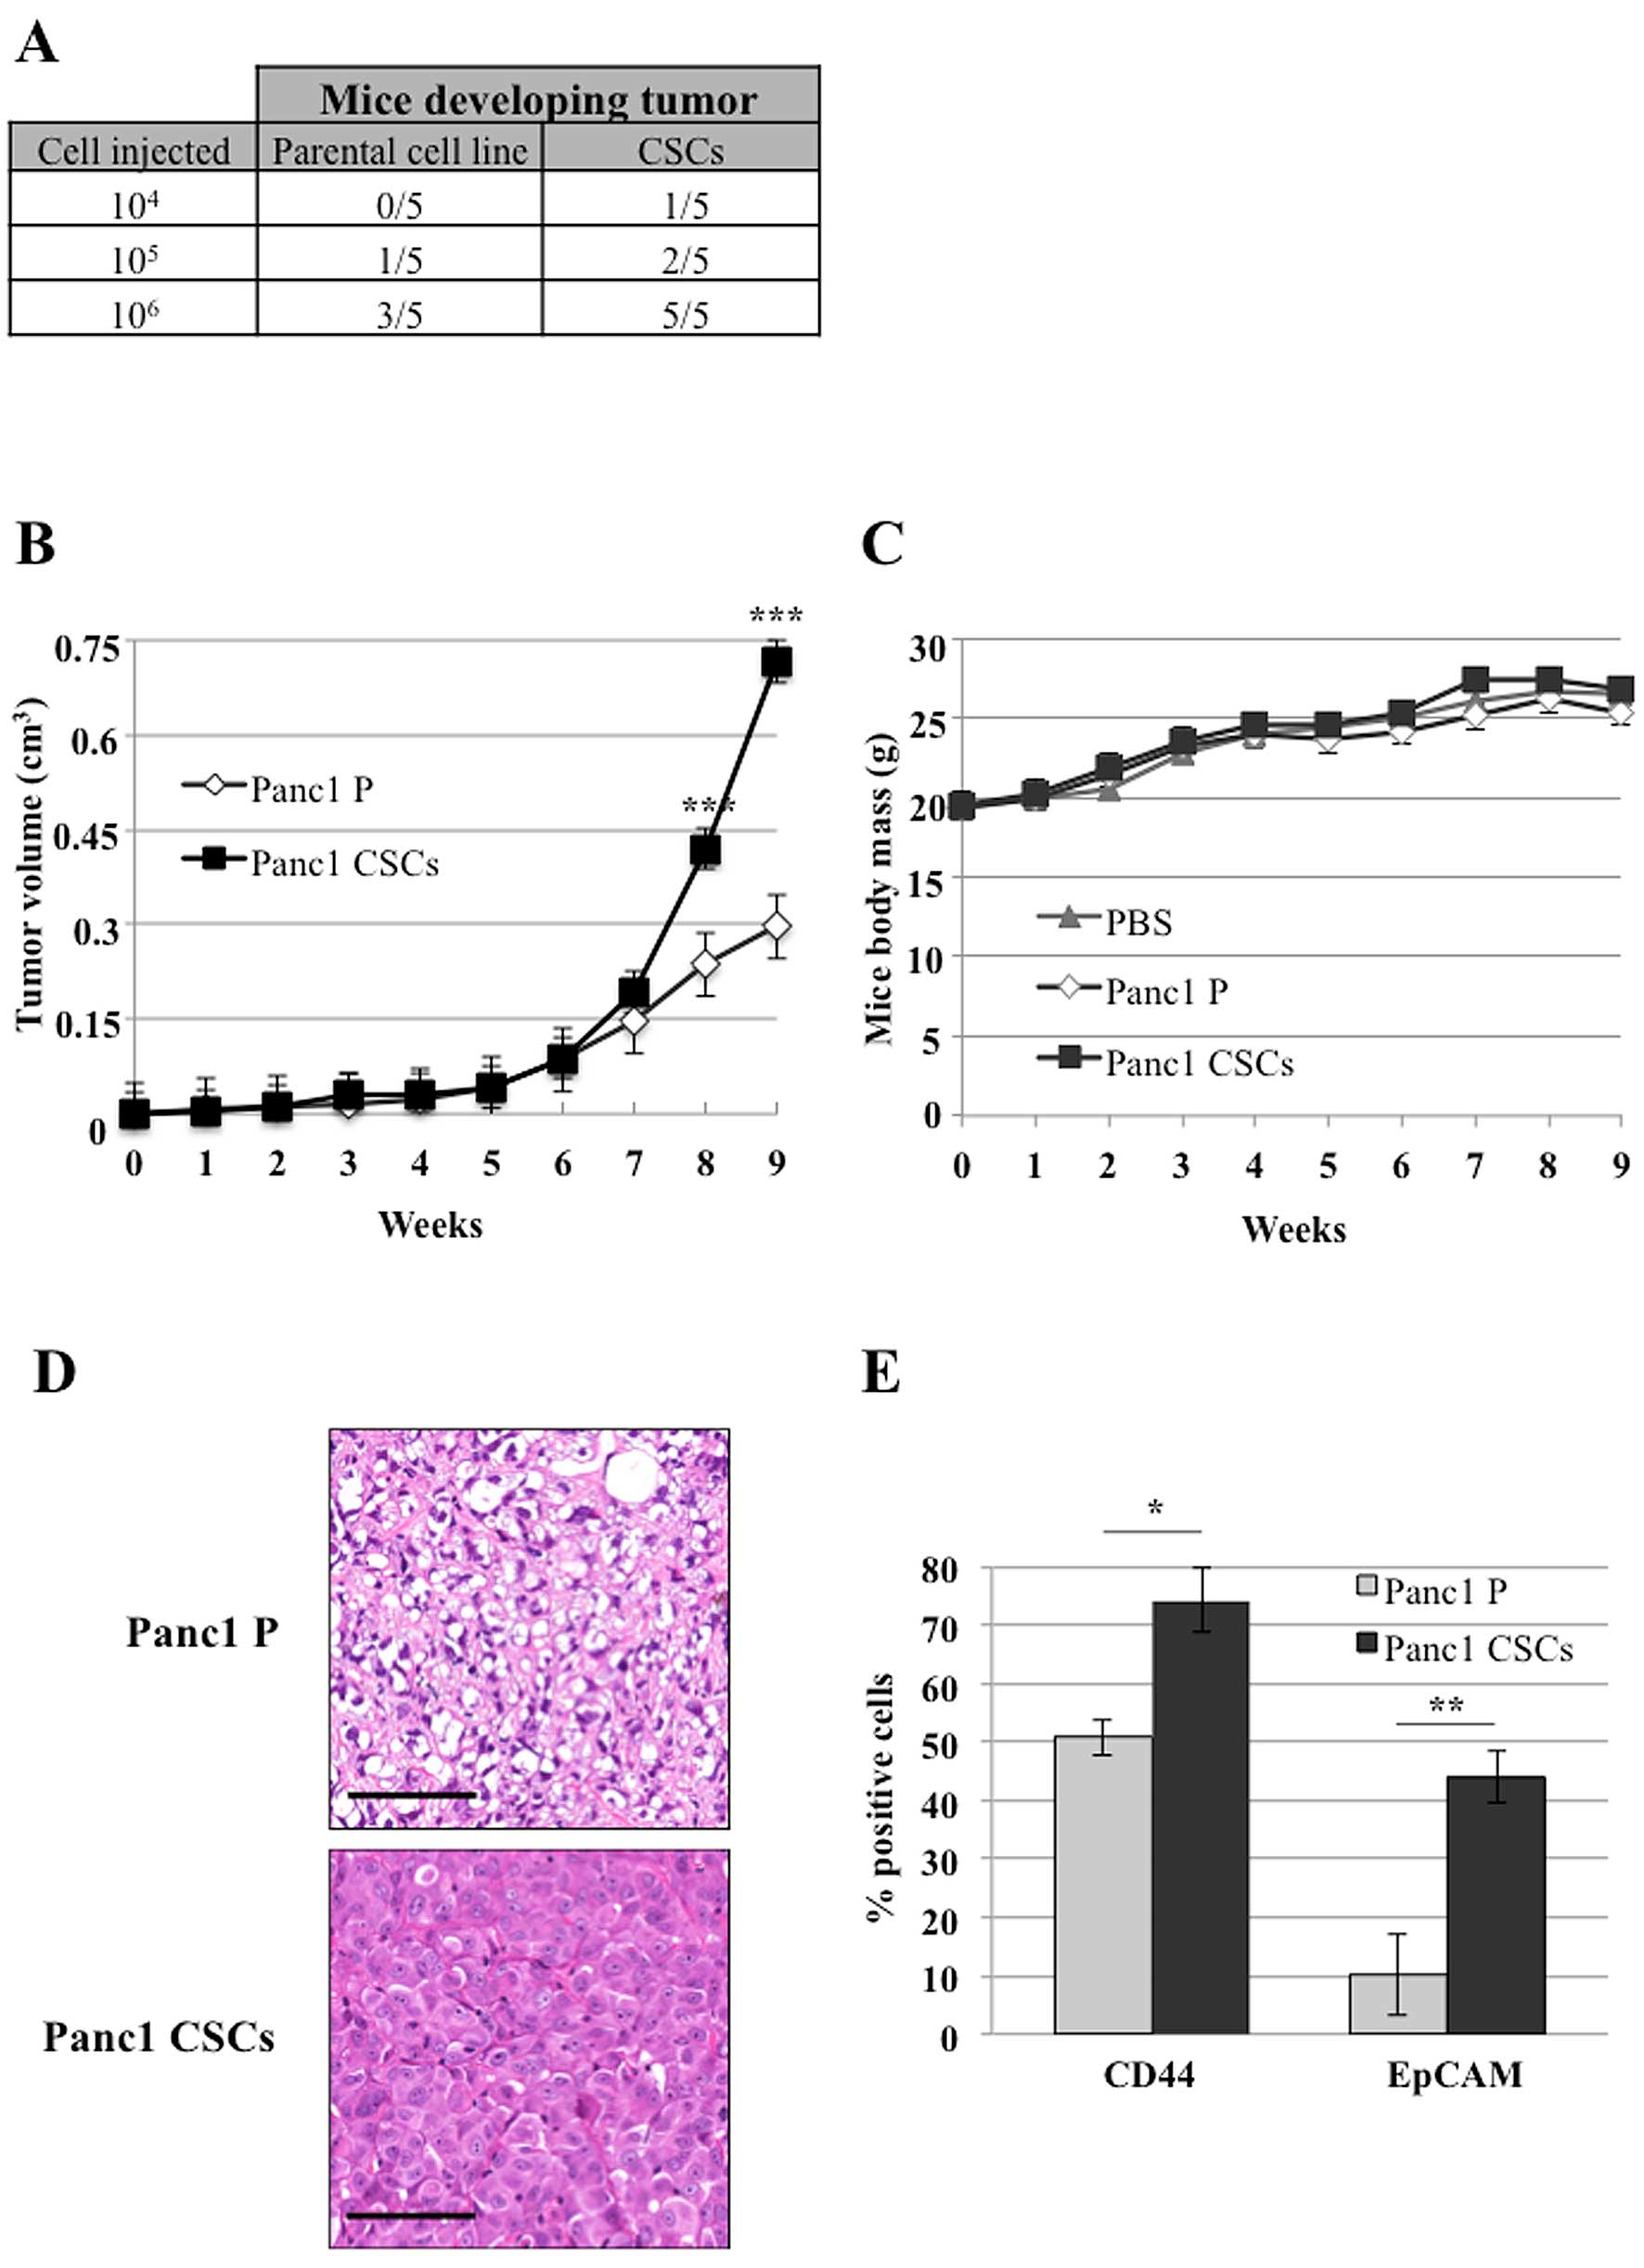
To evaluate the tumor-initiating capabilities of
pancreatic CSCs in vivo, Panc1 CSCs and the parental cell
line (1×10⁴, 1×10⁵ and 1×10⁶
cells/mouse) were subcutaneously injected into nude female mice and
the tumor size was monitored weekly. Fig. 4A shows that Panc1 CSCs possessed an
increased tumor-seeding ability compared to the parental cell line.
Furthermore, 1×10⁶ Panc1 CSCs generated a larger tumor
than the parental cell line (Fig.
4B) without influencing the body mass of mice (Fig. 4C). Histological assessment of tumor
tissues revealed that CSC tumors were composed by a homogeneous
population of cancer cells characterized by small nuclei, evident
nucleoli and oncocytic cytoplasm, whereas parental cell tumors were
constituted by a heterogeneous population of cells with
clear/lipoblast-like features (Fig.
4D). No significant differences were observed concerning tumor
necrosis or its distribution.
To evaluate whether injected CSCs maintained stem
cell marker expression in vivo, we analyzed the expression
levels of all the surface markers tested in vitro (Fig. 3A) on cells obtained by dissociating
the tumor masses. Fig. 4E shows
that EpCAM and CD44 were expressed in a higher percentage of cells
dissociated from CSC tumors, in comparison to parental cell tumors.
These results suggest that CSCs are more tumorigenic than parental
cells and, even when subcutaneously injected in mice, tend to
maintain morphologic and molecular differences.
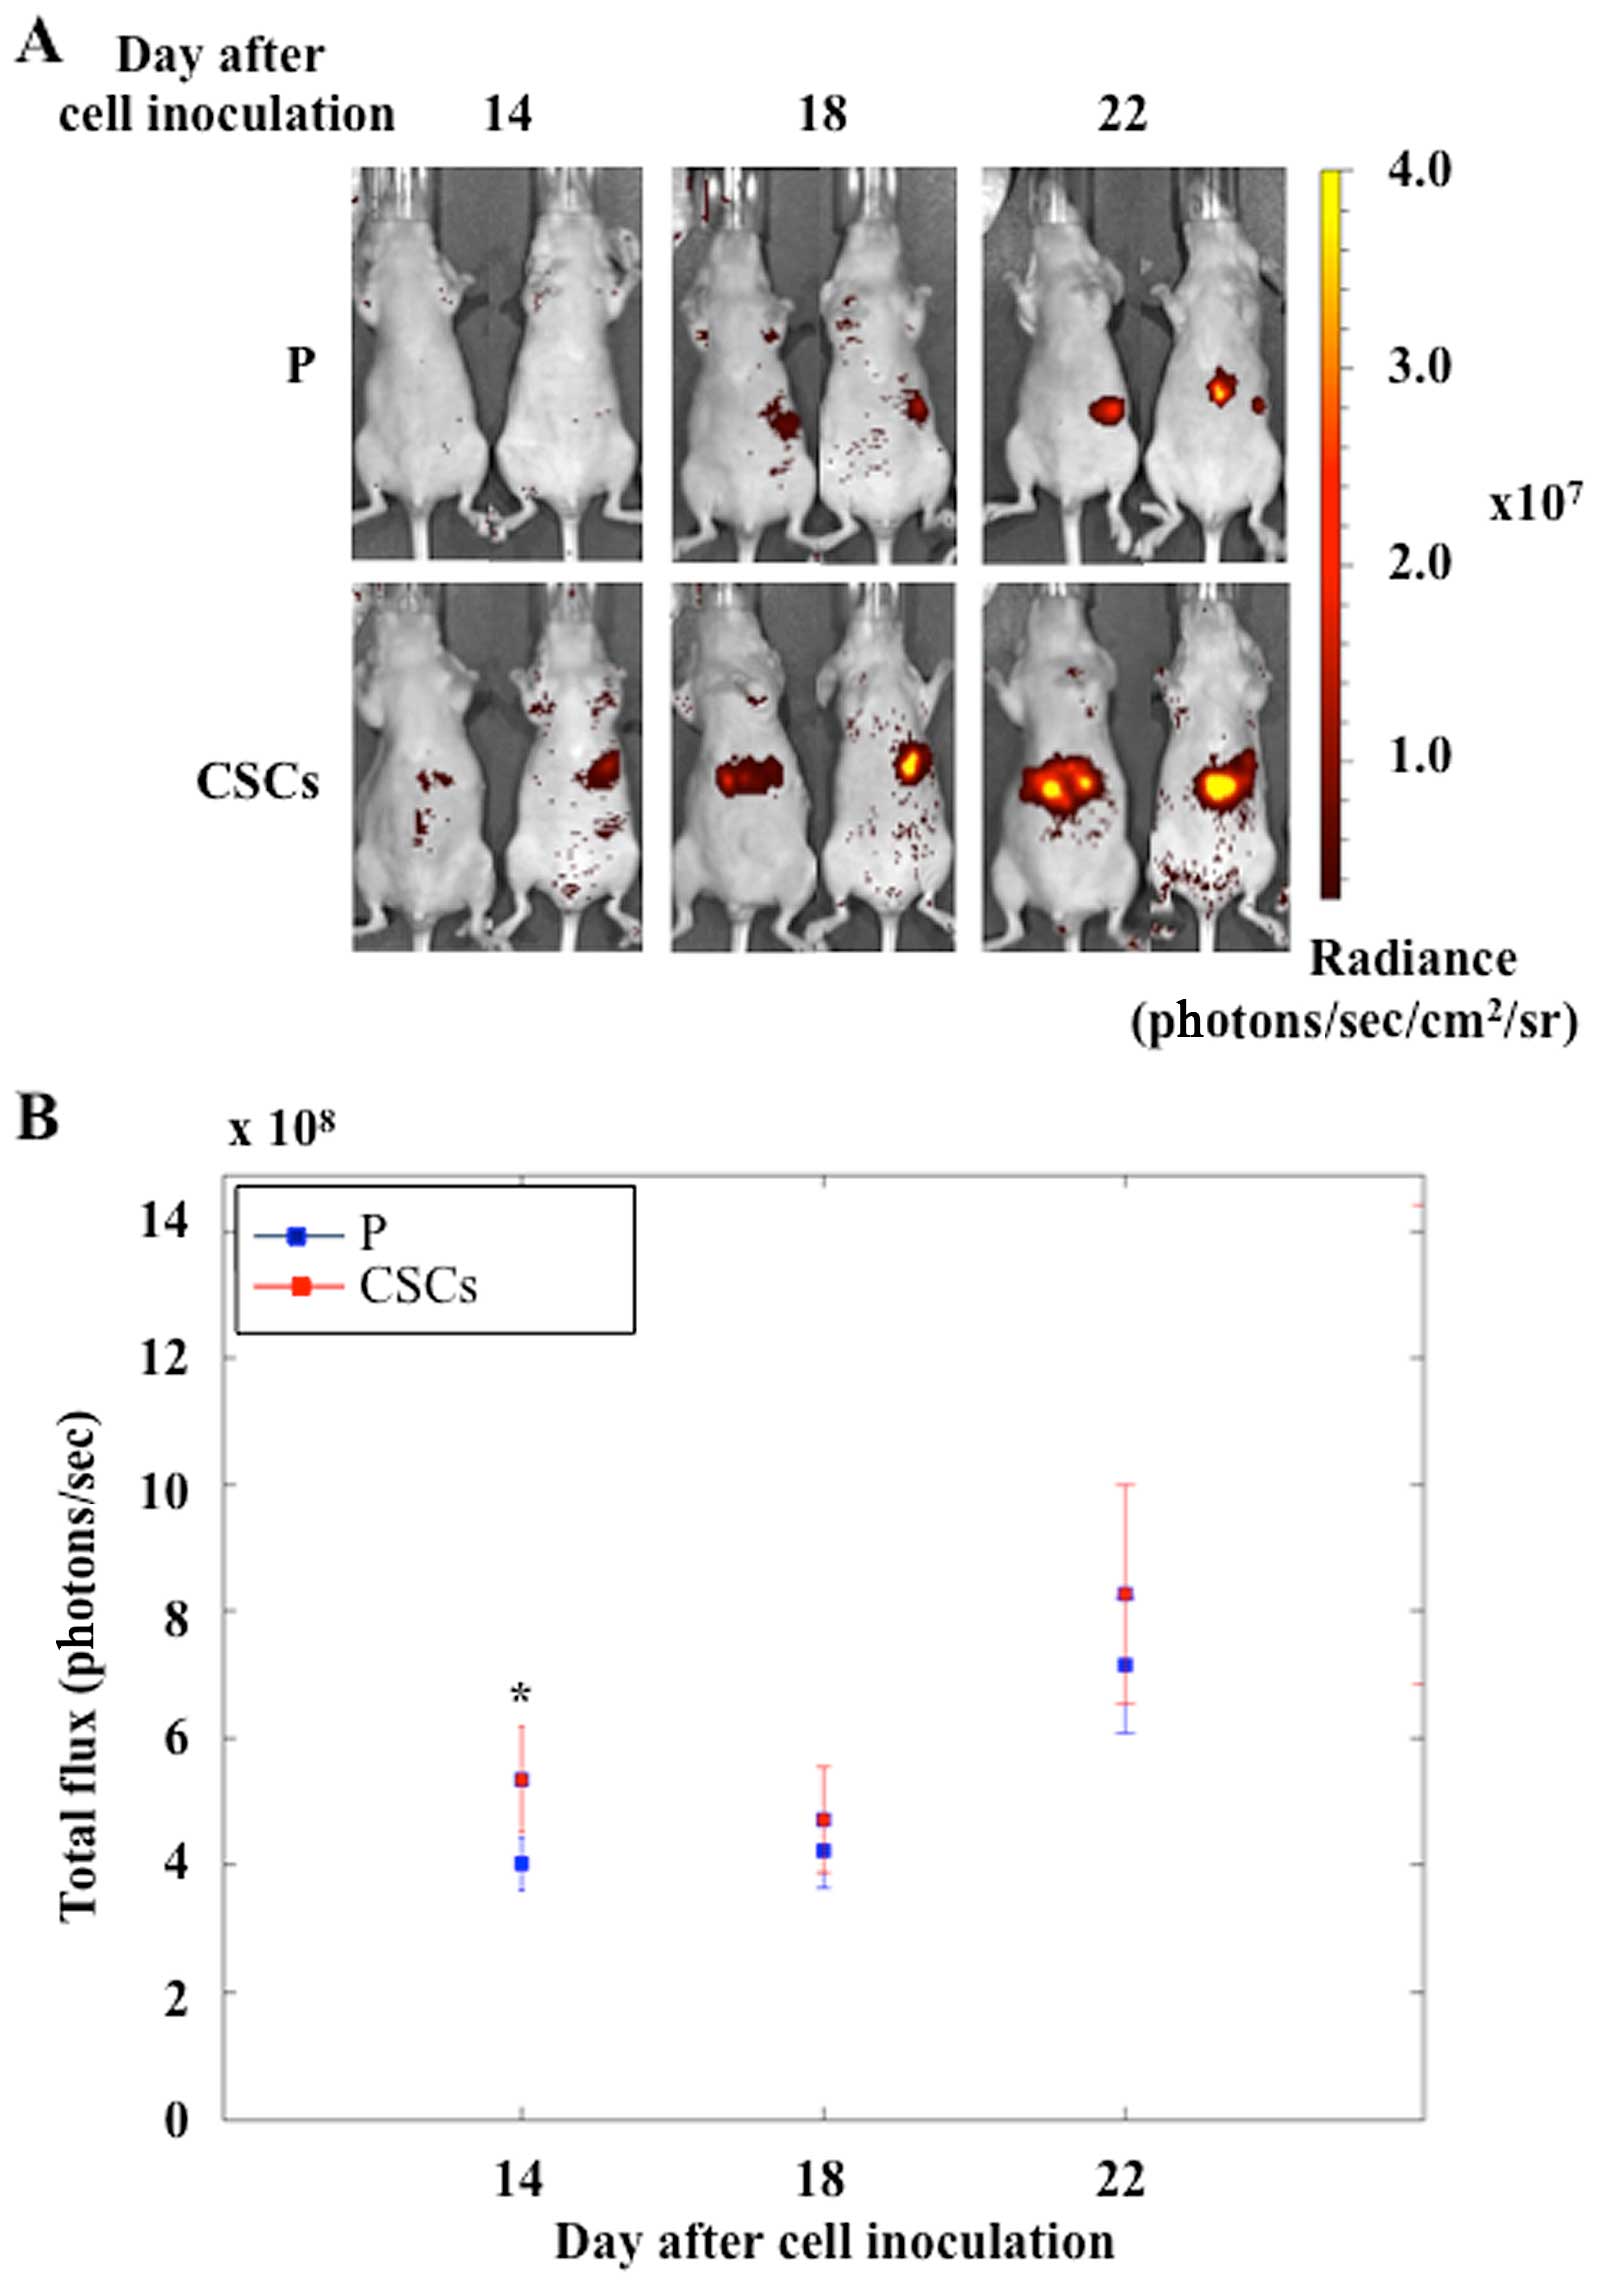
To evaluate the metastatic activity of pancreatic
CSCs, we used an in vivo model of nude mice by injecting
fluorescent cells (MiaPaCa2-RFP, as in Materials and methods) into
the spleen. The growth of both parental and CSCs was evaluated and
the optical images acquired at 14, 18 and 22 days after cell
injection are shown in Fig. 5A.
CSC metastases were well-detectable at the first time point,
whereas parental metastases were detectable 4 days later. As shown
in Fig. 5B, the total flux of the
emitted visible light increased in both experimental groups. At all
the three time points, CSC metastases showed a higher mean light
emission with respect to parental metastases, but only at the 14th
day the difference was statistically significant.
Discussion
Many studies have identified subpopulations of cells
within tumors that drive tumor growth and recurrence, termed CSCs.
These cells are resistant to the majority of current cancer
treatments, including radiation and chemotherapy, suggesting that
most of the cancer therapies, while killing the bulk of tumor
cells, may ultimately fail because they do not eliminate CSCs,
which survive to regenerate new tumors. Consequently, the
development of a reliable model of CSCs becomes crucial for basic
and clinical cancer research.
Several techniques have been used to isolate CSCs
from cancers (17,18). Initially, specific surface markers,
previously identified in normal stem cells, were used to isolate
CSCs (4,19). However, the observation that stem
cell marker-negative cells were also able to grow as spheres and to
give rise to very aggressively growing tumors in vivo did
not allow reaching a consensus on the best marker to be used for
the identification of CSCs in any particular cancer (20). Other methods used to isolate CSCs,
such as sorting the side populations of cancer cells via
intracellular Hoechst 33342 exclusion (17,21,22)
or selecting the chemotherapeutic drug-resistant cells (23), yield only a small number of CSCs,
which is inadequate for further biochemical experimentation. Recent
studies have demonstrated that several cell lines can be enriched
in spheres with stem-like features when cultured in serum-free
medium supplemented with adequate growth factors (5,10–12,24).
In the current study, we first established the
ability of several pancreatic cell lines to form spheres with the
aim to correlate this ability to cell resistance to several
chemotherapeutic agents. We found that only five out of nine PDAC
cell lines had the capacity to form spheres after 1–3 weeks of
culturing in a selective medium and the remaining cell lines were
unable to form spheres even in other stem cell media. Panc1 cells,
described as particularly resistant to gemcitabine (25,26),
had the highest sphere-forming activity. Interestingly, the
capacity to form spheres was independent of the nature of the
tumor, whether primary or metastatic, from which each cell line
originated (27). As expected, the
normal primary pancreatic mesenchymal cells, VIT-1, did not give
rise to spheres. PDAC CSCs were able to regain the epithelial
morphology and marker expression of parental cells after only 1
week of culturing in RPMI medium supplemented with FBS.
Furthermore, Panc1 CSCs and the parental cell line had a doubling
time of 3.26 and 1.83 days, respectively. These latter two findings
strongly support a plastic CSC model, in which non-CSCs can
re-acquire a CSC phenotype and that this bi-directional conversion
is a common and essential component of tumorigenicity (3,8,13,20).
Evidence of enhanced therapeutic resistance to CSCs
has been reported (17,18,28).
In our study, we demonstrated that PDAC CSCs were generally more
resistant than parental cells to several drugs and that ex-CSCs
show sensitivity similar to parental cells. Differences among the
cell types are likely ascribable to specific gene expression
profiles, which will be analyzed in future studies. Notably, Panc1
CSCs further increased drug resistance compared to the parental
cell line.
Several surface markers have been used to identify
and isolate CSCs, including CD24 (29), CD66 (30), CD133 (31), CD44 (29), and EpCAM (29). However, none of them seems to
univocally identify CSCs. Our flow cytometry data showed that EpCAM
and CD44v6 expression increased in Panc1 CSCs in respect to the
parental cell line, while CD133, CD66, and CD24 were lowly and CD44
was highly expressed on both cell types. This latter result
correlates with the observations that CD44 plays a role in drug
resistance (32,33) and that Panc1 are highly resistant
to several chemotherapies (26).
When subcutaneously injected in nude mice, Panc1
CSCs developed larger tumor masses composed by a homogeneous
population of cancer cells characterized by larger size compared to
the heterogeneous population generated by parental cells. This
result suggests a significant alteration of the mechanisms
regulating the metabolic and cell division pathways. Interestingly,
the tumor masses originated from CSCs and parental cells show a
decreased expression of EpCAM and CD44 compared to the cells
analyzed in vitro. This reduction was higher for the
parental cells, suggesting that the in vivo subcutaneous
environment has a higher differentiating activity on these cells.
CSC metastasis obtained by injecting fluorescent cells into the
spleen of nude mice showed higher mean values of light emission
with respect to parental metastasis. These results further support
the higher tumorigenic activity of Panc1 CSCs demonstrated in the
subcutaneous mouse model experiments.
Taken together, our present study has demonstrated
that the pancreatic CSCs isolated from PDAC cell lines have all the
characteristics of the clinically relevant tumors. This model will
be of great importance to deepen our understanding of the biology
of pancreatic adenocarcinoma and will also be employed to early
marker discovery and screening of compounds for therapeutic
intervention.
Acknowledgements
This study was supported by AIRC-Fondazione
CariPaRo, Padova, Italy; AIRC 5 per mille grant no. 12182;
Fondazione Cariverona, Project Verona Nanomedicine Initiative. We
thank Dr Dea Filippini for her support and suggestions during the
in vivo experiments.
References
|
1
|
Bünger S, Barow M, Thorns C, et al:
Pancreatic carcinoma cell lines reflect frequency and variability
of cancer stem cell markers in clinical tissue. Eur Surg Res.
49:88–98. 2012. View Article : Google Scholar : PubMed/NCBI
|
|
2
|
Rasheed ZA and Matsui W: Biological and
clinical relevance of stem cells in pancreatic adenocarcinoma. J
Gastroenterol Hepatol. 27(Suppl 2): S15–S18. 2012. View Article : Google Scholar
|
|
3
|
Marjanovic ND, Weinberg RA and Chaffer CL:
Cell plasticity and heterogeneity in cancer. Clin Chem. 59:168–179.
2013. View Article : Google Scholar
|
|
4
|
Bonnet D and Dick JE: Human acute myeloid
leukemia is organized as a hierarchy that originates from a
primitive hematopoietic cell. Nat Med. 3:730–737. 1997. View Article : Google Scholar : PubMed/NCBI
|
|
5
|
Gaviraghi M, Tunici P, Valensin S, et al:
Pancreatic cancer spheres are more than just aggregates of stem
marker-positive cells. Biosci Rep. 31:45–55. 2011. View Article : Google Scholar
|
|
6
|
Kure S, Matsuda Y, Hagio M, Ueda J, Naito
Z and Ishiwata T: Expression of cancer stem cell markers in
pancreatic intraepithelial neoplasias and pancreatic ductal
adenocarcinomas. Int J Oncol. 41:1314–1324. 2012.PubMed/NCBI
|
|
7
|
Rhim AD, Mirek ET, Aiello NM, et al: EMT
and dissemination precede pancreatic tumor formation. Cell.
148:349–361. 2012. View Article : Google Scholar : PubMed/NCBI
|
|
8
|
Yang G, Quan Y, Wang W, et al: Dynamic
equilibrium between cancer stem cells and non-stem cancer cells in
human SW620 and MCF-7 cancer cell populations. Br J Cancer.
106:1512–1519. 2012. View Article : Google Scholar : PubMed/NCBI
|
|
9
|
Dean M, Fojo T and Bates S: Tumour stem
cells and drug resistance. Nat Rev Cancer. 5:275–284. 2005.
View Article : Google Scholar : PubMed/NCBI
|
|
10
|
Feng Y, Dai X, Li X, et al: EGF signalling
pathway regulates colon cancer stem cell proliferation and
apoptosis. Cell Prolif. 45:413–419. 2012. View Article : Google Scholar : PubMed/NCBI
|
|
11
|
Ponti D, Costa A, Zaffaroni N, et al:
Isolation and in vitro propagation of tumorigenic breast cancer
cells with stem/progenitor cell properties. Cancer Res.
65:5506–5511. 2005. View Article : Google Scholar : PubMed/NCBI
|
|
12
|
Tsai LL, Yu CC, Chang YC, Yu CH and Chou
MY: Markedly increased Oct4 and Nanog expression correlates with
cisplatin resistance in oral squamous cell carcinoma. J Oral Pathol
Med. 40:621–628. 2011. View Article : Google Scholar : PubMed/NCBI
|
|
13
|
Chaffer CL, Brueckmann I, Scheel C, et al:
Normal and neoplastic nonstem cells can spontaneously convert to a
stem-like state. Proc Natl Acad Sci USA. 108:7950–7955. 2011.
View Article : Google Scholar : PubMed/NCBI
|
|
14
|
Varga J, De Oliveira T and Greten FR: The
architect who never sleeps: tumor-induced plasticity. FEBS Lett.
588:2422–2427. 2014. View Article : Google Scholar : PubMed/NCBI
|
|
15
|
Melisi D, Ishiyama S, Sclabas GM, et al:
LY2109761, a novel transforming growth factor beta receptor type I
and type II dual inhibitor, as a therapeutic approach to
suppressing pancreatic cancer metastasis. Mol Cancer Ther.
7:829–840. 2008. View Article : Google Scholar : PubMed/NCBI
|
|
16
|
Zheng G, Lyons JG, Tan TK, et al:
Disruption of E-cadherin by matrix metalloproteinase directly
mediates epithelial-mesenchymal transition downstream of
transforming growth factor-beta1 in renal tubular epithelial cells.
Am J Pathol. 175:580–591. 2009. View Article : Google Scholar : PubMed/NCBI
|
|
17
|
Chen SF, Chang YC, Nieh S, Liu CL, Yang CY
and Lin YS: Nonadhesive culture system as a model of rapid sphere
formation with cancer stem cell properties. PLoS One. 7:e318642012.
View Article : Google Scholar : PubMed/NCBI
|
|
18
|
Vaz AP, Ponnusamy MP, Rachagani S, Dey P,
Ganti AK and Batra SK: Novel role of pancreatic differentiation 2
in facilitating self-renewal and drug resistance of pancreatic
cancer stem cells. Br J Cancer. 111:486–496. 2014. View Article : Google Scholar : PubMed/NCBI
|
|
19
|
Shackleton M: Normal stem cells and cancer
stem cells: similar and different. Semin Cancer Biol. 20:85–92.
2010. View Article : Google Scholar : PubMed/NCBI
|
|
20
|
Singh AK, Arya RK, Maheshwari S, et al:
Tumor heterogeneity and cancer stem cell paradigm: updates in
concept, controversies and clinical relevance. Int J Cancer. Feb
22–2014.(Epub ahead of print). View Article : Google Scholar
|
|
21
|
Song J, Chang I, Chen Z, Kang M and Wang
CY: Characterization of side populations in HNSCC: highly invasive,
chemoresistant and abnormal Wnt signaling. PLoS One. 5:e114562010.
View Article : Google Scholar : PubMed/NCBI
|
|
22
|
Yanamoto S, Kawasaki G, Yamada S, et al:
Isolation and characterization of cancer stem-like side population
cells in human oral cancer cells. Oral Oncol. 47:855–860. 2011.
View Article : Google Scholar : PubMed/NCBI
|
|
23
|
Shah AN, Summy JM, Zhang J, Park SI,
Parikh NU and Gallick GE: Development and characterization of
gemcitabine-resistant pancreatic tumor cells. Ann Surg Oncol.
14:3629–3637. 2007. View Article : Google Scholar : PubMed/NCBI
|
|
24
|
Zeng W, Chen X, Ma Y, et al: A novel
approach for enriching cancer stem cells from the human SW-13
adrenocortical carcinoma cell line. Anticancer Res. 34:117–123.
2014.PubMed/NCBI
|
|
25
|
Donadelli M, Costanzo C, Beghelli S, et
al: Synergistic inhibition of pancreatic adenocarcinoma cell growth
by trichostatin A and gemcitabine. Biochim Biophys Acta.
1773:1095–1106. 2007. View Article : Google Scholar : PubMed/NCBI
|
|
26
|
Piacentini P, Donadelli M, Costanzo C,
Moore PS, Palmieri M and Scarpa A: Trichostatin A enhances the
response of chemotherapeutic agents in inhibiting pancreatic cancer
cell proliferation. Virchows Arch. 448:797–804. 2006. View Article : Google Scholar : PubMed/NCBI
|
|
27
|
Moore PS, Sipos B, Orlandini S, et al:
Genetic profile of 22 pancreatic carcinoma cell lines. Analysis of
K-ras, p53, p16 and DPC4/Smad4. Virchows Arch. 439:798–802. 2001.
View Article : Google Scholar
|
|
28
|
Niess H, Camaj P, Renner A, et al: Side
population cells of pancreatic cancer show characteristics of
cancer stem cells responsible for resistance and metastasis. Target
Oncol. Jun 22–2014.(Epub ahead of print). View Article : Google Scholar : PubMed/NCBI
|
|
29
|
Li C, Heidt DG, Dalerba P, et al:
Identification of pancreatic cancer stem cells. Cancer Res.
67:1030–1037. 2007. View Article : Google Scholar : PubMed/NCBI
|
|
30
|
Gemei M, Mirabelli P, Di Noto R, et al:
CD66c is a novel marker for colorectal cancer stem cell isolation,
and its silencing halts tumor growth in vivo. Cancer. 119:729–738.
2013. View Article : Google Scholar
|
|
31
|
Hermann PC, Huber SL, Herrler T, et al:
Distinct populations of cancer stem cells determine tumor growth
and metastatic activity in human pancreatic cancer. Cell Stem Cell.
1:313–323. 2007. View Article : Google Scholar
|
|
32
|
Arpicco S, Lerda C, Dalla Pozza E, et al:
Hyaluronic acid-coated liposomes for active targeting of
gemcitabine. Eur J Pharm Biopharm. 85:373–380. 2013. View Article : Google Scholar : PubMed/NCBI
|
|
33
|
Cain JW, Hauptschein RS, Stewart JK, Bagci
T, Sahagian GG and Jay DG: Identification of CD44 as a surface
biomarker for drug resistance by surface proteome signature
technology. Mol Cancer Res. 9:637–647. 2011. View Article : Google Scholar : PubMed/NCBI
|