Introduction
Keloid is a benign tumor with characteristics of
hyperproliferation of fibroblasts and excessive accumulation of
extracellular matrix. This pathological process is often triggered
by a skin injury. The lesion invades into the normal skin, and
forms a solid nodule which is unable to regress spontaneously
(1). Multiple therapeutic methods
have been reported, such as surgery, radiotherapy, hormone
injection, intense pulsed light (IPL) and intralesional cryotherapy
(2,3). However, long-term follow-up has shown
a relative high rate of recurrence (4). New therapies have also been applied
recently, while safety and compared effect need to be further
examined (5,6). To better understand the disease,
multiple studies have been conducted to explore the complex
pathological mechanism. Nakashima et al (7) identified 4 single nucleotide
polymorphism (SNP) loci related to keloid by a multistage
genome-wide association study in the Japanese population. Chen
et al (8) found 250
upregulated and 152 downregulated genes in keloid compared with
normal skin. Moreover, several signaling pathways and
transcriptional factors are found associated (9,10).
However, the precise linkage gene and pathological process are
still controversial.
Long non-coding RNA (lncRNA) refers to a class of
non-coding RNA, with length more than 200 nt. LncRNA has been
confirmed vital to genomic imprinting, dosage compensation,
pluripotency-regulation and organism development (11,12).
Although there are no reports on lncRNA in keloid, it does play an
important role in skin homeostasis and diseases (13,14).
For example, lncRNA such as anti-differentiation non-coding RNA
(ANCR) and terminal differentiation-induced non-coding RNA (TINCR)
are essential for epidermal stability (15). A deletion of ANCR induces epidermal
differentiation spontaneously (16).
Considering that lncRNA has a major role in both
normal biological growth and pathological development of diseases,
we hypothesize it may also participate in keloid formation. In the
present study, we adopted high-throughput microarray screening to
compare the differences of lncRNA and mRNA expression profiles
between keloid and normal skin tissues. Quantitative RT-PCR
followed to confirm the results from microarray. By bioinformation
analysis, we used the candidate lncRNAs and their potential related
protein-coding genes to construct a coding-non-coding gene
co-expression diagram.
Materials and methods
Patients and samples
The present study was approved by the Ethics
Committee Board of the Chinese Academy of Medical Sciences and
Peking Union Medical College. All the patients involved in this
program gave informed consent to the work. We obtained keloid and
corresponding normal skin from 16 patients who received surgery in
Peking Union Medical College Hospital. None of the patients had
received previous treatment for keloid. The diagnosis of keloid was
confirmed by the pathological results. During the surgery, keloid
was excised completely, and normal skin tissue was obtained after
trimming. Tissue was frozen by liquid nitrogen and stored at
−80°C.
Total RNA extraction
Total RNA was extracted from the frozen tissue using
a TRIzol reagent (Invitrogen, Carlsbad, CA, USA). Each step
followed the manufacturer's instructions (Invitrogen). The RNA
quality was assessed by NanoDrop ND-1000 (Thermo Fisher Scientific,
Waltham, MA, USA), and RNA integrity was assessed by standard
denaturing agarose gel electrophoresis.
Microarray profiling
Keloid and normal skin tissue from 3 randomly
selected patients were tested in microarray profiling. We used the
ArrayStar Human LncRNA/mRNA Expression Microarray version 3.0
(Arraystar, Inc., Rockville, MD, USA). In total, 30,586 lncRNAs and
26,109 coding transcripts can be detected by this microarray.
Public transcriptome databases and lncRNA publications were used to
construct lncRNAs.
RNA labeling and array hybridization
Sample labeling and array hybridization were
performed according to the Agilent One-Color Microarray-Based Gene
Expression Analysis protocol (Agilent Technologies) with minor
modifications. First, mRNA was purified from total RNA after
removal of rRNA (mRNA-ONLY™ Eukaryotic mRNA isolation kit;
Epicentre, Madison, WI, USA). Then, each sample was amplified and
transcribed into fluorescent cRNA along the entire length of the
transcripts without 3′ bias utilizing a random priming method
(Quick Amp Labeling kit, One-Color; Agilent p/n 5190-0442). The
labeled cRNAs were purified by RNeasy Mini kit (Qiagen p/n 74104).
The concentration and specific activity of the labeled cRNAs (pmol
Cy3/μg cRNA) were measured by NanoDrop ND-1000. Hybridization
adopted Agilent Gene Expression Hybridization kit (Agilent p/n
5188-5242). A total of 1 μg of each labeled cRNA was fragmented by
adding 5 μl 10X blocking agent (Agilent p/n 5188-5242) and 1 μl of
25X fragmentation buffer (Agilent p/n 5188-5242), then the mixture
was heated at 60°C for 30 min, finally 25 μl 2X GE hybridization
buffer (Agilent p/n 5188-5242) was added to dilute the labeled
cRNA. A total of 50 μl of hybridization solution was dispensed into
the gasket slide and assembled to the lncRNA expression microarray
slide. The slides were incubated for 17 h at 65°C in an Agilent
hybridization oven (Agilent p/n G2545A). The hybridized arrays were
washed, fixed and scanned using the Agilent DNA G2505C
microarray.
Data analysis
Agilent Feature Extraction software (version
11.0.1.1) was used to examine acquired array images. Quantile
normalization and subsequent data processing were executed using
the GeneSpring GX v11.5.1 software package (Agilent Technologies).
After quantile normalization of the raw data, lncRNAs and mRNAs, at
least 3 out of 6 samples, were chosen for further data analysis.
Differentially expressed lncRNAs/mRNAs were classified by a fold
change cut-off of 2.0 (upregulated or downregulated) combined with
P-value <0.05 as selection criterion. The microarray analysis
was performed by Kangcheng Biology Engineering Co., Ltd.,
(Shanghai, China).
GO and pathway analysis
The Gene Ontology (GO) project offers a controlled
vocabulary to label gene and gene product attributes in any
organism (http://www.geneontology.org). Three
fields are covered in the ontology, which are biological process
(BP), cellular component (CC) and molecular function (MF). To avoid
more than accidental overlap between the DE list and the GO
annotation list exists, Fisher's exact test is applied. P-value
represents the significance of GO terms enrichment in the DE genes.
Pathway analysis is a functional analysis mapping genes to KEGG
pathways. The P-value (EASE-score, Fisher-P value or
Hypergeometric-P-value) indicates the significance of the pathway
correlated to the conditions. The lower the P-value, the more
significant is the pathway. The analysis was performed by Kangcheng
Biology Engineering.
The coding-non-coding gene co-expression
network
We chose 4 lncRNAs (uc002lfu.1, ENST00000522743,
NR_038439 and ENST00000521141) to explore the connection between
these lncRNAs and corresponding coding genes. First, the median
value of all the transcripts expressed from the same coding gene
was selected, while there was no special treatment with the
expression value of lncRNA. Secondly, differentially expressed
lncRNAs and mRNAs data were screened and taken away from dataset.
Thirdly, Pearson correlation coefficient (PCC) between coding gene
and lncRNA was calculated using R-value. Fourthly, PCC ≥0.999 was
chosen as meaningful related pair. Finally, the network was drawn
through Cytoscape (v2.8.1). In the network, we used blue nodes
representing coding genes, and red/pink nodes representing lncRNAs.
A solid line indicates a positive correlation, and a dashed line a
negative correlation.
Quantitative real-time PCR and
statistical methods
We used quantitative real-time PCR (qRT-PCR) to
confirm the expression levels. Total RNA was extracted from frozen
tissue using a TRIzol reagent (Invitrogen Life Technologies) and
reverse-transcribed using RT reagent kit (Thermo Fisher Scientific)
according to the manufacturer's instructions. Real-time PCR was
performed using the SYBR-Green method with ViiA 7 real-time PCR
system (Applied Biosystems) following the manufacturer's protocols.
Three significantly upregulated lncRNAs (uc002lfu.1,
ENST00000522743 and NR_038439) and one downregulated lncRNAs
(ENST00000521141) were chosen to test the reproducibility of the
data. After further research, NR_038439 drew our attention and was
tested in 13 other pairs of tissues. Glyceraldehyde three-phosphate
dehydrogenase (GAPDH) acted as endogenous control. Primer sequences
were as follows: GAPDH: forward, 5′-GGGAAACTGTGGCGTGAT-3′ and
reverse, 5′-GAGTGGGTGTCGCTGTTGA-3′; uc002lfu.1: forward,
5′-TGCTTGATCCAAATAATGCC-3′ and reverse, 5′-TTCAGTCCAGAGATGTGCC-3′;
ENST00000522743: forward, 5′-AGACCCAAAGCTGACACCA-3′ and reverse,
5′-ATCTCCCCTCATCCAAACC-3′; NR_038439: forward,
5′-CTGGCAAGGTTGAGTAGGCT-3′ and reverse, 5′-TGCTCCCTTCACACGGTCA-3′;
ENST00000521141: forward, 5′-AAGGATGTGGGAGTTTGAGAC-3′ and reverse,
5′-CAGAGGGGAGAGCGTGTTC-3′. The PCR conditions were as follows: PCR
reaction under 95°C for 10 min, then 40 cycles of 95°C for 10 sec
and 60°C for 60 sec. After setting the concentration of PCR product
as 1, all the PCR products were diluted as follows:
1×10⁻¹, 1×10⁻², 1×10⁻³,
1×10⁻⁴, 1×10⁻⁵, 1×10⁻⁶,
1×10⁻⁷, 1×10⁻⁸ and 1×10⁻⁹. As the
target genes and housekeeping gene went through PCR separately, the
standard curves were drawn based on the dilution. The relative
expression (RQ) was obtained through dividing the concentration of
target gene by the one of housekeeping gene. The lncRNA expression
differences between keloid and normal skin were analyzed using
Student's t-test with SPSS (version 16.0; SPSS, Inc., Chicago, IL,
USA). A value of P<0.05 was considered significant.
Results
Differentially expressed lncRNAs between
keloid and normal skin tissues
The microarray we used in the present study can
detect 30,586 lncRNAs and 2,6108 annotated mRNAs from authoritative
data sources including ‘RefSeq’, ‘UCSC known-gene’ and ‘Genecode’.
We found a total of 16,710 lncRNAs expressed in keloid from lncRNA
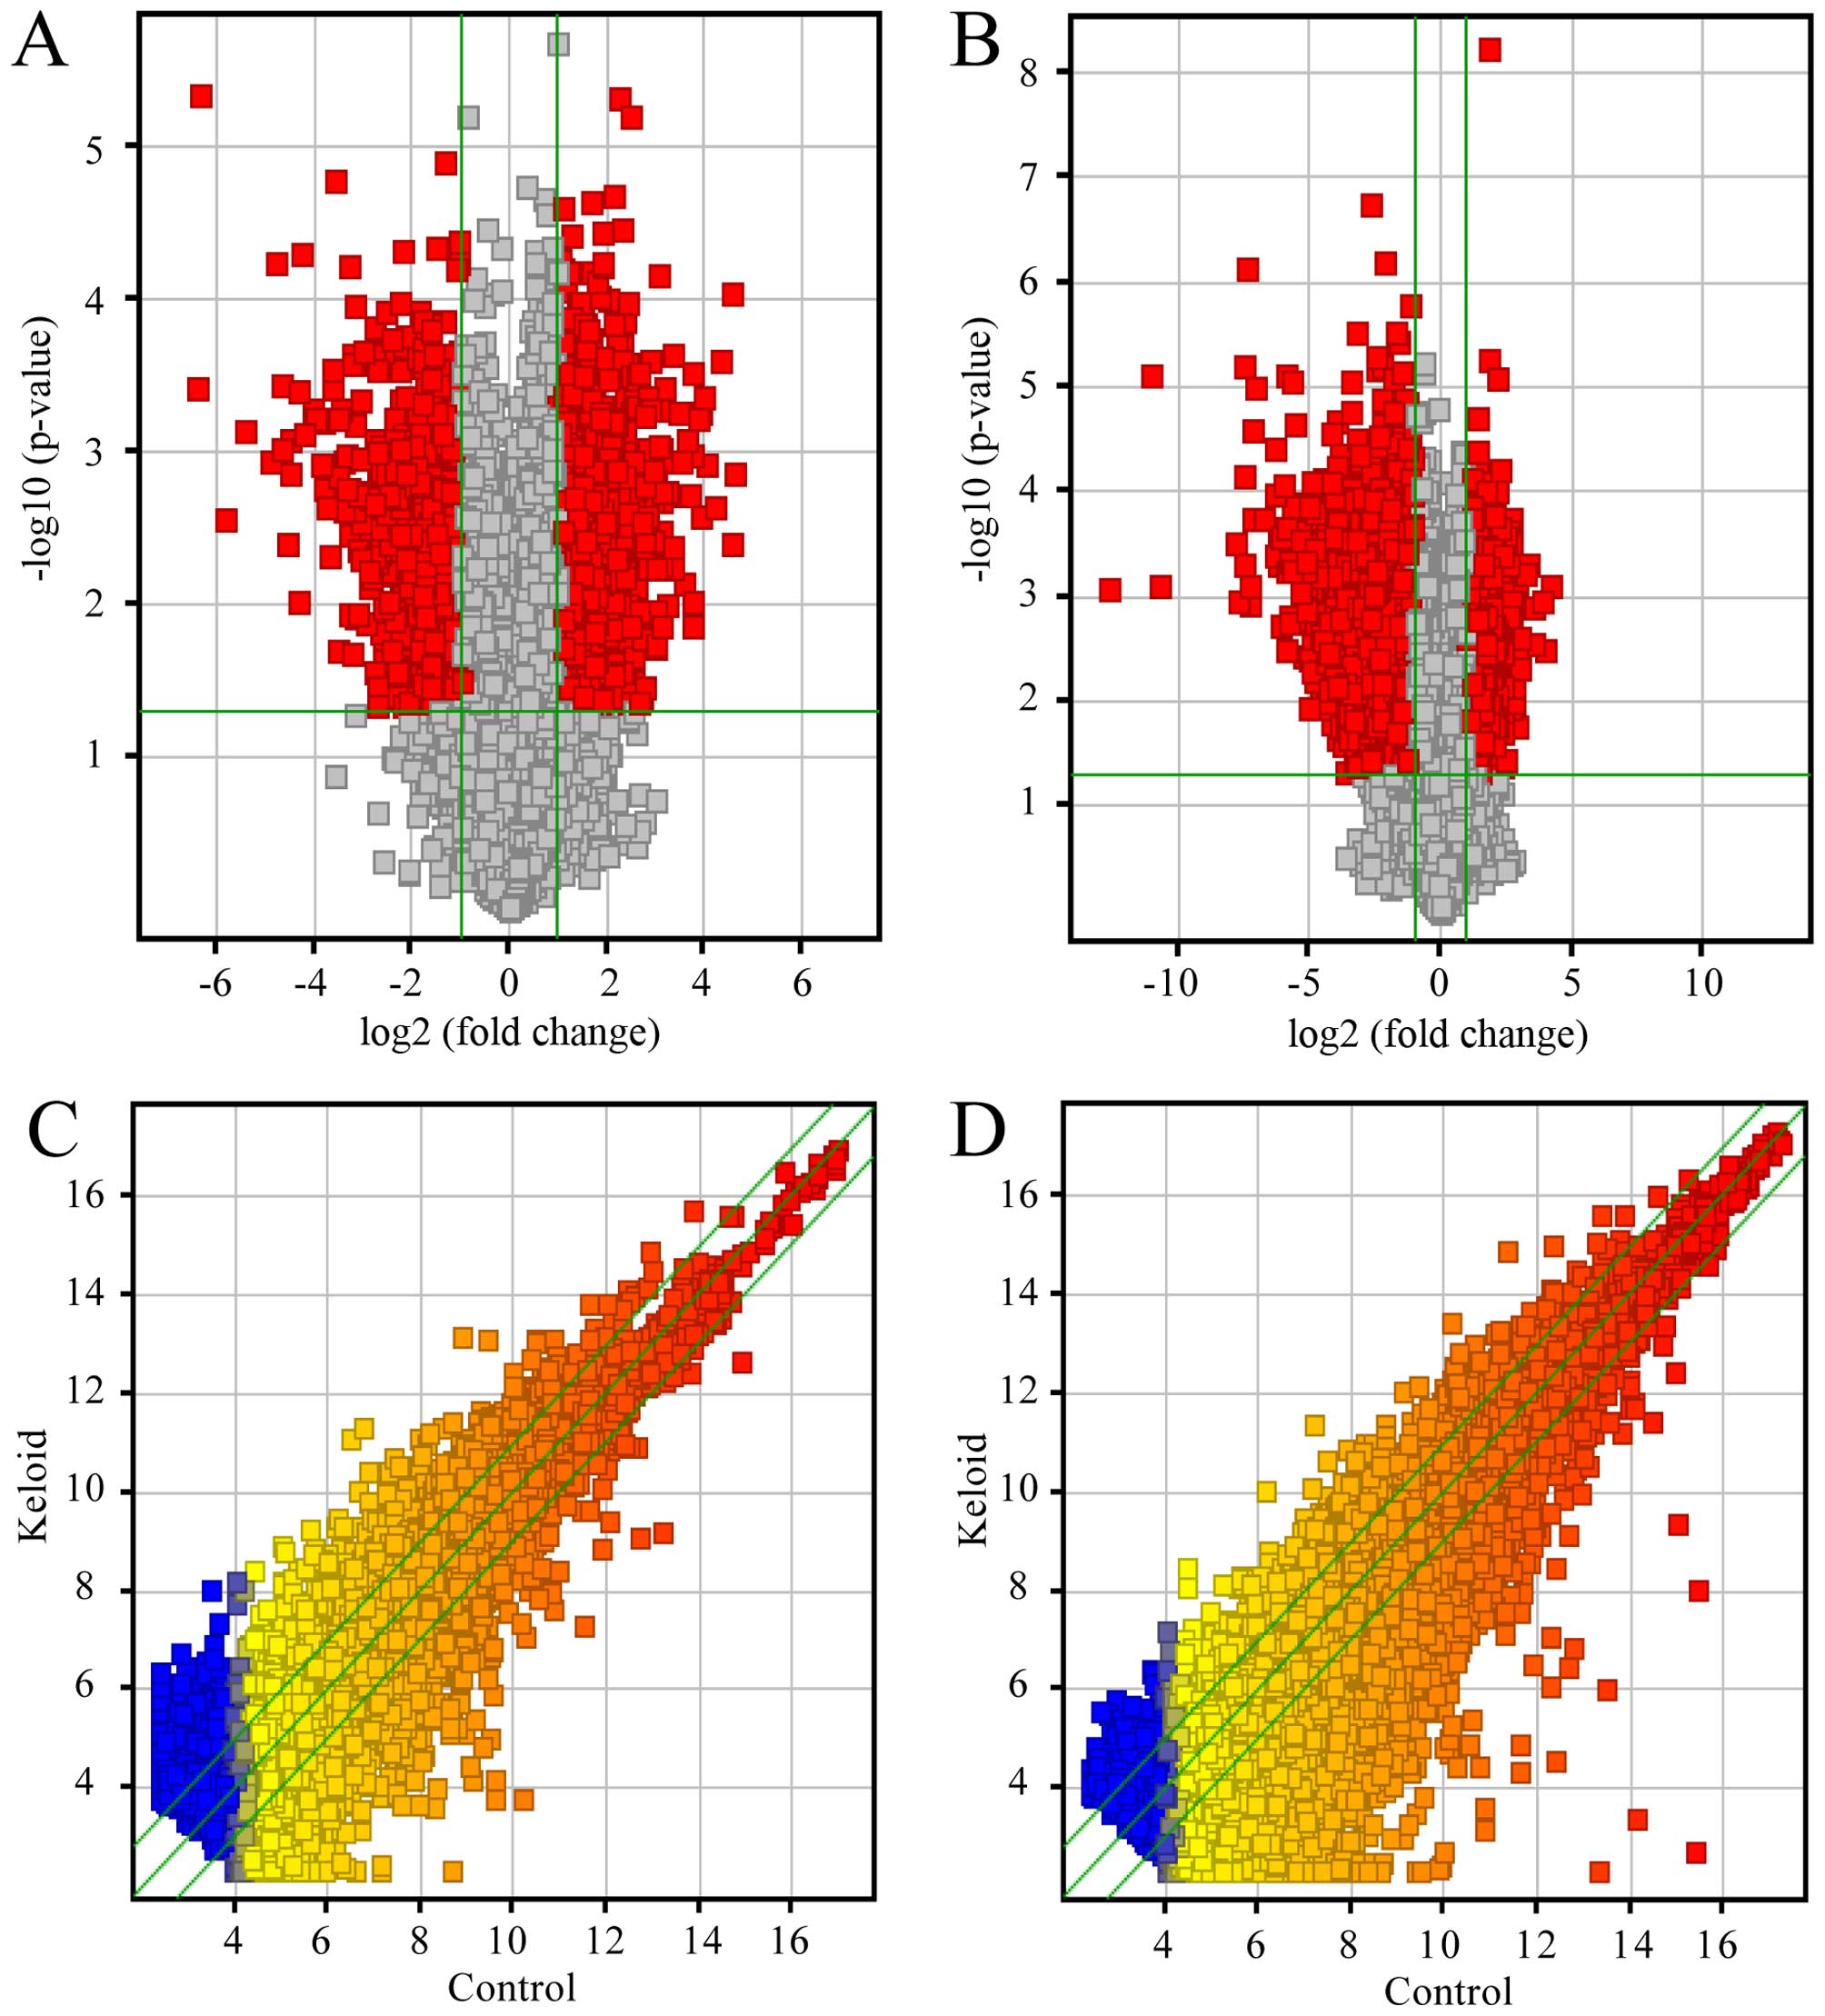
expression profiling data using microarray analysis (Fig. 1A). Through these data, we compared
lncRNA expression levels among 3 pairs of human keloid and their
adjacent normal skin tissue (Fig.
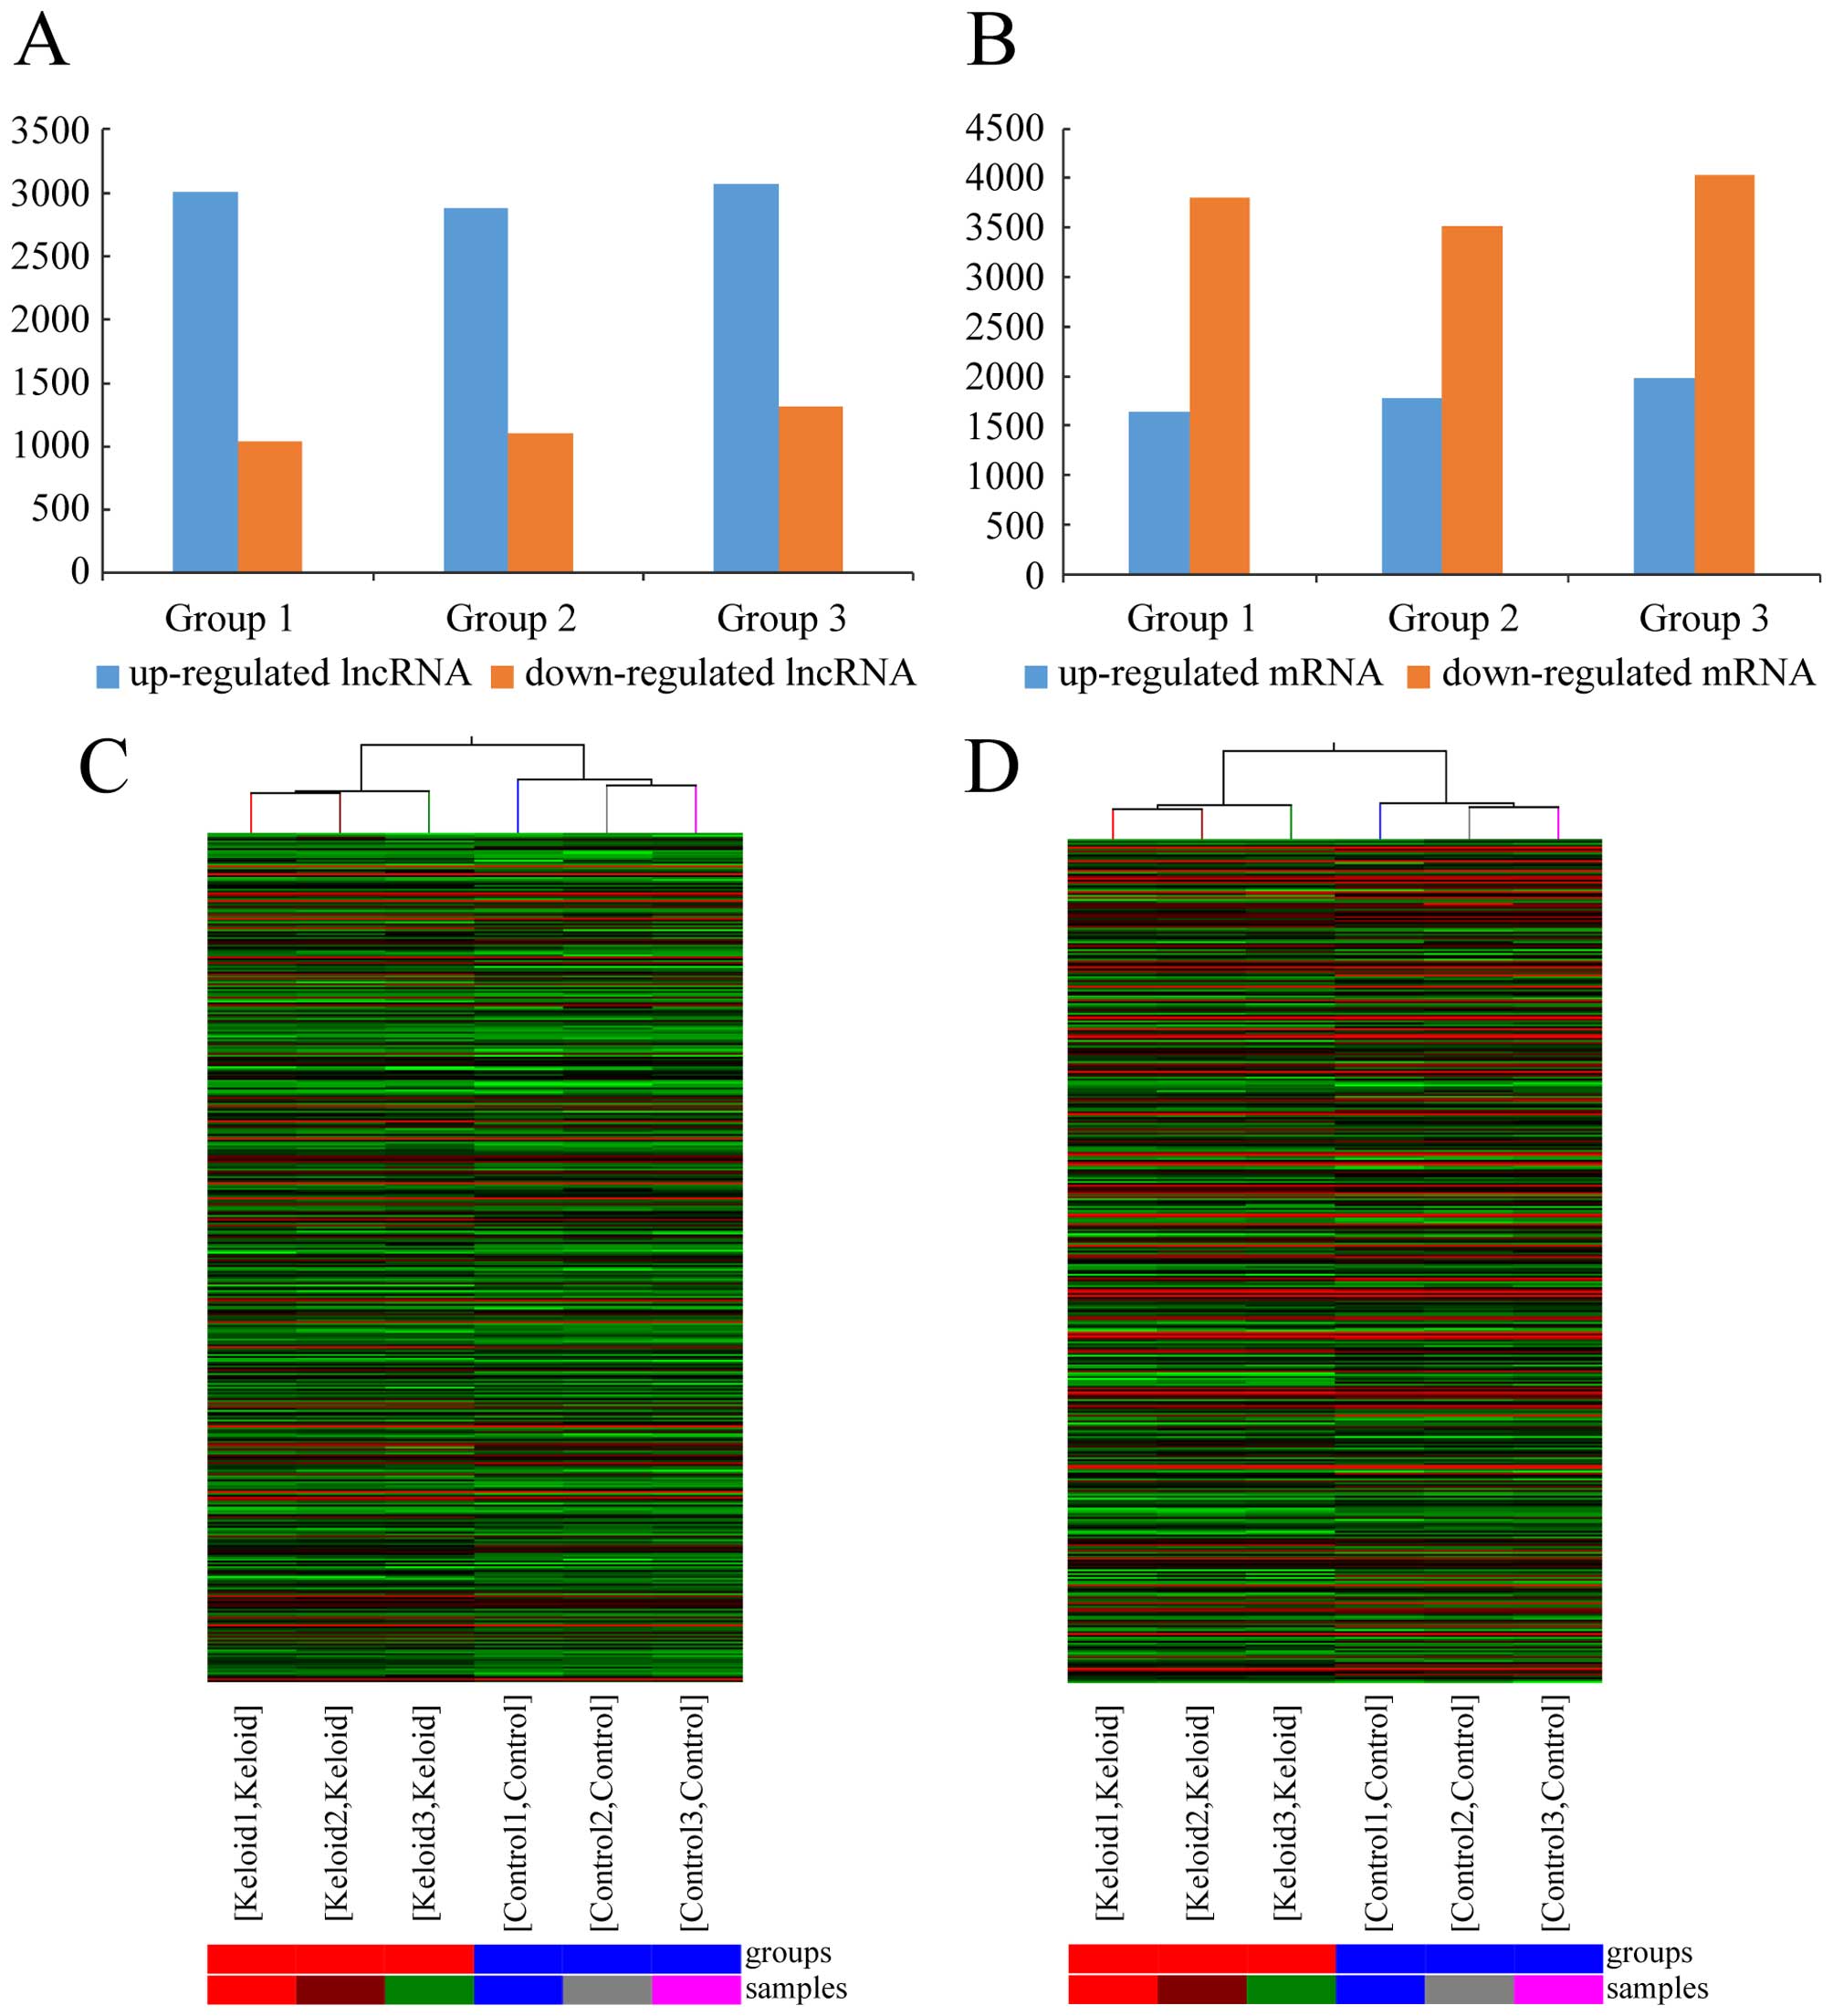
1C). There were an average of 2,988 upregulated lncRNAs (range
from 2,885 to 3,071) and 1,152 downregulated lncRNAs (range from
1,036 to 1,316), which were significantly differentially expressed
(≥2.0-fold) (Fig. 2A). To make the
results more precise and reduce the possibility of false positive,
we set the screen standard of lncRNA as follows: The abnormal
lncRNA should exist in all 3 pairs of tissues. After screening,
there were 1,731 constantly upregulated lncRNAs and 782
down-regulated lncRNAs in keloid compared with normal skin. Top 25
differentially expressed lncRNAs are listed in Table I. In the upregulated lncRNAs, the
maximum fold change was 24.68, which belonged to uc002lfu.1.
Moreover, among the downregulated lncRNAs, ENST00000449151
possessed the maximum fold change, which was 84.18. The dendrogram
from hierarchical clustering analysis exhibits relationships among
lncRNA expression patterns (Fig.
2C).
 | Table ITop 25 differentially expressed
lncRNAs with >2-fold change in 3 paired keloid (K) compared with
normal skin tissue (N). |
Table I
Top 25 differentially expressed
lncRNAs with >2-fold change in 3 paired keloid (K) compared with
normal skin tissue (N).
| Upregulated
lncRNAs | Downregulated
lncRNAs |
|---|
|
|
|---|
| Seqname | P-value | Absolute fold
change (K vs. N) | Seqname | P-value | Absolute fold
change (K vs. N) |
|---|
| uc002lfu.1 | 0.001392141 | 24.67823539 |
ENST00000449151 | 0.000373091 | 84.17830568 |
|
ENST00000448264 | 9.24902E-05 | 23.71568882 |
ENST00000504509 | 4.5935E-06 | 80.75090928 |
|
ENST00000522743 | 0.003964706 | 23.32120992 | TCONS_00014447 | 0.002743683 | 55.75905607 |
| NR_002785 | 0.000245806 | 19.67171045 |
ENST00000508884 | 0.000718046 | 43.04190122 |
|
ENST00000563754 | 0.002278823 | 18.09086601 |
ENST00000543512 | 0.001157162 | 29.62729347 |
|
ENST00000568031 | 0.001182026 | 16.43215739 | NR_037166 | 5.8668E-05 | 27.86637043 |
|
ENST00000430468 | 0.000440694 | 15.99398905 | NR_049776 | 0.000356012 | 25.44496144 |
|
ENST00000568767 | 0.002652791 | 15.40462545 |
ENST00000507950 | 0.00097244 | 25.35162231 |
|
ENST00000564832 | 0.000561264 | 15.3230045 |
ENST00000432377 | 0.004085284 | 23.58314193 |
|
ENST00000524045 | 0.000617583 | 14.35734021 | NR_046258 | 0.000818479 | 22.51173429 |
| NR_046438 | 0.001061987 | 13.5487176 | NR_046259 | 0.001389504 | 22.22674064 |
|
ENST00000514468 | 0.009747714 | 13.40050409 |
ENST00000425399 | 0.009559389 | 19.76933951 |
|
ENST00000439186 | 0.000298858 | 13.26738526 | uc002nrq.3 | 0.000394509 | 19.66993157 |
|
ENST00000399342 | 0.014008237 | 13.24836573 |
ENST00000524012 | 4.96526E-05 | 19.12630922 |
|
ENST00000440570 | 0.001883674 | 12.84056697 | uc001gzl.3 | 0.000755965 | 18.64074653 |
|
ENST00000444114 | 0.000827626 | 12.38834219 |
ENST00000565308 | 0.000520998 | 16.33469184 |
|
ENST00000518932 | 0.007291264 | 11.83886059 | NR_034059 | 0.000590883 | 15.93734199 |
| NR_038439 | 0.001173376 | 11.63954238 |
ENST00000529667 | 0.001227514 | 14.76394367 |
|
ENST00000425711 | 0.000554642 | 11.11258257 | TCONS_00020843 | 0.001779851 | 13.8754485 |
| NR_033997 | 0.001949956 | 10.53634973 | TCONS_00005194 | 0.000640191 | 13.76677473 |
|
ENST00000438154 | 0.005762697 | 10.15674579 |
ENST00000513915 | 0.002284575 | 13.24861031 |
| AL512723 | 0.004287107 | 10.09486468 | uc001uum.3 | 0.00484692 | 12.76120477 |
|
ENST00000424094 | 0.000224946 | 9.997377279 |
ENST00000521141 | 0.000288334 | 12.44615316 |
|
ENST00000489520 | 0.004207864 | 9.470087791 |
ENST00000521188 | 0.00038272 | 12.39901463 |
| TCONS_00023486 | 0.001831401 | 9.387344686 | NR_027856 | 1.6202E-05 | 12.11977043 |
Differentially expressed mRNAs between
keloid and normal skin tissues
The mRNA expression profiling data showed a total of
18,788 mRNAs in keloid using microarray analysis (Fig. 1B). After comparing the three
keloids with their paired adjacent normal skin tissue (Fig. 1D), we found an average of 1,799
upregulated mRNAs (range from 1,643 to 1,975) and 3,784
downregulated mRNAs (range 3,516 from 4,035) which were
significantly differentially expressed (fold change ≥2.0) (Fig. 2B). In the three paired samples,
1,079 mRNAs were consistently upregulated and 3,282 were
consistently downregulated. Top 25 differentially expressed mRNAs
are listed in Table II. In the
upregulated mRNAs, NM_003014 possessed the maximum fold change,
which was 18.22. In the downregulated mRNAs, NM_053283 had the
maximum fold change, which was 6366.20. The clustering analysis
showed relationships among the mRNA expression patterns, which were
present in the samples (Fig.
2D).
| Table IITop 25 differentially expressed mRNAs
with >2-fold change in 3 paired keloid (K) compared with normal
skin tissue (N). |
Table II
Top 25 differentially expressed mRNAs
with >2-fold change in 3 paired keloid (K) compared with normal
skin tissue (N).
| Upregulated
lncRNAs | Downregulated
lncRNAs |
|---|
|
|
|---|
| Seqname | P-value | Absolute fold
change (K vs. N) | Seqname | P-value | Absolute fold
change (K vs. N) |
|---|
| NM_003014 | 0.000766034 | 18.22751605 | NM_053283 | 0.000868472 | 6366.203092 |
|
ENST00000437936 | 0.00312955 | 16.04025716 | NM_002652 | 7.5475E-06 | 2026.938265 |
| NM_207373 | 0.001108182 | 14.5670146 | NM_002411 | 0.000770676 | 1643.833883 |
| NM_001010876 | 0.00288386 | 11.99403154 | NM_003251 | 0.000312511 | 220.2447826 |
|
ENST00000368789 | 0.001235475 | 11.63268318 | NM_152310 | 0.001096438 | 208.8875889 |
| NM_001168243 | 0.000492872 | 9.6787663 | NM_001080526 | 0.000480409 | 176.4587386 |
| NM_005824 | 0.000601708 | 9.311818897 |
ENST00000235547 | 6.3784E-06 | 174.2506749 |
|
ENST00000354373 | 0.000601688 | 9.000401956 | NM_015973 | 6.96809E-05 | 173.3800147 |
|
ENST00000370532 | 0.004754361 | 8.164392456 |
ENST00000312150 | 7.50899E-07 | 172.9050825 |
|
ENST00000359320 | 0.002391107 | 7.870021989 | NM_031962 | 0.000808876 | 154.1275941 |
| NM_001135 | 0.000714446 | 7.627240018 | NM_181535 | 0.001212281 | 150.8484539 |
| NM_001145143 | 0.002748101 | 7.609122032 | NM_007008 | 0.000180465 | 148.9725592 |
| NM_001199 | 0.003800958 | 7.513524934 |
ENST00000301656 | 2.65207E-05 | 146.1537903 |
| NM_012364 | 0.017102348 | 7.281585238 | NM_033185 | 9.90898E-06 | 131.6408041 |
| NM_001159709 | 0.010406205 | 6.717817641 | NM_001482 | 0.000181169 | 106.3194866 |
| NM_032643 | 0.001126809 | 6.638854499 | NM_033187 | 0.000107453 | 77.30322869 |
|
ENST00000435607 | 0.007040186 | 6.635851494 | NM_198692 | 3.8766E-05 | 76.91933758 |
| NM_176891 | 0.001531053 | 6.567488034 | NM_031964 | 0.000399172 | 76.61683722 |
|
ENST00000389623 | 0.000309148 | 6.508019919 | NM_199161 | 0.000242353 | 72.38119393 |
| NM_018250 | 0.001095794 | 6.407558892 | NM_145792 | 0.000497027 | 71.81391287 |
| NM_001005466 | 0.002540038 | 6.395862838 |
ENST00000360770 | 0.00026272 | 70.84177719 |
| NM_005651 | 0.01139665 | 6.349965704 | NM_030754 | 0.001857474 | 67.74012607 |
|
ENST00000319331 | 0.000179028 | 6.191758346 |
ENST00000182377 | 8.80738E-05 | 62.45728419 |
| NM_203371 | 0.000499894 | 6.113256778 | NM_001123387 | 0.003119069 | 61.24489543 |
| NM_001167916 | 0.004378669 | 6.091668213 |
ENST00000368744 | 0.000219518 | 59.85728897 |
GO analysis and pathway analysis
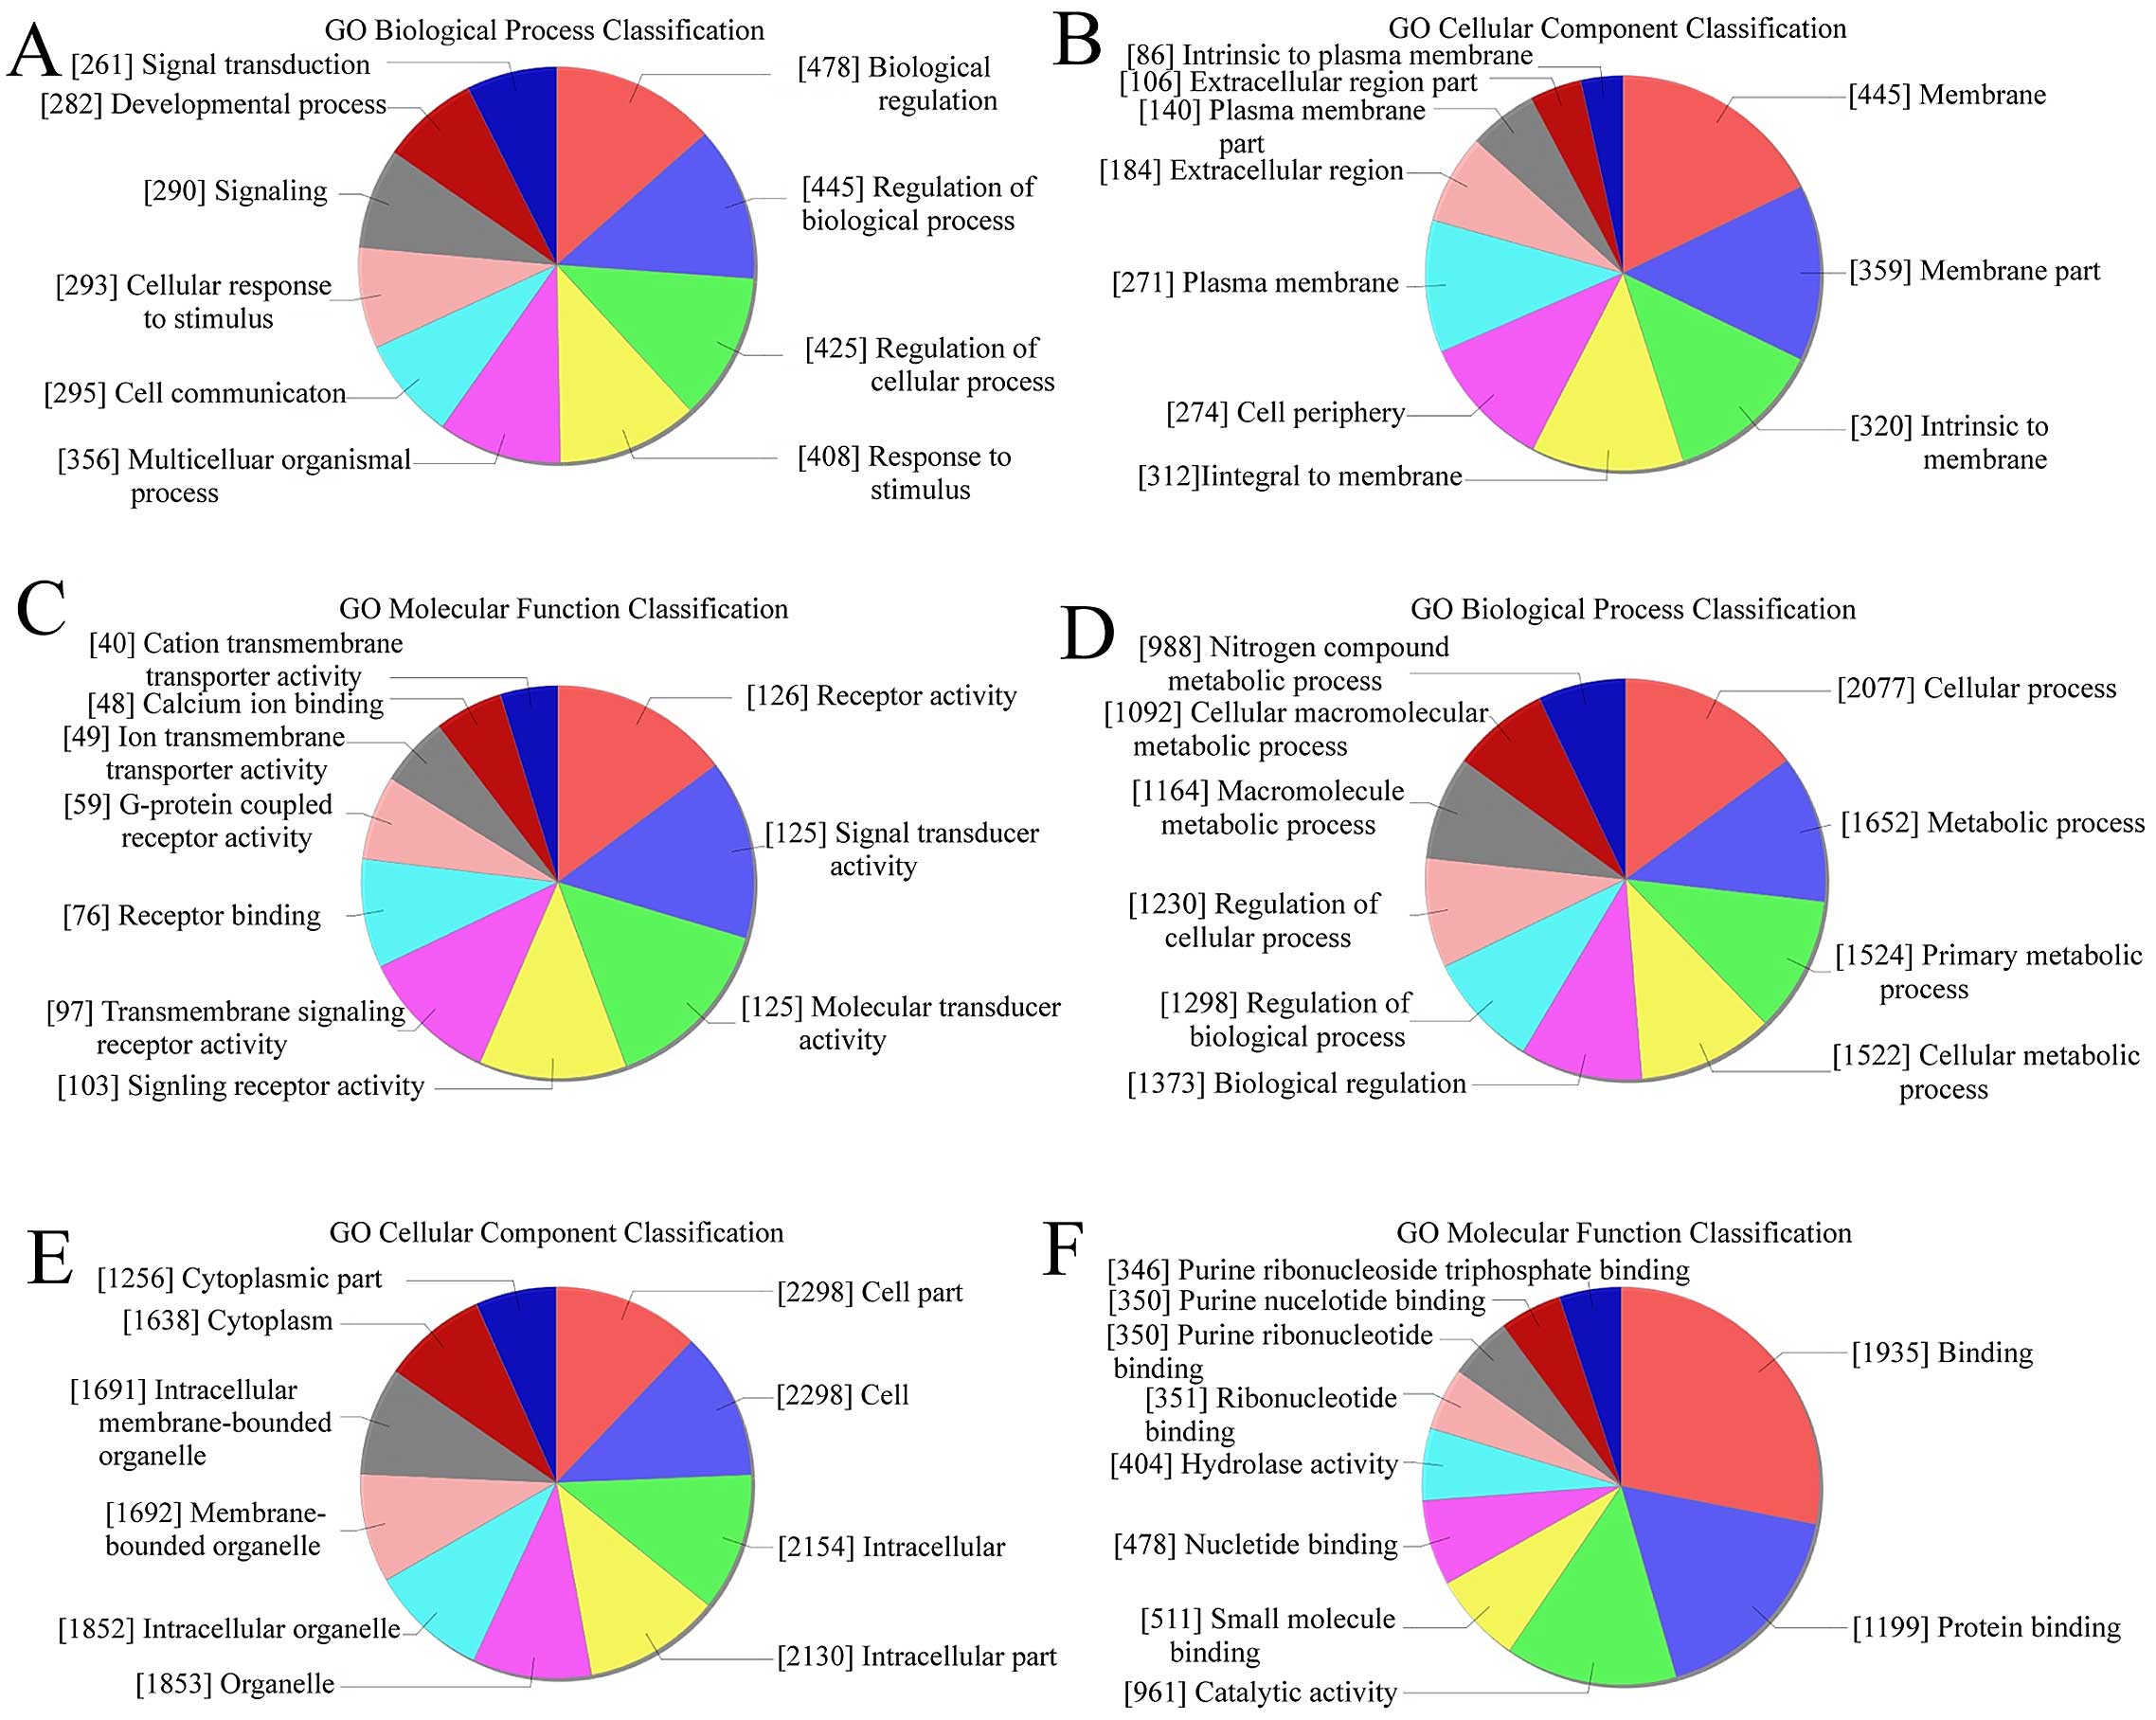
GO analysis was used to analyze the main function of
the closest coding genes according to the GO database. We found
that in upregulated transcripts from keloid, the highest enriched
GOs were biological regulation (biological process) (Fig. 3A), membrane (cellular component)
(Fig. 3B), and receptor activity
(molecular function) (Fig. 3C).
Also, in the downregulated transcripts, the highest enriched GOs
were cellular process (biological process) (Fig. 3D), cell part/cell (cellular
component) (Fig. 3E), and binding
(molecular function) (Fig. 3F). In
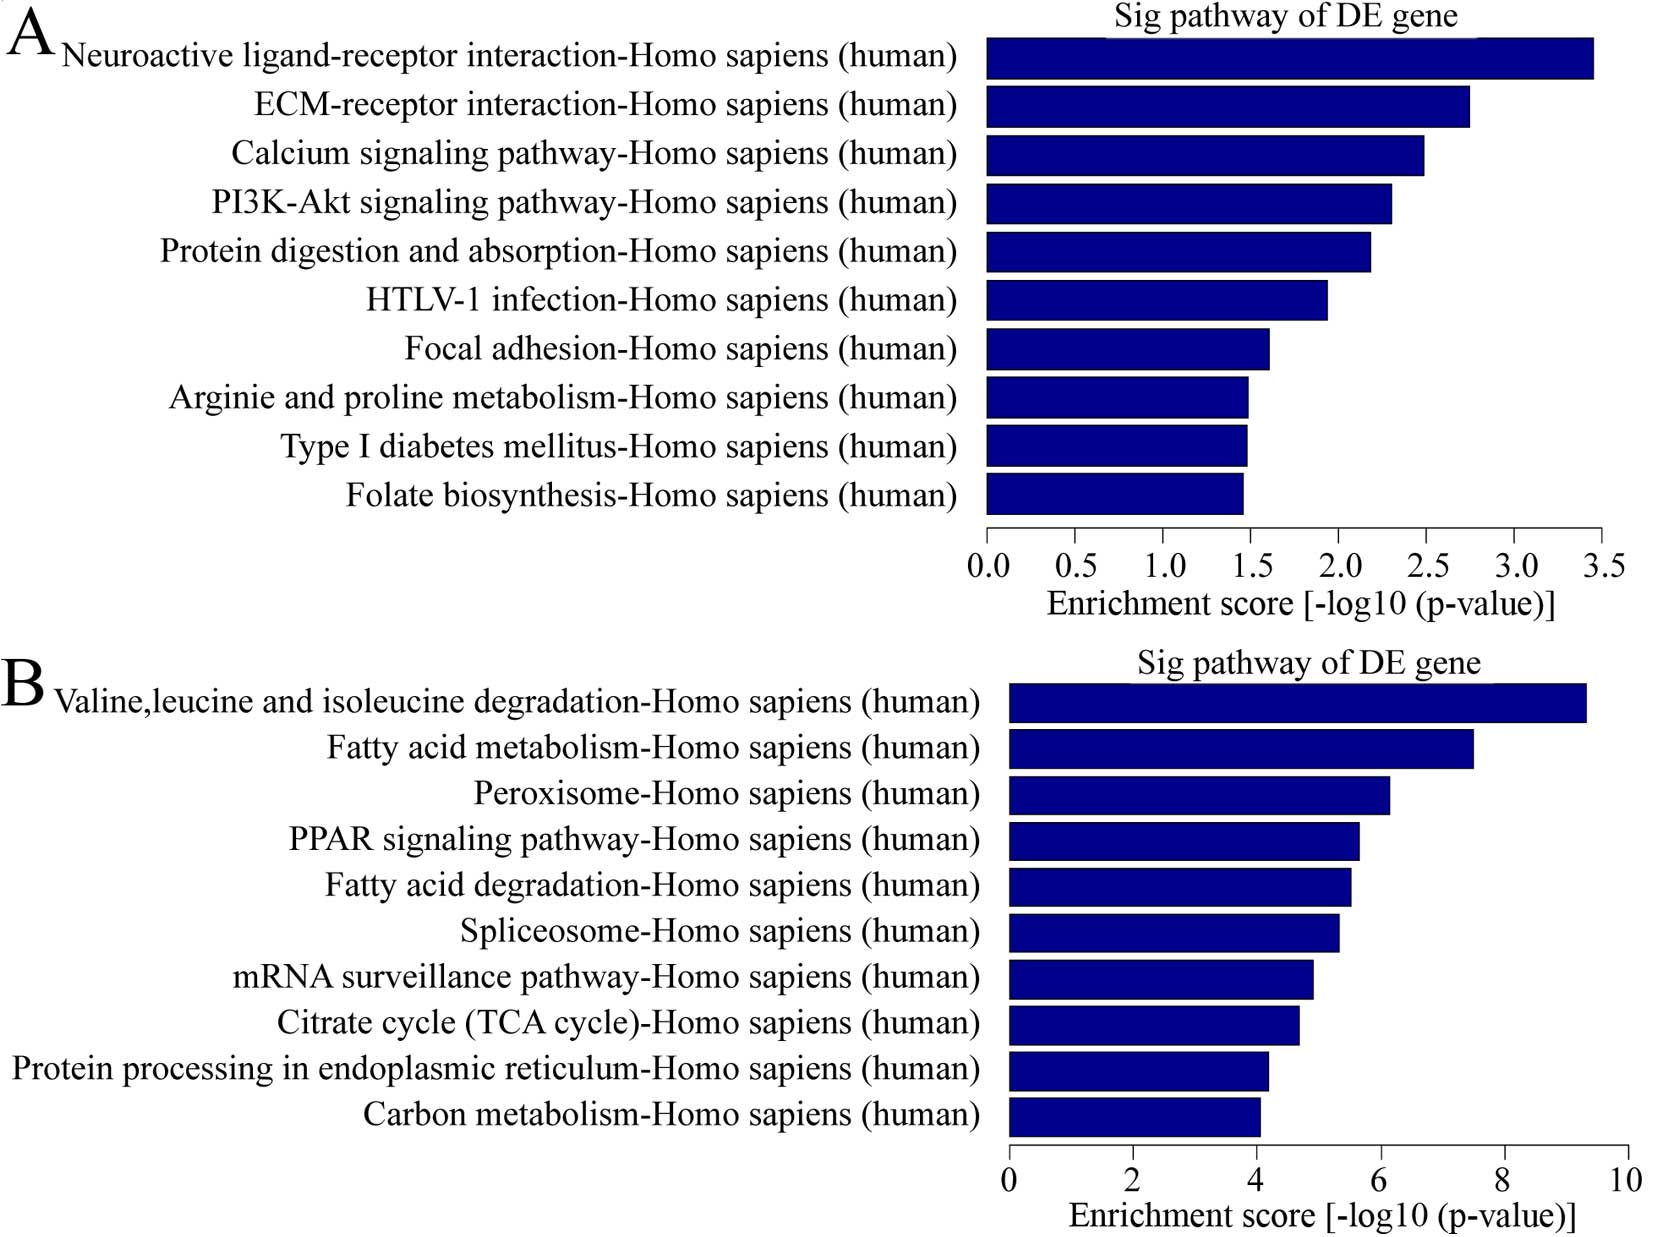
pathway analysis, there were a total of 11 pathways related with
upregulated transcripts in keloid (Fig. 4A). The most enriched network was
Neuroactive ligand-receptor interaction, Homo sapiens
(human). Also, 44 pathways were found related with downregulated
transcripts in keloid (Fig. 4B).
Among them, the most enriched network was valine, leucine and
isoleucine degradation, Homo sapiens (human). It is
interesting that calcium pathway signaling was one of the items
above. Considering calcium played a vital role in wound healing, a
common process in keloid formation and calcium ion influx inhibitor
was used for keloid treatment (17), calcium pathway signaling was
important in pathological behavior.
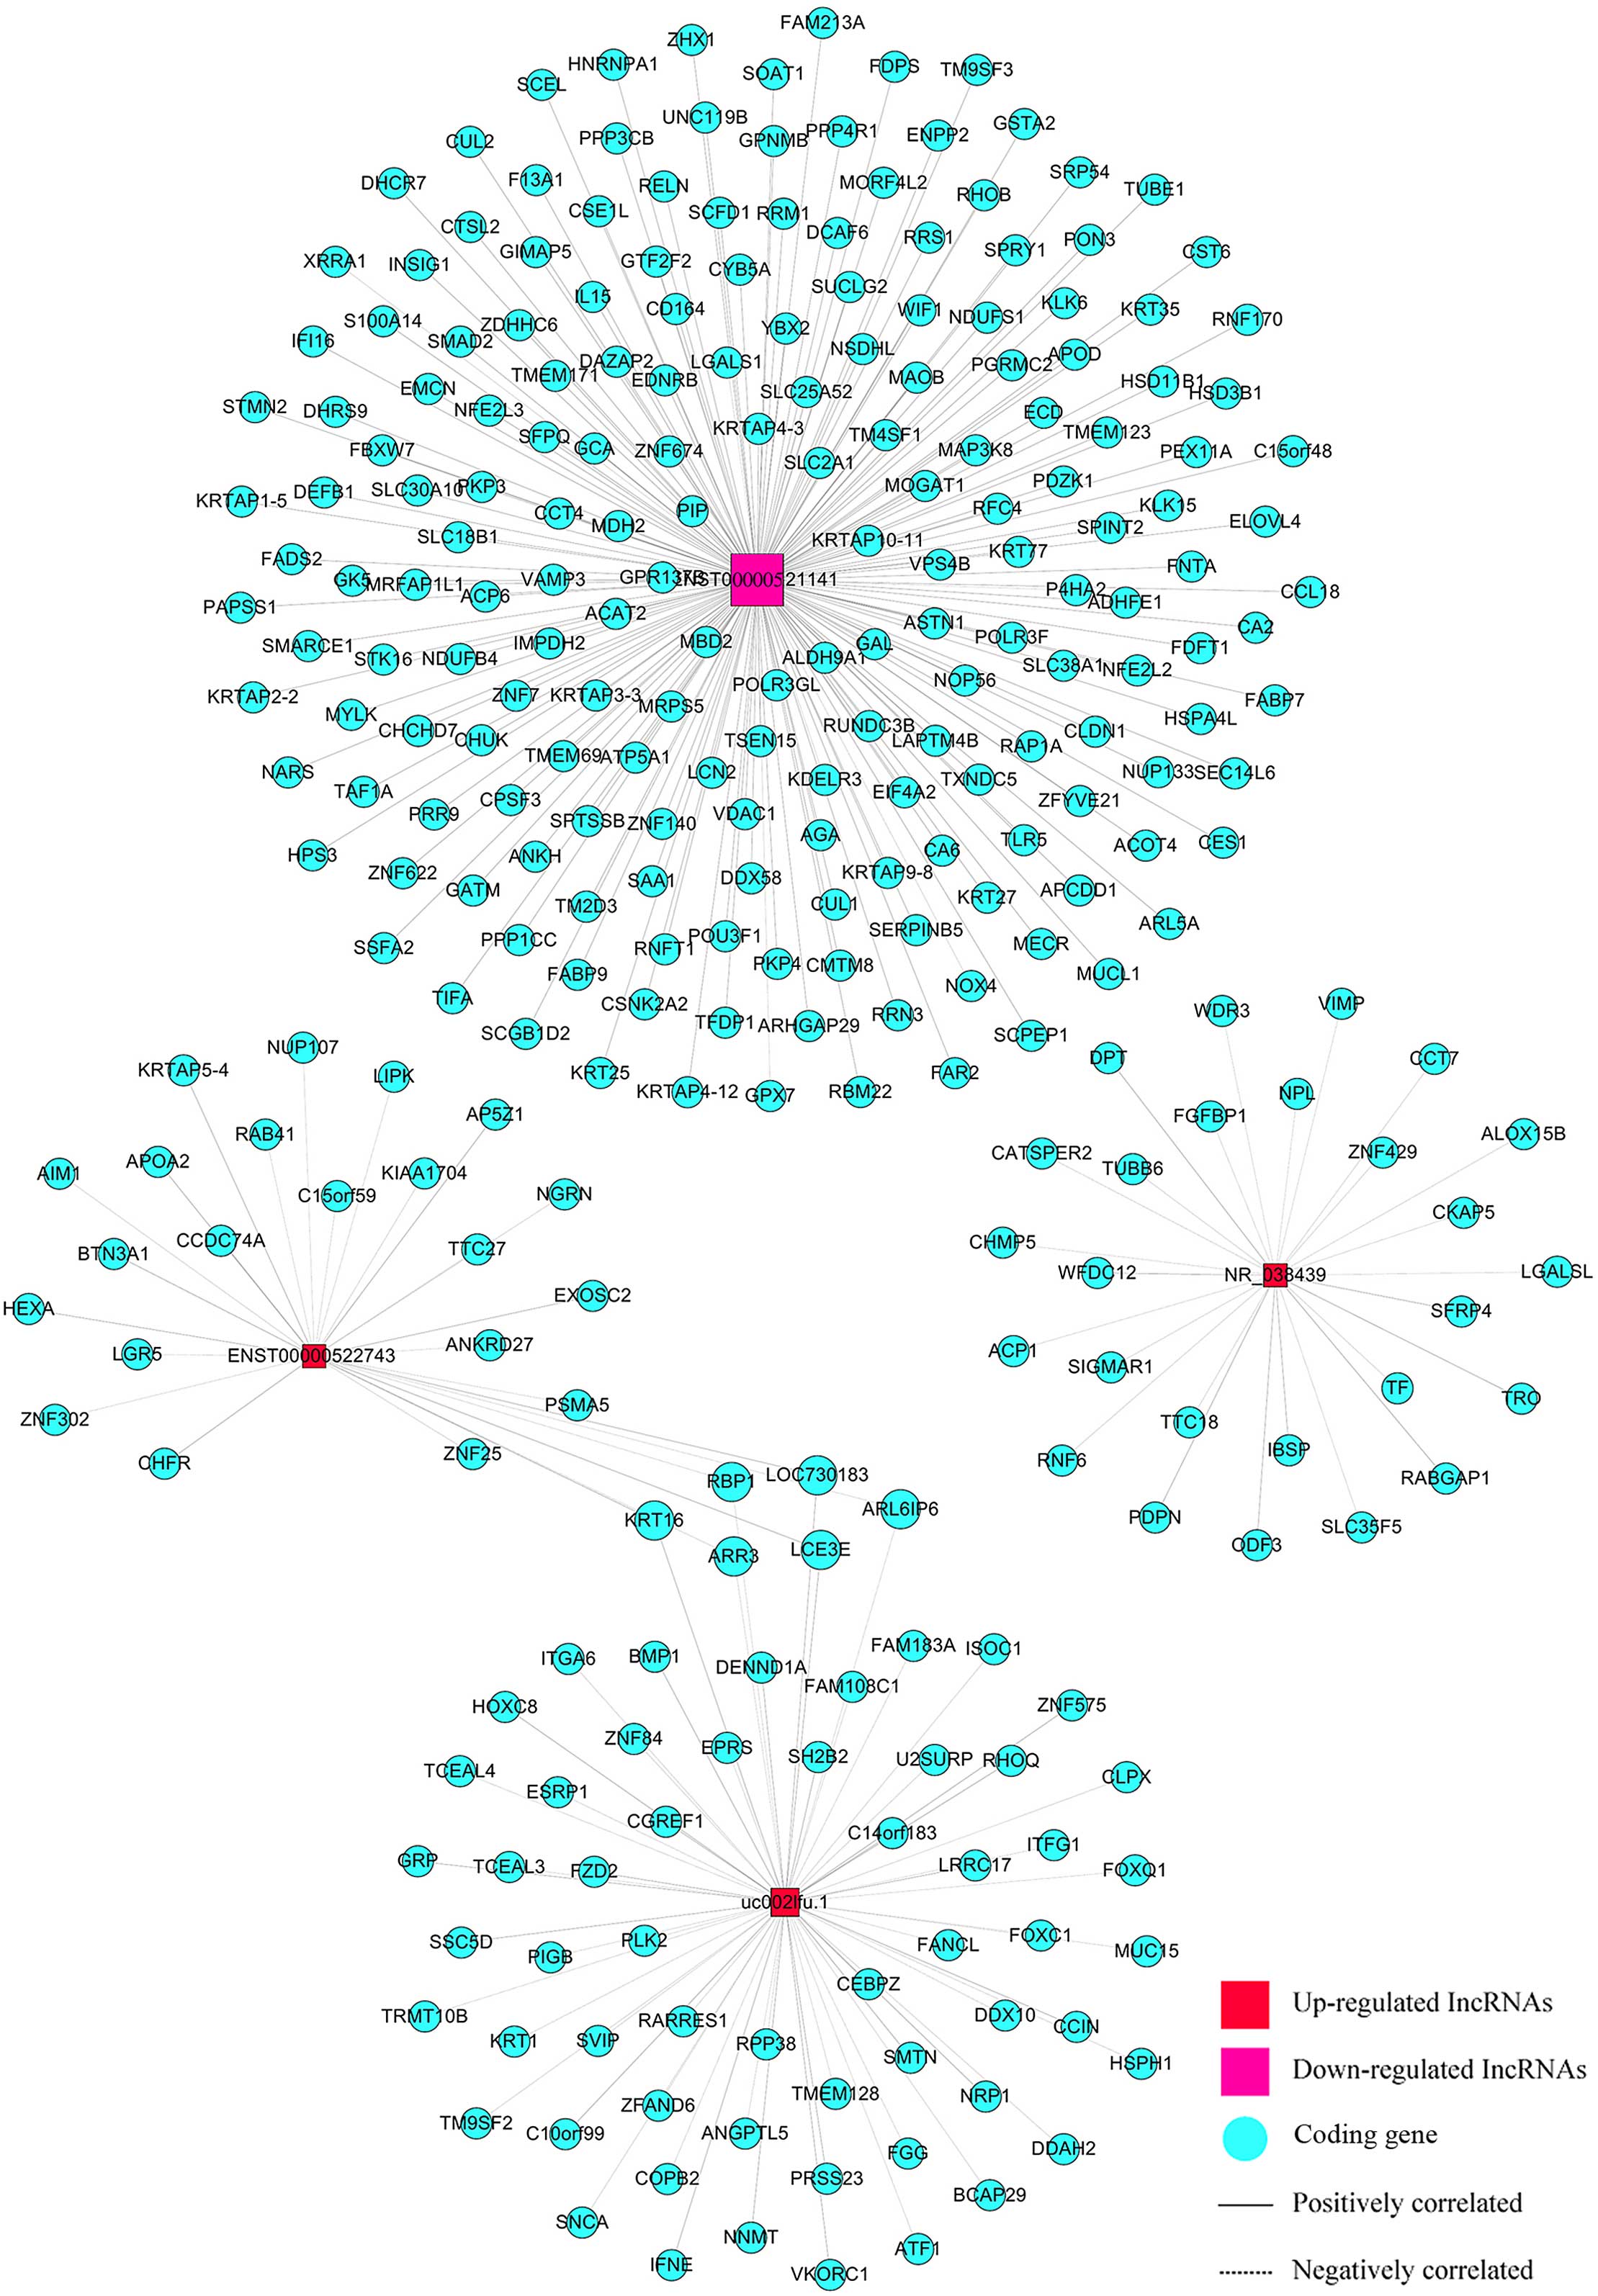
Construction of the co-expression
network
We built a co-expression network using correlation
analysis between differentially expressed lncRNAs (uc002lfu.1,
ENST00000522743, NR_038439, ENST00000521141) and mRNAs (Fig. 5). LncRNAs and mRNAs with Pearson
correlation coefficients not less than 0.999 were chosen to draw
the network by Cytoscape (v2.8.1). There were 4 lncRNAs and 298
mRNAs in this network, 302 nodes possessed 304 pairs of connections
between lncRNAs and mRNAs. The network was complex and indicated
that one lncRNA was associated with multiple mRNAs, and vice
versa.
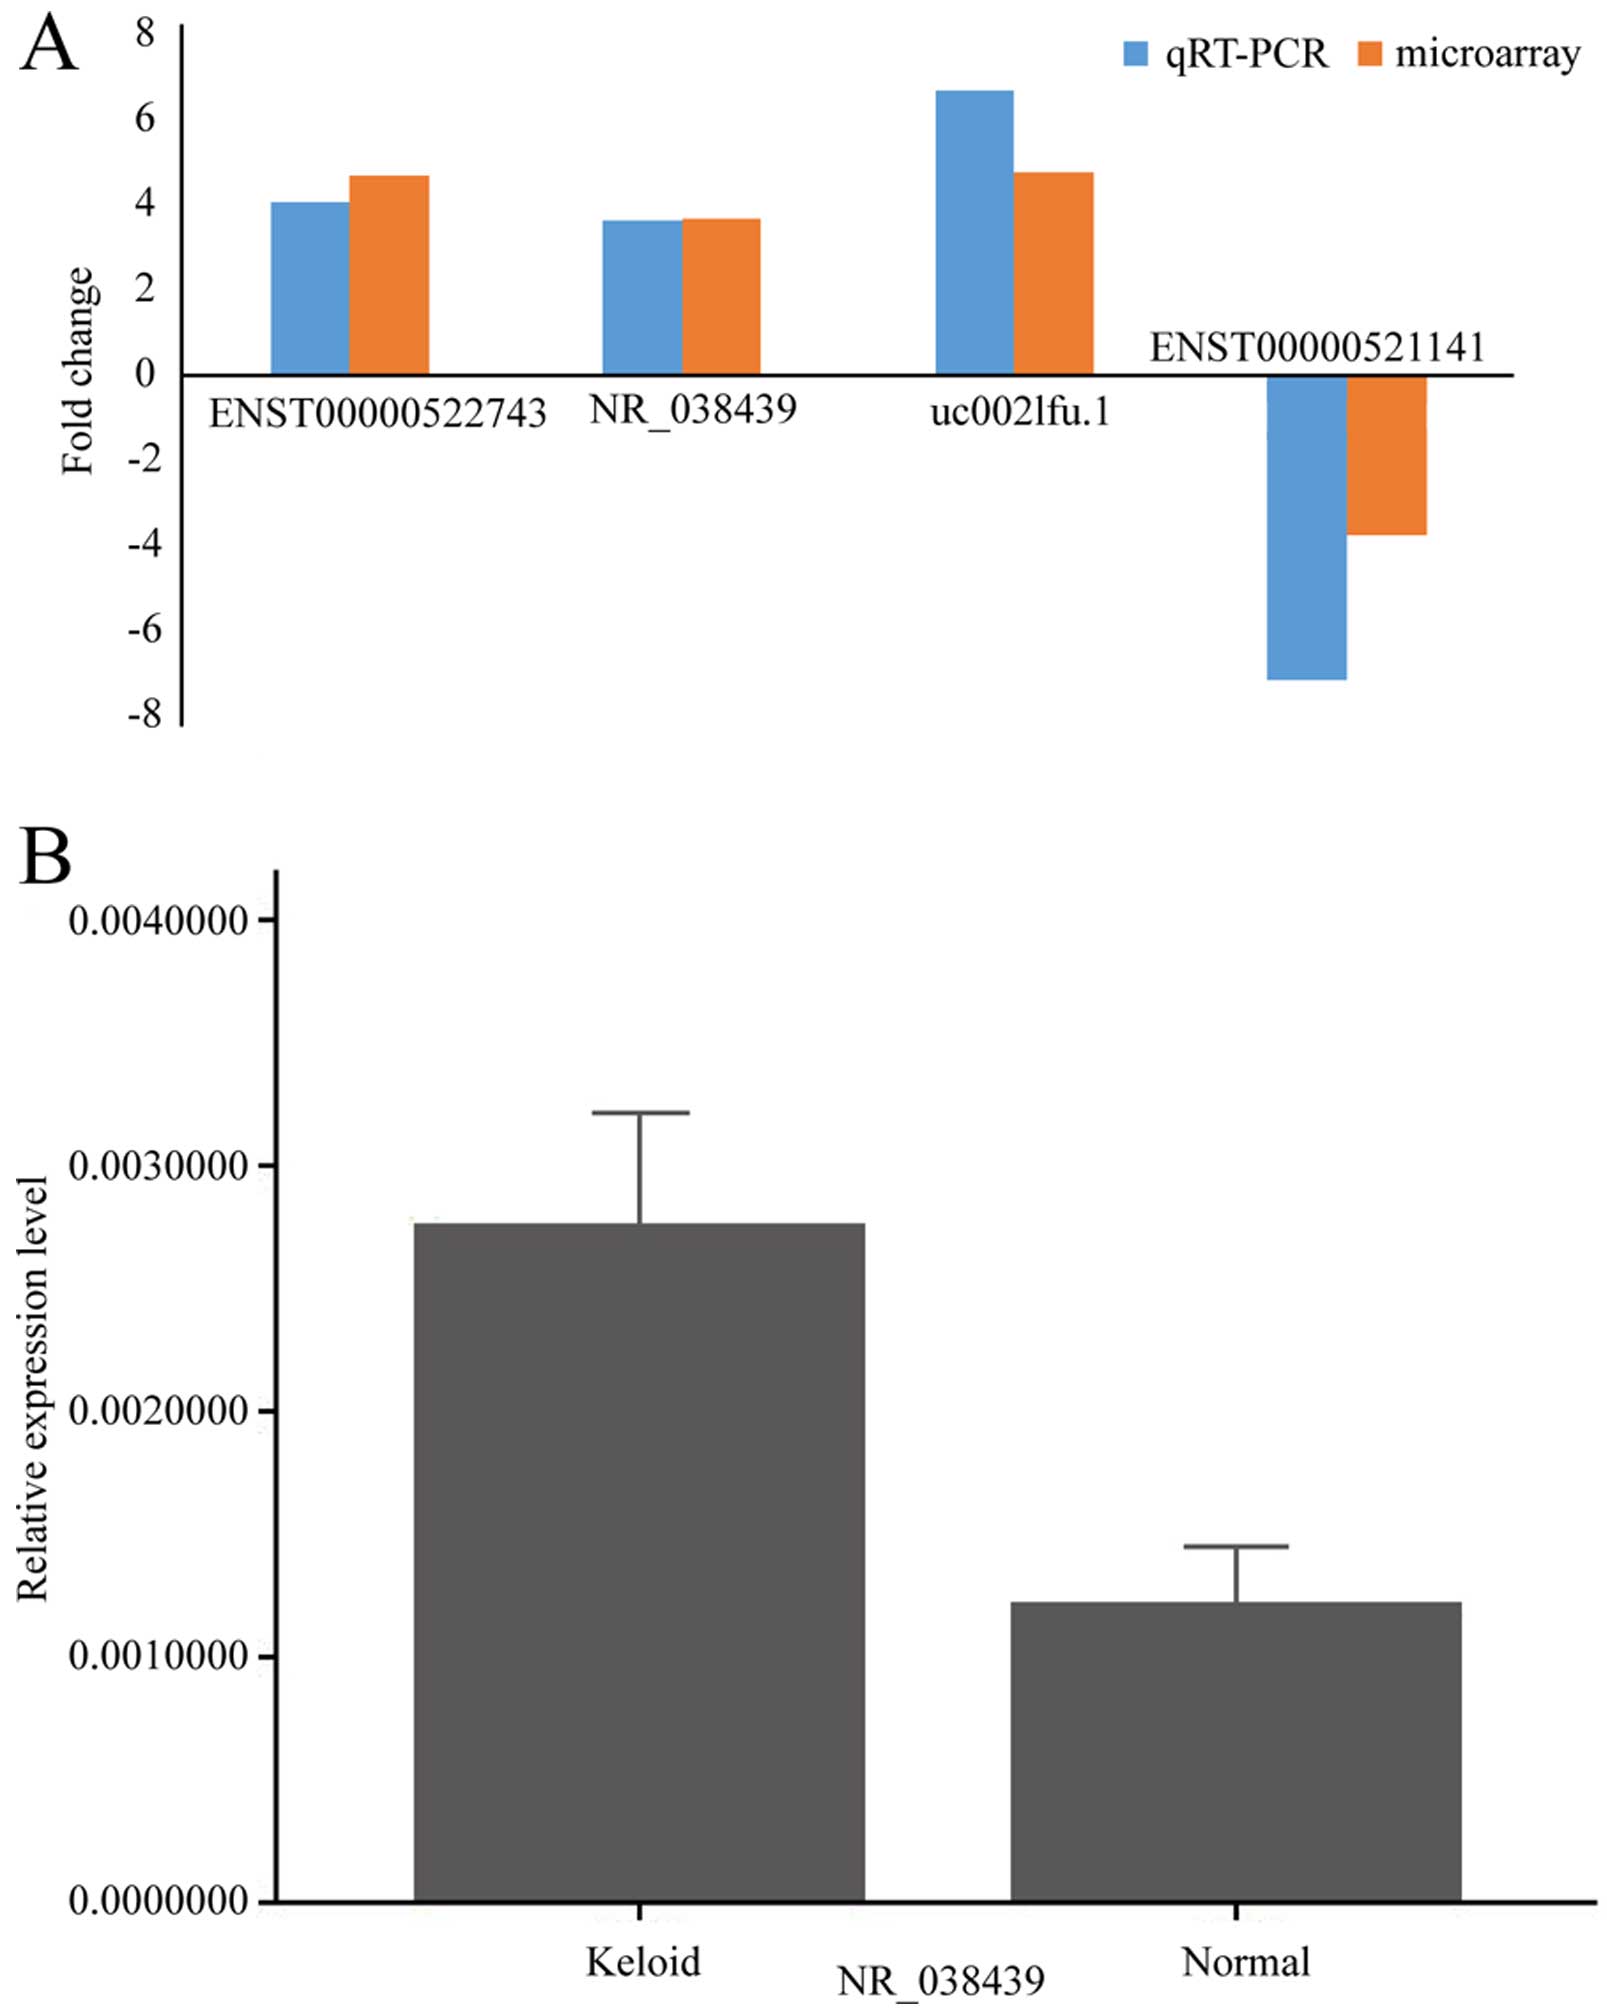
Validation of the microarray finding by
qRT-PCR
In order to validate the results from microarray, we
selected 3 upregulated (uc002lfu.1, ENST00000522743 and NR_038439)
and 1 downregulated lncRNA (ENST00000521141) from the
differentially expressed lncRNA profile, then performed
quantitative RT-PCR in original tissues. All of the chosen lncRNAs
exhibited abundant expression and had significant changes between
the two groups in microarray. The results of qRT-PCR were
consistent with microarray data (Fig.
6A). Because calcium signaling pathway may be related with
keloid, we chose NR_038439 (lncRNA CACNA1G-AS1), an antisense RNA
to CACNA1G which encodes a subtype of T-type Ca2+
channels, and performed qRT-PCR in another 13 pairs of examples.
The result was consistent (P<0.05) (Fig. 6B).
Discussion
In the present study, we have identified a group of
lncRNAs and mRNAs, which had abnormal expression in keloid. To the
best of our knowledge, this is the first large-scale lncRNA
screening, and study of its role in keloid. Non-coding RNA has been
investigated in keloid, and there are many exciting reports
(18). Liu et al (19) used miRNA microarray in 13 couples
of keloid and normal skin, and a total of 32 miRNAs were found with
abnormal expression in keloid. They also found that miR-21 could
affect apoptosis of keloid fibro-blast by negatively regulating the
expression of PTEN (20). Compared
with microRNA, lncRNA is larger, and has more complex structure.
Deregulated expression of lncRNA will disrupt cellular physiology,
and then lead to pathologies (21). Thus, we presumed that it could be
vital to the formation of keloid.
LncRNAs are important in both skin homeostasis and
diseases. When TINCR is deficient, epidermis is found with abnormal
morphological characteristics by absence of keratohyalin granules
and lamellar bodies, which are essential for protecting skin from
environmental damage (22). On the
other hand, lncRNAs are also crucial in cutaneous malignancies.
Vitamin D and its receptor (VDR) are indispensable for preventing
epidermal tumor (23), partially
due to VDR keeping a balance between oncogenic lncRNAs and tumor
suppressors (24). After comparing
lncRNAs in melanoma cell lines, melanocytes and keratinocytes,
SPRY4-IT1 was found upregulated in melanoma cells (25). Following knockdown, the invasion
and proliferation of melanoma ceased, and the apoptosis of the
cells increase. Mazar and his colleagues found that Lipin 2 was a
binding protein to SPRY4-IT1 (26). They proposed that an abnormal
expression of SPRY4-IT1 led to an increased level of Lipin 2, which
may cause the disease. The mechanism of how lncRNAs function has
not been fully studied, yet several models have been proposed.
LncRNAs can perform as molecular signals, decoys, guiding certain
protein to specific location and scaffolds (27). Therefore, further research on
lncRNA characterization will help us understand the mechanism of
keloid formation, and enable development of personalized
therapeutic strategies.
By performing microarray profiling, we found 16,710
lncRNAs and 18,788 mRNAs in keloid. Among them, 1,731 lncRNAs were
constantly upregulated and 782 were downregulated, whereas, 1,079
mRNAs were consistently upregulated and 3,282 were downregulated.
GO analysis showed that upregulated lncRNAs were enriched in
biological regulation, while downregulated ones were enriched in
cellular process and metabolic process. These also had a tight
connection with keloid formation. Using KEGG pathway analysis, we
found an obvious change in ECM-receptor interaction, calcium
signaling pathway, focal adhesion and mRNA surveillance
pathway.
After validation by qRT-PCR, lncRNA CACNA1G-AS1 was
proven to have high expression in a total of 16 keloid tissues.
CACNA1G-AS1 is an antisense RNA to CACNA1G. CACNA1G encodes Cav3.1,
which is a subtype of T-type Ca2+ channels (28). Cav3.1 was found to be a tumor
suppressor (29,30). As far as we know, there are no
reports on the function of CACNA1G-AS1. On the one hand, we have
started to build models to explore its potential function. On the
other hand, we are trying to find out how other antisense lncRNAs
interact with their target genes, which may give us an inspiration
on the current dilemma.
Antisense RNAs are defined as RNAs transcribed
either from opposite strand of a protein coding gene or a sense
strand-derived RNA (31). They can
either positively or negatively modulate protein-coding genes
(32). Xue et al (33) found that in bladder cancer cells,
lncRNA MDC1-AS can inhibit malignant cell performance by
upregulating the expression of MDC1, a cancer suppressing
gene, in both mRNA and protein levels. Our mRNA microarray result
showed that CACNA1G also exhibited higher expression level in
keloid. Thus, we presumed that CACNA1G-AS1 might regulate the
pathological process in keloid through interacting with CACNA1G.
More experiments are needed to explore the hypothesis. The L-type
calcium channel blocker verapamil, has already been used in
clinical treatment for keloid and proven effective (34). An 18-month follow-up of clinical
study showed that in a group of patients who received intralesional
verapamil hydrochloride injections after surgery, keloid was cured
in 54% of them, compared to 18% in the control group who received
the same therapy except verapamil (35). Some researchers believe that
hypertension is one of the reasons that may cause keloid, thus
anti-hypertension pharmaceuticals such as verapamil is useful
(36). Verapamil can also decrease
the production of cytokines such as IL-6 and VEGF in central keloid
fibroblasts, which are responsible for irregular proliferation of
keloid fibroblasts (37). Based on
these theories, we propose that Cav3.1 blocker may also be valid in
treating keloid in a similar way.
Besides the CACNA1G, we found 26 other genes related
to CACNA1G-AS1 in the co-expression network. They were
RABGAP1,TTC18,PDPN,TUBB6,WDR3,ACP1,WFDC12, DPT, SIGMAR1, LGALSL,
IBSP, ODF3, ZNF429, CHMP5, RNF6, ALOX15B, TF, SLC35F5, FGFBP1, NPL,
VIMP, TRC, CCT7, SFRP4, CATSPER2 and CKAP5. Many of them are
involved in cell proliferation and preventing cell apoptosis, which
are commonly seen in keloid. Dermatopontin (DPT) participates in
wound healing by activating fibronectin and improving cell adhesion
(38). CHMP5, a multivesicular
body, can inhibit cell apoptosis. When expression of CHMP5 is
inhibited in leukemic cells, caspase-3 is activated, and apoptosis
is stimulated (39). FGFBP1, known
as FGFBP, is upregulated in several types of tumors and critical
for tumor angiogenesis (40). More
research should be done to establish related regulation mechanisms
between these coding and noncoding genes.
In conclusion, we profiled differentially expressed
lncRNAs and mRNAs in keloid and normal skin tissue. Further
information on the candidate lncRNAs and their associated
protein-coding genes were also studied. CACNA1G-AS1 was upregulated
in keloid, and it may be important in keloid formation. However,
further studies of the possible mechanism are required. Our
findings indicate that lncRNAs are involved in the pathological
process of keloid, which may help to explain the mechanism of
keloid formation.
Acknowledgements
The present study was supported by a grant from the
National Natural Science Foundation of China (NSFC) (no.
81071571).
References
|
1
|
Halim AS, Emami A, Salahshourifar I and
Kannan TP: Keloid scarring: Understanding the genetic basis,
advances, and prospects. Arch Plast Surg. 39:184–189. 2012.
View Article : Google Scholar : PubMed/NCBI
|
|
2
|
van Leeuwen MC, van der Wal MB, Bulstra
AE, Galindo-Garre F, Molier J, van Zuijlen PP, van Leeuwen PA and
Niessen FB: Intralesional cryotherapy for treatment of keloid
scars: A prospective study. Plast Reconstr Surg. 135:580–589. 2015.
View Article : Google Scholar : PubMed/NCBI
|
|
3
|
Erol OO, Gurlek A, Agaoglu G, Topcuoglu E
and Oz H: Treatment of hypertrophic scars and keloids using intense
pulsed light (IPL). Aesthetic Plast Surg. 32:902–909. 2008.
View Article : Google Scholar : PubMed/NCBI
|
|
4
|
Juckett G and Hartman-Adams H: Management
of keloids and hypertrophic scars. Am Fam Physician. 80:253–260.
2009.PubMed/NCBI
|
|
5
|
Mseddi M, Mesrati H, Ktaari S, Amouri M,
Chaaben H, Boudaya S and Turki H: Treatment of keloid with phenol:
A new therapy. Ann Dermatol Venereol. 141:493–499. 2014.(In
French). View Article : Google Scholar : PubMed/NCBI
|
|
6
|
van Leeuwen MC, Bulstra AE, van Leeuwen PA
and Niessen FB: A new argon gas-based device for the treatment of
keloid scars with the use of intralesional cryotherapy. J Plast
Reconstr Aesthet Surg. 67:1703–1710. 2014. View Article : Google Scholar : PubMed/NCBI
|
|
7
|
Nakashima M, Chung S, Takahashi A,
Kamatani N, Kawaguchi T, Tsunoda T, Hosono N, Kubo M, Nakamura Y
and Zembutsu H: A genome-wide association study identifies four
susceptibility loci for keloid in the Japanese population. Nat
Genet. 42:768–771. 2010. View
Article : Google Scholar : PubMed/NCBI
|
|
8
|
Chen W, Fu X, Sun X, Sun T, Zhao Z and
Sheng Z: Analysis of differentially expressed genes in keloids and
normal skin with cDNA microarray. J Surg Res. 113:208–216. 2003.
View Article : Google Scholar : PubMed/NCBI
|
|
9
|
Unahabhokha T, Sucontphunt A, Nimmannit U,
Chanvorachote P, Yongsanguanchai N and Pongrakhananon V: Molecular
signalings in keloid disease and current therapeutic approaches
from natural based compounds. Pharm Biol. 53:457–463. 2015.
View Article : Google Scholar
|
|
10
|
Murao N, Seino K, Hayashi T, Ikeda M,
Funayama E, Furukawa H, Yamamoto Y and Oyama A: Treg-enriched
CD4+ T cells attenuate collagen synthesis in keloid
fibroblasts. Exp Dermatol. 23:266–271. 2014. View Article : Google Scholar : PubMed/NCBI
|
|
11
|
Kung JT, Colognori D and Lee JT: Long
noncoding RNAs: Past, present, and future. Genetics. 193:651–669.
2013. View Article : Google Scholar : PubMed/NCBI
|
|
12
|
Bonasio R and Shiekhattar R: Regulation of
transcription by long noncoding RNAs. Annu Rev Genet. 48:433–455.
2014. View Article : Google Scholar : PubMed/NCBI
|
|
13
|
He Y, Meng XM, Huang C, Wu BM, Zhang L, Lv
XW and Li J: Long noncoding RNAs: Novel insights into hepatocelluar
carcinoma. Cancer Lett. 344:20–27. 2014. View Article : Google Scholar
|
|
14
|
Martens-Uzunova ES, Böttcher R, Croce CM,
Jenster G, Visakorpi T and Calin GA: Long noncoding RNA in
prostate, bladder, and kidney cancer. Eur Urol. 65:1140–1151. 2014.
View Article : Google Scholar : PubMed/NCBI
|
|
15
|
Hombach S and Kretz M: The non-coding
skin: Exploring the roles of long non-coding RNAs in epidermal
homeostasis and disease. BioEssays. 35:1093–1100. 2013. View Article : Google Scholar : PubMed/NCBI
|
|
16
|
Kretz M, Webster DE, Flockhart RJ, Lee CS,
Zehnder A, Lopez-Pajares V, Qu K, Zheng GX, Chow J, Kim GE, et al:
Suppression of progenitor differentiation requires the long
noncoding RNA ANCR. Genes Dev. 26:338–343. 2012. View Article : Google Scholar : PubMed/NCBI
|
|
17
|
Boggio RF, Freitas VM, Cassiola FM,
Urabayashi M and Machado-Santelli GM: Effect of a calcium-channel
blocker (verapamil) on the morphology, cytoskeleton and collagenase
activity of human skin fibroblasts. Burns. 37:616–625. 2011.
View Article : Google Scholar
|
|
18
|
Kashiyama K, Mitsutake N, Matsuse M, Ogi
T, Saenko VA, Ujifuku K, Utani A, Hirano A and Yamashita S:
miR-196a down-regulation increases the expression of type I and III
collagens in keloid fibroblasts. J Invest Dermatol. 132:1597–1604.
2012. View Article : Google Scholar : PubMed/NCBI
|
|
19
|
Liu Y, Yang D, Xiao Z and Zhang M: miRNA
expression profiles in keloid tissue and corresponding normal skin
tissue. Aesthetic Plast Surg. 36:193–201. 2012. View Article : Google Scholar
|
|
20
|
Liu Y, Wang X, Yang D, Xiao Z and Chen X:
MicroRNA-21 affects proliferation and apoptosis by regulating
expression of PTEN in human keloid fibroblasts. Plast Reconstr
Surg. 134:561e–573e. 2014. View Article : Google Scholar : PubMed/NCBI
|
|
21
|
Di Gesualdo F, Capaccioli S and Lulli M: A
pathophysiological view of the long non-coding RNA world.
Oncotarget. 5:10976–10996. 2014. View Article : Google Scholar : PubMed/NCBI
|
|
22
|
Kretz M: TINCR, staufen1, and cellular
differentiation. RNA Biol. 10:1597–1601. 2013. View Article : Google Scholar : PubMed/NCBI
|
|
23
|
Bikle DD: The vitamin D receptor: A tumor
suppressor in skin. Discov Med. 11:7–17. 2011.PubMed/NCBI
|
|
24
|
Jiang YJ and Bikle DD: LncRNA profiling
reveals new mechanism for VDR protection against skin cancer
formation. J Steroid Biochem Mol Biol. 144pa:87–90. 2014.
|
|
25
|
Wan DC and Wang KC: Long noncoding RNA:
Significance and potential in skin biology. Cold Spring Harb
Perspect Med. 4:1–10. 2014. View Article : Google Scholar
|
|
26
|
Mazar J, Zhao W, Khalil AM, Lee B, Shelley
J, Govindarajan SS, Yamamoto F, Ratnam M, Aftab MN, Collins S, et
al: The functional characterization of long noncoding RNA SPRY4-IT1
in human melanoma cells. Oncotarget. 5:8959–8969. 2014. View Article : Google Scholar : PubMed/NCBI
|
|
27
|
Wang KC and Chang HY: Molecular mechanisms
of long noncoding RNAs. Mol Cell. 43:904–914. 2011. View Article : Google Scholar : PubMed/NCBI
|
|
28
|
Fukunaga K: Cognitive Function and
Calcium. Cognitive improvement through T type calcium channel
stimulation. Clin Calcium. 25:247–254. 2015.(In Japanese).
PubMed/NCBI
|
|
29
|
Toyota M, Ho C, Ohe-Toyota M, Baylin SB
and Issa JP: Inactivation of CACNA1G, a T-type calcium channel
gene, by aberrant methylation of its 5′ CpG island in human tumors.
Cancer Res. 59:4535–4541. 1999.PubMed/NCBI
|
|
30
|
Ohkubo T and Yamazaki J: T-type
voltage-activated calcium channel Cav3.1, but not Cav3.2, is
involved in the inhibition of proliferation and apoptosis in MCF-7
human breast cancer cells. Int J Oncol. 41:267–275. 2012.PubMed/NCBI
|
|
31
|
Villegas VE and Zaphiropoulos PG:
Neighboring gene regulation by antisense long non-coding RNAs. Int
J Mol Sci. 16:3251–3266. 2015. View Article : Google Scholar : PubMed/NCBI
|
|
32
|
Zhang ZZ, Shen ZY, Shen YY, Zhao EH, Wang
M, Wang CJ, Cao H and Xu J: HOTAIR long noncoding RNA promotes
gastric cancer metastasis through suppression of Poly r(C) Binding
Protein (PCBP) 1. Mol Cancer Ther. 14:1162–1170. 2015. View Article : Google Scholar : PubMed/NCBI
|
|
33
|
Xue Y, Ma G, Zhang Z, Hua Q, Chu H, Tong
N, Yuan L, Qin C, Yin C, Zhang Z, et al: A novel antisense long
noncoding RNA regulates the expression of MDC1 in bladder cancer.
Oncotarget. 6:484–493. 2015. View Article : Google Scholar :
|
|
34
|
Ledon JA, Savas J, Franca K, Chacon A and
Nouri K: Intralesional treatment for keloids and hypertrophic
scars: A review. Dermatol Surg. 39:1745–1757. 2013. View Article : Google Scholar : PubMed/NCBI
|
|
35
|
D'Andrea F, Brongo S, Ferraro G and Baroni
A: Prevention and treatment of keloids with intralesional
verapamil. Dermatology. 204:60–62. 2002. View Article : Google Scholar : PubMed/NCBI
|
|
36
|
Huang C and Ogawa R: Pharmacological
treatment for keloids. Expert Opin Pharmacother. 14:2087–2100.
2013. View Article : Google Scholar : PubMed/NCBI
|
|
37
|
Giugliano G, Pasquali D, Notaro A, Brongo
S, Nicoletti G, D'Andrea F, Bellastella A and Sinisi AA: Verapamil
inhibits interleukin-6 and vascular endothelial growth factor
production in primary cultures of keloid fibroblasts. Br J Plast
Surg. 56:804–809. 2003. View Article : Google Scholar : PubMed/NCBI
|
|
38
|
Wu W, Okamoto O, Kato A, Matsuo N, Nomizu
M, Yoshioka H and Fujiwara S: Dermatopontin regulates fibrin
formation and its biological activity. J Invest Dermatol.
134:256–263. 2014. View Article : Google Scholar
|
|
39
|
Wang H, Liu J, Wang F, Chen M, Xiao Z,
Ouyang R, Fei A, Shen Y and Pan S: The role of charged
multivesicular body protein 5 in programmed cell death in leukemic
cells. Acta Biochim Biophys Sin (Shanghai). 45:383–390. 2013.
View Article : Google Scholar
|
|
40
|
Abuharbeid S, Czubayko F and Aigner A: The
fibroblast growth factor-binding protein FGF-BP. Int J Biochem Cell
Biol. 38:1463–1468. 2006. View Article : Google Scholar
|