Introduction
The role of targeted therapies in medical oncology
has tremendously increased over the last ten years. A high number
of novel molecular substances have already been approved for
clinical use and several compounds are in ongoing trials at present
(1,2). Despite some very successful
therapeutics like the tyrosine kinase inhibitor imatinib, which
greatly ameliorated the outcome of patients suffering from chronic
myelogenous leukemia (3), several
of the molecular drugs have not met the expectations from
preclinical data when applied clinically. We reason that one cause
for this discrepancy could be that many drugs are tested under
non-physiological two-dimensional (2D) cell culture conditions not
sufficiently reflecting the microenvironment in vivo.
Three-dimensional (3D) cell culture models are in
use for several decades now. Amongst scientists from various fields
of biology and medicine, the culturing of cells in three dimensions
opened new avenues of experimentation and thinking. Aside from its
potential for tissues engineering, our understanding of cell
biology has reached a new dimension ranging from gene expression to
protein-protein interactions and signal transduction. The
groundbreaking work of Bissell and co-workers and many others
strikingly exhibited the essence of 3D growth conditions for single
cells and higher order multicellular organisms (4–7).
Today, a large body of literature evidently
demonstrates that the response of 3D grown cells to external stress
and stimuli such as drug treatment or exposure to ionizing
radiation more reliably reflects the cell response in vivo
than the results obtained under 2D cell monolayer growth conditions
(4,8–16).
This effect could be due to both, the change in morphology and the
activation of integrins and other cell adhesion receptors by
binding to the ECM components, which strongly impact on cell
behavior, functionality, gene and protein expression,
protein-protein interactions, signal transduction and cellular
sensitivity to cytotoxic stress (7,15,17–28).
For in vitro investigation, cell phenotype and molecular
processes can be conserved in 3D ECM-based scaffolds. This
understanding gains particular relevance in the field of
translational research. An example of even higher clinical
relevance is a whole genome gene expression analysis of 3D grown
human breast cancer cell lines, which was elegantly used to
demonstrate predictive power for the probability of relapse and
overall survival of breast cancer patients (12,22).
By keeping in mind the heterogeneous distribution
and expression patterns of ECM proteins in the different types of
human malignancies, cell phenotypes of normal epithelial cells and
cancer cells can be reproducibly maintained or restored by
culturing them in laminin-rich basement membrane extracellular
matrix (lrECM; Matrigel) (7,29).
Either embedded or ‘on top’ with subsequent lrECM overlay, the
lrECM isolated from the Engelbreth-Holm-Swarm mouse sarcoma
provides a broad spectrum of applications for 3D cell
investigations including measurement of apoptosis, cell
proliferation, malignant transformation and differentiation. A
variety of published protocols explains how cells can be isolated
from lrECM gels for protein expression and functional exploration
or examined in situ using microscopy on living cells or
histology (immunohistochemistry, immunofluorescence) on fixed
cells, organotypic cell cultures or tissues (23,29).
Cell survival in vitro is often measured in
terms of apoptosis, dye exclusion or proliferation. Although more
time consuming, the colony forming assay has been shown to reliably
determine tumor cell kill and reflect tumor control, whereas
proliferation assays are used to explore tumor growth delay
(30,31). Consequently, the colony forming
assay is the gold standard for all disciplines for evaluating
dose-effect relationships between e.g. drug concentration or
radiation dose and cell survival (32).
However, to date, there is no existing assay to
determine clonogenic cell survival as well as tumor proliferation
under 3D cell culture conditions in a large scale for drug efficacy
testing. On this basis, in the present study, we describe a
high-throughput 3D lrECM based cell culture technique that greatly
broadens the spectrum of already existing 3D cell culture protocols
and enables a robust, reliable and reproducible analysis of the
cancer cell response to cytotoxic drugs, targeted therapeutics or
different kinds of radiation.
Materials and methods
Cell culture
FaDu, A549 and DLD1 carcinoma cells were obtained
from the American Type Culture Collection (ATCC; Manassas, VA,
USA). The origin and stability of the cells were routinely
monitored by short tandem repeat analysis (microsatellites). Cells
were cultured in Dulbecco's modified Eagle's medium (DMEM; PAA
Laboratories GmbH, Coelbe, Germany) supplemented with 10% fetal
bovine serum (FBS; PAA Laboratories) and 1% non-essential amino
acids (PAA Laboratories) at 37°C in a humidified atmosphere
containing 7% CO2. For all experiments asynchronously
growing cell cultures were used.
Radiation exposure
Irradiation (X-rays, 200 kV, 20 mA) was performed at
room temperature using a Yxlon Y.TU 320 (Yxlon International CT
Development GmbH, Hattingen, Germany) containing a 0.5-mm copper
filter. For measurement of the absorbed dose a Duplex dosimeter
(PTW Freiburg GmbH, Freiburg, Germany) was used. The dose-rate was
~1.3 Gy/min and applied doses ranged from 0 to 4 Gy.
2D colony formation assay
Asynchronously growing cells were trypsinized,
counted using a Neubauer counting chamber (Paul Marienfeld GmbH
& Co. KG, Lauda-Königshofen, Germany) and plated as single
cells in 6-well cell culture plates. After 24 h, cells were
irradiated with 4 Gy or treated with cisplatin (25 μM) or cetuximab
(5 μg/ml; Merck, Darmstadt, Germany) or left untreated. After 1 h
cells were washed with 1X PBS to remove cisplatin from the cell
culture medium. For determination of long-term survival cells were
cultured for 8 days (A549, DLD1) or 11 days (FaDu) enabling colony
growth. After fixation with 80% ethanol cells were stained with
Coomassie blue (Merck). Counting of cell colonies with >50 cells
was performed using a Stemi 2000 microscope (Carl Zeiss, Jena,
Germany). Surviving fractions were calculated as follows: numbers
of colonies formed/[numbers of cells plated (irradiated) × plating
efficiency (unirradiated)]. Each point on survival curves
represents the mean surviving fraction from at least three
independent experiments.
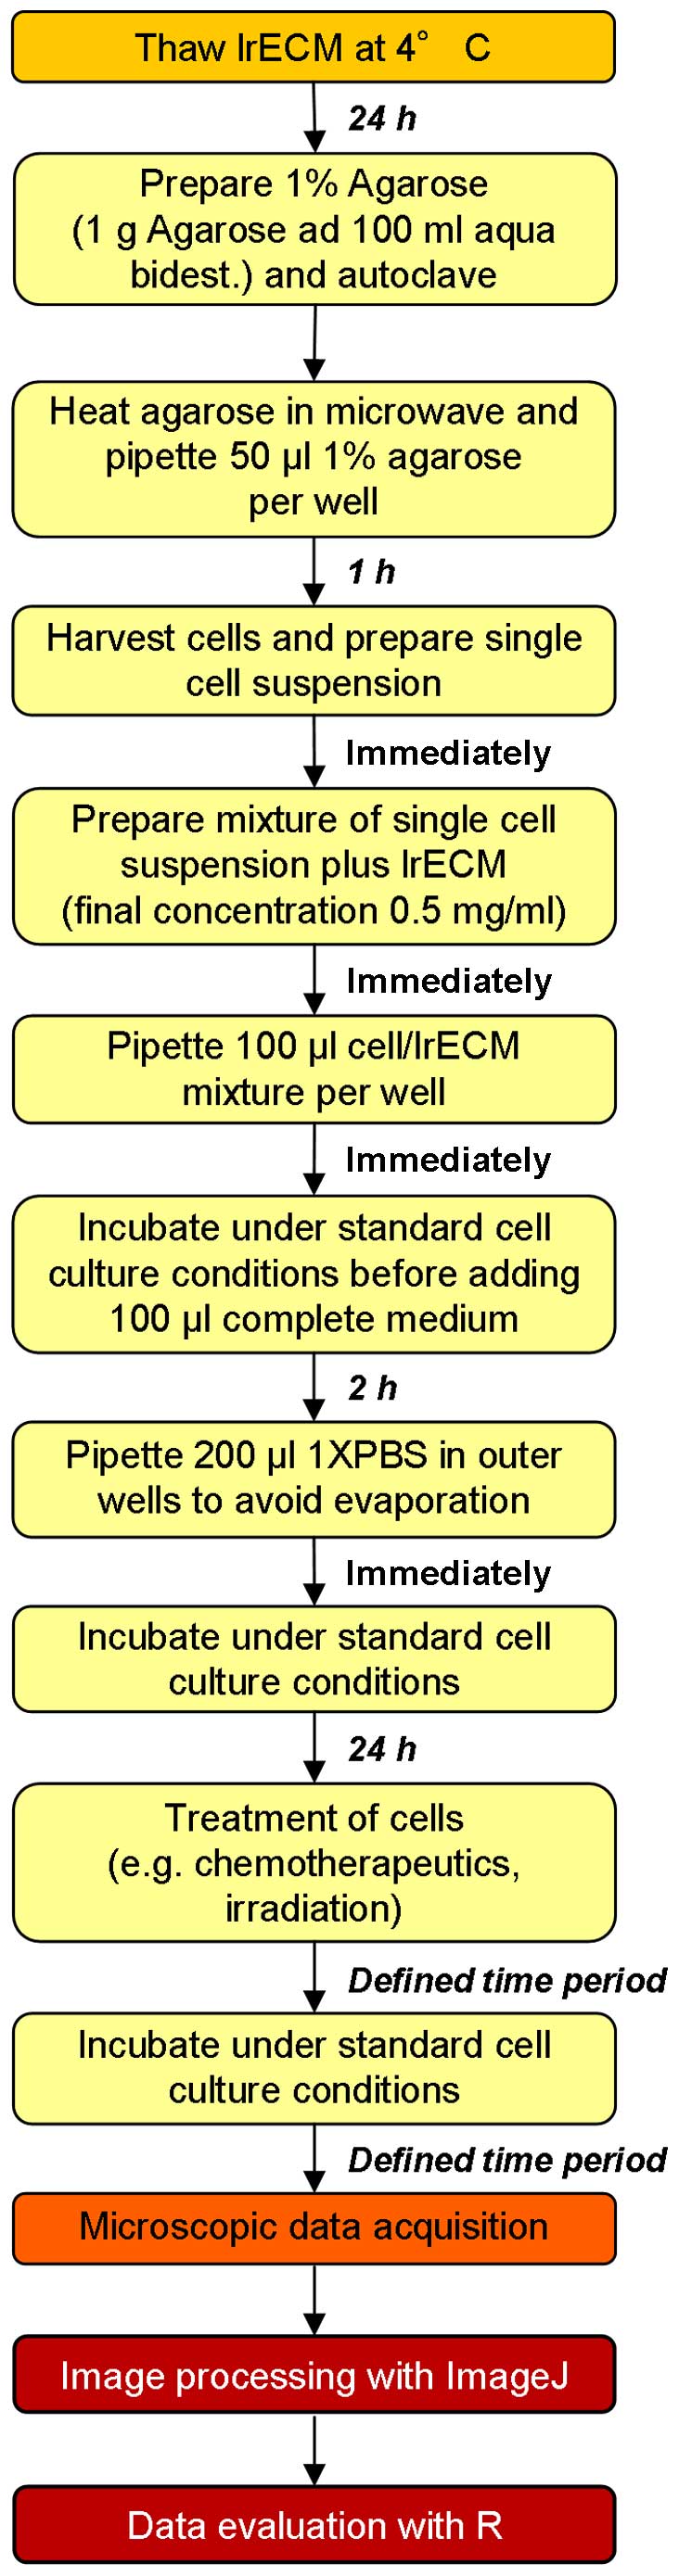
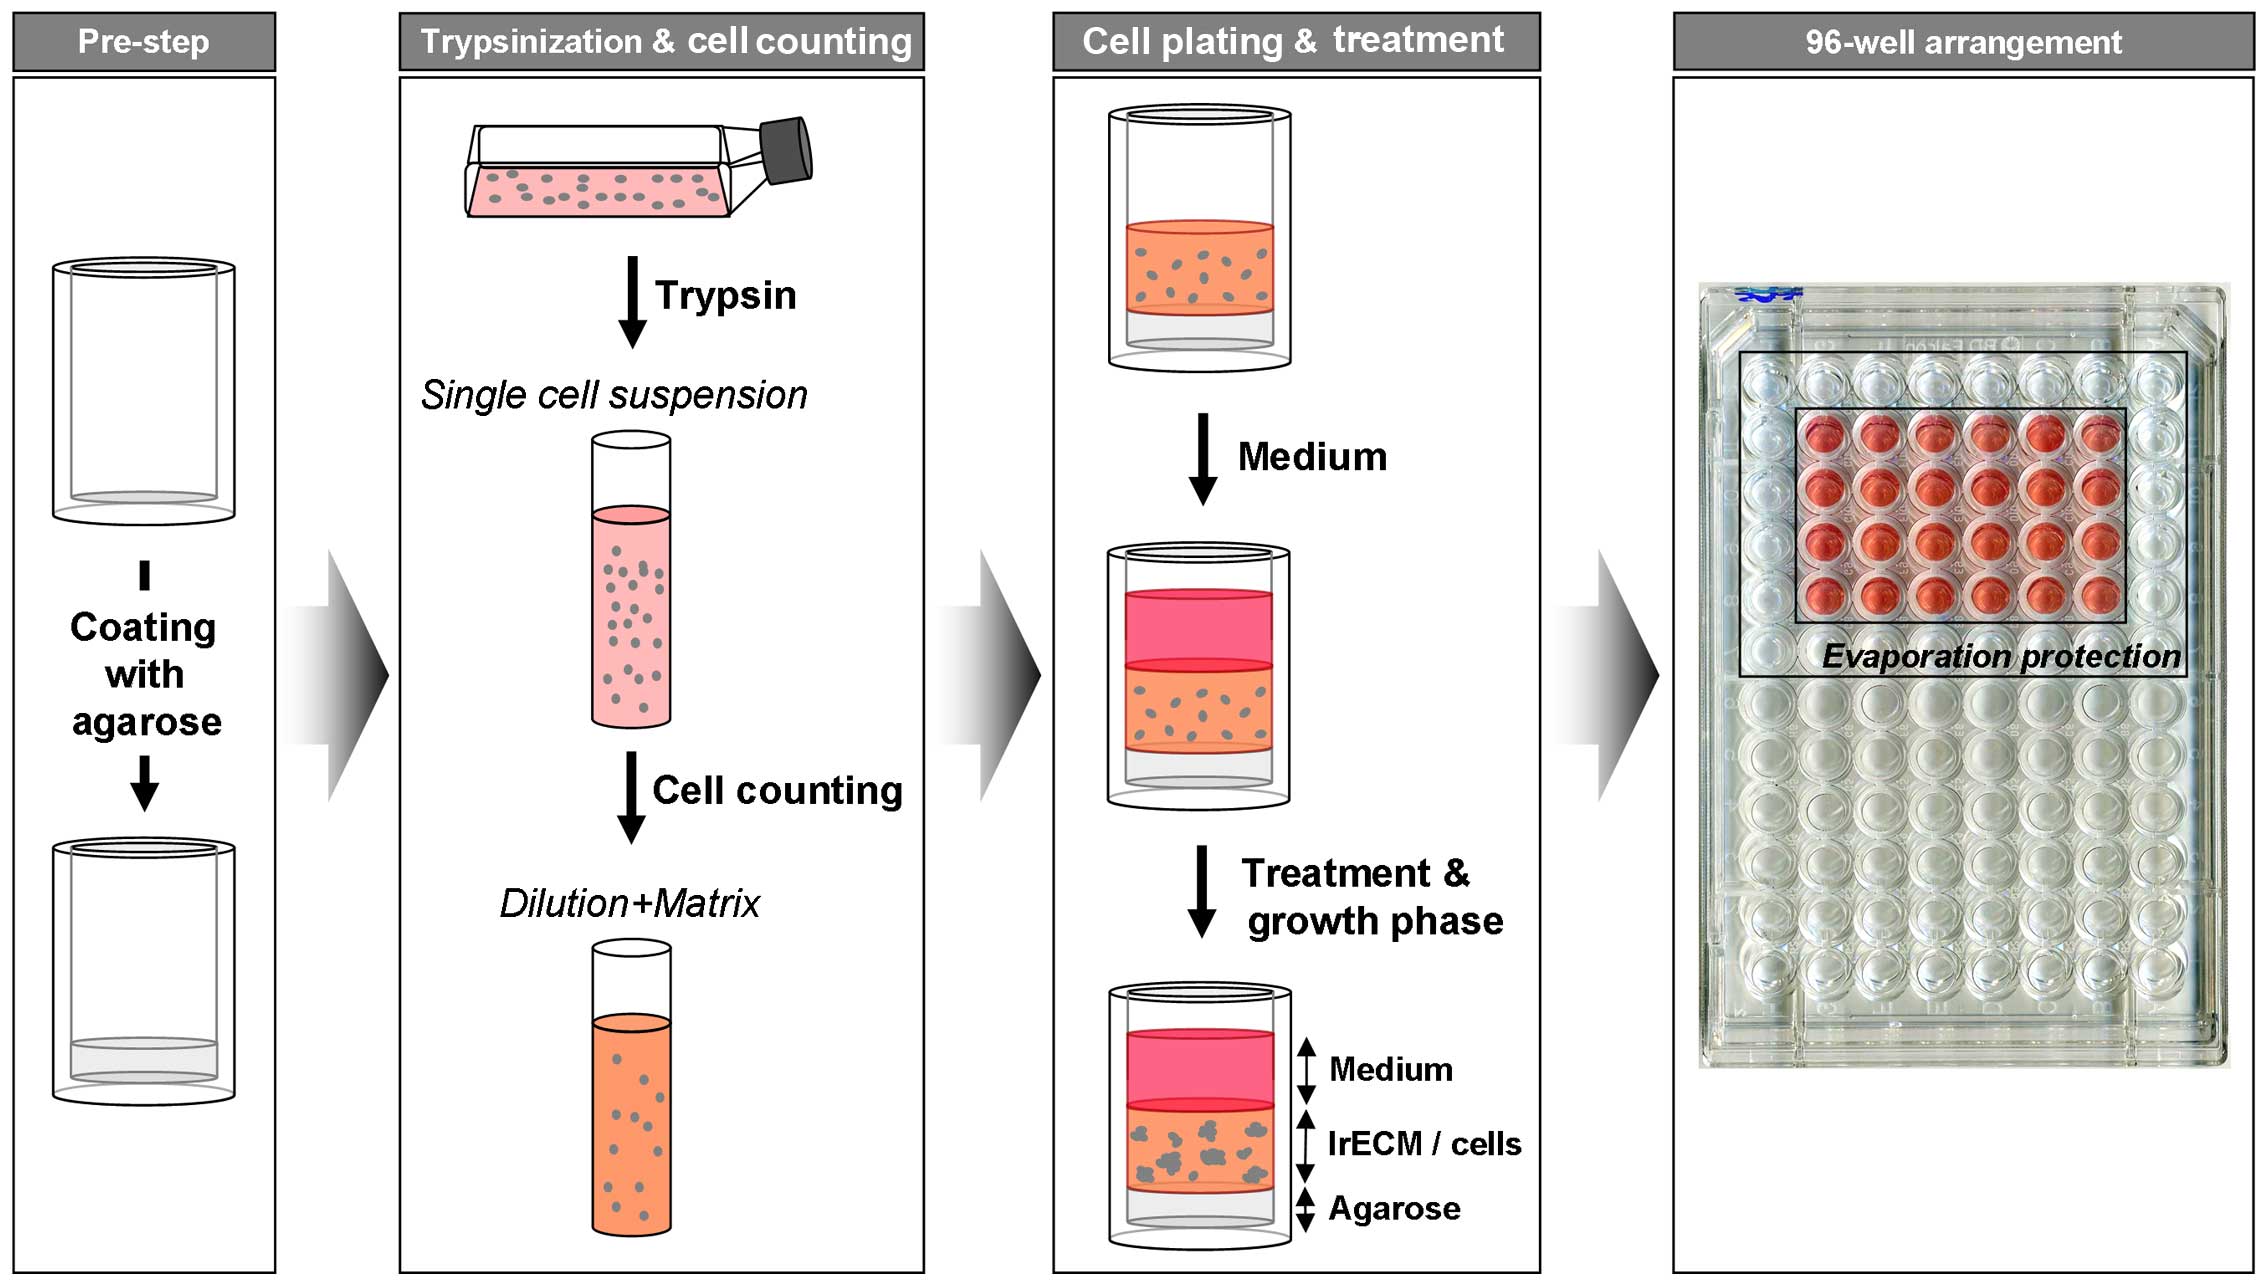
3D colony formation assay
Asynchronously growing cells were trypsinized,
counted and mixed with cell culture medium containing 0.5 mg/ml
lrECM (cat. no. 354248; BD Biosciences, Heidelberg, Germany). Then,
100 μl of this mixture was placed in 96-well plates precoated with
50 μl of 1% agarose. After 2 h, the cell-lrECM layer was covered
with 100 μl of cell culture medium. To prevent evaporation of
medium, circumjacent wells were filled with 1X PBS (Fig. 1). After 24 h cells were irradiated
with 4 Gy or treated with cisplatin (25 μM) or cetuximab (5 μg/ml)
or left untreated similar to 2D cell culture conditions. To
withdraw cisplatin from the cell culture, medium was carefully
removed without touching the cell-lrECM layer and new cell culture
medium was added. This step was repeated five times. Cells were
cultured for 8 days (A549, DLD1) or 11 days (FaDu). Cell clusters
(with the minimum size of a cell cluster containing 50 cells) were
either counted microscopically without staining using a Axiovert 25
with a 2.5× objective (Carl Zeiss) or evaluated automatically as
described below.
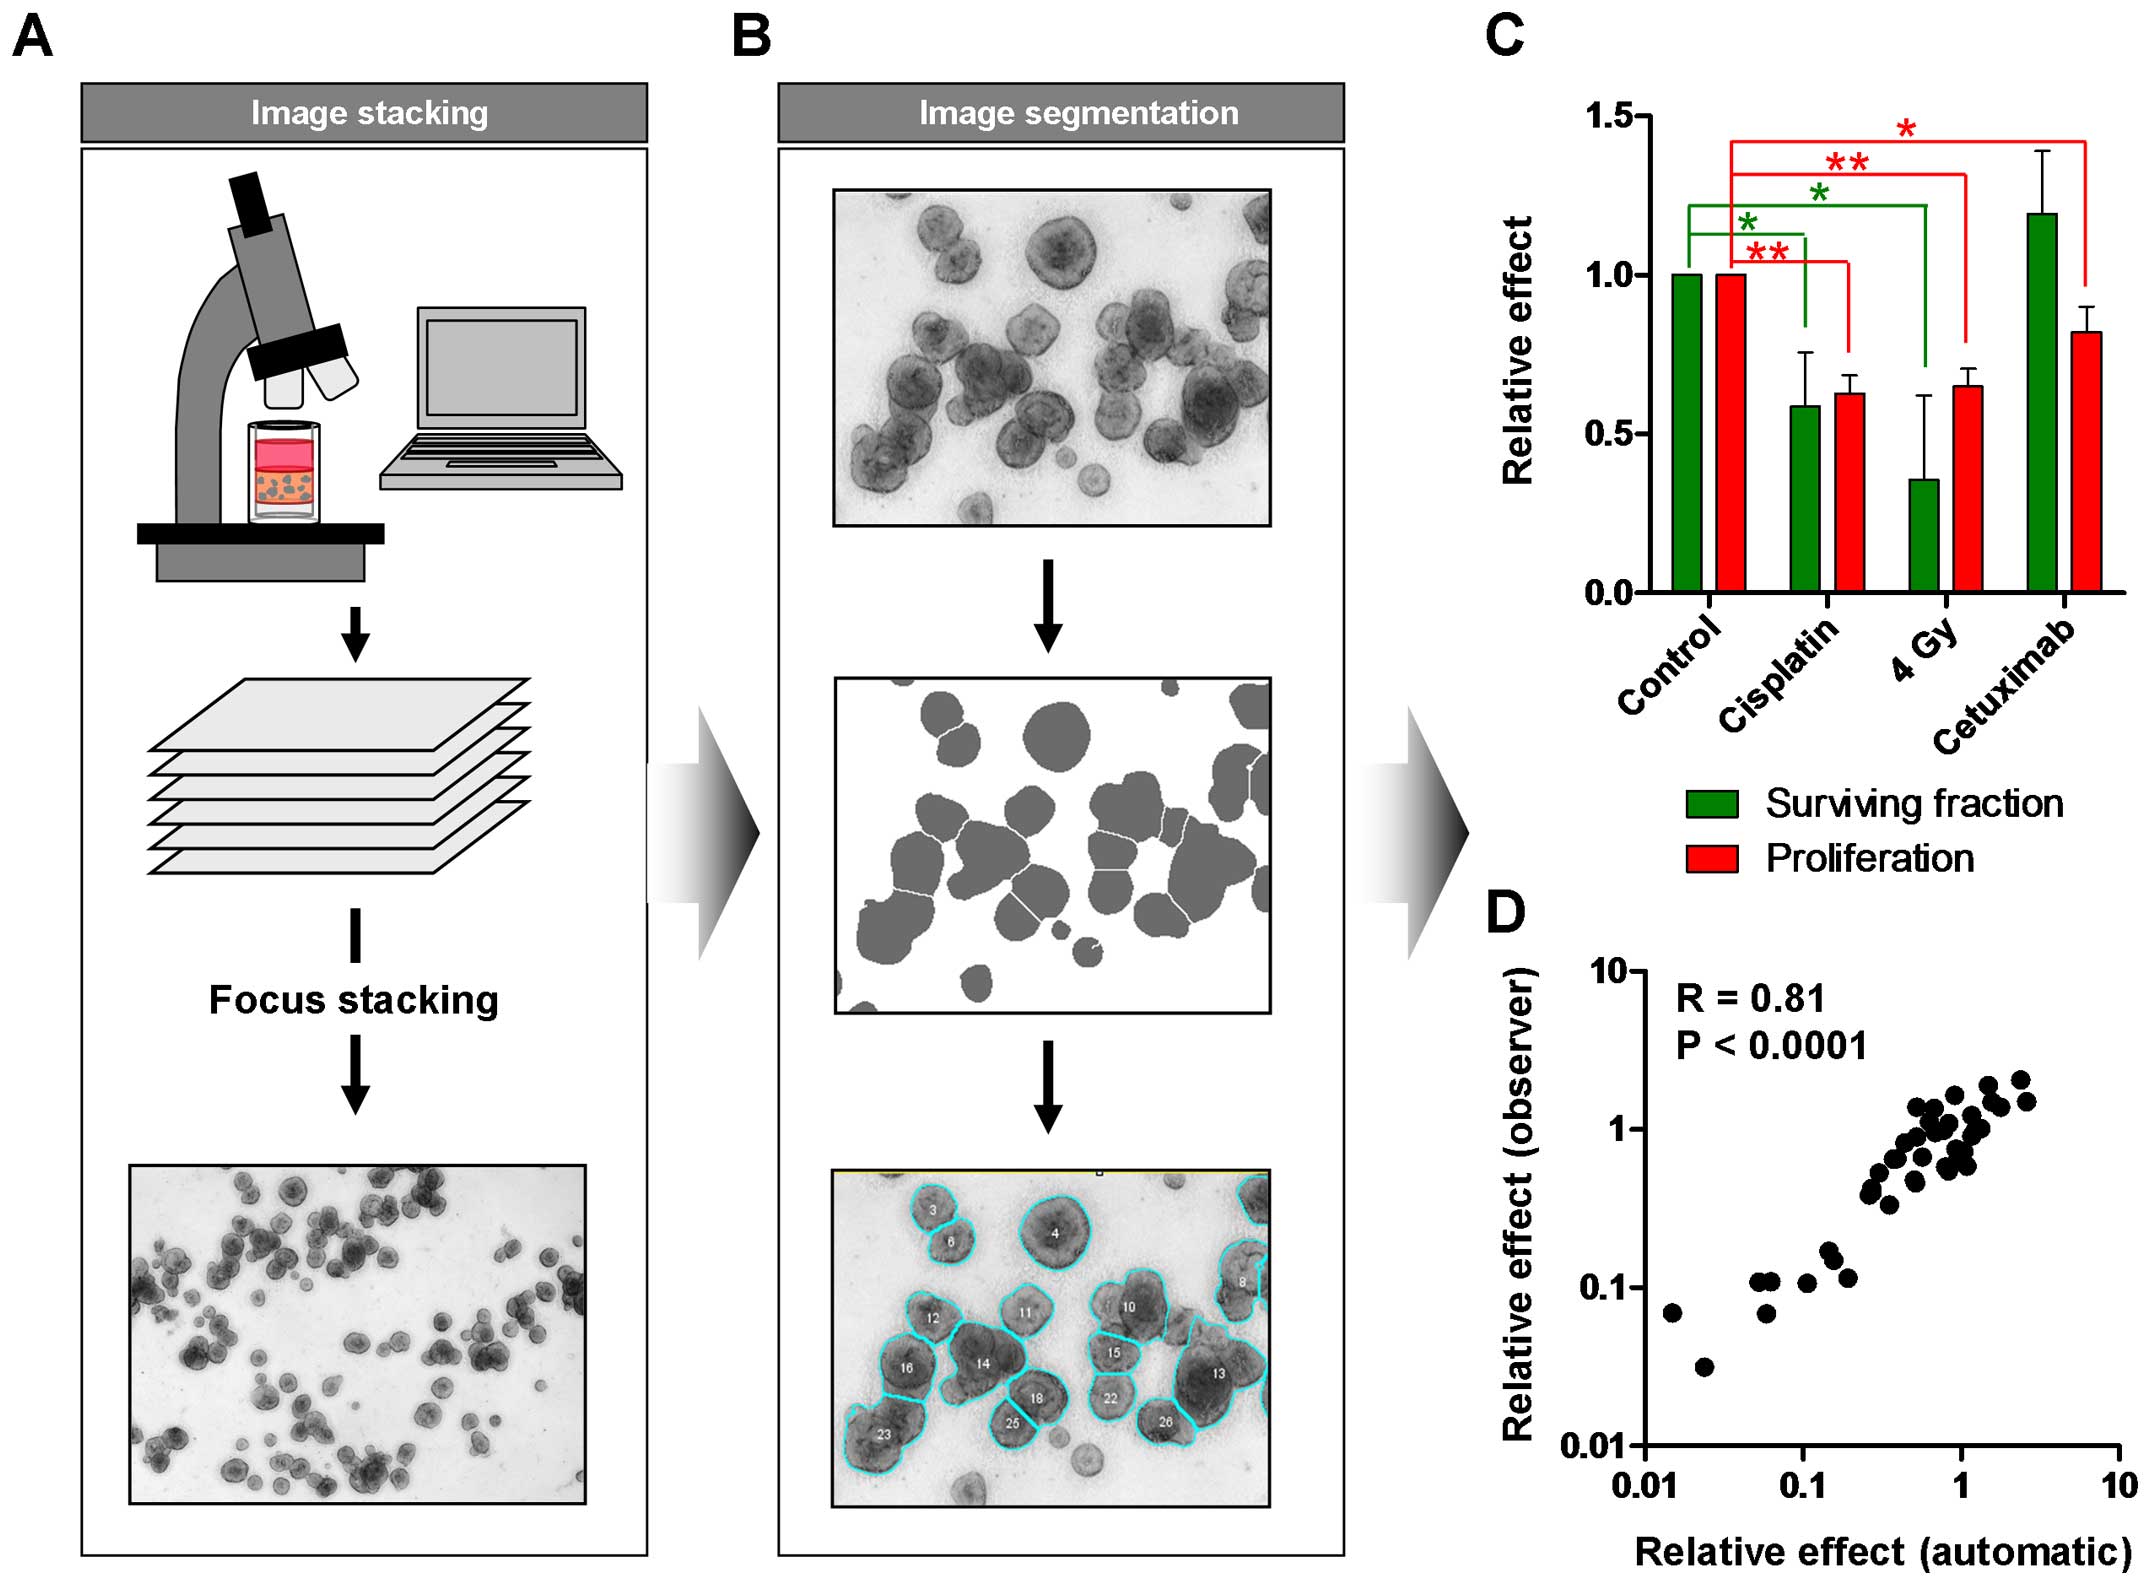
Automated evaluation of colony number and
size
For automated analysis of survival and
proliferation, each well was imaged in at least 7 different
Z-levels using an Axio Observer microscope with a 2.5× objective (
Carl Zeiss). ImageJ/Fiji (33) was
used for image processing and an example ImageJ macro is shown in
Table I. Briefly, focus stacking
was applied to the Z-level images to yield a single clear image of
all 3D colonies. Further processing included background
subtraction, median filtering and thresholding steps. A watershed
algorithm was used to separate overlapping colonies, and automatic
colony counting followed. Tables of object sizes and numbers are
written to disk. Overlays of the microscopic images and the
segmentation are also saved for quality review. The resulting
tables can be further summarized and analyzed using R (34). The example scripts (ImageJ:
Table I; R: Table II) automatically process images
from multiple wells. The R script generates a histogram of colony
size for each well and a summary result table of all wells imaged
containing the number of colonies, the average colony area and the
total colony area as a measurement of proliferation.
 | Table IExample ImageJ macro to be used on a
directory with multiple subdirectories containing images. |
Table I
Example ImageJ macro to be used on a
directory with multiple subdirectories containing images.
| Steps |
|---|
| Step 1 | //ATTENTION: This
macro will close all other open images in ImageJ
Dialog.create(“ATTENTION”);
Dialog.addMessage(“This macro will close all other open images in
ImageJ/Fiji!!
Please press cancel if there is any unsaved data”);
Dialog.show(); |
| Step 2 | //Chose directory
containing the image subdirectories
dir = getDirectory(“Choose a Directory “);
count = 1;
list = getFileList (dir); |
| Step 3 | //Chose minimum
colony size
Dialog.create(“Minimum colony size”);
Dialog.addMessage(“Please specify the minimum colony size (area)
for counting (in pixels, smaller structures will be
ignored)”);
Dialog.addNumber(“Minimum colony size”, 600, 0, 5, “area
pixels”)
Dialog.show();
MinColonySize = Dialog.getNumber(); |
| Step 4 | //Loop through
directories
for (i=0; i<list.length; i++) {
if (endsWith(list[i], “/”)) {
//Get files in directory
files = getFileList(““+dir+list[i]); |
| Step 5 | //load images and
perform focus stacking
run(“Image Sequence...”, “open=“ + dir + list[i] + files[0] + “
sort”);
run(“Extended Depth of Field (Easy mode)...”, “quality=‘0’
topology=‘0’
show-topology=‘off’ show-view=‘off’”); |
| Step 6 | //Wait for output
to open
while(!isOpen(“Output”)) {
wait(50);}
wait(1000); //Just to make sure not too early |
| Step 7 | //Select stacked
output
selectImage(“Output”);
rename(“OStack”);
run(“Duplicate...”, “ “); |
| Step 8 | //Substract
background, filter and do segmentation
run(“8-bit”);
run(“Subtract Background...”, “rolling=50 light”);
run(“Median...”, “radius=3”);
run(“Auto Threshold”, “method=Default white”);
run(“Convert to Mask”);
run(“Watershed”);
rename(“Segmented”); |
| Step 9 | //Count
Colonies
run(“Analyze Particles...”, “size=MinColonySize -Infinity
circularity=0.00–1.00
show=[Overlay Outlines]
display clear”); |
| Step 10 | //Save overlay
image to disk
selectWindow(“OStack”);
run(“Select All”);
run(“Copy”);selectWindow(“Segmented”);
run(“Paste”);
run(“Invert”);
setFont(“SansSerif”, 32);
setColor(120,120,120);
setJustification(“left”);
drawString(“Min. Colony size: “+ MinColonySize, 10, 50);
saveAs(“PNG”, dir + “segmented” + files[0]); |
| Step 11 | //Save results to
disk
selectWindow(“Results”);
saveAs(“Results”, dir+ substring(list[i],0,lengthOf(list[i])-1) +
“.csv”); |
| Step 12 | //Close all
windows
close(“*”);}} |
| Table IIExample R code to be used to analyze
the data. |
Table II
Example R code to be used to analyze
the data.
| Steps |
|---|
| Step 1 | #Set to directory
containing the ImageJ output
setwd(“C:/Users/xx/Images”)
#Adjust this to the directory containing the image subfolders |
| Step 2 |
library(“ggplot2”)
require(plyr) |
| Step 3 | #load
data
#get names of csv files, read and add each filename to the
dataframe
files <- dir(pattern = “*.csv”)
data <- read.csv(files[1],header = TRUE)
data$file <- files[1]
for (i in 2:length(files)){
a <- read.csv(files[i],header = TRUE)
a$file <- files[i]
data <- rbind(a,data)} |
| Step 4 | #create and output
area histograms
p <-ggplot(data, aes(x=Area)) + geom_histogram()
+scale_x_log10() + facet_wrap(~file)
pdf(“histograms.pdf”, , width=8, height=10)
print(p)
dev.off() |
| Step 5 | #summarize data for
each filename (corresponding to each well) and write csv
file
resultdata <- ddply(data, .(file), summarize,
ColonyNumber=length(Area) ,
MeanColonyArea=mean(Area), TotalColonyArea = sum(Area))
write.csv(resultdata, file = “SummaryCounting.txt”) |
Results and Discussion
In the present study, we describe a novel method to
measure automatically clonogenic survival and proliferation of
cells in a 3D matrix consisting of lrECM which has been reported to
mimic physiologic in vivo growth conditions in a better way
than conventional 2D cell culture plastic (4–11,14,16).
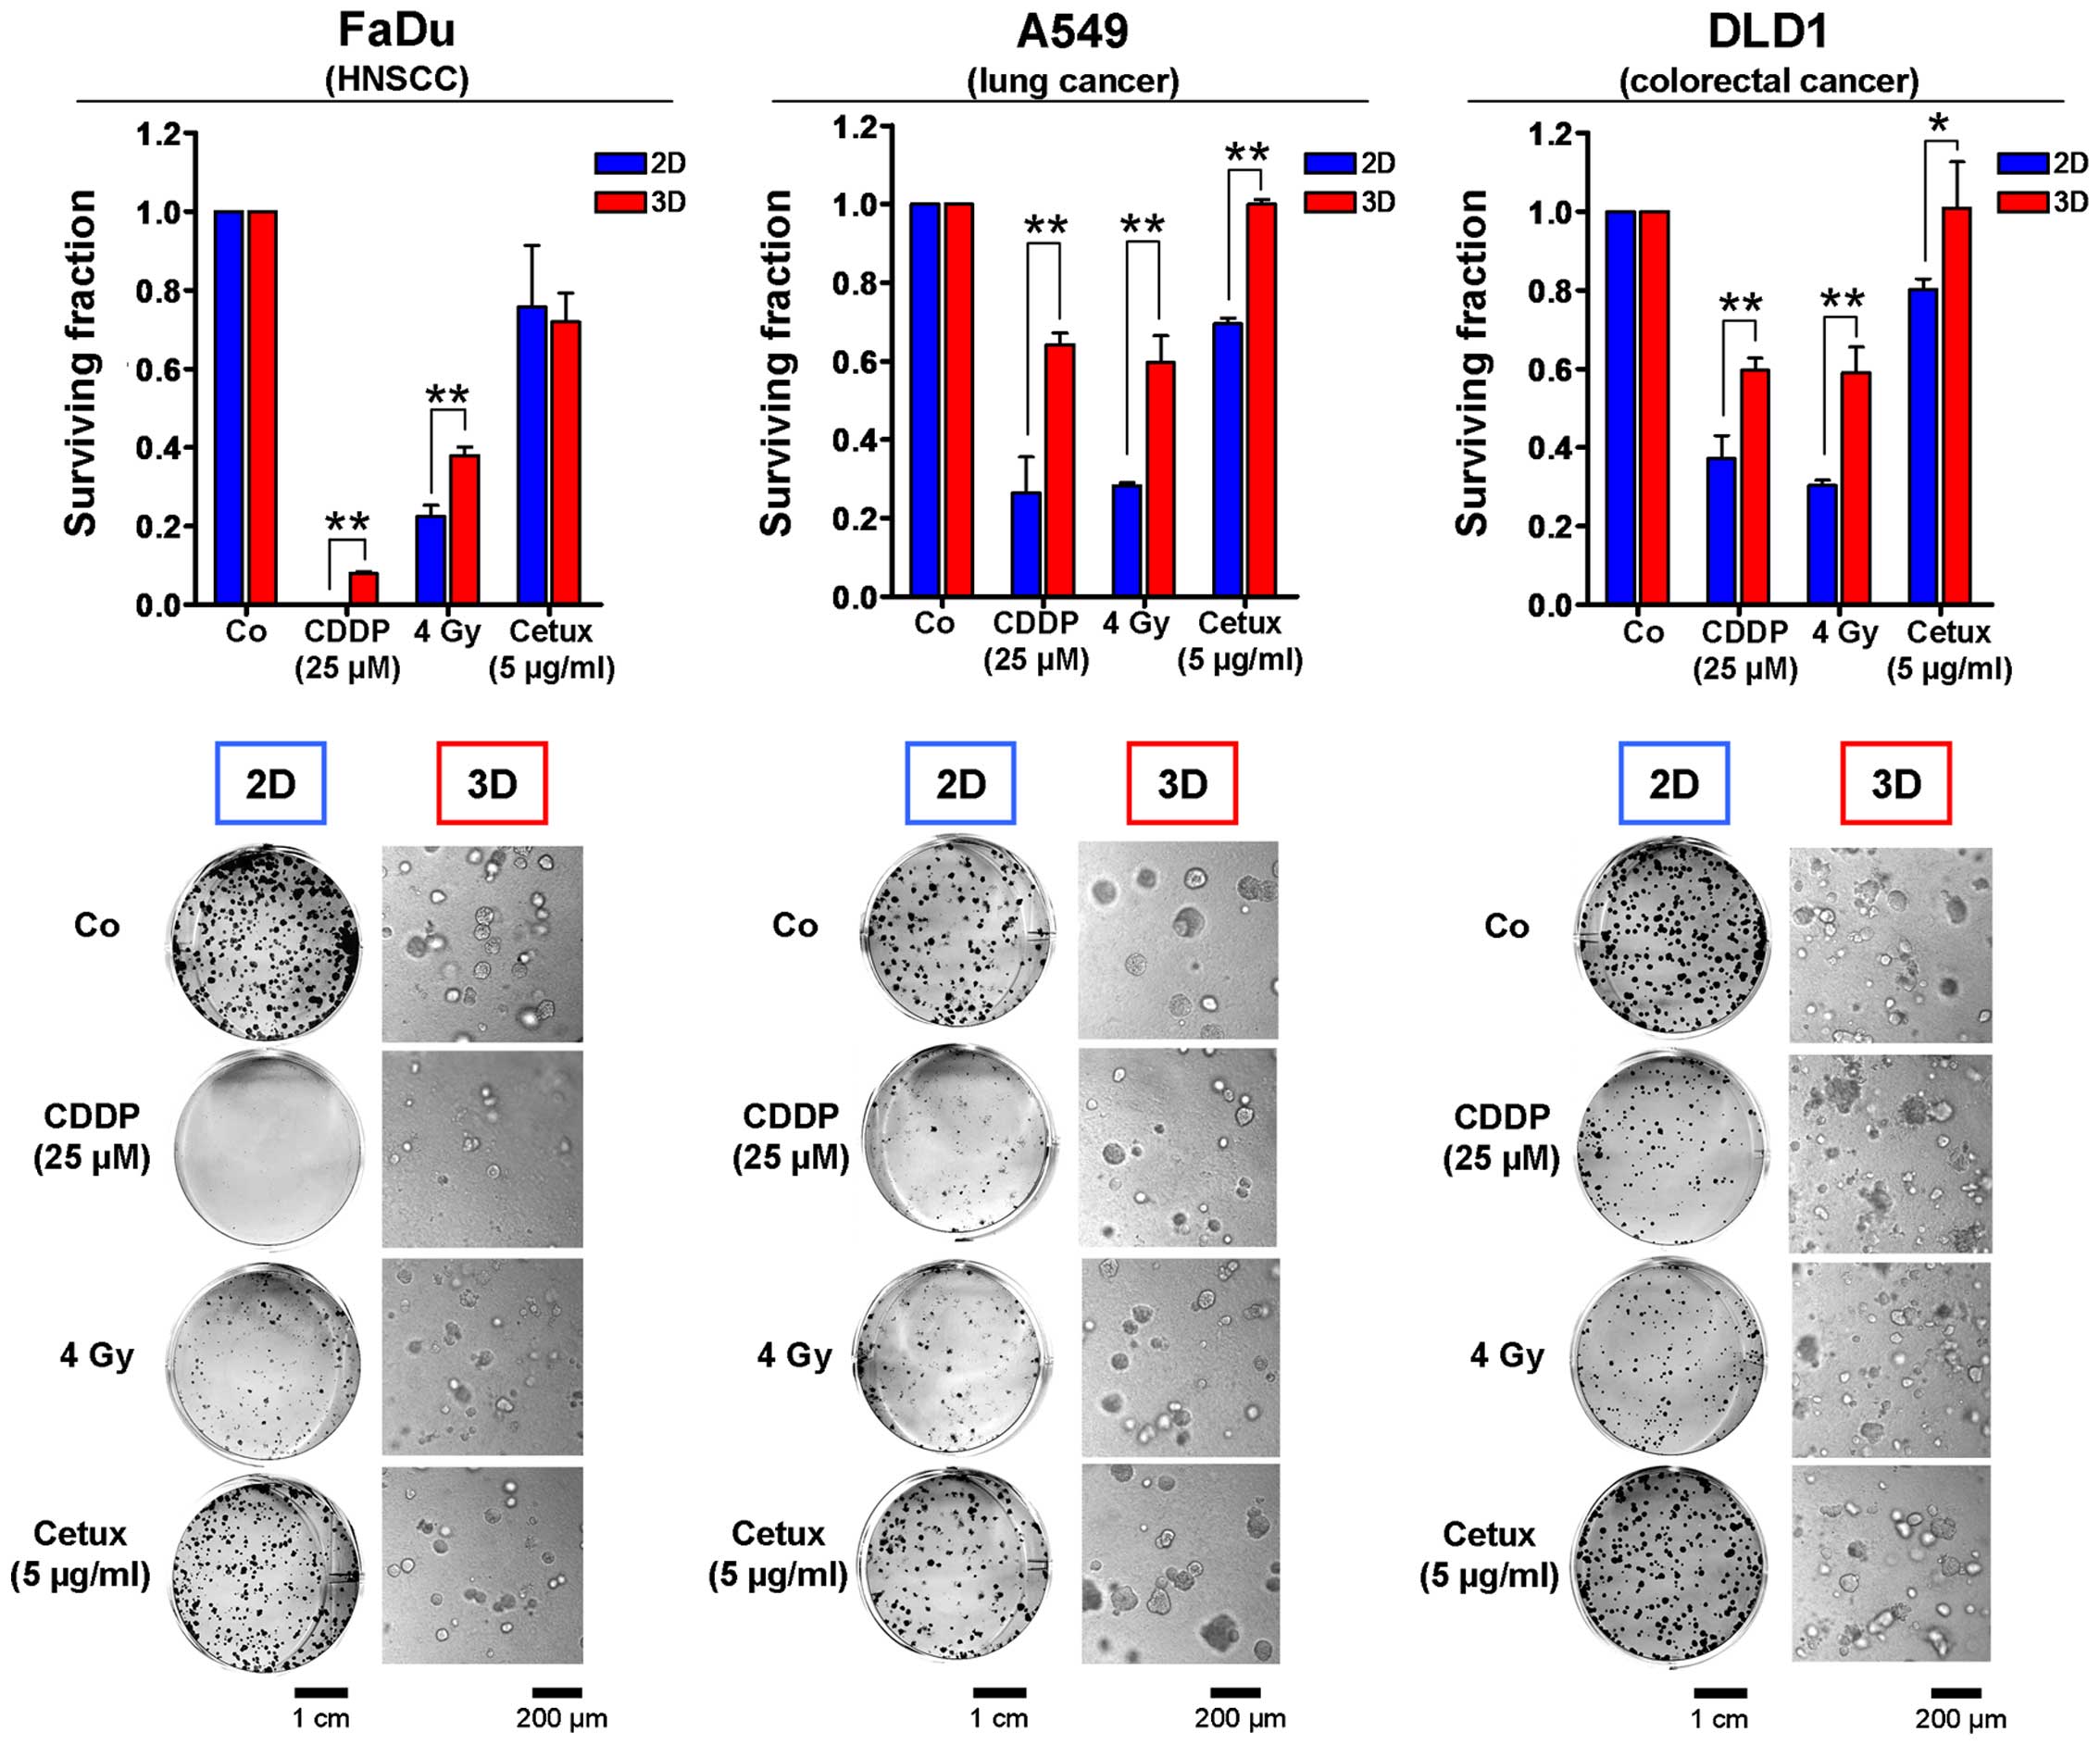
Importantly, this approach can also be used in a high-throughput
setting. According to previous data, we found that the response of
all three tested human carcinoma cell lines exposed to the
chemotherapeutic drug cisplatin (CDDP) or to X-ray irradiation was
affected by the growth conditions with cells being significantly
more resistant when cultured in 3D (Fig. 1) (9,11,20,24,35).
This cell adhesion-mediated radioresistance and therapy resistance
might result from a multitude of cellular processes including
differences in transcriptional, translational, post-translational
processes and signal transduction (8–11,22,36).
Not surprising and particularly alerting with regard to molecular
drug efficacy is that molecular compounds like the EGFR inhibitor
cetuximab are also less effective under 3D growth conditions and
that this cellular drug response correlates more closely with in
vivo results (Fig. 1)
(9–11,37).
These data confirm the necessity to test targeted substances and
more conventional therapeutics in a 3D matrix-based in vitro
assay prior to animal studies to minimize costs, time and
effort.
The workflow of plating and treatment of cells for
the 3D clonogenic assay is depicted in Figs. 2 and 3. Agarose, cell/lrECM mixture and medium
can be applied with a multi-channel pipette allowing time-efficient
plating for large-scale analysis. Another advantage over most of
the existing matrix-based 3D methods is that the lrECM solution
with the concentration of 0.5 mg/ml can be produced with pre-heated
medium (37°C) and processed at room temperature for at least 30 min
without becoming solid. Therefore, cells do not have to be cooled
down which likely provoke a cold stress response and perturb
molecular processes (38). To
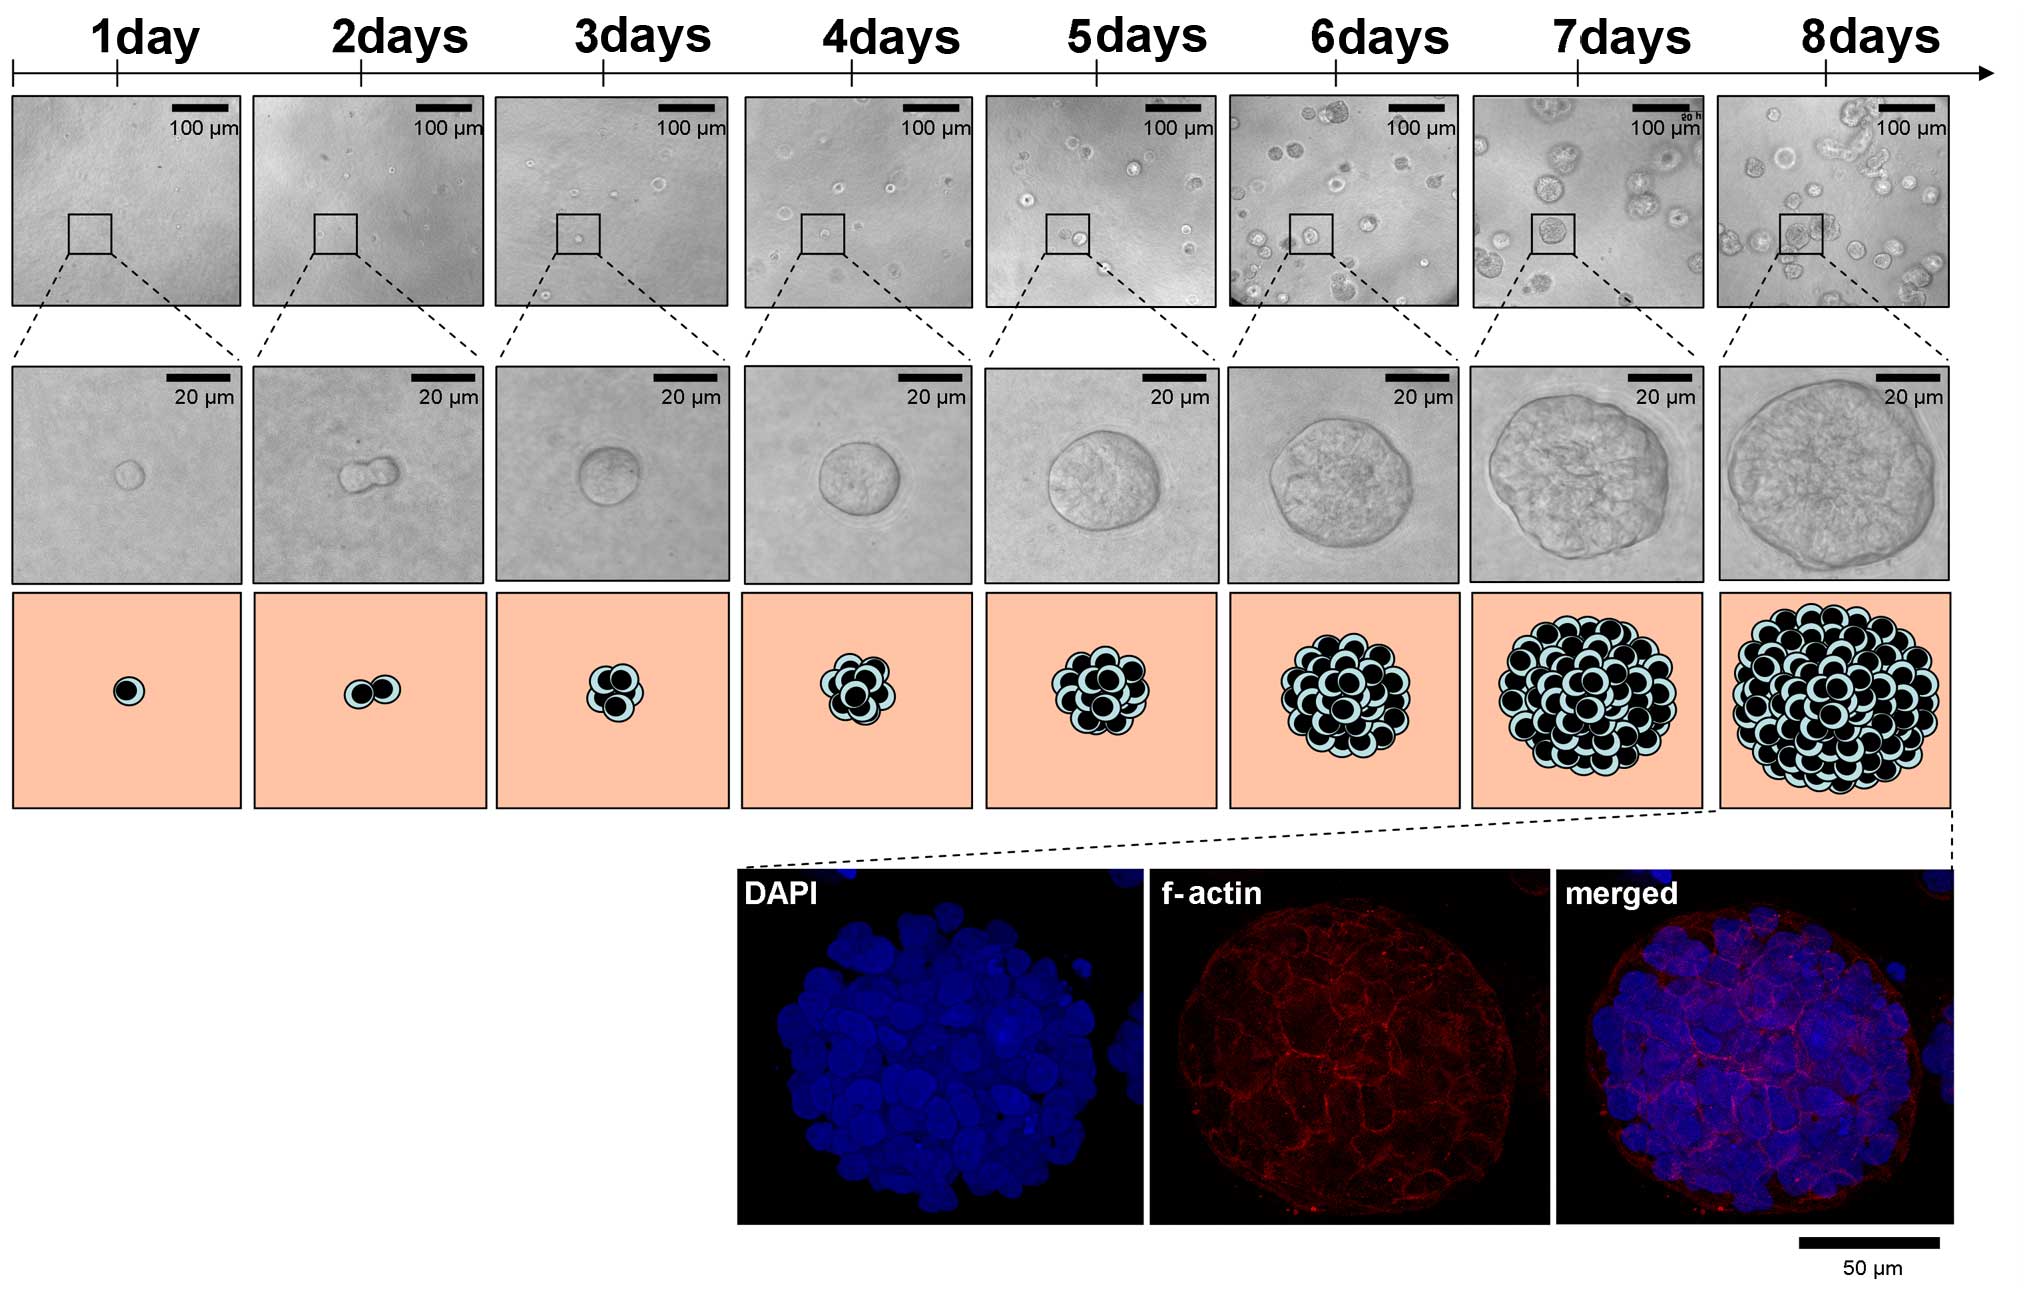
assess the cell number per colony and proliferation of cells
embedded into lrECM, we evaluated the number of grown A549 cells
over a period of 8 days microscopically (Fig. 4). Phase contrast microscopy and
DAPI/f-Actin staining revealed similar proliferation rates of this
cell line in a 3D matrix in comparison to 2D monolayer cell
cultures (~22 h according to ATCC) with doubling times of about 24
h after a lag phase of 1 day. Importantly, at the time of treatment
(1 day after plating), 3D cell cultures are still in the single
cell status, a key requirement to measure clonogenic survival
(Fig. 4) (30–32).
Manually counting of colonies is a time-consuming
and error-prone process. Therefore, automated evaluation can reduce
the working time and improve the inter-observer reliability and
validity of data. As the colonies are in a 3D matrix, we took
images of the wells in different Z-levels and performed focus
stacking to create a clear image of all colonies (Fig. 5A). After image segmentation, colony
number and size were determined (Fig.
5B) enabling the evaluation of the specific treatment effects
on tumor cell proliferation as well as on clonogenic survival
(Fig. 5C). While irradiation or
cisplatin treatment reduced both, the size of the colonies and the
colony number, cetuximab mainly affected the tumor growth and had
no significant impact on cell survival (Fig. 5C). A comparison with manually
counted results showed an excellent correlation (R=0.81) indicating
a high reliability of the obtained data (Fig. 5D).
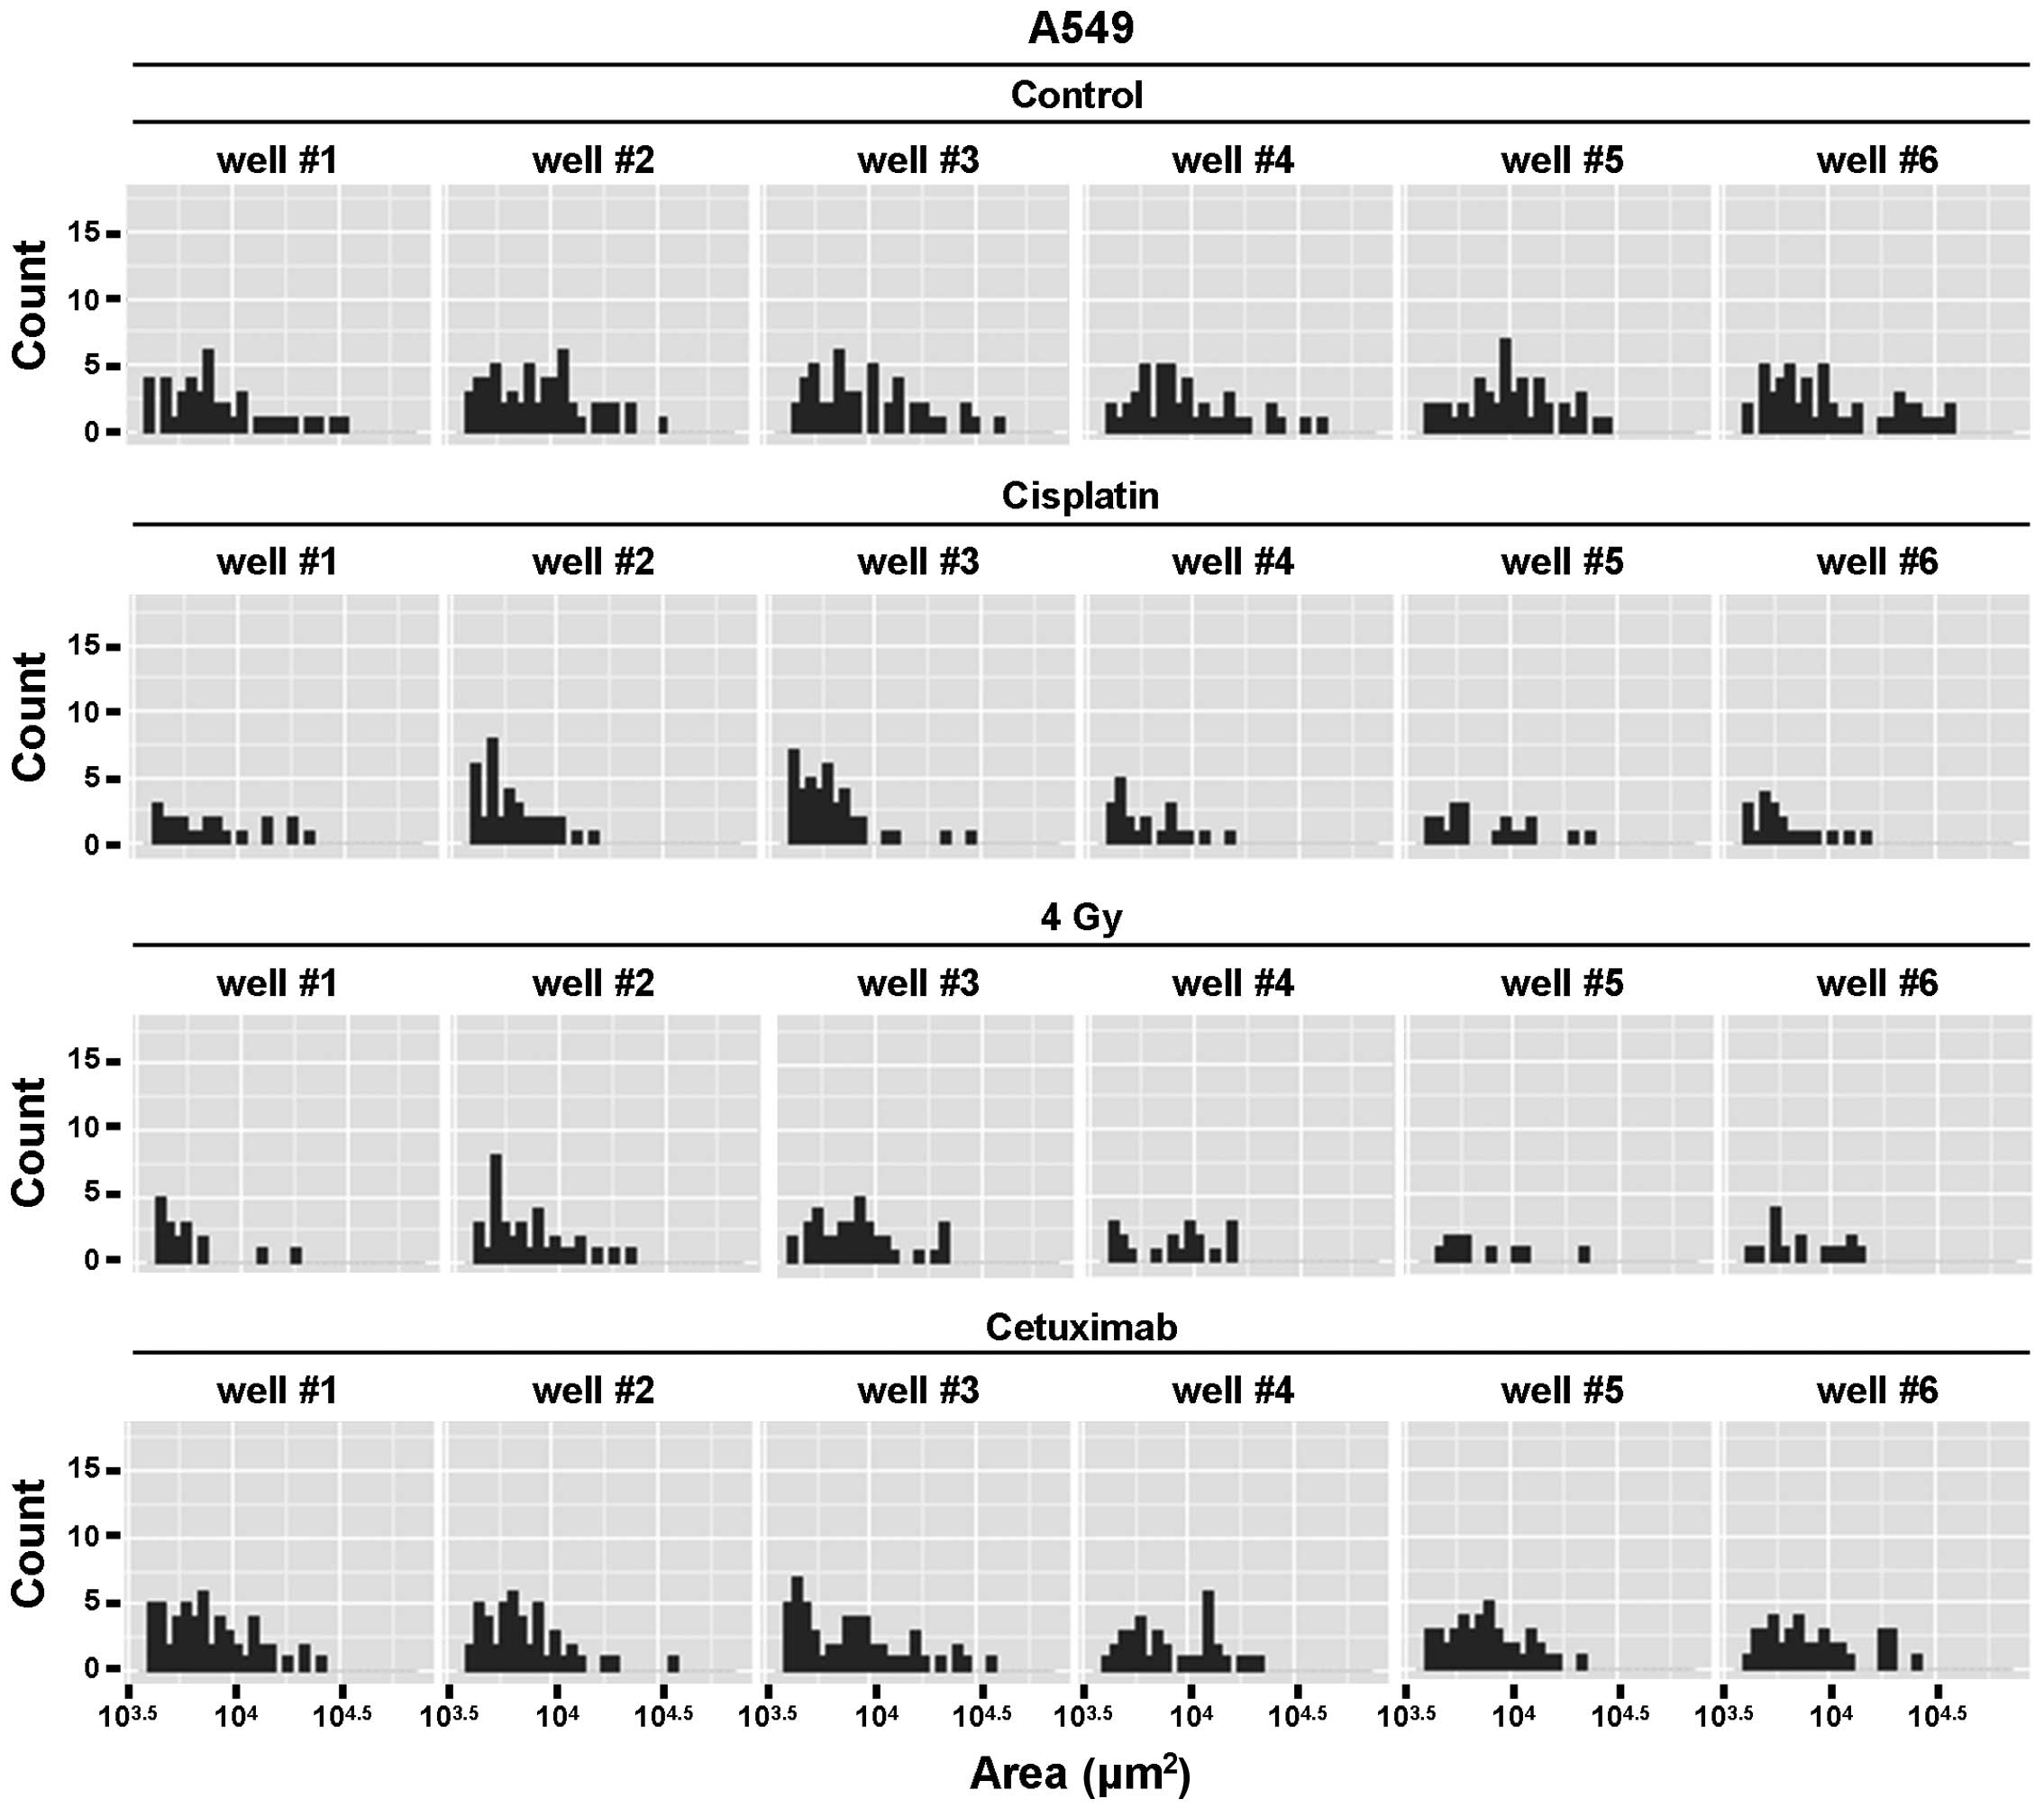
Considering the heterogeneity in human tumors and
the role of cancer stem cells for therapy resistance (39), analysis on a single cell base can
be crucial to evaluate the potential of targeted therapeutics. With
the described technique the size and distribution of every single
colony (which grows out of one single cell) could easily be
determined and plotted in a histogram (Fig. 6). As shown in Fig. 6, control cell cultures had a wide
spectrum of colony sizes with several small and medium-sized but
also few larger colonies. In contrast, after exposure to cisplatin,
ionizing radiation or cetuximab the distribution shifted to the
left resulting in an overall decrease of colony size. These data
could give valuable information about the different treatment
effects in a tumor cell population.
In summary, the described protocol is a cost and
time-efficient method to analyze the tumor response to cancer
therapy in a more physiologic cell culture model. Taking into
account that 3D lrECM based assays have been shown to reflect the
in vivo conditions more reliably than 2D monolayer cells, it
would be beneficial to employ this technique in a large-scale
evaluation of molecular compounds prior to in vivo
studies.
Acknowledgements
The authors were in part supported by a grant from
the Bundesministerium für Bildung und Forschung (BMBF Contracts
03ZIK041 and BMBF-02NUK006B to N.C.), the Deutsche
Forschungsgemeinschaft (CO668/4-1 to N.C.), the Deutsche Krebshilfe
(108976 to N.C.), the EFRE Europäische Fonds für regionale
Entwicklung, Europa fördert Sachsen (100066308) and by the NIH
Intramural Research Program, National Cancer Institute, Center for
Cancer Research (to I.E.).
References
|
1
|
Sawyers C: Targeted cancer therapy.
Nature. 432:294–297. 2004. View Article : Google Scholar : PubMed/NCBI
|
|
2
|
Zhou L, Xu N, Sun Y and Liu XM: Targeted
biopharmaceuticals for cancer treatment. Cancer Lett. 352:145–151.
2014. View Article : Google Scholar : PubMed/NCBI
|
|
3
|
Savage DG and Antman KH: Imatinib
mesylate--a new oral targeted therapy. N Engl J Med. 346:683–693.
2002. View Article : Google Scholar : PubMed/NCBI
|
|
4
|
Bissell MJ, Weaver VM, Lelièvre SA, Wang
F, Petersen OW and Schmeichel KL: Tissue structure, nuclear
organization, and gene expression in normal and malignant breast.
Cancer Res. 59:1757–1763s; discussion 1763s–1764s. 1999.PubMed/NCBI
|
|
5
|
Weaver VM, Fischer AH, Peterson OW and
Bissell MJ: The importance of the microenvironment in breast cancer
progression: Recapitulation of mammary tumorigenesis using a unique
human mammary epithelial cell model and a three-dimensional culture
assay. Biochem Cell Biol. 74:833–851. 1996. View Article : Google Scholar : PubMed/NCBI
|
|
6
|
Yang J, Richards J, Bowman P, Guzman R,
Enami J, McCormick K, Hamamoto S, Pitelka D and Nandi S: Sustained
growth and three-dimensional organization of primary mammary tumor
epithelial cells embedded in collagen gels. Proc Natl Acad Sci USA.
76:3401–3405. 1979. View Article : Google Scholar : PubMed/NCBI
|
|
7
|
Lo AT, Mori H, Mott J and Bissell MJ:
Constructing three-dimensional models to study mammary gland
branching morphogenesis and functional differentiation. J Mammary
Gland Biol Neoplasia. 17:103–110. 2012. View Article : Google Scholar : PubMed/NCBI
|
|
8
|
Cichon MA, Gainullin VG, Zhang Y and
Radisky DC: Growth of lung cancer cells in three-dimensional
microenvironments reveals key features of tumor malignancy. Integr
Biol Camb. 4:440–448. 2012. View Article : Google Scholar
|
|
9
|
Eke I, Schneider L, Förster C, Zips D,
Kunz-Schughart LA and Cordes N: EGFR/JIP-4/JNK2 signaling
attenuates cetuximab-mediated radiosensitization of squamous cell
carcinoma cells. Cancer Res. 73:297–306. 2013. View Article : Google Scholar
|
|
10
|
Eke I, Storch K, Krause M and Cordes N:
Cetuximab attenuates its cytotoxic and radiosensitizing potential
by inducing fibro-nectin biosynthesis. Cancer Res. 73:5869–5879.
2013. View Article : Google Scholar : PubMed/NCBI
|
|
11
|
Storch K, Eke I, Borgmann K, Krause M,
Richter C, Becker K, Schröck E and Cordes N: Three-dimensional cell
growth confers radioresistance by chromatin density modification.
Cancer Res. 70:3925–3934. 2010. View Article : Google Scholar : PubMed/NCBI
|
|
12
|
Martin KJ, Patrick DR, Bissell MJ and
Fournier MV: Prognostic breast cancer signature identified from 3D
culture model accurately predicts clinical outcome across
independent datasets. PLoS One. 3:e29942008. View Article : Google Scholar : PubMed/NCBI
|
|
13
|
Yamada KM and Cukierman E: Modeling tissue
morphogenesis and cancer in 3D. Cell. 130:601–610. 2007. View Article : Google Scholar : PubMed/NCBI
|
|
14
|
Pampaloni F, Reynaud EG and Stelzer EHK:
The third dimension bridges the gap between cell culture and live
tissue. Nat Rev Mol Cell Biol. 8:839–845. 2007. View Article : Google Scholar : PubMed/NCBI
|
|
15
|
Fernandez-Fuente G, Mollinedo P, Grande L,
Vazquez-Barquero A and Fernandez-Luna JL: Culture dimensionality
influences the resistance of glioblastoma stem-like cells to
multi-kinase inhibitors. Mol Cancer Ther. 13:1664–1672. 2014.
View Article : Google Scholar : PubMed/NCBI
|
|
16
|
Marushima H, Shibata S, Asakura T,
Matsuura T, Maehashi H, Ishii Y, Eda H, Aoki K, Iida Y, Morikawa T,
et al: Three-dimensional culture promotes reconstitution of the
tumor-specific hypoxic microenvironment under TGFβ stimulation. Int
J Oncol. 39:1327–1336. 2011.PubMed/NCBI
|
|
17
|
Park CC, Zhang HJ, Yao ES, Park CJ and
Bissell MJ: Beta1 integrin inhibition dramatically enhances
radiotherapy efficacy in human breast cancer xenografts. Cancer
Res. 68:4398–4405. 2008. View Article : Google Scholar : PubMed/NCBI
|
|
18
|
Damiano JS, Cress AE, Hazlehurst LA, Shtil
AA and Dalton WS: Cell adhesion mediated drug resistance (CAM-DR):
Role of integrins and resistance to apoptosis in human myeloma cell
lines. Blood. 93:1658–1667. 1999.PubMed/NCBI
|
|
19
|
Eke I, Deuse Y, Hehlgans S, Gurtner K,
Krause M, Baumann M, Shevchenko A, Sandfort V and Cordes N: β1
Integrin/FAK/cortactin signaling is essential for human head and
neck cancer resistance to radiotherapy. J Clin Invest.
122:1529–1540. 2012. View
Article : Google Scholar : PubMed/NCBI
|
|
20
|
Ahmed KM, Zhang H and Park CC: NF-κB
regulates radioresistance mediated by β1-integrin in
three-dimensional culture of breast cancer cells. Cancer Res.
73:3737–3748. 2013. View Article : Google Scholar : PubMed/NCBI
|
|
21
|
Eke I, Zscheppang K, Dickreuter E,
Hickmann L, Mazzeo E, Unger K, Krause M and Cordes N: Simultaneous
β1 integrin-EGFR targeting and radiosensitization of human head and
neck cancer. J Natl Cancer Inst. 107:dju4192015. View Article : Google Scholar
|
|
22
|
Fournier MV and Martin KJ: Transcriptome
profiling in clinical breast cancer: From 3D culture models to
prognostic signatures. J Cell Physiol. 209:625–630. 2006.
View Article : Google Scholar : PubMed/NCBI
|
|
23
|
Lee GY, Kenny PA, Lee EH and Bissell MJ:
Three-dimensional culture models of normal and malignant breast
epithelial cells. Nat Methods. 4:359–365. 2007. View Article : Google Scholar : PubMed/NCBI
|
|
24
|
Eke I, Storch K, Kästner I, Vehlow A,
Faethe C, Mueller-Klieser W, Taucher-Scholz G, Temme A, Schackert G
and Cordes N: Three-dimensional invasion of human glioblastoma
cells remains unchanged by X-ray and carbon ion irradiation in
vitro. Int J Radiat Oncol Biol Phys. 84:e515–e523. 2012. View Article : Google Scholar : PubMed/NCBI
|
|
25
|
Liu TJ, LaFortune T, Honda T, Ohmori O,
Hatakeyama S, Meyer T, Jackson D, de Groot J and Yung WK:
Inhibition of both focal adhesion kinase and insulin-like growth
factor-I receptor kinase suppresses glioma proliferation in vitro
and in vivo. Mol Cancer Ther. 6:1357–1367. 2007. View Article : Google Scholar : PubMed/NCBI
|
|
26
|
Tancioni I, Uryu S, Sulzmaier FJ, Shah NR,
Lawson C, Miller NL, Jean C, Chen XL, Ward KK and Schlaepfer DD:
FAK inhibition disrupts a β5 integrin signaling axis controlling
anchorage-independent ovarian carcinoma growth. Mol Cancer Ther.
13:2050–2061. 2014. View Article : Google Scholar : PubMed/NCBI
|
|
27
|
Kawakami K, Fujita Y, Kato T, Mizutani K,
Kameyama K, Tsumoto H, Miura Y, Deguchi T and Ito M: Integrin β4
and vinculin contained in exosomes are potential markers for
progression of prostate cancer associated with taxane-resistance.
Int J Oncol. 47:384–390. 2015.PubMed/NCBI
|
|
28
|
Matsuda Y, Kawamoto Y, Teduka K, Peng WX,
Yamamoto T, Ishiwata T and Naito Z: Morphological and cytoskeletal
alterations of nervous system tumor cells with different culturing
methods. Int J Oncol. 38:1253–1258. 2011.PubMed/NCBI
|
|
29
|
Nelson CM, Inman JL and Bissell MJ:
Three-dimensional lithographically defined organotypic tissue
arrays for quantitative analysis of morphogenesis and neoplastic
progression. Nat Protoc. 3:674–678. 2008. View Article : Google Scholar : PubMed/NCBI
|
|
30
|
Roper PR and Drewinko B: Comparison of in
vitro methods to determine drug-induced cell lethality. Cancer Res.
36:2182–2188. 1976.PubMed/NCBI
|
|
31
|
Salmon SE, Hamburger AW, Soehnlen B, Durie
BG, Alberts DS and Moon TE: Quantitation of differential
sensitivity of human-tumor stem cells to anticancer drugs. N Engl J
Med. 298:1321–1327. 1978. View Article : Google Scholar : PubMed/NCBI
|
|
32
|
Puck TT, Morkovin D, Marcus PI and
Cieciura SJ: Action of x-rays on mammalian cells. II. Survival
curves of cells from normal human tissues. J Exp Med. 106:485–500.
1957. View Article : Google Scholar : PubMed/NCBI
|
|
33
|
Schindelin J, Arganda-Carreras I, Frise E,
Kaynig V, Longair M, Pietzsch T, Preibisch S, Rueden C, Saalfeld S,
Schmid B, et al: Fiji: An open-source platform for biological-image
analysis. Nat Methods. 9:676–682. 2012. View Article : Google Scholar : PubMed/NCBI
|
|
34
|
Team RC: R: a language and environment for
statistical computing. R Foundation for Statistical Computing;
Vienna, Austria: 2012, Open access available http://cran.r-project.org,
2014.
|
|
35
|
Eke I, Leonhardt F, Storch K, Hehlgans S
and Cordes N: The small molecule inhibitor QLT0267 Radiosensitizes
squamous cell carcinoma cells of the head and neck. PLoS One.
4:e64342009. View Article : Google Scholar : PubMed/NCBI
|
|
36
|
Luca AC, Mersch S, Deenen R, Schmidt S,
Messner I, Schäfer KL, Baldus SE, Huckenbeck W, Piekorz RP, Knoefel
WT, et al: Impact of the 3D microenvironment on phenotype, gene
expression, and EGFR inhibition of colorectal cancer cell lines.
PLoS One. 8:e596892013. View Article : Google Scholar : PubMed/NCBI
|
|
37
|
Smyth T, Paraiso KHT, Hearn K,
Rodriguez-Lopez AM, Munck JM, Haarberg HE, Sondak VK, Thompson NT,
Azab M, Lyons JF, et al: Inhibition of HSP90 by AT13387 delays the
emergence of resistance to BRAF inhibitors and overcomes resistance
to dual BRAF and MEK inhibition in melanoma models. Mol Cancer
Ther. 13:2793–2804. 2014. View Article : Google Scholar : PubMed/NCBI
|
|
38
|
Roobol A, Carden MJ, Newsam RJ and Smales
CM: Biochemical insights into the mechanisms central to the
response of mammalian cells to cold stress and subsequent
rewarming. FEBS J. 276:286–302. 2009. View Article : Google Scholar
|
|
39
|
Pattabiraman DR and Weinberg RA: Tackling
the cancer stem cells - what challenges do they pose? Nat Rev Drug
Discov. 13:497–512. 2014. View
Article : Google Scholar : PubMed/NCBI
|