Introduction
Clear cell renal carcinoma (ccRCC) is the most
frequent RCC subtype and is characterized by high mortality of 40
within 5 years, due to late diagnosis and distant metastases found
in 30 (1) to 80 (2) of RCC patients at a time of
examination or within the course of the disease. Among patients who
undergo radical resection for clinically localized disease, future
meta-static disease will develop in 20–40 of the ccRCC cases
(3). The search for new molecular
targets is continuing due to high mortality rate of advanced RCC
(4).
The 3p chromosomal region contains tumor suppressor
genes (TSG) whose downregulation is involved in cancer progression:
VHL (5), FHIT
(6) and RASSF1 (7). RASSF1 [Ras association
(RalGDS/AF-6) domain family member 1] gene encodes RASSF1A and
RASSF1C proteins which function as intracellular signal transducers
(8). RASSF1A mRNA levels
were decreased in at least 37 types of tumors (8) with promoter hypermethylation as the
common mechanism of its underexpession (9).
Since no quantitative analysis of RASSF1A
gene expression has yet been performed in ccRCC we decided to
assess RASSF1A mRNA and protein levels in tumor, normal
kidney tissue and metastases. We also analyzed the methylation
status of RASSF1A promoter by a novel quantitative
technique. Moreover, we checked mRNA and protein levels of
RASSF1C gene in matched tumor-normal kidney and metastasized
samples of ccRCC patients.
Materials and methods
Patients and samples
Tissue samples were collected from 86 ccRCC patients
who underwent radical nephrectomy at the Department of Urology,
Medical University of Gdansk, Poland, between January 2011 and
September 2013. The clinical data of patients is presented in
Table I. The study was approved by
the local ethics committee; written consent was obtained before the
surgery from each patient.
 | Table IDetails of qPCR assays. |
Table I
Details of qPCR assays.
| Assay | Primer
sequences | Amplicon size/CpGs
product (bp) | qPCR efficiency
(%) | qPCR reaction
conditions | qPCR reaction
content |
|---|
| RASSF1A
promoter methylation |
5′-TTTTTTTAGGATTTAGATTGGG-3′
5′-CCTACACCCAAATTTCCATTAC-3′ | 71/4 | 101 | 95°C, 5 min; 42×
(95°C, 5 sec; 55°C, 10 sec; 72°C, 10 sec; 75°C, 10 sec, sample
reading) Melting curve: 95°C, 15 sec; 60°C, 1 min; 60°C → 95°C
reading every 0.1°C | 5 μl SensiFast HRM
(BioLine, London, UK), 300 nM each primer, ∑ 10 μl |
| RASSF1A mRNA
level measurment |
5′-CTCGTCTGCCTGGACTGTTGC-3′
5′-TCAGGTGTCTCCCACTCCACAG-3′ | 101 | 98.5 | 95°C, 3 min; 37×
(95°C, 5 sec; 58°C, 10 sec; 72°C, 10 sec; 75°C, 10 sec, sample
reading) Melting curve: 95°C, 15 sec; 60°C, 1 min; 60°C → 95°C
reading every 0.3°C | 5 μl SensiFast
NoRox SYBR-Green (BioLine), 200 nM each primer, ∑ 10 μl |
| RASSF1C mRNA
level measurment |
5′-TACTGCAGCCAAGAGGACTCGG-3′
5′-TCAGGTGTCTCCCACTCCACAG-3′ | 116 | 92.3 | 95°C, 3 min; 37×
(95°C, 5 sec; 58°C, 10 sec; 72°C, 10 sec; 75°C, 10 sec, sample
reading) Melting curve: 95°C, 15 sec; 60°C, 1 min; 60°C → 95°C
reading every 0.3°C | 5 μl SensiFast
NoRox SYBR-Green (BioLine), 200 nM each primer, ∑ 10 μl |
| GUSB mRNA
level measurment for qPCR normalization |
5′-ATGCAGGTGATGGAAGAAGTGGTG-3′
5′-AGAGTTGCTCACAAAGGTCACAGG-3′ | 177 | 99.6 | 95°C, 3 min; 35×
(95°C, 5 sec; 57°C, 10 sec; 72°C, 10 sec; 75°C, 10 sec, sample
reading) Melting curve: 95°C, 15 sec; 60°C, 1 min; 60°C → 95°C
reading every 0.3°C Melting curve: 95°C, 15 sec; 60°C, 1 min; 60°C
→ 95°C reading every 0.3°C | 5 μl SensiFast
NoRox SYBR-Green (BioLine), 200 nM each primer, ∑ 10 μl |
Sample acquisition
Samples were obtained according to our previous
report (10) with some
modifications. Briefly, dissected tissue samples of primary ccRCC
tumor (n=86, named T), normal kidney (n=86, named C as controls)
and adrenal gland or the whole lymph node (n=12, named M), were
collected in the operating room and placed immediately in
approximately five volumes of RNAlater (Ambion Inc., Austin, TX,
USA).
RNA isolation and cDNA synthesis
We utilized the same methodology as previously
described (10) with some
modifications. In short, ExtractMe Total RNA kit (DNAGdansk,
Gdansk, Poland) was used for RNA extraction, followed by
spectro-photometric (NanoDrop ND-1000; Thermo Fisher Scientific,
Fitchburg, WI, USA) and electrophoretic (Bioanalyzer 2100
apparatus; Agilent Technologies, Santa Clara, CA, USA) analysis of
RNA. After DNA removal (Turbo DNA-free kit; Ambion, Austin, TX,
USA), 2 μg total RNA was reversibly transcribed with the use of
RevertAid reverse transcriptase (Fermentas-Thermo Fischer
Scientific) and 0.5 μg dT18 primers (Sigma-Aldrich,
Munich, Germany) in a total volume of 20 μl.
Assessment of RASSF1A and RASSF1C mRNA
expression
Quantitative real-time PCR (qPCR) technique was
applied to measure mRNA level of RASSF1A and RASSF1C
genes in all samples after normalization to the GUSB
reference gene level in each sample (10). List of primers and details
regarding time-temperature protocol are described in Table II. All reactions were run in
duplicate using 1 μl of 4X diluted cDNA and SensiFast Sybr™ No-ROX
kit (BioLine, London, UK) chemistry in a total volume of 10 μl.
Each gene assay was run on a separate plate (StepOnePlus apparatus;
Life Technologies-Applied Biosystems, Grand Island, NY, USA) with
non-template control (water instead of cDNA) and 10X diluted pooled
cDNA as a run-to-run precision control. Data was acquired by
StepOne Software ver. 2.2 and geometric mean of Ct (threshold
cycle) values were used for comparable expression analysis. The
Livak's method was utilized for quantification: Ratio =
2−ΔΔCt to obtain raw expression data for each sample,
followed by calibration to average expression data of control
samples (fold change; control sample = 1).
| Table IIClinicopathological features of ccRCC
patients and association between RASSF1A and RASSF1C
mRNA levels and clinical data. |
Table II
Clinicopathological features of ccRCC
patients and association between RASSF1A and RASSF1C
mRNA levels and clinical data.
| | RASSF1A qPCR
results (%) | RASSF1C qPCR
results (%) |
|---|
| |
|
|
|---|
| Patients
(n=86) | Subgroups | Low (≤0.266) | High
(>0.266) | P-value (low vs.
high)a | Low (≤0.191) | High
(>0.191) | P-value (low vs.
high)a |
|---|
| Age (years) | ≤62 | 31 (36) | 14 (16) | 0.65 | 14 (16) | 31 (36) | 1.00 |
| 62.16±11.24 | >62 | 26 (30) | 15 (18) | | 12 (14) | 29 (34) | |
| Range, 33–83 |
| Gender | Female (n=38) | 23 (27) | 15 (17) | 0.36 | 13 (15) | 25 (29) | 0.49 |
| Male (n=48) | 34 (40) | 14 (16) | | 13 (15) | 35 (41) | |
| Tumor size
(cm) | ≤7 (n=50) | 33 (38) | 17 (20) | 1.00 | 15 (18) | 35 (41) | 1.00 |
| >7 (n=36) | 24 (28) | 12 (18) | | 11 (13) | 24 (28) | |
| Fuhrman's |
| histological
grade | 1 + 2 (n=37) | 16 (19) | 21 (24) | 0.0002 | 11 (13) | 26 (30) | 1.00 |
| 3 + 4 (n=49) | 41 (42) | 8 (9) | | 14 (16) | 35 (41) | |
| TNM stage |
|
Non-metastatic | T1-2N-0M0 | 24 (28) | 21 (24) | 0.011 | 14 (16) | 31 (36) | 1.00 |
| Metastatic | T1-2N1M0 | | | | | | |
| T3-N0-1M0 | | | | | | |
| T4-N0-2M0 | | | | | | |
| T1-4N2M0 | | | | | | |
| T1-4N0-2M1 | 33 (39) | 8 (9) | | 12 (14) | 29 (34) | |
DNA extraction, bisulfite modification
and acquisition of control DNA
DNA was isolated from each specimen (~2 mg) to a
total volume of 20 μl followed by bisulfide modification according
to manufacturer's protocol (DNA Methylation-Direct™ kit; Zymo
Research, Irvine, CA, USA). Final elution was performed with the
use of 50 μl of ddH2O, and the DNA concentration was
assessed with NanoDrop ND-1000. For the generation of a dilution
series of control DNA standards, fully methylated (named MD) and
unmethylated (UMD) human genomic DNA (HCT116 cell line, DKO strain,
Human Methylated & Non-methylated DNA Set; Zymo Research) were
utilized.
Methylation sensitive high resolution
melting quantitative PCR (MS-HRM-qPCR) assessment of RASSF1A
promoter methylation status
Methylation was assessed in samples with the use of
methylation specific-high resolution melting (MS-HRM) (9). Primers sequences were designed using
MethPrimer software (http://www.urogene.org/methprimer/); primers, reaction
mixtures and time-temperature conditions are listed for each
promoter region interrogated in Table
I. MS-qPCR reactions were set on StepOnePlus
(Life-Technologies) apparatus and after conventional 42-cycle
amplification, post-PCR products were checked using HRM application
(details in Table I) with the use
of HRM software ver. 3.1 (Life-Technologies). For each run, matched
DNA from T, C and M samples were set; standard dilutions of MD and
UMD were made to 100, 50, 25, 10 and 0% of MD in UMD and used in
the same PCR plate as well as no template control. The final
methylation results divided samples into two groups: homogenous and
heterogenous methylated DNA; homogenous DNA was further
semi-quantitatively divided into intervals, according to MD
standards (0–10%; 10–25%; 25–50% and 50–100%). Heterogenously
methylated DNA samples were excluded from the analysis, due to
limitation of the method (9,11).
Western blot analysis
Protein lysates were prepared with Mammalian Cell
Extraction kit (BioVision, Milpitas, CA, USA). The lysates (10 μg)
were loaded to a 10% Mini-Protean TGX gel (Bio-Rad Laboratories,
Hercules, CA, USA), resolved by SDS-PAGE and transferred to a PVDF
membrane using the Trans-Blot Turbo system (Bio-Rad Laboratories).
Membranes were stained with 0.1% Ponceau S to ensure equal loading
after transfer, and subsequently blocked with 5% albumin fraction V
in TBS buffer with 0.1% Tween-20 (TBST) for 1 h at room temperature
(RT). After washing with TBST, membranes were incubated (overnight,
4°C) with specific primary antibodies in 2% albumin/TBS: 1:2,000
rabbit anti-RASSF1A (#bs-1234R; Bioss, Inc., Woburn, MA, USA);
mouse polyclonal anti-RASSF1C (1:1,000) (#ab24419; Abcam,
Cambridge, UK) and anti-GAPDH peroxidise-conjugated IgM 1:50,000
(#G9295; Sigma-Aldrich, St. Louis, MO, USA). After triple washing
with TBST, blots were incubated (2 h, RT) with horseradish
peroxidase-conjugated secondary antibodies: 1:15,000 anti-rabbit
IgG or anti-mouse IgG (Sigma-Aldrich). Following triple washing
with TBST, immunoreactive bands were detected on medical X-ray film
(Agfa HealthCare, Mortsel, Belgium) using chemiluminescent
peroxidase substrate (Sigma-Aldrich). Densitometric analyses of
immunoreactive protein bands was performed with Quantity One
software (Bio-Rad Laboratories) and calculated as units =
Intensity/mm2. After normalization to GAPDH protein
units for each sample, the semi-quantitate results for either tumor
or metastasized samples were obtained as a ratio = mean
unitsT/M/mean unitsC for RASSF1A or RASSF1C
proteins.
Immunohistochemistry for RASSF1A and
RASSF1C proteins
Formalin-fixed paraffin-embedded tissue sections (6
μm) from side tissues were deparaffinized and hydrated through
xylenes and graded alcohol series. After antigen retrieval using
hot acidic citrate buffer (Epitope Retrieval Solution pH 6.0; Leica
Biosystems Newcastle Ltd., Newcastle upon Tyne, UK) samples were
blocked for endogenous peroxidase activity by using 3% hydrogen
peroxide for 10 min. Sections were then incubated with 2.5% normal
horse serum [ImmPRESS anti-rabbit Ig (peroxidase) polymer detection
kit; Vector Laboratories, Inc., Burlingame, CA, USA] to block
non-specific binding of immunoglobulin. Immunohistochemical (IHC)
staining was performed using anti-RASSF1A rabbit anti-human
polyclonal antibody (1:100) (#bs-1234R; Bioss, Woburn, MA, USA) or
mouse polyclonal anti-RASSF1C (1:100) (#ab24419; Abcam). After 2-h
incubation with primary antibodies at room temperature, slides were
washed in PBS and incubated with an appropriate secondary antibody
[ImmPRESS anti-rabbit Ig (peroxidase) polymer detection kit or
ImmPRESS anti-mouse Ig (peroxidase) polymer detection kit] for 30
min. Slides were rinsed in PBS and immunoreactive cells were
visualized by addition of 3,3′-diaminobenzidine solution (DAB
peroxidase substrate kit; Vector Laboratories) and counterstained
with hematoxylin. Sections were then dehydrated, mounted in DPX
mounting medium and viewed under a Nikon Eclipse E800 light
microscope with Lucia G software. The specificity of the IHC
staining was determined by a negative control, which was prepared
under the same conditions as mentioned above, replacing primary
antibodies with 2.5% normal horse serum [ImmPRESS anti-rabbit Ig
(peroxidase) polymer detection kit].
Statistical analysis
Statistics was performed with the use of GraphPad
Prism ver. 6.05 (GraphPad Software, Inc., San Diego, CA, USA) and
Statistica ver. 10c (Statsoft Inc., Tulsa, OK, USA). Non-parametric
Mann-Whitney U and Kruskal-Wallis ANOVA tests were used to compare
clinical and molecular data since most data did not pass D'Agostino
and Pearson omnibus test. Fisher's 2×2 exact test was used to
analyse relationships between the subgroups. Spearman's correlation
or multivariate regression were utilized for testing the
associations between two or three variables. The Cox-Mantel
proportional hazard regression model was used to evaluate the
effect of explorative variables on survival of ccRCC patients.
First, univariate Cox regression analysis for every single variable
was performed. Secondly, variables with a P-value <0.05 were
included into multivariate Cox regression analysis with a variable
selection via backward elimination. All associations were presented
as hazard ratios (HR) with their 95% confidence interval (CI) and
P-values (12). Variables for
overall survival (OS) and progression-free survival (PFS) rates
were calculated separately. Kaplan-Meier estimations were performed
to describe survival rates.
Results
Clinicopathological characteristics of
patients
Of 86 ccRCC patients (mean age, 62.1±11.2 years)
(Table II), 37 were diagnosed as
stage I (T1-2N0M0), 8 as stage II (T2N0M0), 12 as stage III
(T1-2N1M0 or T3N0-1M0) and 29 as stage IV (T4N0-2M0 or T1-4N2M0 or
T1-4N0-2M1). At the time of surgery 47.7% ccRCC patients were
diagnosed with local or distant metastases. According to Fuhrman's
nuclear grading 4 patients were grade 1, 32 grade 2, 23 grade 3 and
26 were grade 4. None of the patients had undergone chemotherapy or
radiotherapy before the nephrectomy. The mean follow-up period was
21 months (range, 3–48), to date 45 patients were alive (52); all
deaths (except for 1 patient) were related to ccRCC progression.
Median overall survival (OS) rate was 12 months. During follow-up
metastases occurred in 38 (44) patients while the median
progression free-survival (PFS) rate was 6 months.
Expression of RASSF1A and RASSF1C genes
at the mRNA level
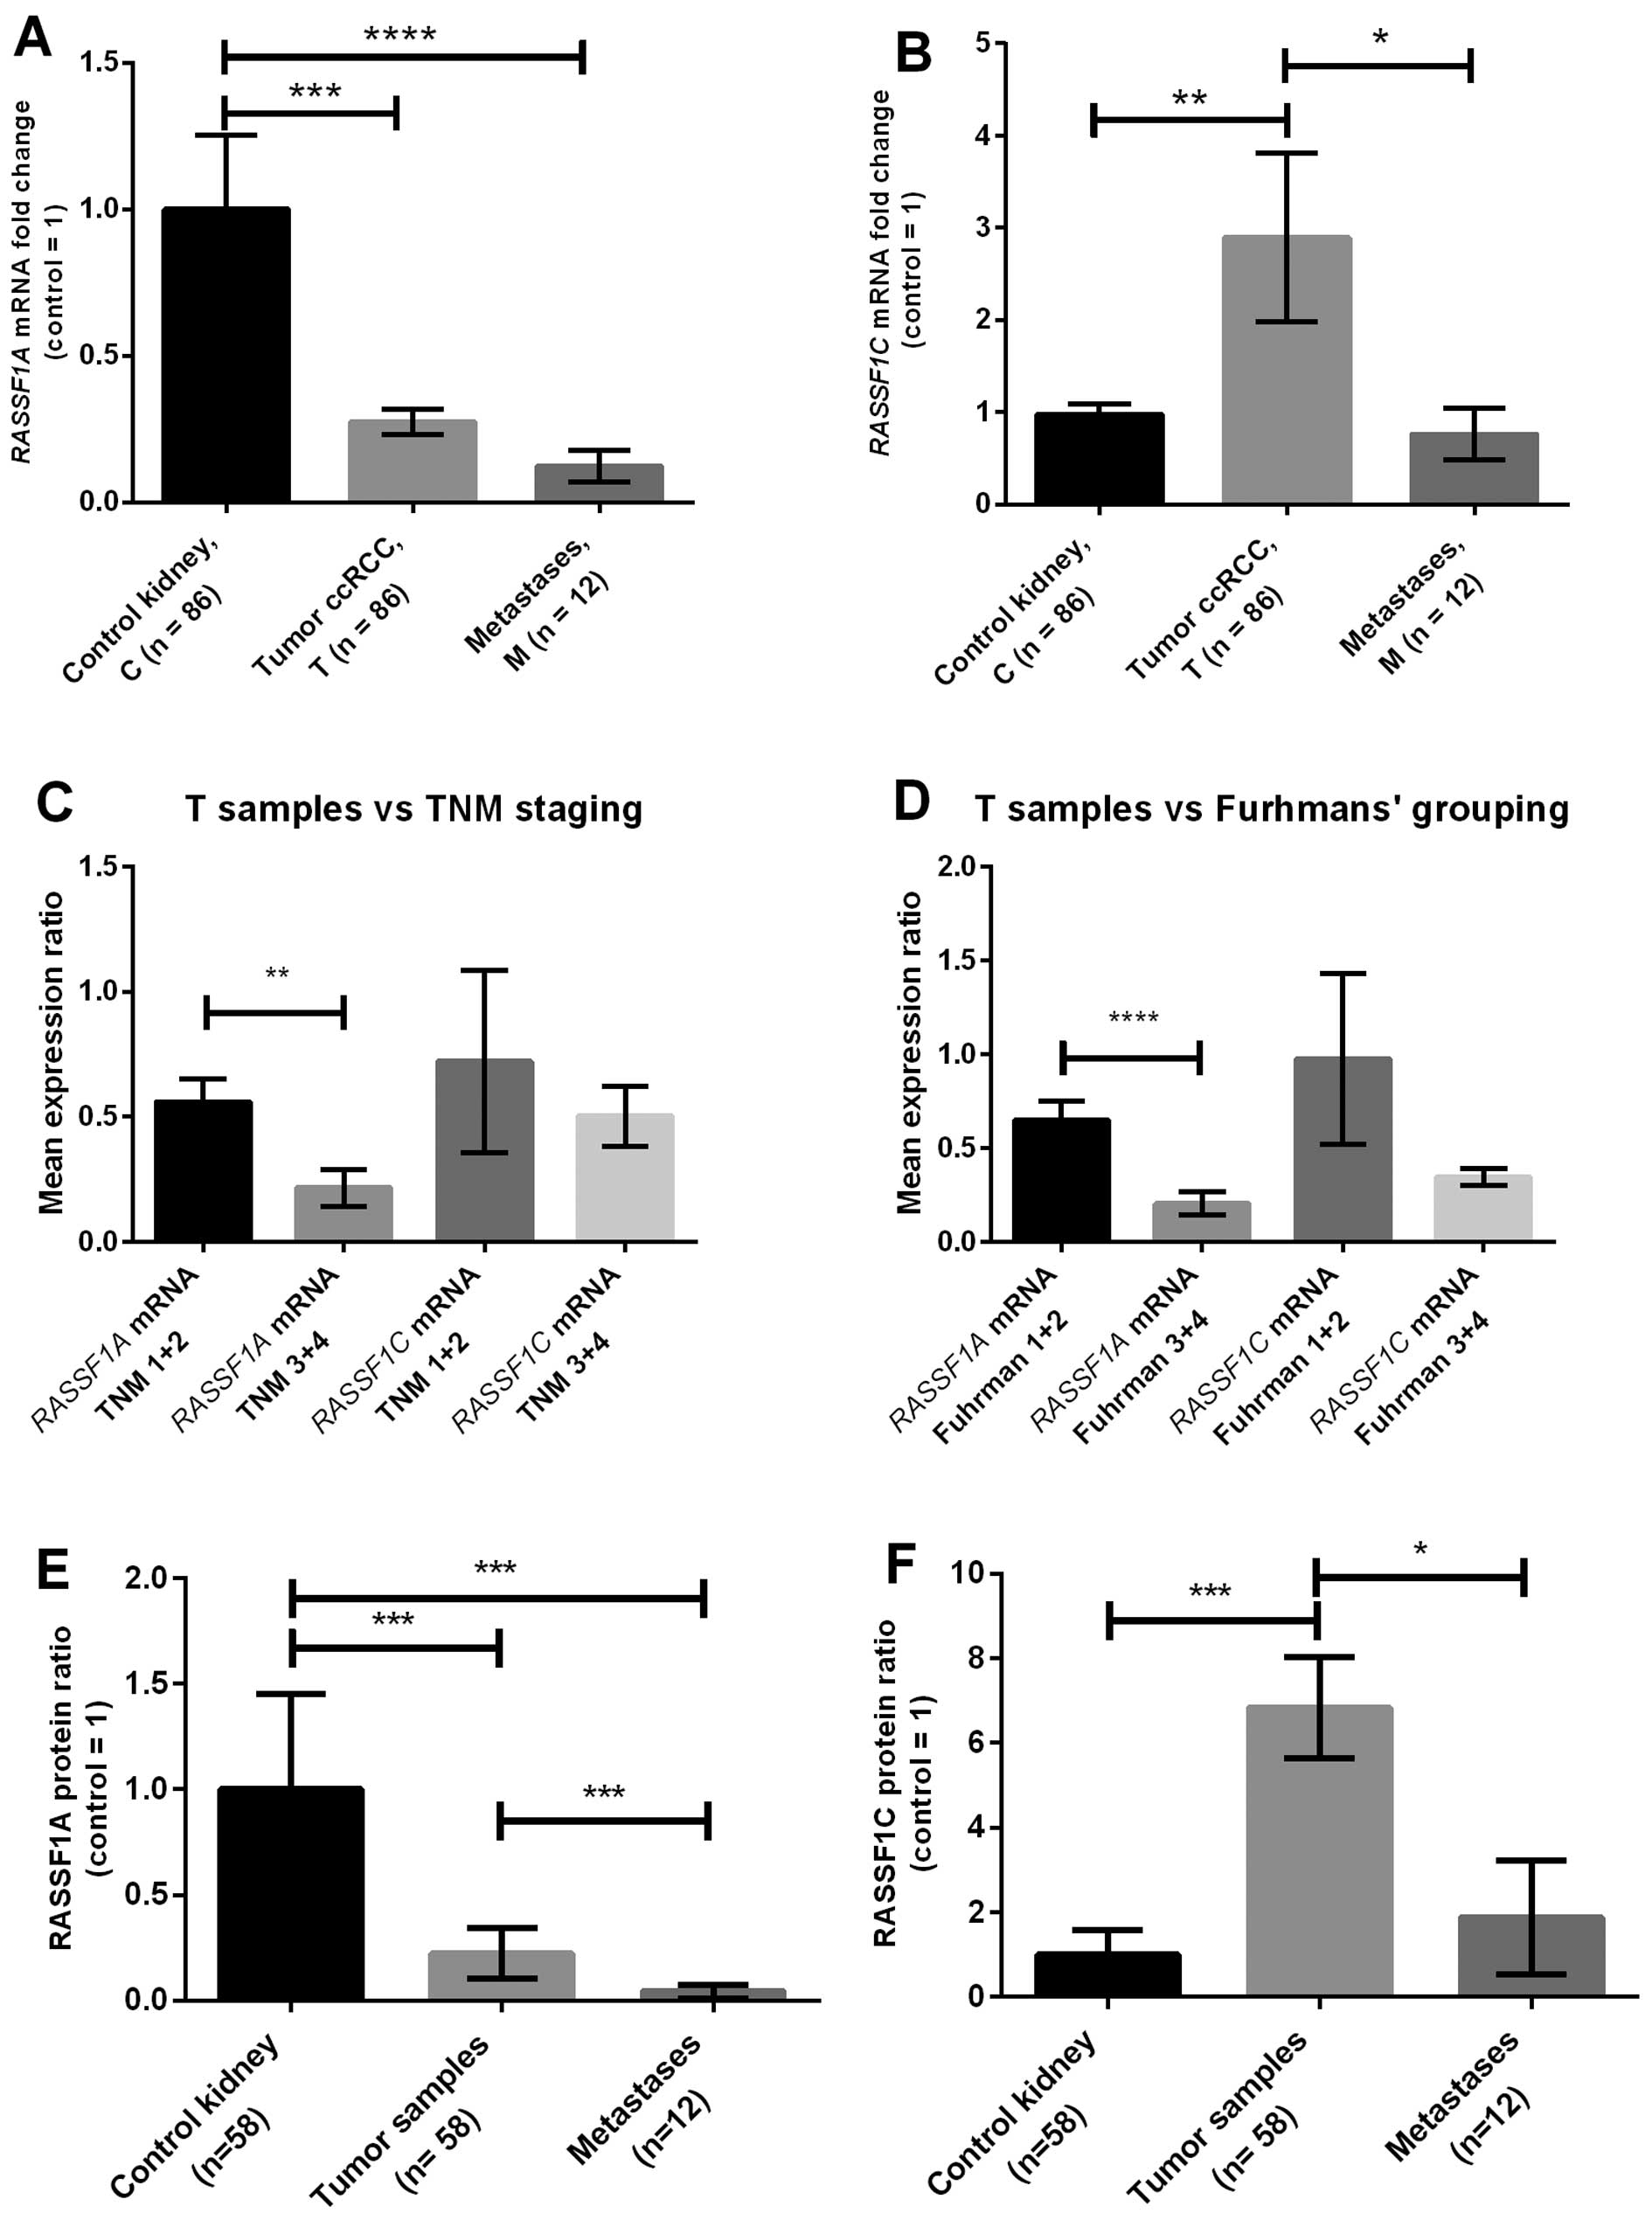
As shown in Fig.
1A, RASSF1A mRNA level in T and M samples were ~4 and 5
times lower vs. C samples, respectively. The mRNA levels of
RASSF1C were ~3 times higher in tumor in comparison to
either C or M samples, respectively (Fig. 1B).
After setting-up the threshold value based on median
values of RASSF1A or RASSF1C expression levels in
control samples decreased level of RASSF1A mRNA was noted in
66 of T and 75 of M samples, whereas RASSF1C expression was
upregulated in 76 T and 33 M samples.
Patients with higher nuclear grades (Fuhrman's 3+4)
and metastatic ccRCC (TNM 3+4) showed downregulation of
RASSF1A (Table II). The
mRNA levels of RASSF1A were ~3 and 4 times lower in TNM 3+4
and Fuhrman's 3+4 than in TNM 1+2 or Fuhrman's 1+2 groups,
respectively (Fig. 1C and D). No
correlations between clinical data and RASSF1C gene
expression were found (Table II
and Fig. 1C and D).
RASSF1A promoter methylation status
According to the analysis of MD/UMD standards the
results of HRM-MS-qPCR were qualified into four grades: 1, 0–10%
methylation; 2, 10–25%; 3, 25–50%; 4, 50–100% (data not shown). We
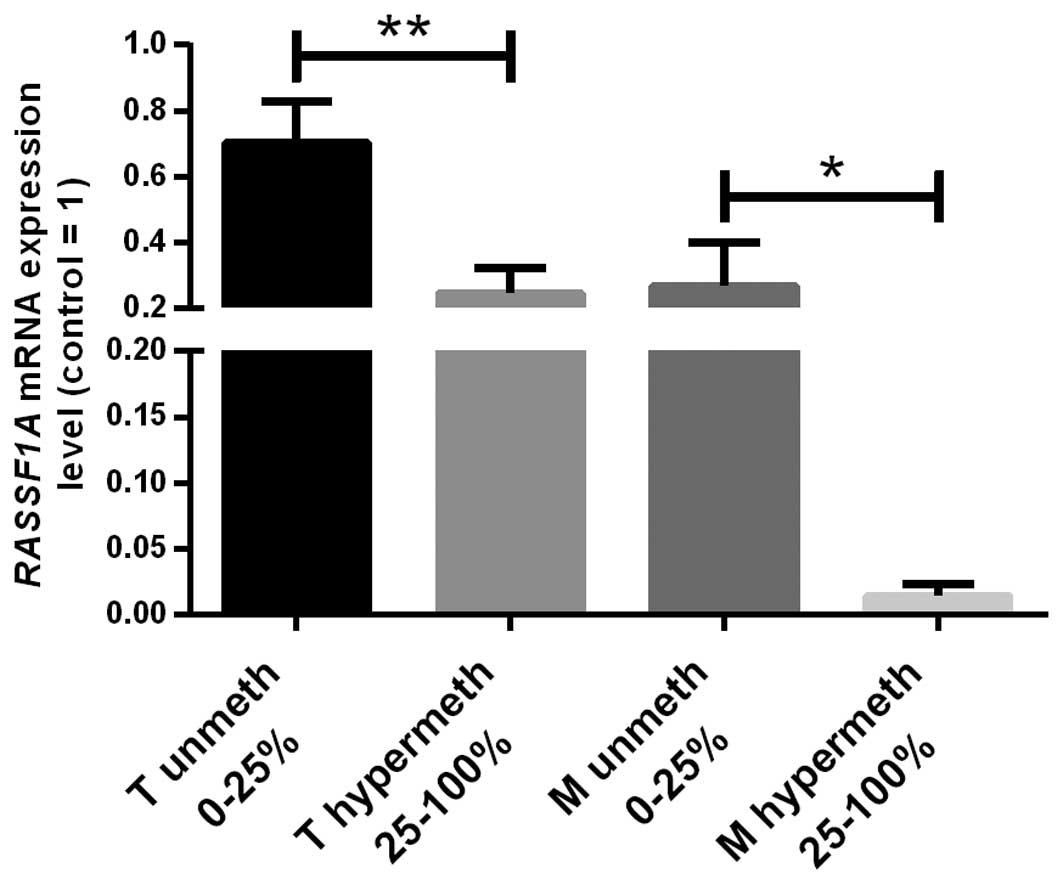
assessed >25% methylation as hypermethylation status finding 35
(60%) unmethylated and 23 (40%) hypermethylated T samples. A
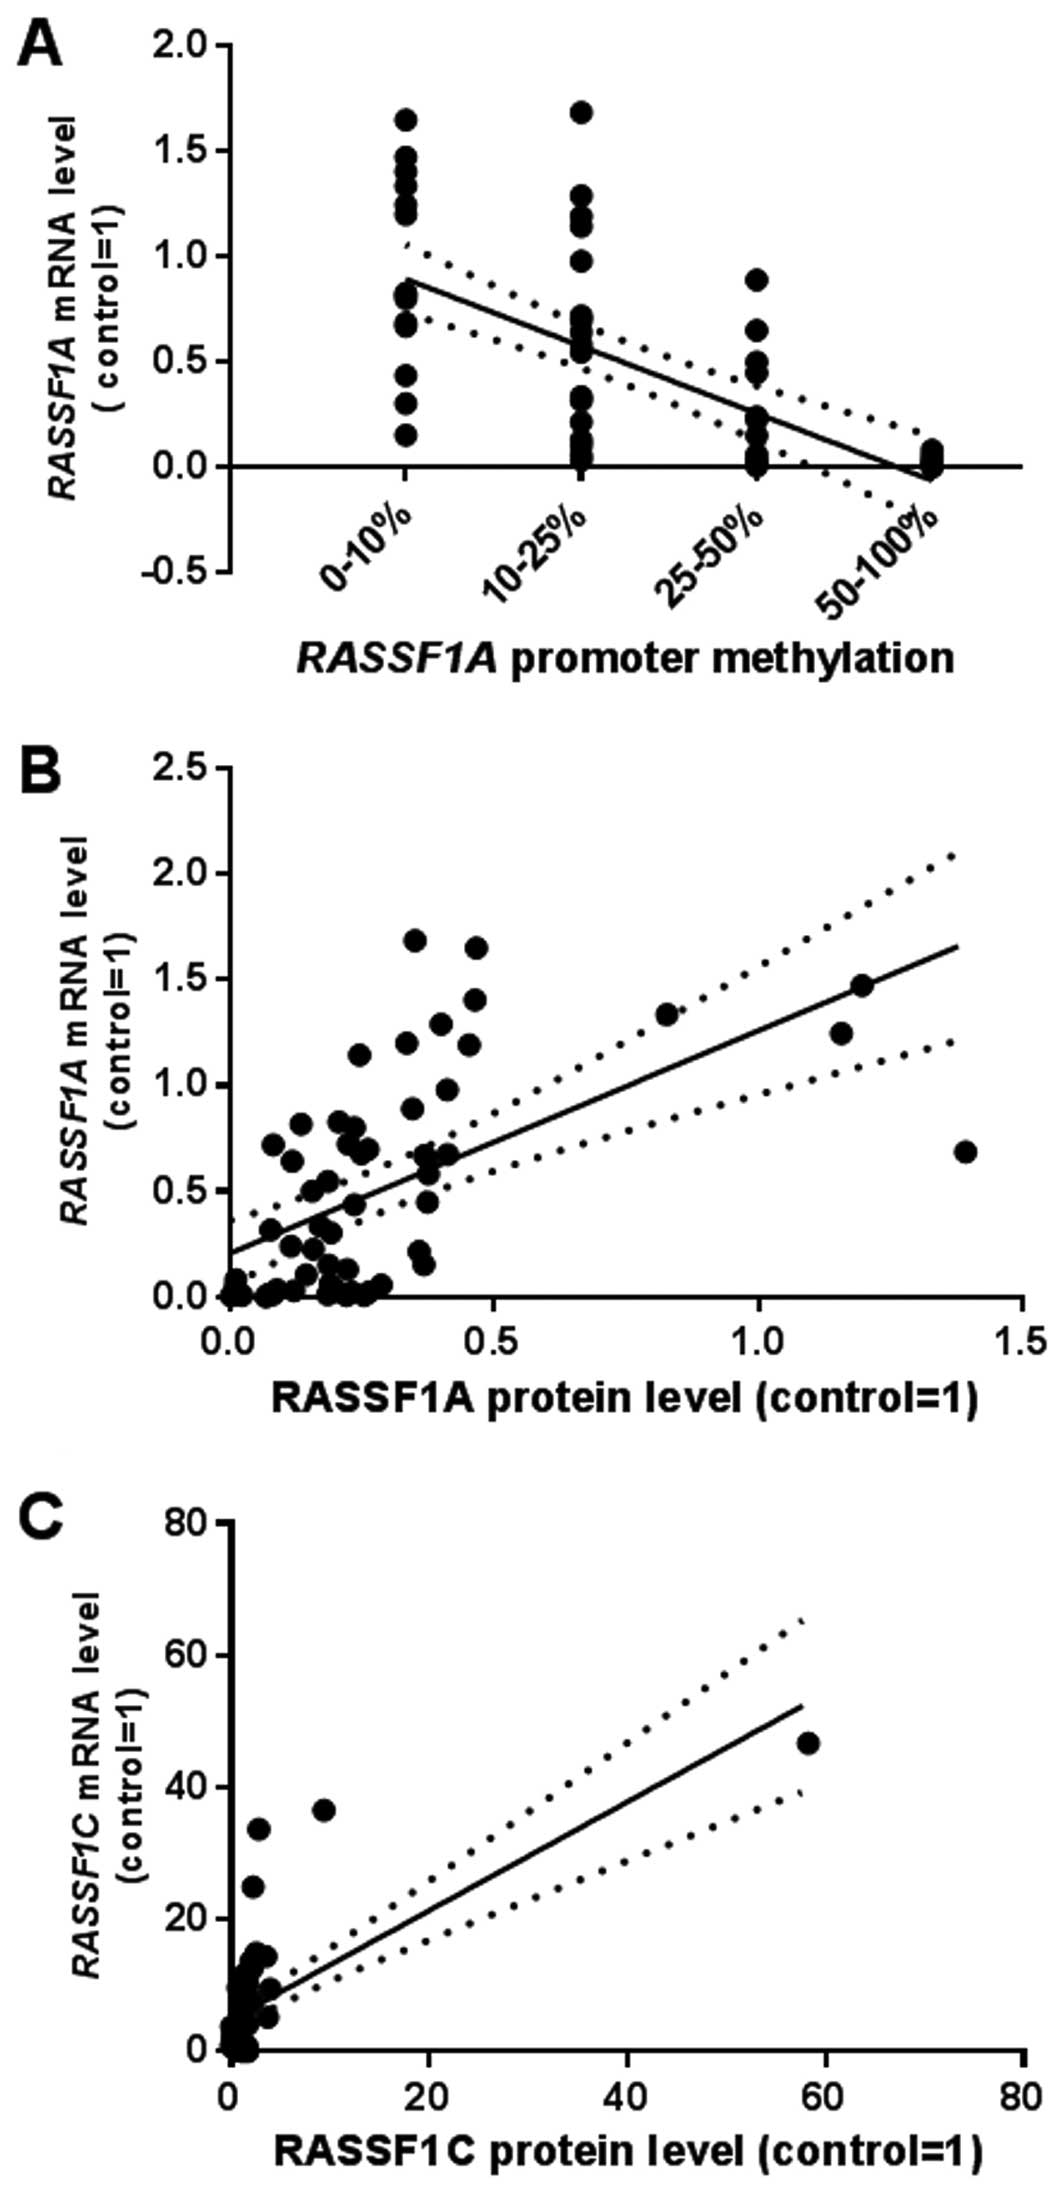
significant negative correlation between increasing grades of
methylation and RASSF1A mRNA levels was found (Fig. 3). In hypermethylated T samples ~3.5
times lower RASSF1A mRNA level than in non-methylated T
cases was observed. Hypermethylation of RASSF1 promoter was
associated only with high TNM status (Table III).
| Table IIIAssociation between RASSF1A
promoter methylation, protein expression of RASSF1A and
RASSF1C and data of patients. |
Table III
Association between RASSF1A
promoter methylation, protein expression of RASSF1A and
RASSF1C and data of patients.
|
Patients/specimens/qPCR results Variables,
n | RASSF1A
promoter methylation and protein assessment | RASSF1C
protein assessment |
|---|
|
|
|---|
| Unmethylation vs.
hypermethylation (%) | Protein level
relative to control samples (%) | Protein level
relative to control samples (%) |
|---|
|
|
|
|---|
| Unmethylated
(%) | Hypermethylated
(%) | P-valuea | Low (≤10.09b) | High
(>10.09b) | P-valuea | Low
(>3.03b) | High (≤3.03b) | P-valuea |
|---|
| Age (years) |
| ≤62 (n=29) | 17 (29) | 12 (21) | 1.00 | 24 (41) | 5 (9) | 0.35 | 24 (41) | 5 (9) | 1.00 |
| >62 (n=29) | 18 (31) | 11 (19) | | 20 (34) | 9 (16) | | 24 (41) | 5 (9) | |
| Gender |
| Female
(n=280) | 14 (24) | 14 (24) | 0.18 | 22 (38) | 6 (10) | 0.76 | 24 (41) | 4 (8) | 0.73 |
| Male (n=30) | 21 (36) | 9 (16) | | 22 (38) | 8 (14) | | 24 (41) | 6 (10) | |
| Tumor size
(cm) |
| ≤7 (n=34) | 19 (33) | 15 (26) | 0.43 | 25 (43) | 9 (16) | 0.76 | 28 (47) | 7 (12) | 0.51 |
| >7 (n=24) | 16 (28) | 8 (13) | | 19 (33) | 5 (8) | | 21 (36) | 3 (5) | |
| Fuhrman's
histological grade |
| 1 + 2 (n=25) | 17 (29) | 8 (14) | 0.41 | 15 (26) | 10 (17) | 0.028 | 19 (33) | 6 (10) | 0.3 |
| 3 + 4 (n=33) | 18 (31) | 15 (26) | | 29 (50) | 4 (7) | | 29 (50) | 4 (7) | |
| TNM stage
groupingc |
| Non-metastatic
(n=32) | 24 (41) | 8 (14) | 0.01 | 20 (33) | 12 (20) | 0.006 | 27 (44) | 5 (8) | 1.00 |
| Metastatic
n=26 | 11 (19) | 15 (26) | | 27 (41) | 2 (6) | | 24 (40) | 5 (8) | |
|
RASSF1A/RASSF1C qPCR
expression level |
| Low (≤0.266 for
RASSF1A) or (≥0.19 for RASSF1C) | 17 (29) | 16 (28) | 0.17 | 31 (53) | 2 (3) | 0.0004 | 20 (34) | 0 | 0.01 |
| High (>0.266
for RASSF1A) or (<0.19 for RASSF1C) | 18 (31) | 7 (12) | | 13 (22) | 12 (21) | | 28 (48) | 10 (18) | |
RASSF1A promoter hypermethylation was found in 5/8
of metastasized samples in which RASSF1A mRNA levels were
~15 times lower than in non-methylated metastasized samples
(Fig. 2). No correlations between
methylation status of metastases and clinical data were found.
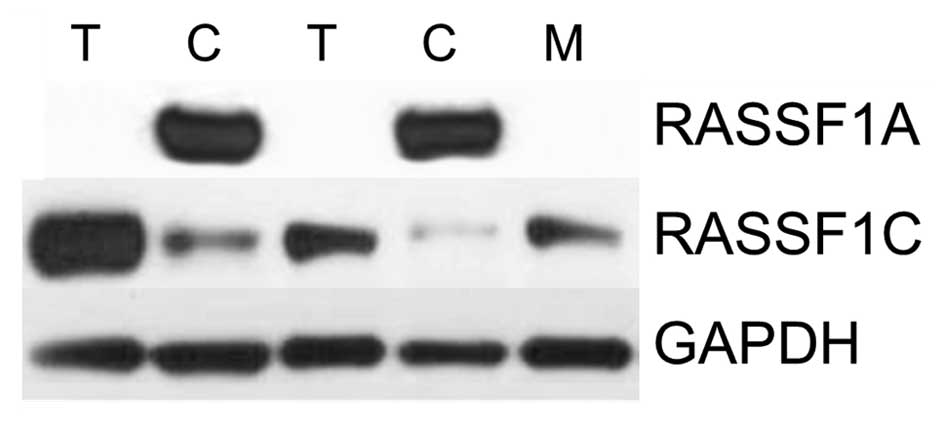
RASSF1A and RASSF1C protein analysis
RASSF1A and RASSF1C protein levels were assessed by
western blot analysis in paired 58 ccRCC and control samples, and
12 metastases analyzed for RASSF1A hypermethylation. The
average RASSF1A protein levels in T and M samples were ~5 and 20
times lower than in control tissue, respectively (Figs. 4 and 1E). After setting-up threshold level
44/58 T (76) and 10/12 M (83) samples showed decreased RASSF1A
protein level (Fig. 1E and
Table III). Decreased RASSF1A
level in tumor samples was associated with higher Fuhrman's grade
and high TNM grades (Table
III).
RASSF1C protein level was on average ~6 times higher
in T vs. C samples with similar levels in M and C (Figs. 4 and 1F). However, high RASSF1C level was found
only in 10/58 (20) T and 3/12
(25) M samples (Fig. 1F and Table III).
Positive correlations were observed between mRNA and
protein levels (rs=0.66 for RASSF1A and rs=0.69 for RASSF1C;
P<0.001, Spearman's test).
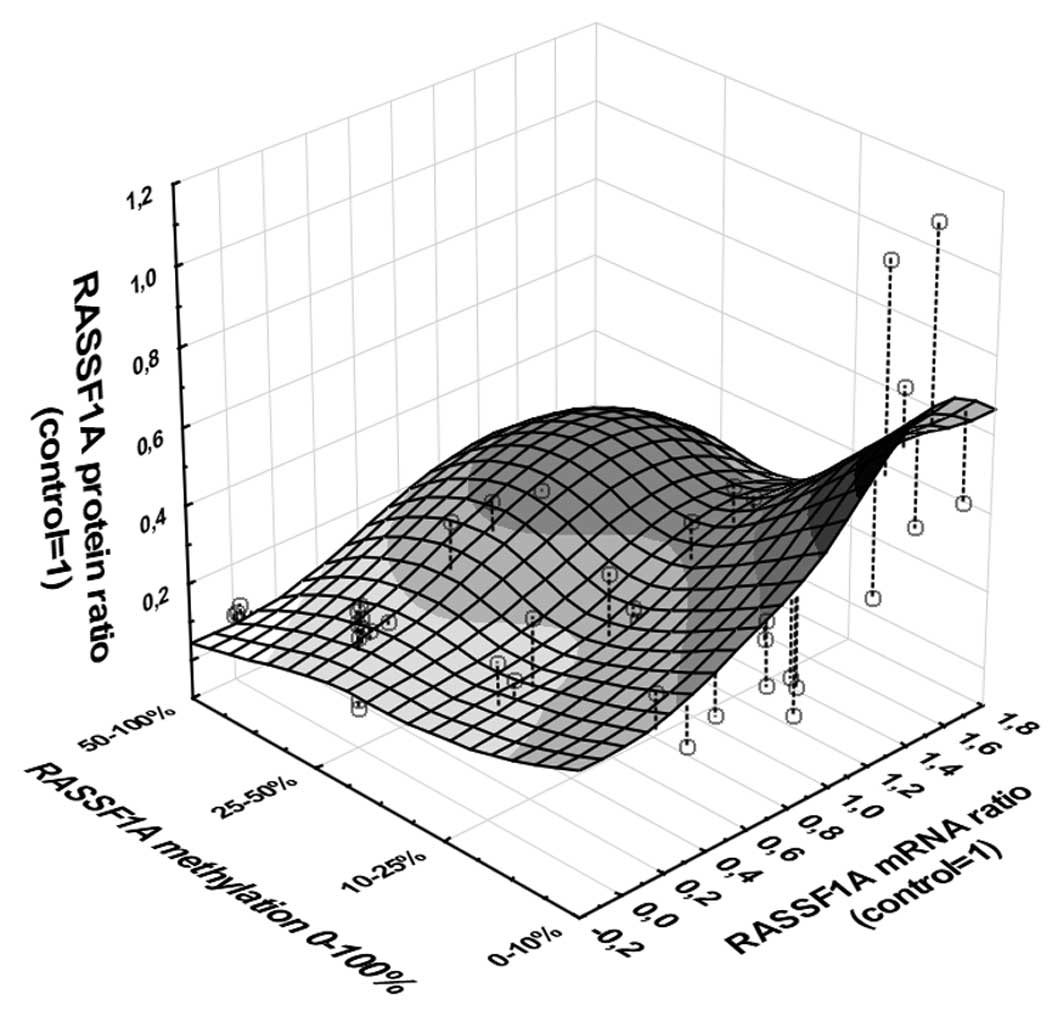
The analysis of possible indirect association
between RASSF1A promoter methylation → decreased mRNA level →
decreased protein level revealed significant relationship between
three measured variables (multivariable regression; P<0.001,
b=−0.63; Fig. 5).
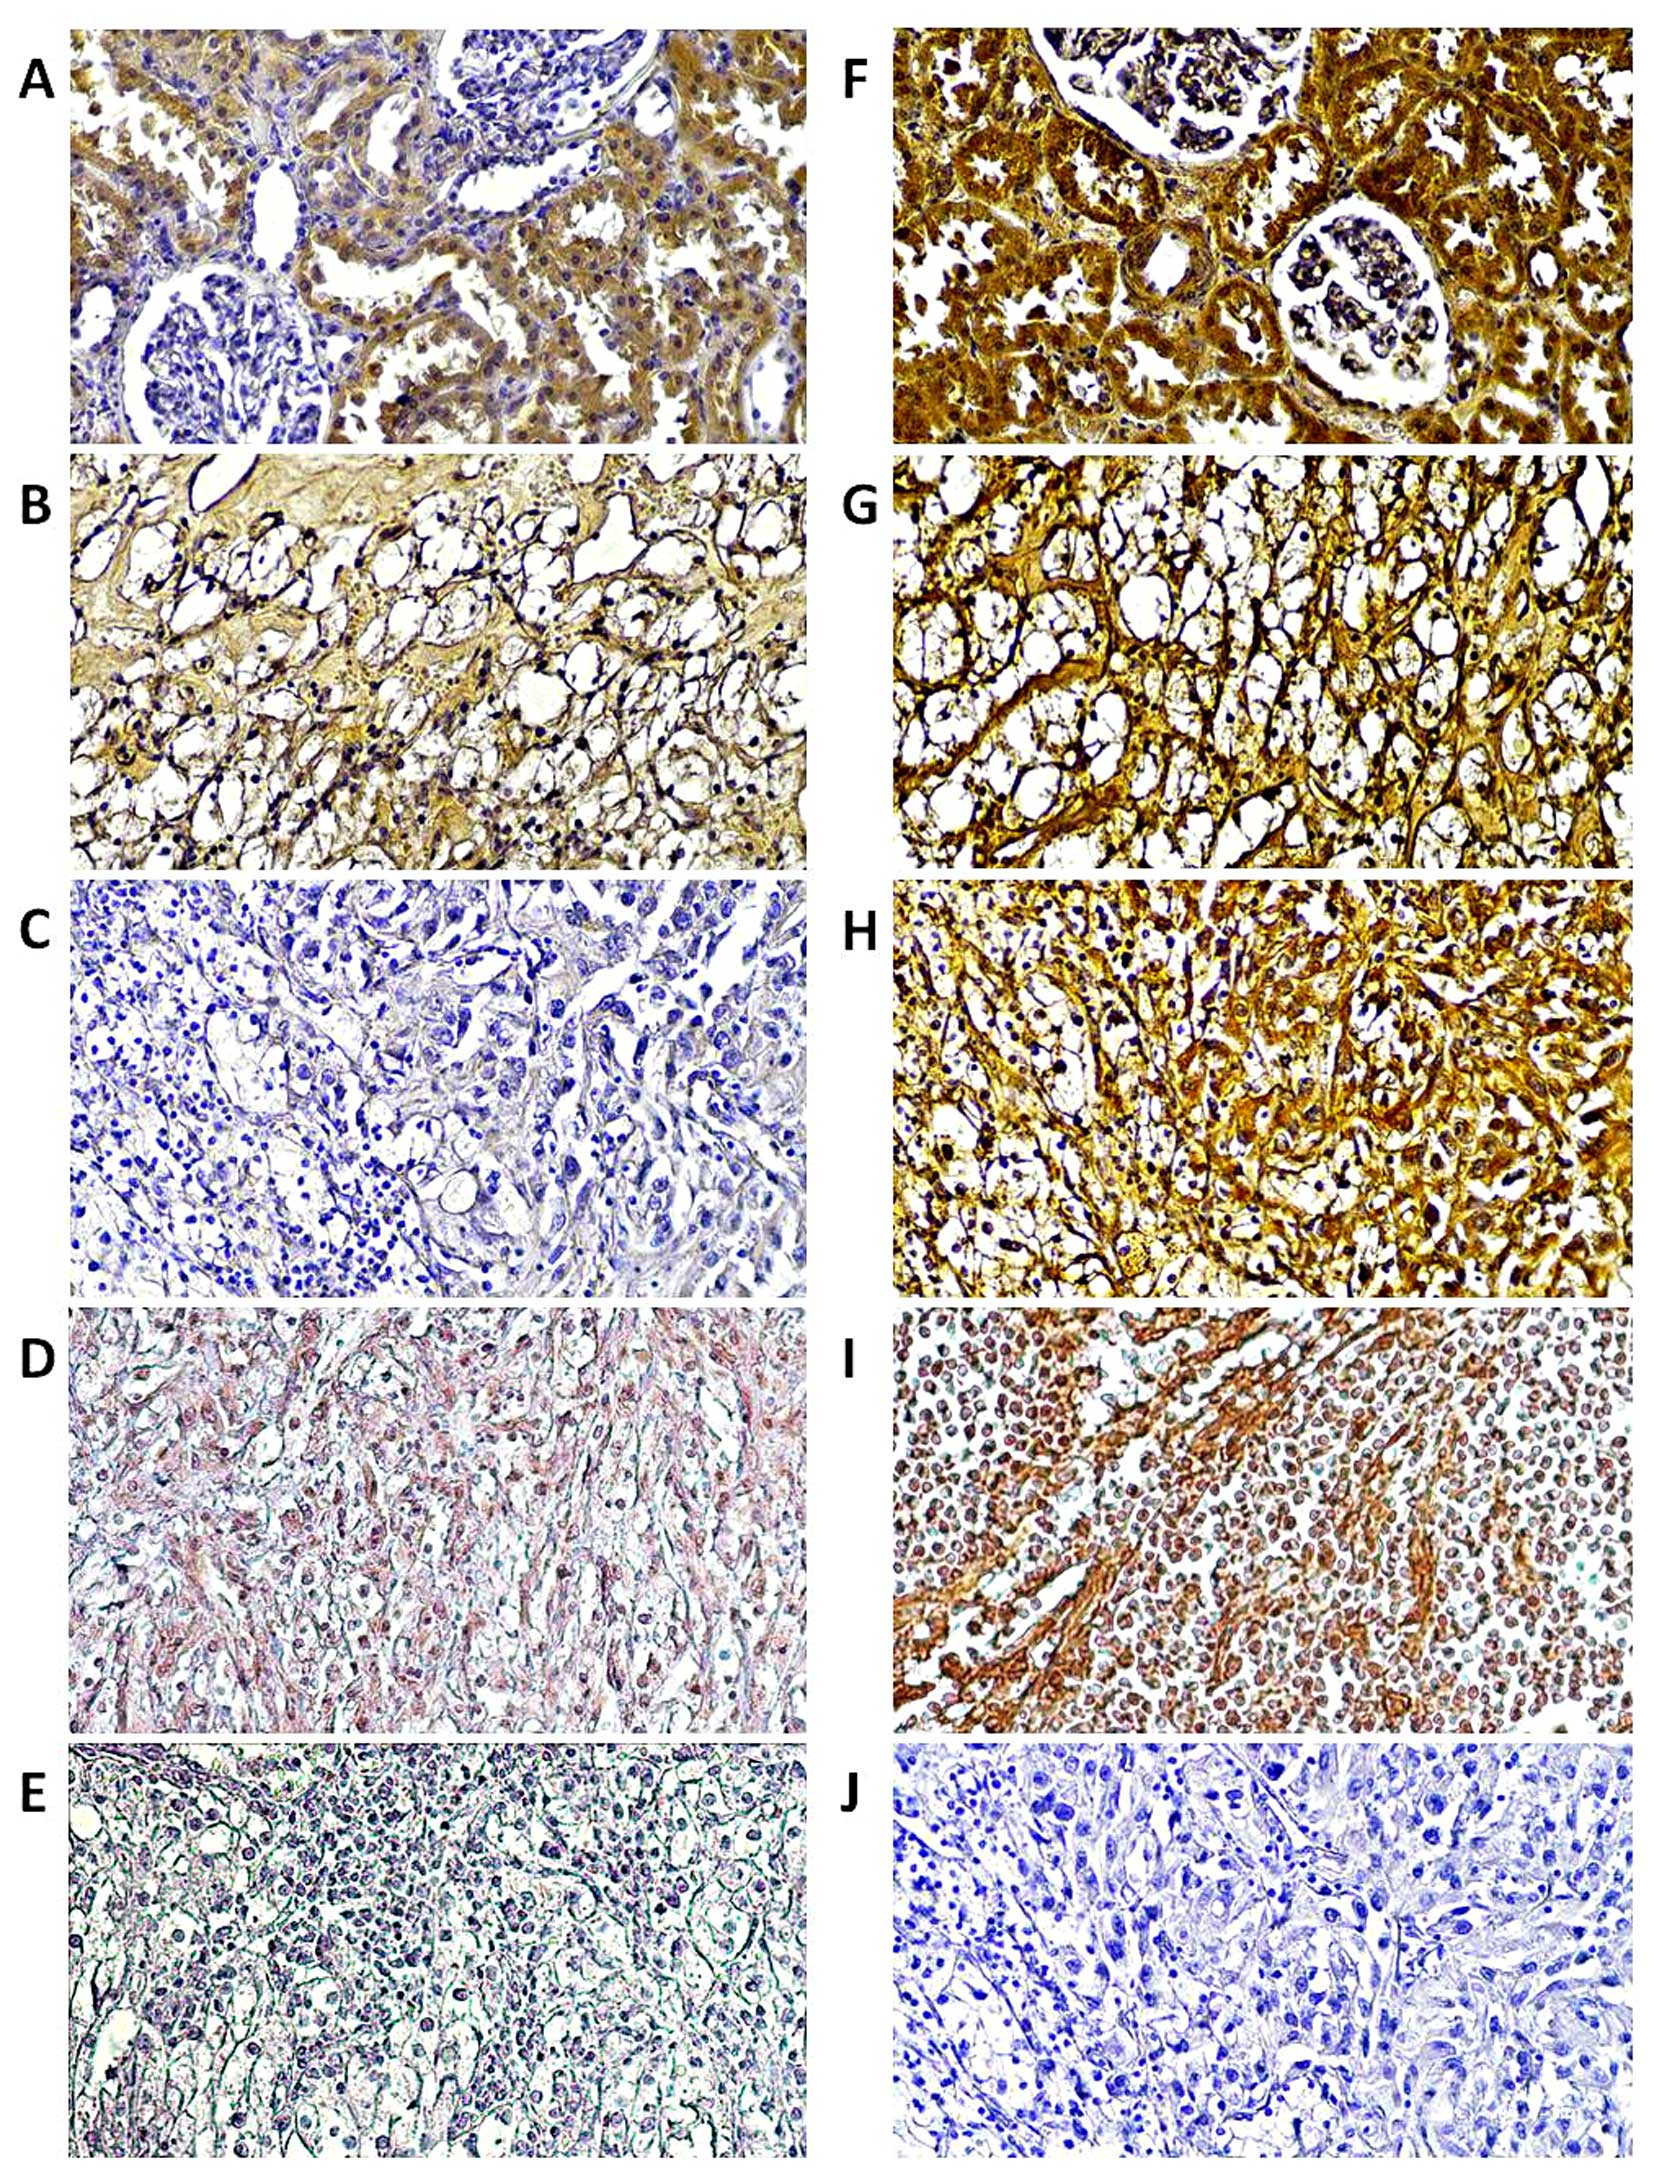
Tissue localization of RASSF1A and
RASSF1C proteins
Immunohistochemical staining for RASSF1A and RASSF1C
proteins was performed on twelve paired T and C samples and six M
samples. As presented in Fig. 6,
both proteins showed intense immunoreactivity in epithelial cells
of healthy kidney whereas in tumor and metastasized samples RASSF1A
was barely noticeable (Fig. 6B–D).
Strong immunoreactivity of the RASSF1C protein was found in all
studied samples (Fig. 6F–I).
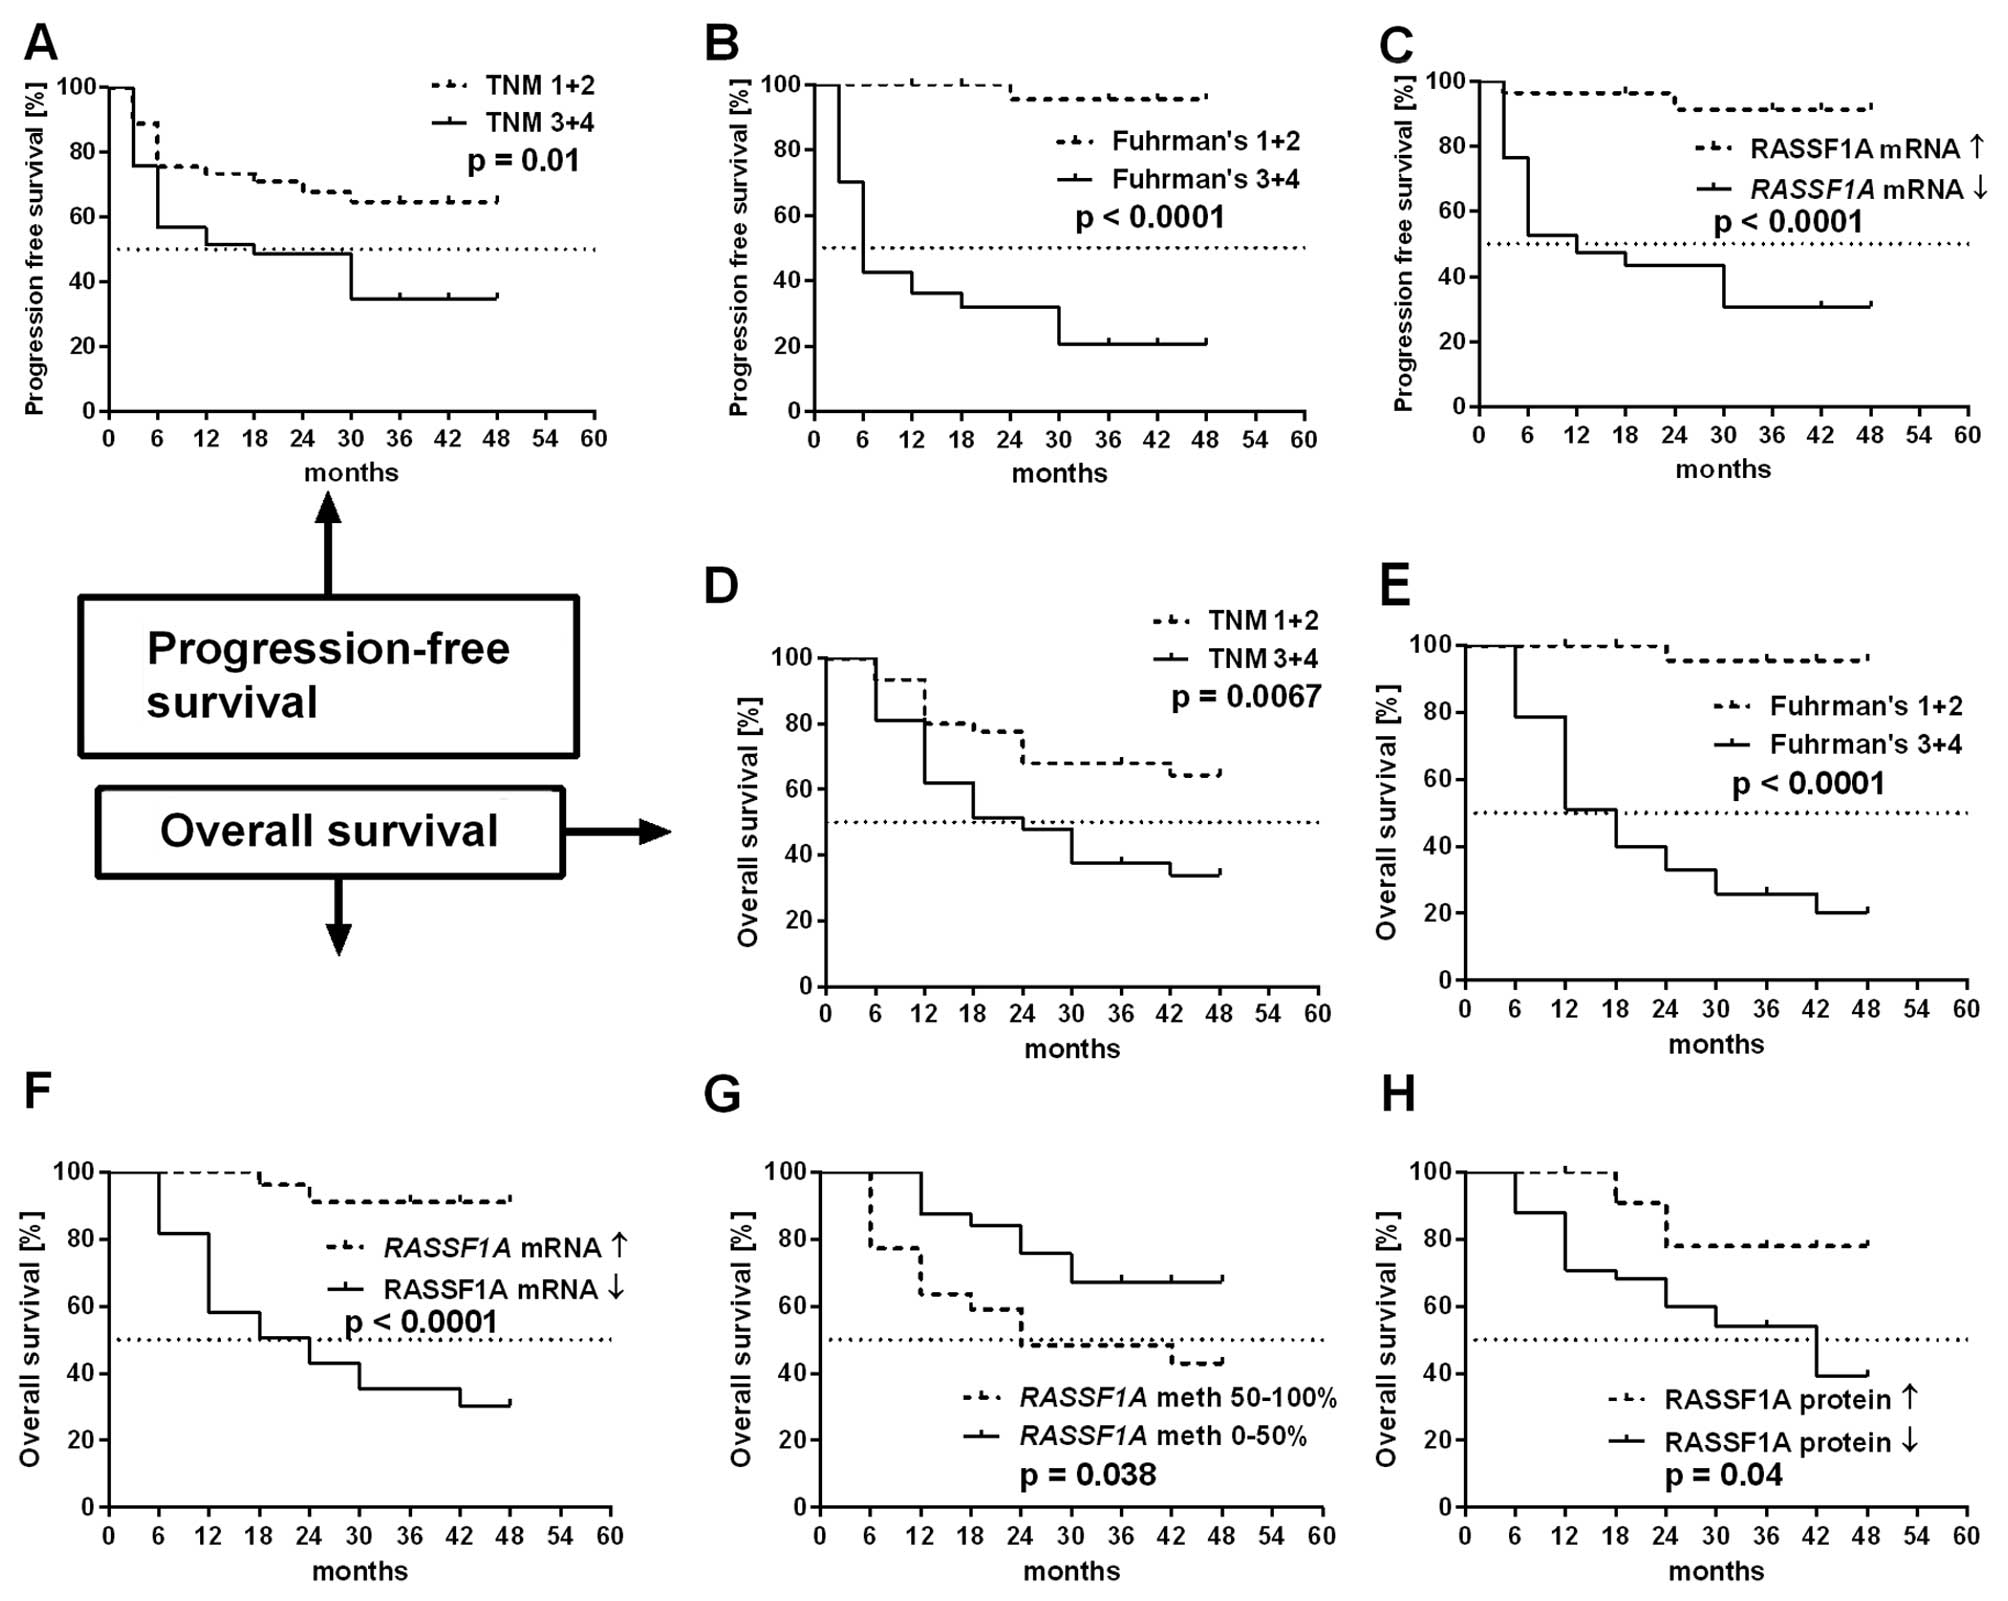
Survival analysis
We found that overall and progression-free survival
were strongly associated with higher TNM and Fuhrman's grades of
ccRCC patients (Fig. 7A, B, D and
E). Patients with decreased RASSF1A mRNA levels showed
significantly shorter OS and PFS rates than patients with high
RASSF1A mRNA levels (Fig. 7C
and F). Furthermore, higher RASSF1A promoter methylation
status and lower RASSF1A protein levels were associated with
shorter OS (Fig. 7G and H).
It was noted, that the levels of RASSF1C were not
associated with either OS or PFS rates of ccRCC patients (plots not
shown).
Multivariate analysis using the Cox proportional
hazard model indicated that the classification based on
RASSF1A mRNA level was the independent predictor of OS and
PFS in ccRCC patients when assessed by Fuhrman's histological grade
(Tables IV and V).
| Table IVUnivariable and multivariable Cox
regression analysis of overall survival rate of ccRCC patients. |
Table IV
Univariable and multivariable Cox
regression analysis of overall survival rate of ccRCC patients.
| Univariable
analysis | Multivariable
analysis |
|---|
|
|
|
|---|
| Parameters | P-value | HR (95 CI) | P-value | HR (95 CI) |
|---|
| Gender |
| Female vs.
male | 0.069 | 2.38
(0.93–6.11) | | |
| Age (years) |
| >62 vs.≤62 | 0.42 | 0.69
(0.27–1.71) | | |
| Tumor size
(cm) |
| >7 vs.≤7 | 0.46 | 0.71
(0.29–1.75) | | |
| Tumor grade |
| T3+4 vs. T1+2 | 0.0001 | 8.37
(2.76–25.35) | 0.28 | 1.95
(0.57–6.64) |
| Histological
grade |
| F3+4 vs. F1+2 |
<0.0001 | 34.08
(4.50–258.08) | 0.007 | 18.28
(2.19–152.39) |
| RASSF1A mRNA
levels |
| (≤0.266) vs.
(>0.266) | 0.004 | 6.06
(1.76–20.91) | 0.02 | 2.25
(0.62–8.12) |
| RASSF1A
methylation |
| (>25) vs.
(≤25%) | 0.02 | 3.00
(1.18–7.65) | 0.22 | 1.88
(0.68–5.18) |
| RASSF1A
protein levels |
| (≤10.09) vs.
(>10.09) | 0.32 | 0.54
(0.15–1.85) | | |
| RASSF1C mRNA
levels |
| (>0.191) vs.
(≤0.191) | 0.83 | 0.91
(0.34–2.37) | | |
| RASSF1C
protein levels |
| (>3.03) vs.
(≤0.191) | 0.35 | 2.01
(0.46–8.72) | | |
| Table VUnivariable and multivariable Cox
regression analysis of progression free-survival rate of ccRCC
patients. |
Table V
Univariable and multivariable Cox
regression analysis of progression free-survival rate of ccRCC
patients.
| Univariable
analysis | Multivariable
analysis |
|---|
|
|
|
|---|
| Parameters | P-value | HR (95 CI) | P-value | HR (95 CI) |
|---|
| Gender |
| Female vs.
male | 0.049 | 2.37
(1.01–5.64) | 0.55 | 1.33
(0.52–3.39) |
| Age (years) |
| >62 vs.≤62 | 0.19 | 0.57
(0.25–1.32) | | |
| Tumor size
(cm) |
| >7 vs.≤7 | 0.61 | 0.81
(0.35–1.84) | | |
| Tumor grade |
| T3+4 vs. T1+2 | 0.003 | 3.57
(1.51–8.47) | 0.73 | 1.67
(0.47–2.88) |
| Histological
grade |
| F3+4 vs. F1+2 | 0.005 | 33.86
(4.54–252.35) | 0.006 | 18.81
(2.26–156.32) |
| RASSF1A mRNA
levels |
| (≤0.266) vs.
(>0.266) | 0.001 | 10.40
(2.43–44.51) | 0.019 | 2.93
(0.59–14.43) |
| RASSF1A
methylation |
| (>25%) vs.
(≤25%) | 0.28 | 1.56
(0.69–3.55) | | |
| RASSF1A
protein levels |
| (≤10.09) vs.
(>10.09) | 0.43 | 0.65
(0.22–1.9) | | |
| RASSF1C mRNA
levels |
| (>0.191) vs.
(≤0.191) | 0.67 | 0.82
(0.34–2.01) | | |
| RASSF1C
protein levels |
| (>3.03) vs.
(≤0.191) | 0.12 | 4.83
(0.64–35.85) | | |
Discussion
RASSF1A has been suggested to function as a
tumor suppressor gene: its decreased expression at mRNA or protein
levels was observed in almost all studied human cancers (8,13,14),
however, only a few groups were analyzed for its role in ccRCC.
To the best of our knowledge, the present study is
the first report of decreased RASSF1A mRNA levels in ccRCC.
To date, the decreased RASSF1A expression assessed by the
QPCR method in ovarian cancer (15), non-small cell lung cancer (NSCLC)
(16), breast and lung cancers
(17) and esophageal squamous cell
(ESCC) (18) was associated with
progression of cancer and poor patient outcome (15,16,18).
Thus, lower transcription of RASSF1A seems to be a wider
phenomenon.
Epigenetic alterations occur frequently in various
cancer types with hypermethylation of the CpG islands being a
frequent cause of gene silencing. Unexpectedly, when we assessed
hypermethylation of RASSF1A promoter region in ccRCC, we
found a relatively low number of hypermethylated tumor samples,
probably due to high DNA heterogeneity in ccRCC tissue as observed
by other groups (19,20). Although other authors reported high
association of RASSF1A methylation with increased risk of
RCC, it has to be noted that this was attributed only to serum DNA
but not cancer tissue (21). In
the present study probably the more homogeneous histology of twelve
ccRCC metastasized samples resulted in the increased OR similarly
to data on serum DNA (22–24). In other malignancies the
hypermethylation of RASSF1A was related to the progression
of breast (25), NSCLC (26), prostate (7), pancreatic (27), ESCC (18) and colorectal (28) cancers.
The reliable measurement of the gene expression
should involve at least two levels of quantification, since the DNA
→ mRNA → protein sequence often becomes deregulated in cancer cells
(29). The analysis of protein
level is necessary for the realistic evaluation of alterations of
the gene expression both in normal and cancer tissues. The
decreased levels of RASSF1A in ccRCC described in the study present
a novel observation. The finding of the relation between low levels
of RASSF1A in ccRCC samples and progression of cancer (TNM and
Fuhrman's grading) support the role of RASSF1A as a tumor
suppressor gene also in ccRCC, similarly to other types of cancer
(30,31).
The immunohistochemical evaluation of protein
expression in tissue sections is a standard method in cancer
studies. Our qualitative observations of decreased RASSF1A
immunoreactivity in ccRCC tissue are in line with the results of
the tissue microarrays (TMA) study which showed that low RASSF1A
tissue expression was associated with poorer outcome (32). Other authors found that
downregulation of RASSF1A immunoexpression was associated with
early RCC formation (19).
We present novel data on the RASSF1C
expression at mRNA and protein level in ccRCC. Their increased
expression in ccRCC did not correlate with cancer progression on
the contrary to breast cancer and ESCC (18,33).
Thus, RASSF1C expression probably does not play oncogenic
role in ccRCC. The epigenetic methylation does not play any role in
RASSF1C gene expression since its promoter region does not
contain CpG islands (27).
In conclusion, the results of the present study
suggest that measurement of RASSF1A mRNA levels in paired
tumor-normal kidney tissue could be used as a new prognostic factor
in ccRCC, whereas the involvement of RASSF1C gene in ccRCC
progression was not confirmed.
Acknowledgements
The present study was supported by the National
Science Centre (grant no: 2012/05/B/NZ4/02735); the Ministry of
Science and Higher Education (grant IP2010 045970 and grant no:
GUMed: 02-017/07); the system project ‘InnoDoktorant-Scholarships
for Ph.D. students, VIth edition’. The project is co-financed by
the European Union in the frame of the European Social Fund.
Authors wish to thank Michal Czarniak, for the laboratory
support.
References
|
1
|
Novara G, Martignoni G, Artibani W and
Ficarra V: Grading systems in renal cell carcinoma. J Urol.
177:430–436. 2007. View Article : Google Scholar : PubMed/NCBI
|
|
2
|
Massari F, Bria E, Maines F, Milella M,
Giannarelli D, Cognetti F, Pappagallo G, Tortora G and Porta C:
Adjuvant treatment for resected renal cell carcinoma: Are all
strategies equally negative? Potential implications for trial
design with targeted agents. Clin Genitourin Cancer. 11:471–476.
2013. View Article : Google Scholar : PubMed/NCBI
|
|
3
|
Keizman D, Rouvinov K, Sella A, Gottfried
M, Maimon N, Kim JJ, Eisenberger MA, Sinibaldi V, Peer A, Carducci
MA, et al: Is there a ‘trial effect’ on outcome of patients with
meta-static renal cell carcinoma treated with sunitinib? Cancer Res
Treat. Mar 5–2015. View Article : Google Scholar : (Epub ahead of
print).
|
|
4
|
van der Mijn JC, Mier JW, Broxterman HJ
and Verheul HM: Predictive biomarkers in renal cell cancer:
Insights in drug resistance mechanisms. Drug Resist Updat.
17:77–88. 2014. View Article : Google Scholar : PubMed/NCBI
|
|
5
|
Nyhan MJ, O'Sullivan GC and McKenna SL:
Role of the VHL (von Hippel-Lindau) gene in renal cancer: A
multifunctional tumour suppressor. Biochem Soc Trans. 36:472–478.
2008. View Article : Google Scholar : PubMed/NCBI
|
|
6
|
Haroun RA, Zakhary NI, Mohamed MR,
Abdelrahman AM, Kandil EI and Shalaby KA: Assessment of the
prognostic value of methylation status and expression levels of
FHIT, GSTP1 and p16 in non-small cell lung cancer in Egyptian
patients. Asian Pac J Cancer Prev. 15:4281–4287. 2014. View Article : Google Scholar : PubMed/NCBI
|
|
7
|
Daniunaite K, Jarmalaite S, Kalinauskaite
N, Petroska D, Laurinavicius A, Lazutka JR and Jankevicius F:
Prognostic value of RASSF1 promoter methylation in prostate cancer.
J Urol. 192:1849–1855. 2014. View Article : Google Scholar : PubMed/NCBI
|
|
8
|
Chan JJ and Katan M: PLCɛ and the RASSF
family in tumour suppression and other functions. Adv Biol Regul.
53:258–279. 2013. View Article : Google Scholar : PubMed/NCBI
|
|
9
|
Wojdacz TK and Dobrovic A:
Methylation-sensitive high resolution melting (MS-HRM): A new
approach for sensitive and high-throughput assessment of
methylation. Nucleic Acids Res. 35:e412007. View Article : Google Scholar : PubMed/NCBI
|
|
10
|
Wierzbicki PM, Klacz J, Rybarczyk A,
Slebioda T, Stanislawowski M, Wronska A, Kowalczyk A, Matuszewski M
and Kmiec Z: Identification of a suitable qPCR reference gene in
metastatic clear cell renal cell carcinoma. Tumour Biol.
35:12473–12487. 2014. View Article : Google Scholar : PubMed/NCBI
|
|
11
|
Mikeska T, Candiloro IL and Dobrovic A:
The implications of heterogeneous DNA methylation for the accurate
quantification of methylation. Epigenomics. 2:561–573. 2010.
View Article : Google Scholar : PubMed/NCBI
|
|
12
|
Avădănei ER, Wierzbicki PM, Giuşcă SE,
Grigoraş A, Amălinei C and Căruntu ID: Macrophage profile in
primary versus secondary liver tumors. Folia Histochem Cytobiol.
52:112–123. 2014. View Article : Google Scholar
|
|
13
|
van der Weyden L and Adams DJ: The
Ras-association domain family (RASSF) members and their role in
human tumourigenesis. Biochim Biophys Acta. 1776:58–85.
2007.PubMed/NCBI
|
|
14
|
Wierzbicki PM and Rybarczyk A: The Hippo
pathway in colorectal cancer. Folia Histochem Cytobiol. 53:105–119.
2015. View Article : Google Scholar : PubMed/NCBI
|
|
15
|
Fu LJ and Zhang SL: Expression of RASSF1A
in epithelial ovarian cancers. Eur Rev Med Pharmacol Sci.
19:813–817. 2015.PubMed/NCBI
|
|
16
|
Pastuszak-Lewandoska D, Kordiak J,
Migdalska-Sęk M, Czarnecka KH, Antczak A, Górski P, Nawrot E,
Kiszałkiewicz JM, Domańska D and Brzeziańska-Lasota E: Quantitative
analysis of mRNA expression levels and DNA methylation profiles of
three neighboring genes: FUS1, NPRL2/G21 and RASSF1A in non-small
cell lung cancer patients. Respir Res. 16:762015. View Article : Google Scholar : PubMed/NCBI
|
|
17
|
Reeves ME, Firek M, Chen ST and Amaar Y:
The RASSF1 gene and the opposing effects of the RASSF1A and RASSF1C
isoforms on cell proliferation and apoptosis. Mol Biol Int.
2013:1450962013. View Article : Google Scholar : PubMed/NCBI
|
|
18
|
Guo W, Cui L, Wang C, Guo Y, Shen S, Kuang
G and Dong Z: Decreased expression of RASSF1A and up-regulation of
RASSF1C is associated with esophageal squamous cell carcinoma. Clin
Exp Metastasis. 31:521–533. 2014. View Article : Google Scholar : PubMed/NCBI
|
|
19
|
Peters I, Rehmet K, Wilke N, Kuczyk MA,
Hennenlotter J, Eilers T, Machtens S, Jonas U and Serth J: RASSF1A
promoter methylation and expression analysis in normal and
neoplastic kidney indicates a role in early tumorigenesis. Mol
Cancer. 6:492007. View Article : Google Scholar : PubMed/NCBI
|
|
20
|
Cooper CS, Eeles R, Wedge DC, Van Loo P,
Gundem G, Alexandrov LB, Kremeyer B, Butler A, Lynch AG, Camacho N,
et al: Analysis of the genetic phylogeny of multifocal prostate
cancer identifies multiple independent clonal expansions in
neoplastic and morphologically normal prostate tissue. Nat Genet.
47:367–372. 2015. View Article : Google Scholar : PubMed/NCBI
|
|
21
|
Yu GS, Lai CY, Xu Y, Bu CF and Su ZX:
Aberrant methylation of RASSF1A gene contribute to the risk of
renal cell carcinoma: A meta-analysis. Asian Pac J Cancer Prev.
16:4665–4669. 2015.PubMed/NCBI
|
|
22
|
de Martino M, Klatte T, Haitel A and
Marberger M: Serum cell-free DNA in renal cell carcinoma: A
diagnostic and prognostic marker. Cancer. 118:82–90. 2012.
View Article : Google Scholar
|
|
23
|
Onay H, Pehlivan S, Koyuncuoglu M, Kirkali
Z and Ozkinay F: Multigene methylation analysis of conventional
renal cell carcinoma. Urol Int. 83:107–112. 2009. View Article : Google Scholar : PubMed/NCBI
|
|
24
|
Kawai Y, Sakano S, Suehiro Y, Okada T,
Korenaga Y, Hara T, Naito K, Matsuyama H and Hinoda Y: Methylation
level of the RASSF1A promoter is an independent prognostic factor
for clear-cell renal cell carcinoma. Ann Oncol. 21:1612–1617. 2010.
View Article : Google Scholar
|
|
25
|
Hagrass HA, Pasha HF, Shaheen MA, Abdel
Bary EH and Kassem R: Methylation status and protein expression of
RASSF1A in breast cancer patients. Mol Biol Rep. 41:57–65. 2014.
View Article : Google Scholar
|
|
26
|
Nawaz I, Qiu X, Wu H, Li Y, Fan Y, Hu LF,
Zhou Q and Ernberg I: Development of a multiplex methylation
specific PCR suitable for (early) detection of non-small cell lung
cancer. Epigenetics. 9:1138–1148. 2014. View Article : Google Scholar : PubMed/NCBI
|
|
27
|
Malpeli G, Amato E, Dandrea M, Fumagalli
C, Debattisti V, Boninsegna L, Pelosi G, Falconi M and Scarpa A:
Methylation-associated down-regulation of RASSF1A and up-regulation
of RASSF1C in pancreatic endocrine tumors. BMC Cancer. 11:3512011.
View Article : Google Scholar : PubMed/NCBI
|
|
28
|
Wang HL, Zhang Y, Liu P and Zhou PY:
Aberrant promoter methylation of RASSF1A gene may be correlated
with colorectal carcinogenesis: A meta-analysis. Mol Biol Rep.
41:3991–3999. 2014. View Article : Google Scholar : PubMed/NCBI
|
|
29
|
Kristensen VN, Lingjærde OC, Russnes HG,
Vollan HK, Frigessi A and Børresen-Dale AL: Principles and methods
of integrative genomic analyses in cancer. Nat Rev Cancer.
14:299–313. 2014. View Article : Google Scholar : PubMed/NCBI
|
|
30
|
Joo MK, Kim KH, Park JJ, Yoo HS, Choe J,
Kim HJ, Lee BJ, Kim JS and Bak YT: CpG island promoter
hypermethylation of Ras association domain family 1A gene
contributes to gastric carcinogenesis. Mol Med Rep. 11:3039–3046.
2015.
|
|
31
|
Hu J, Li H, Shi T, Ma X, Wang B, Xu H, Ai
X, Ju Z, Wang C, Zhang G, et al: Relationship between the
expression of RASSF1A protein and promoter hypermethylation of
RASSF1A gene in bladder tumor. J Huazhong Univ Sci Technolog Med
Sci. 28:182–184. 2008. View Article : Google Scholar : PubMed/NCBI
|
|
32
|
Tezval H, Merseburger AS, Matuschek I,
Machtens S, Kuczyk MA and Serth J: RASSF1A protein expression and
correlation with clinicopathological parameters in renal cell
carcinoma. BMC Urol. 8:122008. View Article : Google Scholar : PubMed/NCBI
|
|
33
|
Reeves ME, Baldwin SW, Baldwin ML, Chen
ST, Moretz JM, Aragon RJ, Li X, Strong DD, Mohan S and Amaar YG:
Ras-association domain family 1C protein promotes breast cancer
cell migration and attenuates apoptosis. BMC Cancer. 10:5622010.
View Article : Google Scholar : PubMed/NCBI
|