Introduction
Recent studies have demonstrated that some cancer
stem cells (CSC) remain in a mitotically quiescent state, which
enhances their chemoresistance and results in a more invasive and
aggressive phenotype (1,2). The p75 neurotrophin receptor (p75NTR)
is expressed in the quiescent basal layer of the esophageal
epithelium (3,4), and in esophageal squamous cell
carcinoma (ESCC). It is also expressed in populations of cells that
exhibit enhanced colony-forming abilities and xenograft
tumorigenicity (5,6). CD44 (7) and CD90 (8) have also been reported to be markers
of populations of esophageal CSC that display enhanced xenograft
tumorigenicity and/or metastatic potential. However, none of these
studies investigated the mitotic status of the examined CSC
populations. The aim of this study was to develop a method for
identifying mitotically quiescent CSC in ESCC based on their
p75NTR, CD44 and CD90 expression patterns.
Materials and methods
Tissue microarray
A total of 56 tumor specimens from ESCC patients who
had undergone surgery at our hospital from 1990 to 2008 were
analyzed using a tissue microarray, as described previously
(9). All of the patients underwent
R0 resections, and none of them died in hospital. The median
follow-up time was 29 months. The subjects included 50 male and 6
female patients, and their mean age was 62.8 years. The patients'
TNM stages (ver. 6) were as follows: stage I, 6 patients; stage
IIA, 15 patients; stage IIB, 5 patients; stage III, 24 patients;
and stage IV, 6 patients. All of the M1 cases involved only distant
lymph node metastases, which were surgically removed. Thirty-six
patients underwent postoperative cisplatin-based chemotherapy. The
institutional review board at the University of Toyama approved
this study (#20-57).
Immunohistochemistry
The antibodies used for the immunohistochemical
staining were as follows: anti-Ki-67 antibody (dilution 1:100),
anti-cytokeratin Oscar in vitro diagnostic antibody
(dilution 1:200; Abcam Ltd., Cambridge, UK), anti-human CD44
monoclonal antibody (156-3C11; dilution 1:400; Cell Signaling
Technology, Beverly, MA, USA), anti-human CD90 monoclonal antibody
(EPR3132; dilution 1:100), and human p75NTR monoclonal antibody
against p75NGER (NGER5; dilution 1:100) (both from Abcam). The
immunostaining was performed using Envision Plus kits, horseradish
peroxidase, or 3,3′-diaminobenzidine (DAB; Dako Cytomation, Kyoto,
Japan) as recommended by the supplier. Counterstaining was
performed with Mayer's hematoxylin.
The numbers of p75NTR-, CD44- or CD90-positive cells
and all tumor cells were counted in three random fields of each
section. Then, the proportions of each cell type in each tumor were
calculated. We classified tumors as positive when >5% of the
tumor cells were stained.
Double staining of Ki-67 (brown)/p75NTR (red) or
Ki-67 (brown)/CD44 (red) was performed using Bond III automated
immunostainers (Leica Biosystems). The Ki-67 labeling index was
defined as the number of tumor cells that exhibited positive
nuclear immunostaining divided by the total number of tumor
cells.
Human esophageal cancer cell lines and
culture conditions
Human ESCC cell lines (KYSE-30, KYSE-140, KYSE-150,
KYSE-220, KYSE-510, KYSE-520 and KYSE-790) were established by
Shimada et al and cultured in Ham's F12/Roswell Park
Memorial Institute (RPMI)-1640 medium (Wako, Osaka, Japan)
supplemented with 2% fetal calf serum (FCS) (Gibco, Grad Island,
NY, USA), according to a previously reported method (10).
Analysis of cancer stem cell surface
antigens and cell sorting
The surface antigen markers of the samples were
analyzed using a FACSCant II flow cytometer and were sorted using a
FACSAria II cell sorter and BD FACSDiva software (both from BD
Biosciences, San Jose, CA, USA). Fluorescein isothiocyanate (FITC)
or allophycocyanin (APC)-conjugated monoclonal mouse anti-human
CD44 (clone BD105) and p75NTR (clone ME20.4-1.H4) antibodies were
purchased from Miltenyi Biotec (Bergisch Gladbach, Germany).
FITC-conjugated monoclonal mouse anti-human CD90 (clone 5E-10)
antibodies were obtained from BD Biosciences. FITC-conjugated
antibodies were used to detect CSC surface markers. Isotype-matched
APC- or FITC-conjugated antibodies (Miltenyi Biotec) were used as
controls. Cultured cells were washed once with phosphate-buffered
saline (PBS) (−), before being dissociated from the culture plates
using 0.25% trypsin-ethylenediaminetetraacetic acid (Invitrogen,
Carlsbad, CA, USA) and centrifuged. Single cells were resuspended
in PBS (−) containing 2% FBS, and then the FITC-conjugated antibody
or the isotype control antibody was added, before the cells were
incubated at 4°C for 30 min. After being washed twice with PBS (−)
containing 2% FBS, the cells were resuspended in PBS (−) containing
2% FBS. The cells were also stained with 7-aminoactinomycin D
(7-AAD; Bio-Rad Laboratories, Richmond, CA, USA) to exclude dead
cells. The samples were analyzed and sorted using a flow cytometer.
We classified cell lines as positive when >1% of their cells
were stained.
The KYSE-30 cells were sorted into
p75NTR-positive/CD44-negative, p75NTR-negative/CD44-positive, and
p75NTR-negative/CD44-negative fractions. The KYSE-140 cells were
sorted into p75NTR-positive/CD90-positive,
p75NTR-positive/CD90-negative, p75NTR-negative/CD90-positive and
p75NTR-negative/CD90-negative fractions.
RNA extraction, cDNA synthesis and
real-time PCR
Total RNA was extracted using the TRIzol reagent
(Invitrogen, Carlsbad, CA, USA). cDNA was synthesized using the
PrimeScript First Strand cDNA synthesis kit (Takara Inc., Kyoto,
Japan) and used for the quantitative polymerase chain reaction
(qPCR) analysis. The cDNA samples were amplified in an Mx3000P
real-time qPCR system (Agilent Technologies, Santa Clara, CA, USA)
using SYBR Premix Ex Taq II (Takara Inc.), as described previously
(11). Each mRNA expression level
was normalized to that of the reference gene GAPDH. The primer
sequences are shown in Table I.
The expression level of each mRNA molecule was evaluated using the
ΔΔCt method.
 | Table IPolymerase chain reaction primer
sequences. |
Table I
Polymerase chain reaction primer
sequences.
| Gene product | Forward and reverse
primers (5′-3′) | Size (bp) |
|---|
| Nanog | F:
ATGCCTCACACGGAGACTGT
R: AAGTGGGTTGTTTGCCTTTG | 83 |
| p63 | F:
CAGACTTGCCAGATCATCC
R: CAGCATTGTCAGTTTCTTAGC | 220 |
| Bmi-1 | F:
CCACCTGATGTGTGTGCTTTG
R: TTCAGTAGTGGTCTGGTCTTGT | 162 |
| Involucrin | F:
TGTTCCTCCTCCAGTCAATACCC
R: ATTCCTCATGCTGTTCCCAGTGC | 227 |
| E-cadherin | F:
GTCTGTCATGGAAGGTGCT
R: TACGACGTTAGCCTCGTTC | 370 |
| N-cadherin | F:
AGCCAACCTTAACTGAGGAGT
R: GGCAAGTTGATTGGAGGGATG | 136 |
| Fibronectin | F:
AGGAAGCCGAGGTTTTAACTG
R: AGGACGCTCATAAGTGTCACC | 106 |
| DPD | F:
TCAAGCACACGACTCTTGGTG
R: CATACCATTCCACAAGTCAGACC | 205 |
| ERCC-1 | F:
GCCTCCGCTACCACAACCT
R: TCTTCTCTTGATGCGGCGA | 313 |
| GAPDH | F:
ACCACAGTCCATGCCATCAC
R: TCCACCACCCTGTTGCTGTA | 452 |
Cell cycle analysis
The cell cycle analysis was performed using the
CycleTest Plus DNA reagent kit (Becton-Dickinson Inc., San Jose,
CA, USA) as recommended by the supplier and a FACSCant II, and the
resultant data were analyzed with the software FCS4 Express
Cytometry (Becton-Dickinson Inc.).
Anticancer drug resistance assay
Each cell population was cultured in Dulbecco's
modified Eagle's medium/Ham's F-12 containing 5% FCS at a density
of 3,200 cells/well in a 96-well plate (Thermo Scientific,
Yokohama, Japan) under a humidified atmosphere of 5% CO2
at 37°C. After being allowed to adhere overnight, the cells were
treated with various concentrations of cisplatin (Wako, Osaka,
Japan) or were left untreated (control). The medium in each well
was changed at 2 days after the initial treatment. Cell viability
was determined at 3 days after the initial treatment using the
standard 3-(4,5-dimethylthiazol-2-yl)-2,5-diphenyltetrazolium
bromide (MTT) assay (Trevigen, Gaithersburg, MD, USA) in accordance
with the manufacturer's instructions, and the optical absorbance of
the supernatant in each well at a wavelength of 595 nm was measured
using a FilterMax F5 plate reader (Molecular Devices, Tokyo,
Japan). Cell viability was defined as the relative absorbance of
the control cells versus that of the treated cells. All experiments
were performed in triplicate.
Colony formation assay
After being sorted with a FACSAria II, 1,000 cells
from each KYSE-30 or KYSE-140 subset were plated in 60-mm tissue
culture dishes (Thermo Scientific). After the cells had been
cultured for 14 days, any colonies were stained with crystal violet
(0.5% crystal violet dissolved in 20% methanol). The numbers of
colonies of >3 mm in diameter were counted.
Tumorigenicity assay in nude mice or
NOD/SCID mice
This part of the study protocol was approved by and
conducted in accordance with the Committee of the Use of Live
Animals in Teaching and Research at the University of Toyama.
Five-to 6-week-old mice were used for the tumorigenicity assay;
athymic nude mice (BALB/CAN. Cg-Foxnlnu/CrCrlj) were
used for the experiments involving KYSE-30 cells and NOD/SCID mice
(NOD. CB17-Prdkcscid/J) were used for those involving
KYSE-140 cells. All mice were purchased from Charles River
Laboratories (Yokohama, Japan). After being sorted, 1,000 to 30,000
KYSE cells were subcutaneously injected into the bilateral lumbar
regions of the mice. After 4 weeks, the mice were sacrificed, and
their subcutaneous tumors were fixed with 10% buffered formalin and
embedded in paraffin, before being subjected to immunohistochemical
staining.
In animals that were injected with cancer cells, but
did not exhibit any signs of a tumor burden, the injection sites
were opened up to confirm that no tumor had developed.
Statistical analysis
Statistical analyses were performed using JMP v.11
(SAS Institute Inc., Cary, NC, USA). The Chi-square test and
Fisher's exact test were used for the statistical analyses, and
p-values of <0.05 were considered to be statistically
significant.
Results
Expression of p75NTR, CD44 and CD90 in
the ESCC specimens
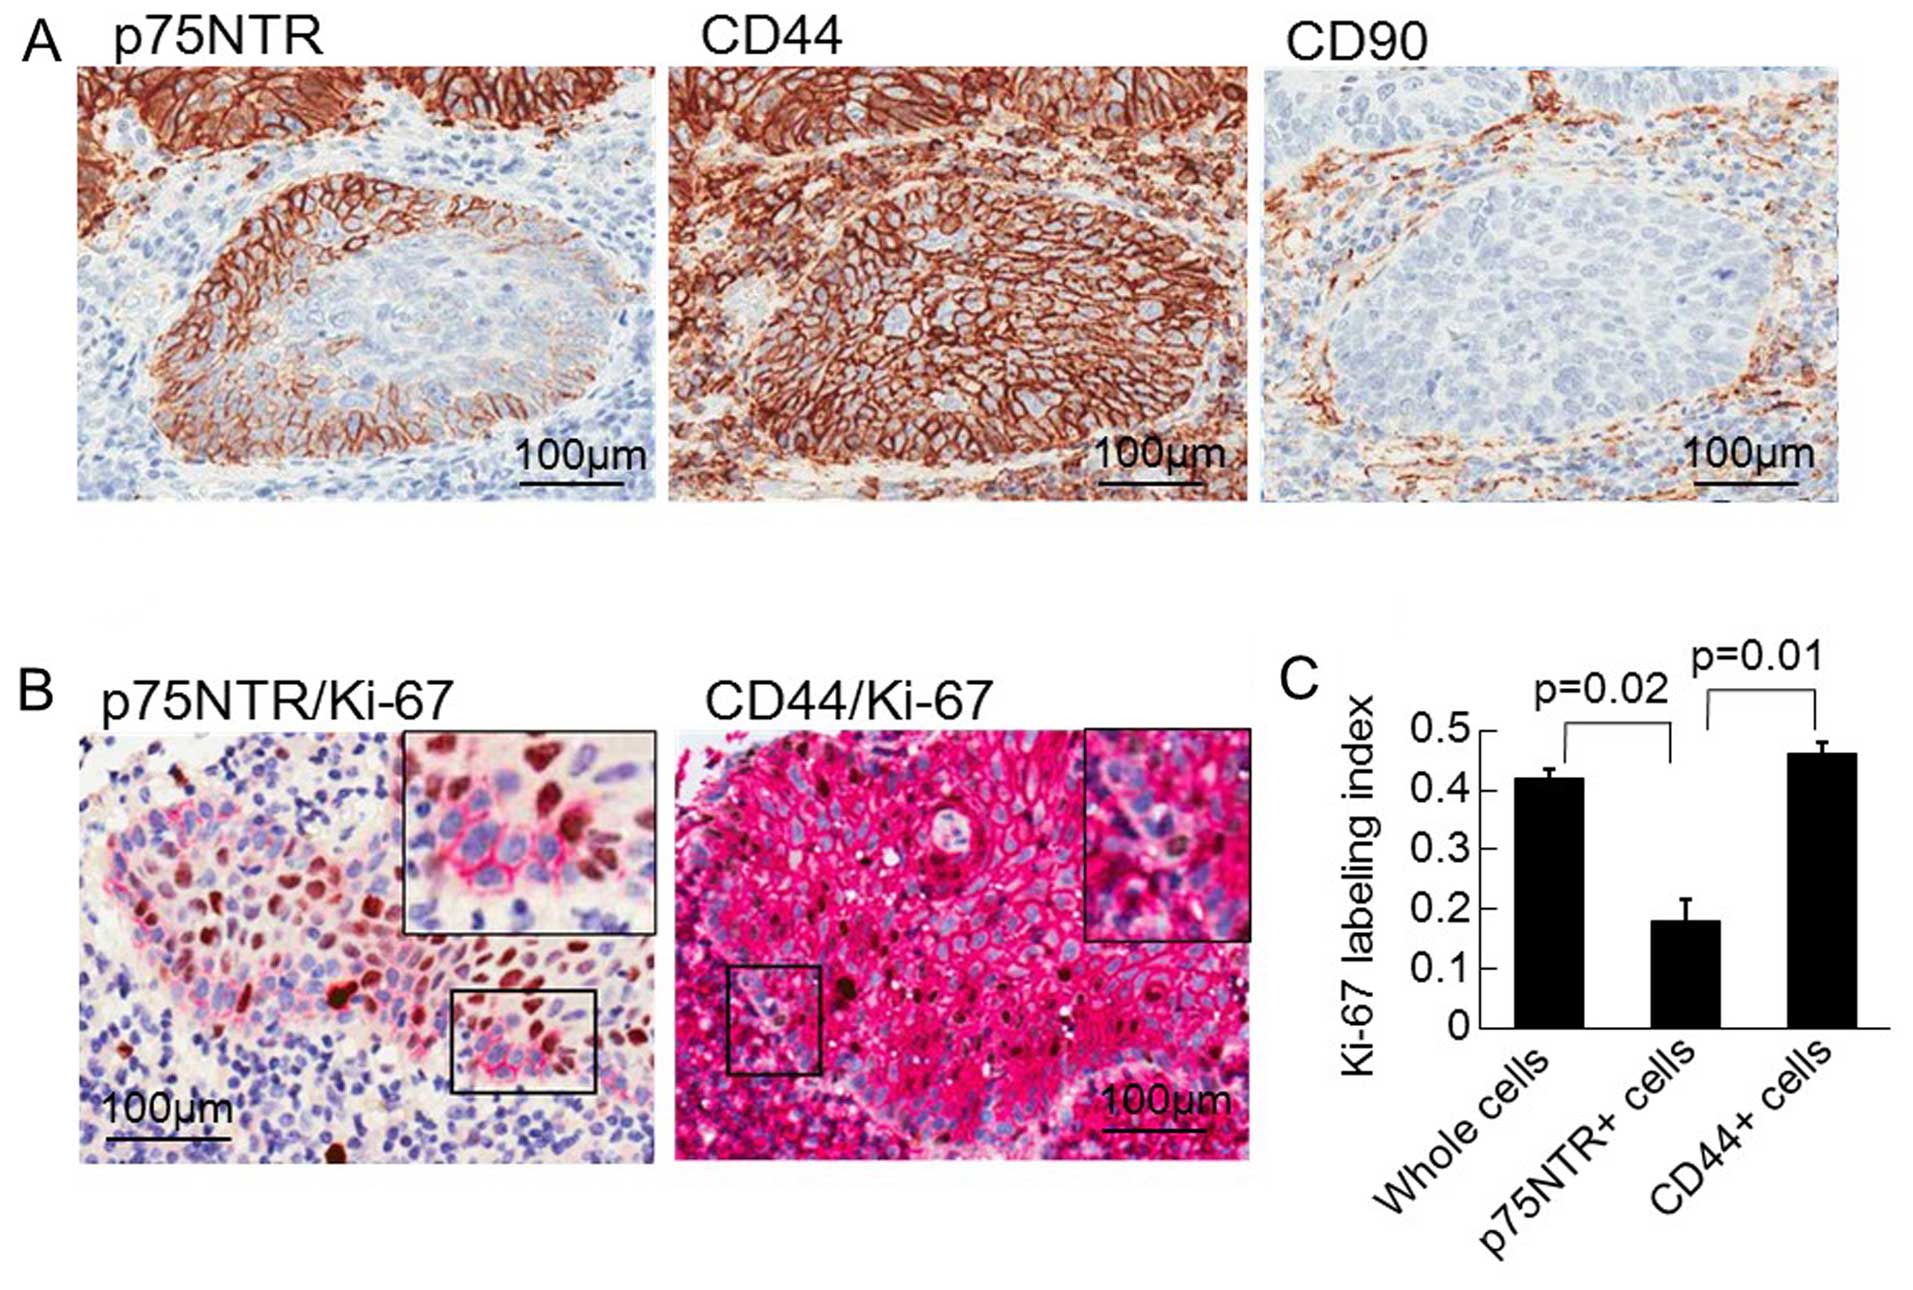
We first assessed the expression of p75NTR, CD44 and
CD90 in 56 primary ESCC tumors by immunohistologically staining the
tumors using a tissue microarray (Fig.
1A). p75NTR was expressed in 19 of the 56 (33.9%) tumors, in
which the first few layers nearest to the tumor's infiltrative
margin exhibited positive staining. CD44 was expressed in 31 of the
56 (55.4%) tumors and demonstrated a diffuse distribution. On the
other hand, CD90 was not expressed in any of the 56 ESCC tumors
despite the fact that it was detected in hepatocellular carcinoma
tissue using the same procedure (data not shown). p75NTR expression
was not correlated with any of the examined clinicopathological
factors, such as gender, age, tumor site, or pTNM stage (Table II), while CD44 expression was
correlated with the depth of invasion and lymph node metastasis
(Table II). Both p75NTR and CD44
were expressed in 12 of 56 (21.4%) cases, although only some of the
diffusely distributed CD44-positive cells were p75NTR-positive. The
expression of p75NTR or CD44 alone was observed in 7 of the 56
(12.5%) and 19 of the 56 (33.9%) cases, respectively. Neither
p75NTR nor CD44 was detected in 13 of the 56 (23.2%) cases.
| Table IIRelationship between the expression
of CSC markers (p75NTR, CD44 and CD90) in resected ESCC specimens
and thge patient clinicopathological characteristics. |
Table II
Relationship between the expression
of CSC markers (p75NTR, CD44 and CD90) in resected ESCC specimens
and thge patient clinicopathological characteristics.
| p75NTR | CD44 | CD90 |
|---|
|
|
|
|
|---|
| Positive | Negative | p-value | Positive | Negative | p-value | Positive | Negative | p-value |
|---|
| Gender |
| Male | 17 | 33 | | 29 | 21 | | 0 | 50 | |
| Female | 2 | 4 | 0.974 | 2 | 4 | 0.251 | 0 | 6 | - |
| Age (years) |
| ≥65 | 9 | 18 | | 14 | 13 | | 0 | 29 | |
| <65 | 10 | 19 | 0.928 | 17 | 12 | 0.611 | 0 | 27 | - |
| Site |
| Ce-Ut | 3 | 5 | | 3 | 5 | | 0 | 8 | |
| Mt-Ae | 16 | 32 | 0.818 | 28 | 20 | 0.276 | 0 | 48 | - |
| pT |
| T1-T2 | 9 | 11 | | 7 | 13 | | 0 | 20 | |
| T3-T4 | 10 | 26 | 0.192 | 24 | 12 | *0.022 | 0 | 36 | - |
| pN |
| N0 | 11 | 14 | | 10 | 15 | | 0 | 25 | |
| N1-3 | 8 | 22 | 0.178 | 20 | 10 | *0.048 | 0 | 30 | - |
|
Differentiation |
| Well-mod | 12 | 27 | | 22 | 17 | | 0 | 39 | |
| Poor | 3 | 6 | 0.881 | 6 | 3 | 0.574 | 0 | 9 | - |
An analysis of the Ki-67 labeling index based on
double immunostaining revealed that the majority of p75NTR-positive
cells were in the resting phase of the cell cycle, while most of
the CD44-positive cells were actively proliferating (Fig. 1B). The whole cells, the
p75NTR-positive cells, and the CD44-positive cells had mean Ki-67
labeling indices of 0.407, 0.155 and 0.446, respectively (Fig. 1C).
Expression of p75NTR, CD44 and CD90 in
ESCC cell lines
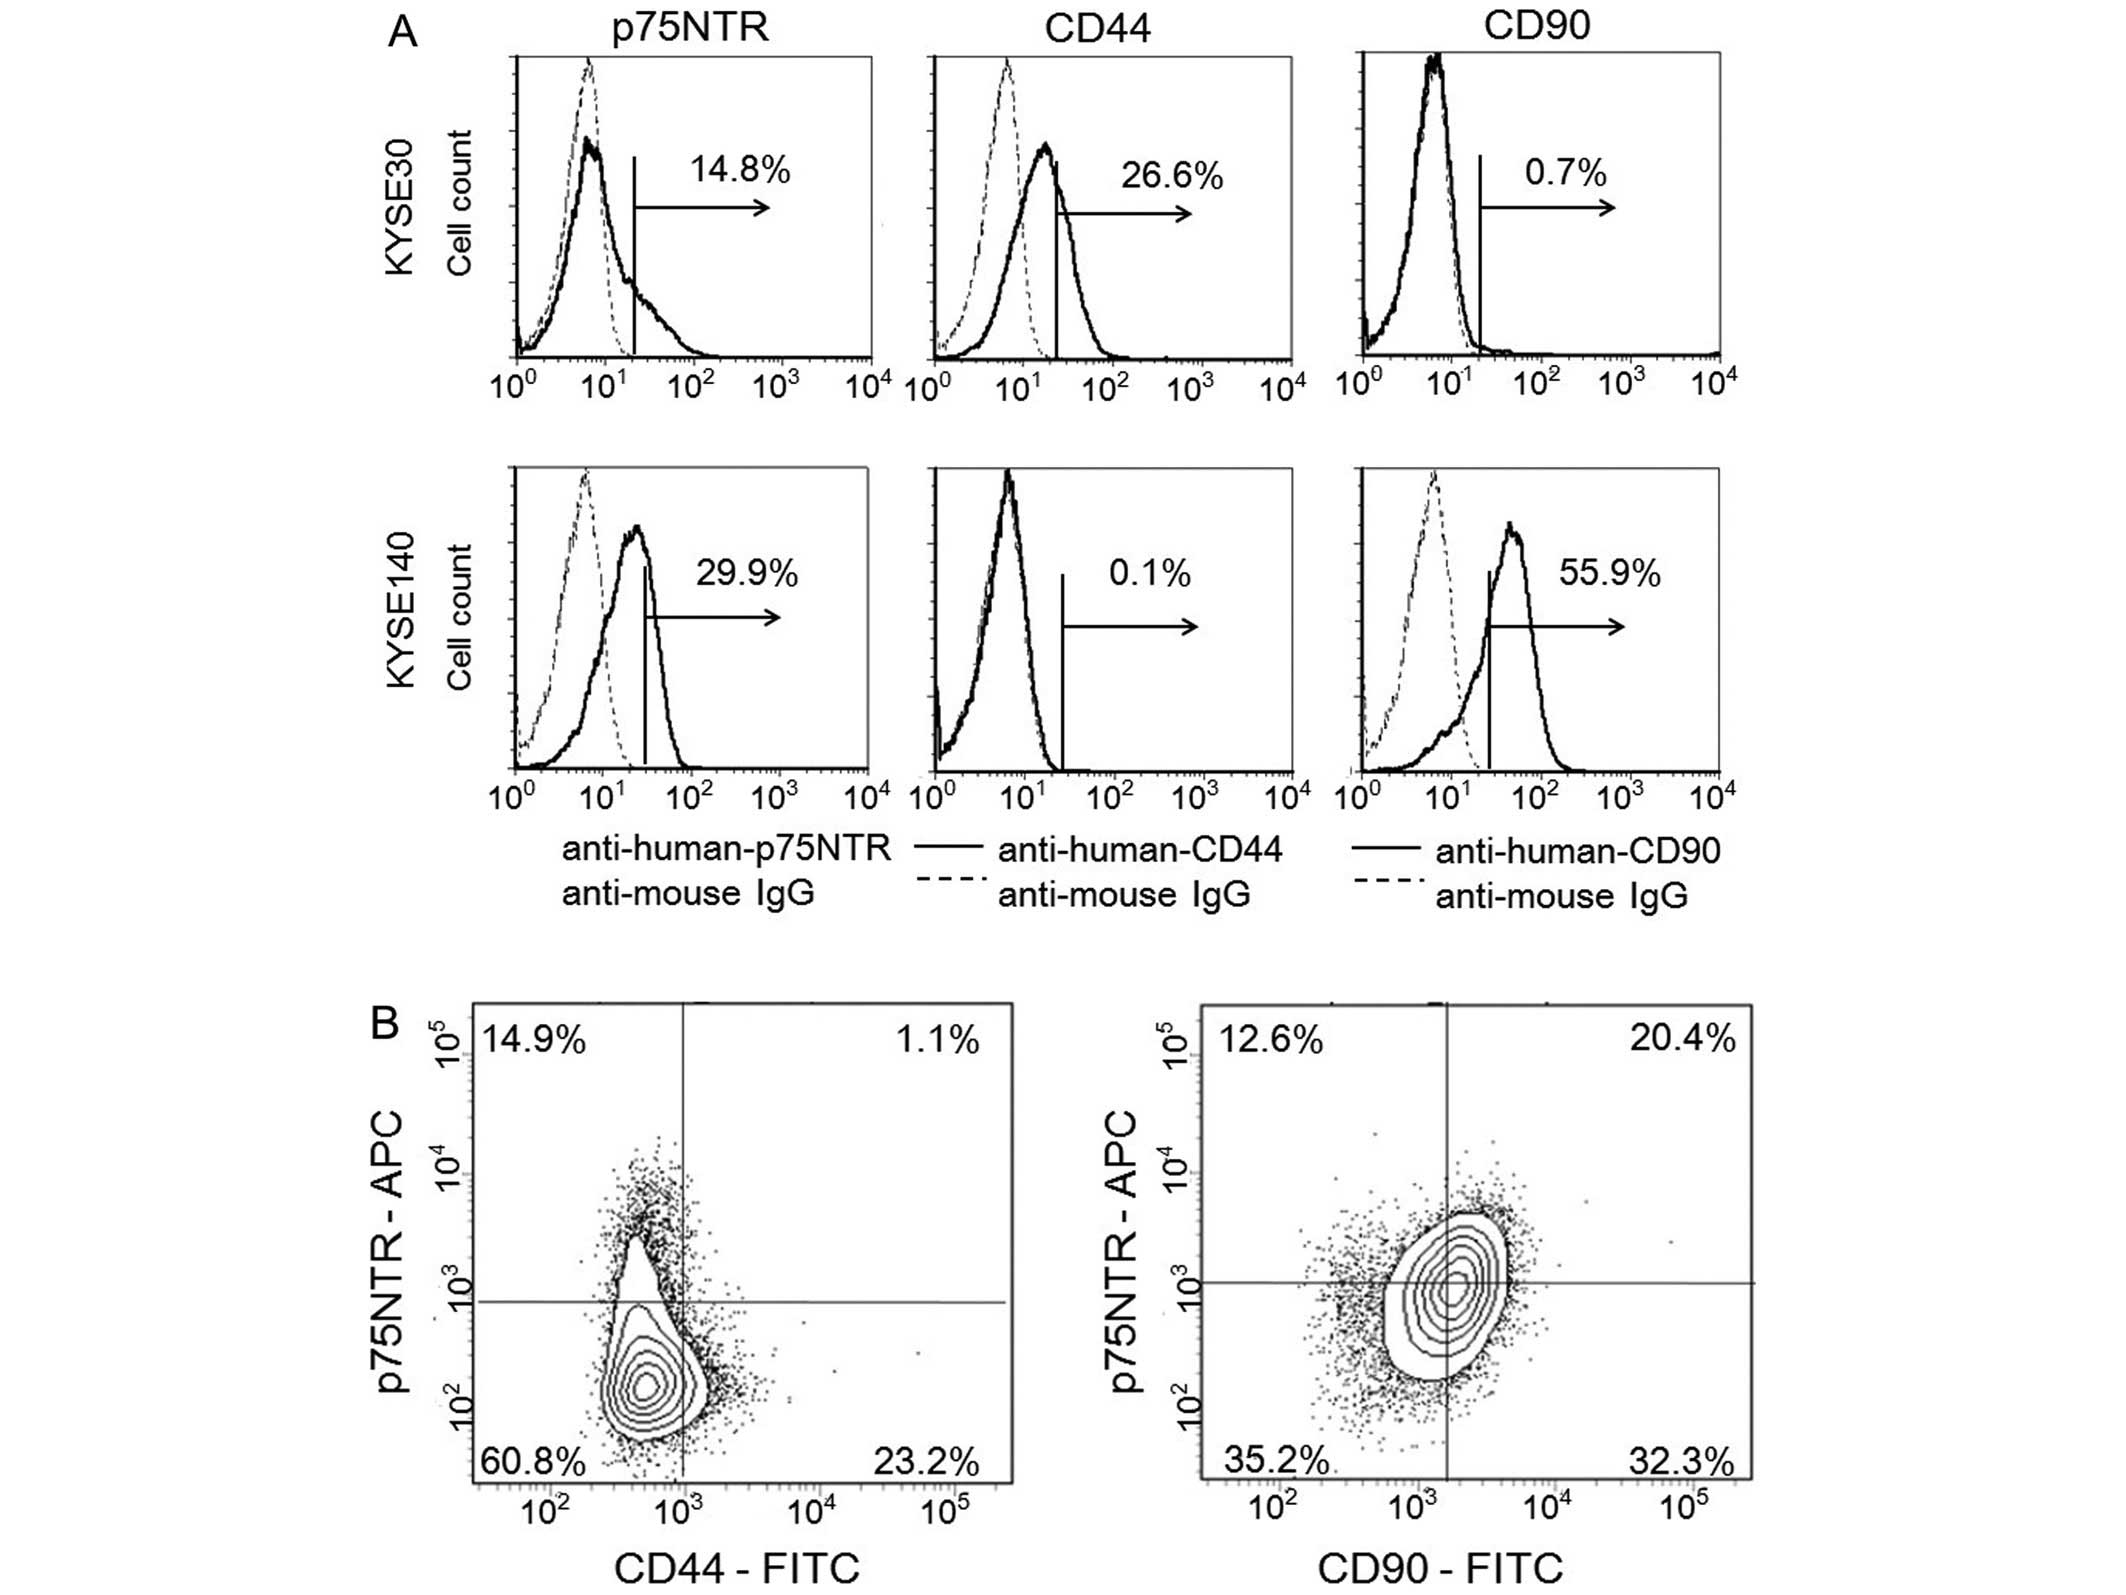
To identify cell subsets based on the combined
expression of CSC markers in ESCC, we examined the expression of
p75NTR, CD44 and CD90 in 10 ESCC cell lines (KYSE-30, KYSE-70,
KYSE-140, KYSE-150, KYSE-180, KYSE-220, KYSE-450, KYSE-510,
KYSE-520 and KYSE-790) using flow cytometry (Fig. 2A and Table III). p75NTR-positive cells were
detected in 6 of the 10 (60.0%) cell lines, in which the proportion
of positive cells ranged from 6.4 to 50.4%. CD44-positive cells
were detected in 9 of the 10 (90.0%) cell lines, in which the
proportion of positive cells ranged from 2.4 to 97.8%.
CD90-positive cells were detected in only 1 of the 10 (10.0%) cell
lines (positive proportion, 50.9%). p75NTR and CD44, or p75NTR and
CD90, were co-expressed in 5 and 1 of the 10 cell lines,
respectively (Table III).
Epithelial cell adhesion molecule was expressed in all of the
examined ESCC cell lines, in which the proportion of positive cells
ranged from 97.5 to 99.9% (data not shown). Based on the expression
patterns of p75NTR, CD44 and CD90 displayed by the 10 cell lines
(Table III), we selected KYSE-30
and KYSE-140 cells for the dual-color flow cytometric analysis.
Among the KYSE-30 cells, which expressed p75NTR and/or CD44,
p75NTR-positive/CD44-positive cells, p75NTR-positive/CD44-negative
cells, p75NTR-negative/CD44-positive cells and
p75NTR-negative/CD44-negative cells accounted for 1.1, 14.9, 23.2
and 60.8% of the cells, respectively (Fig. 2B).
| Table IIIThe percentage of cells expressing
CSC markers (p75NTR, CD44 and CD90) in 10 ESCC cell lines. |
Table III
The percentage of cells expressing
CSC markers (p75NTR, CD44 and CD90) in 10 ESCC cell lines.
| p75NTR (%) | CD44 (%) | CD90 (%) |
|---|
| KYSE-30 | 13.8 | 30.6 | - |
| KYSE-70 | - | 97.8 | - |
| KYSE-140 | 29.9 | - | 50.9 |
| KYSE-150 | 50.4 | 7.4 | - |
| KYSE-180 | - | 2.8 | - |
| KYSE-220 | 14.9 | 2.4 | - |
| KYSE-450 | - | 3.6 | - |
| KYSE-510 | 29.9 | 97.2 | - |
| KYSE-520 | - | 80.7 | - |
| KYSE-790 | 6.4 | 3.9 | - |
Among the KYSE-140 cells, which expressed p75NTR
and/or CD90, p75NTR-positive/CD90-positive cells,
p75NTR-positive/CD90-negative cells, p75NTR-negative/CD90-positive
cells and p75NTR-negative/CD90-negative cells accounted for 20.4,
12.6, 32.3 and 35.2% cells, respectively (Fig. 2B).
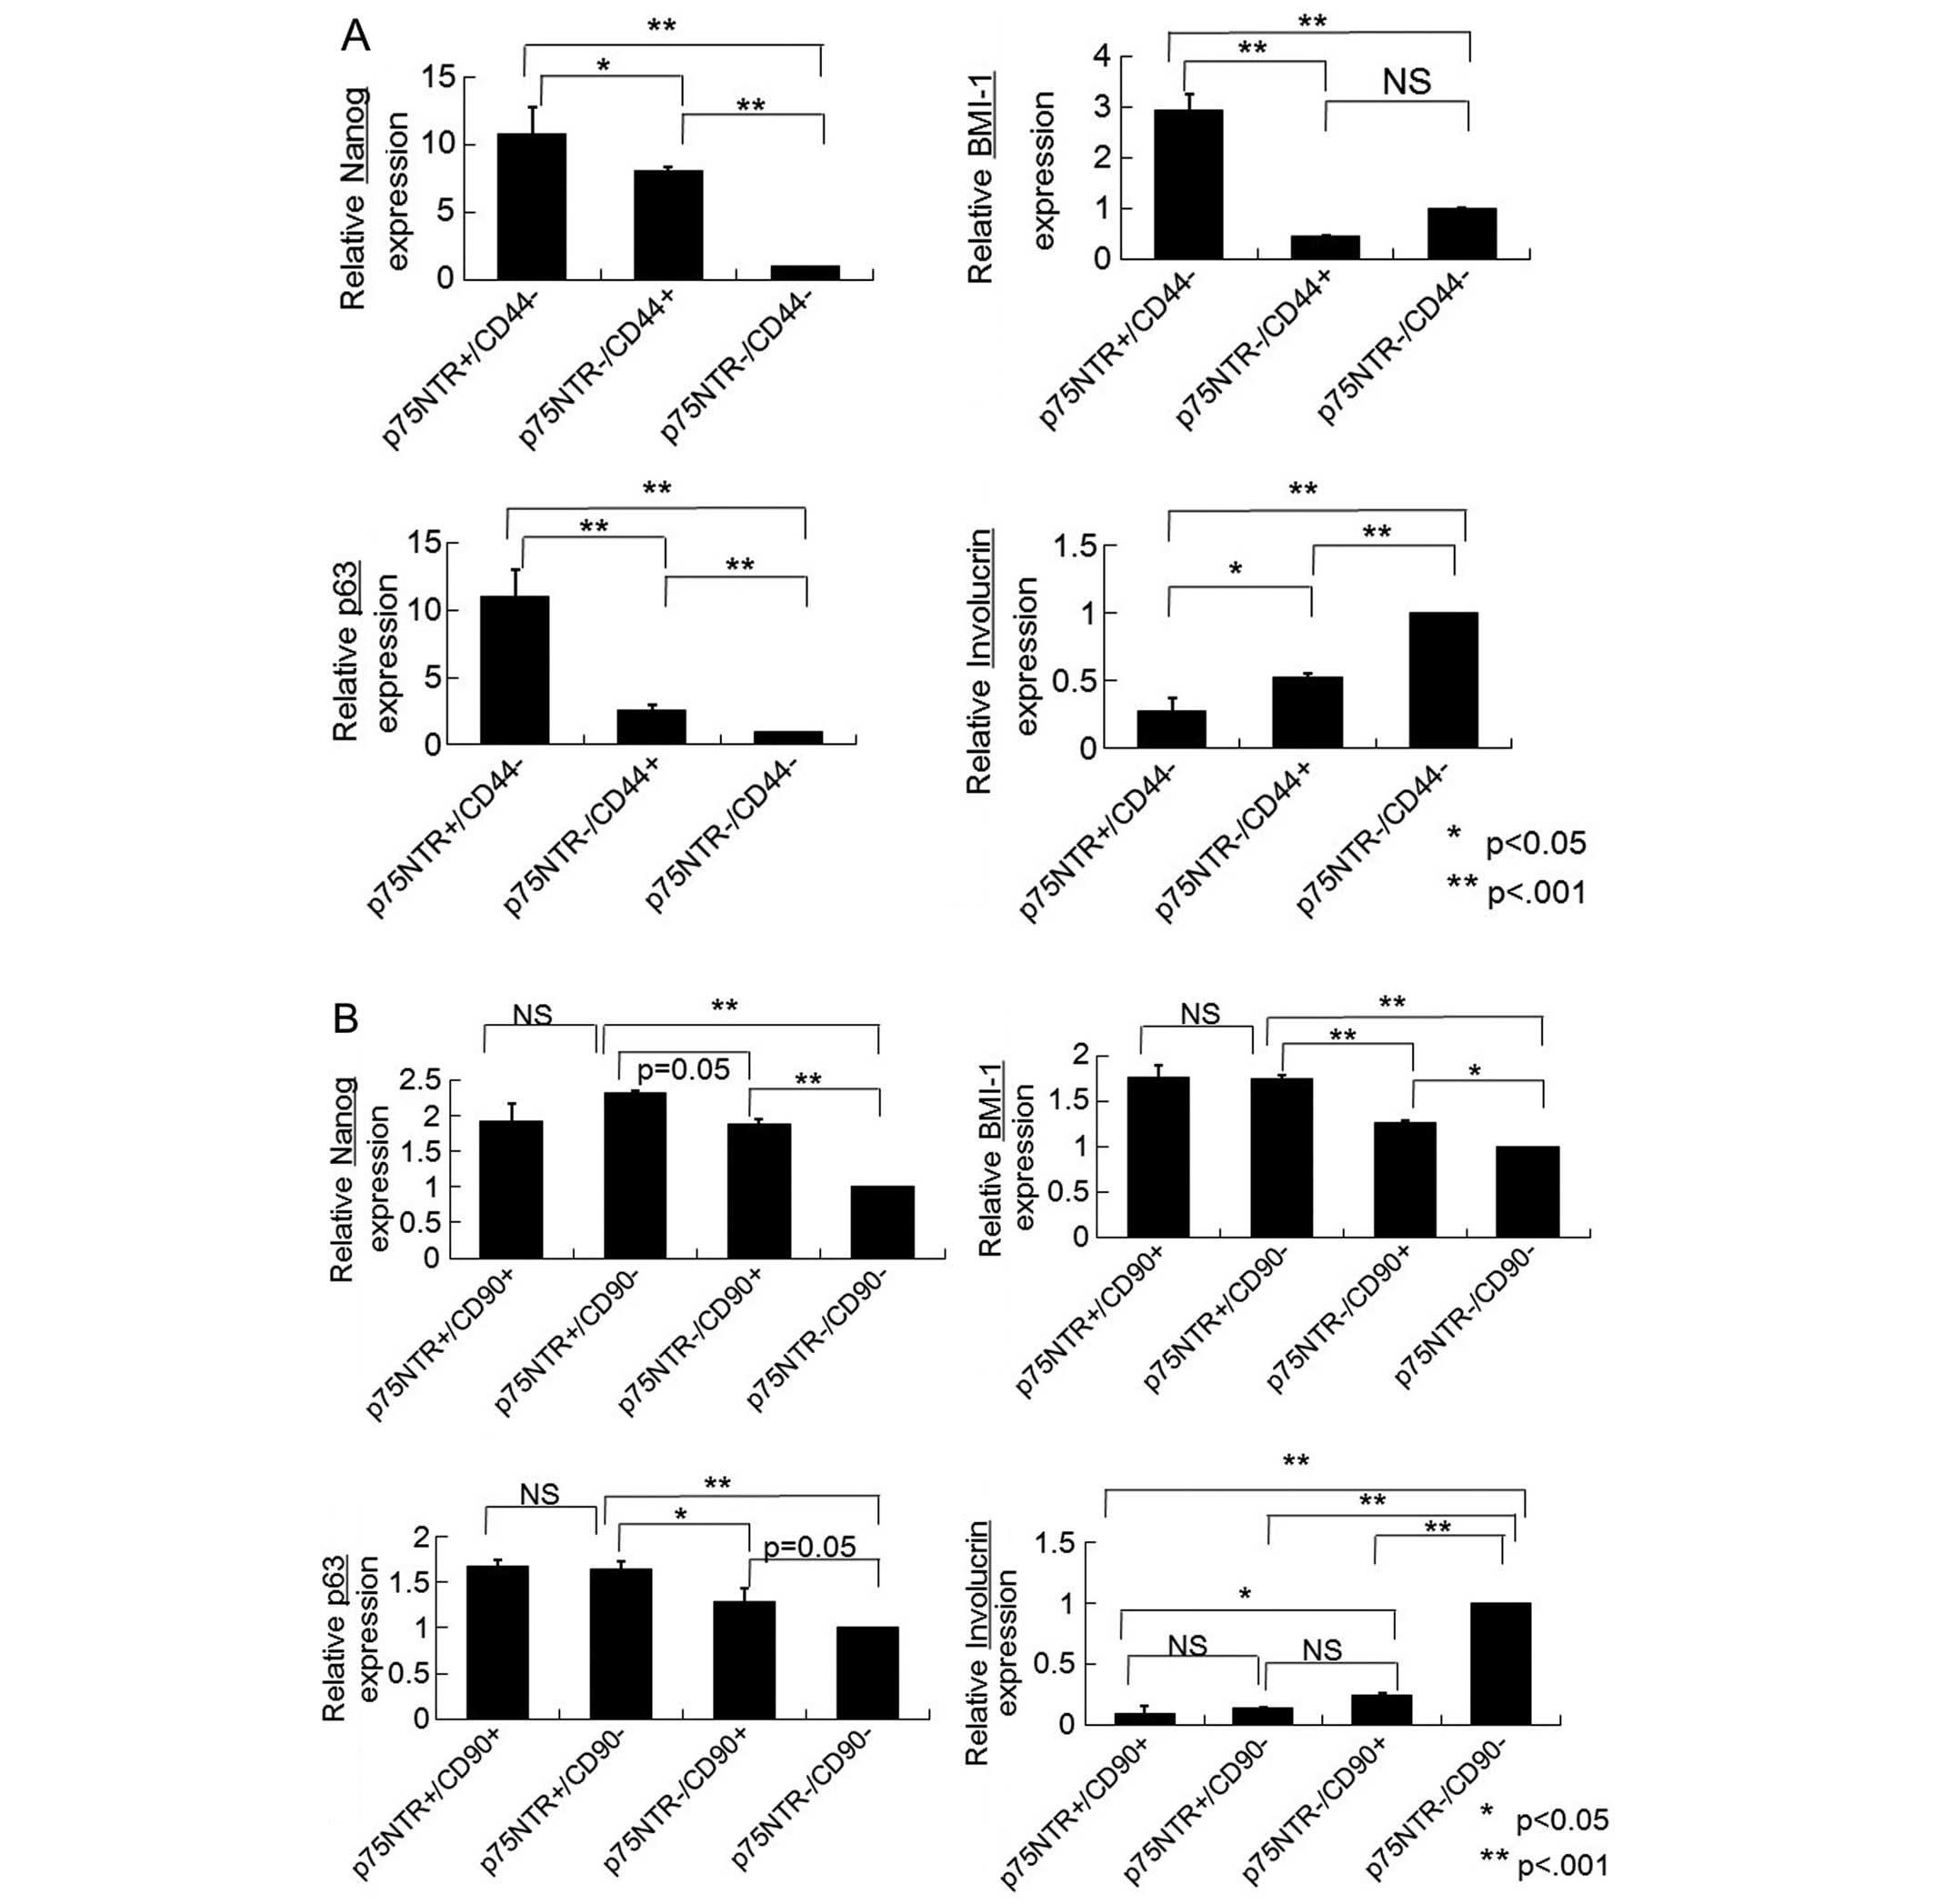
Expression of CSC-related genes in
fractionated cell subsets
We compared the expression patterns of stem cell-,
keratinocyte differentiation- and epithelial-mesenchymal transition
(EMT)-related genes in each fraction using real-time PCR. Among the
KYSE-30 cells, Nanog, p63 and Bmi-1 were expressed at significantly
higher levels in the p75NTR-positive/CD44-negative fraction than in
the p75NTR-negative/CD44-positive or p75NTR-negative/CD44-negative
fraction (Fig. 3A). In addition,
the expression of involucrin was significantly lower in the
p75NTR-positive/CD44-negative fraction than in the
p75NTR-negative/CD44-positive or p75NTR-negative/CD44-negative
fraction (Fig. 3A).
The p75NTR-positive/CD44-negative and
p75NTR-negative/CD44-positive fractions demonstrated significantly
lower E-cadherin expression than the p75NTR-negative/CD44-negative
fraction (Fig. 3C). In addition,
the p75NTR-positive/CD44-negative fraction displayed significantly
higher N-cadherin and fibronectin expression than the
p75NTR-negative/CD44-positive and p75NTR-negative/CD44-negative
fractions (Fig. 3C).
Among the KYSE-140 cells, Nanog, p63 and Bmi-1 were
expressed at significantly higher levels in the
p75NTR-positive/CD90-positive and p75NTR-positive/CD90-negative
fractions than in the p75NTR-negative/CD90-positive or
p75NTR-negative/CD90-negative fraction (Fig. 3B). The
p75NTR-negative/CD90-negative fraction exhibited significantly
higher involucrin expression than the other fractions (Fig. 3B). Significantly greater E-cadherin
expression was observed in the p75NTR-negative/CD90-negative
fraction than in the p75NTR-positive/CD90-positive,
p75NTR-positive/CD90-negative or p75NTR-negative/CD90-positive
fraction (Fig. 3D). The
p75NTR-positive/CD90-positive fraction exhibited significantly
higher N-cadherin and fibronectin expression than the other
fractions (Fig. 3D).
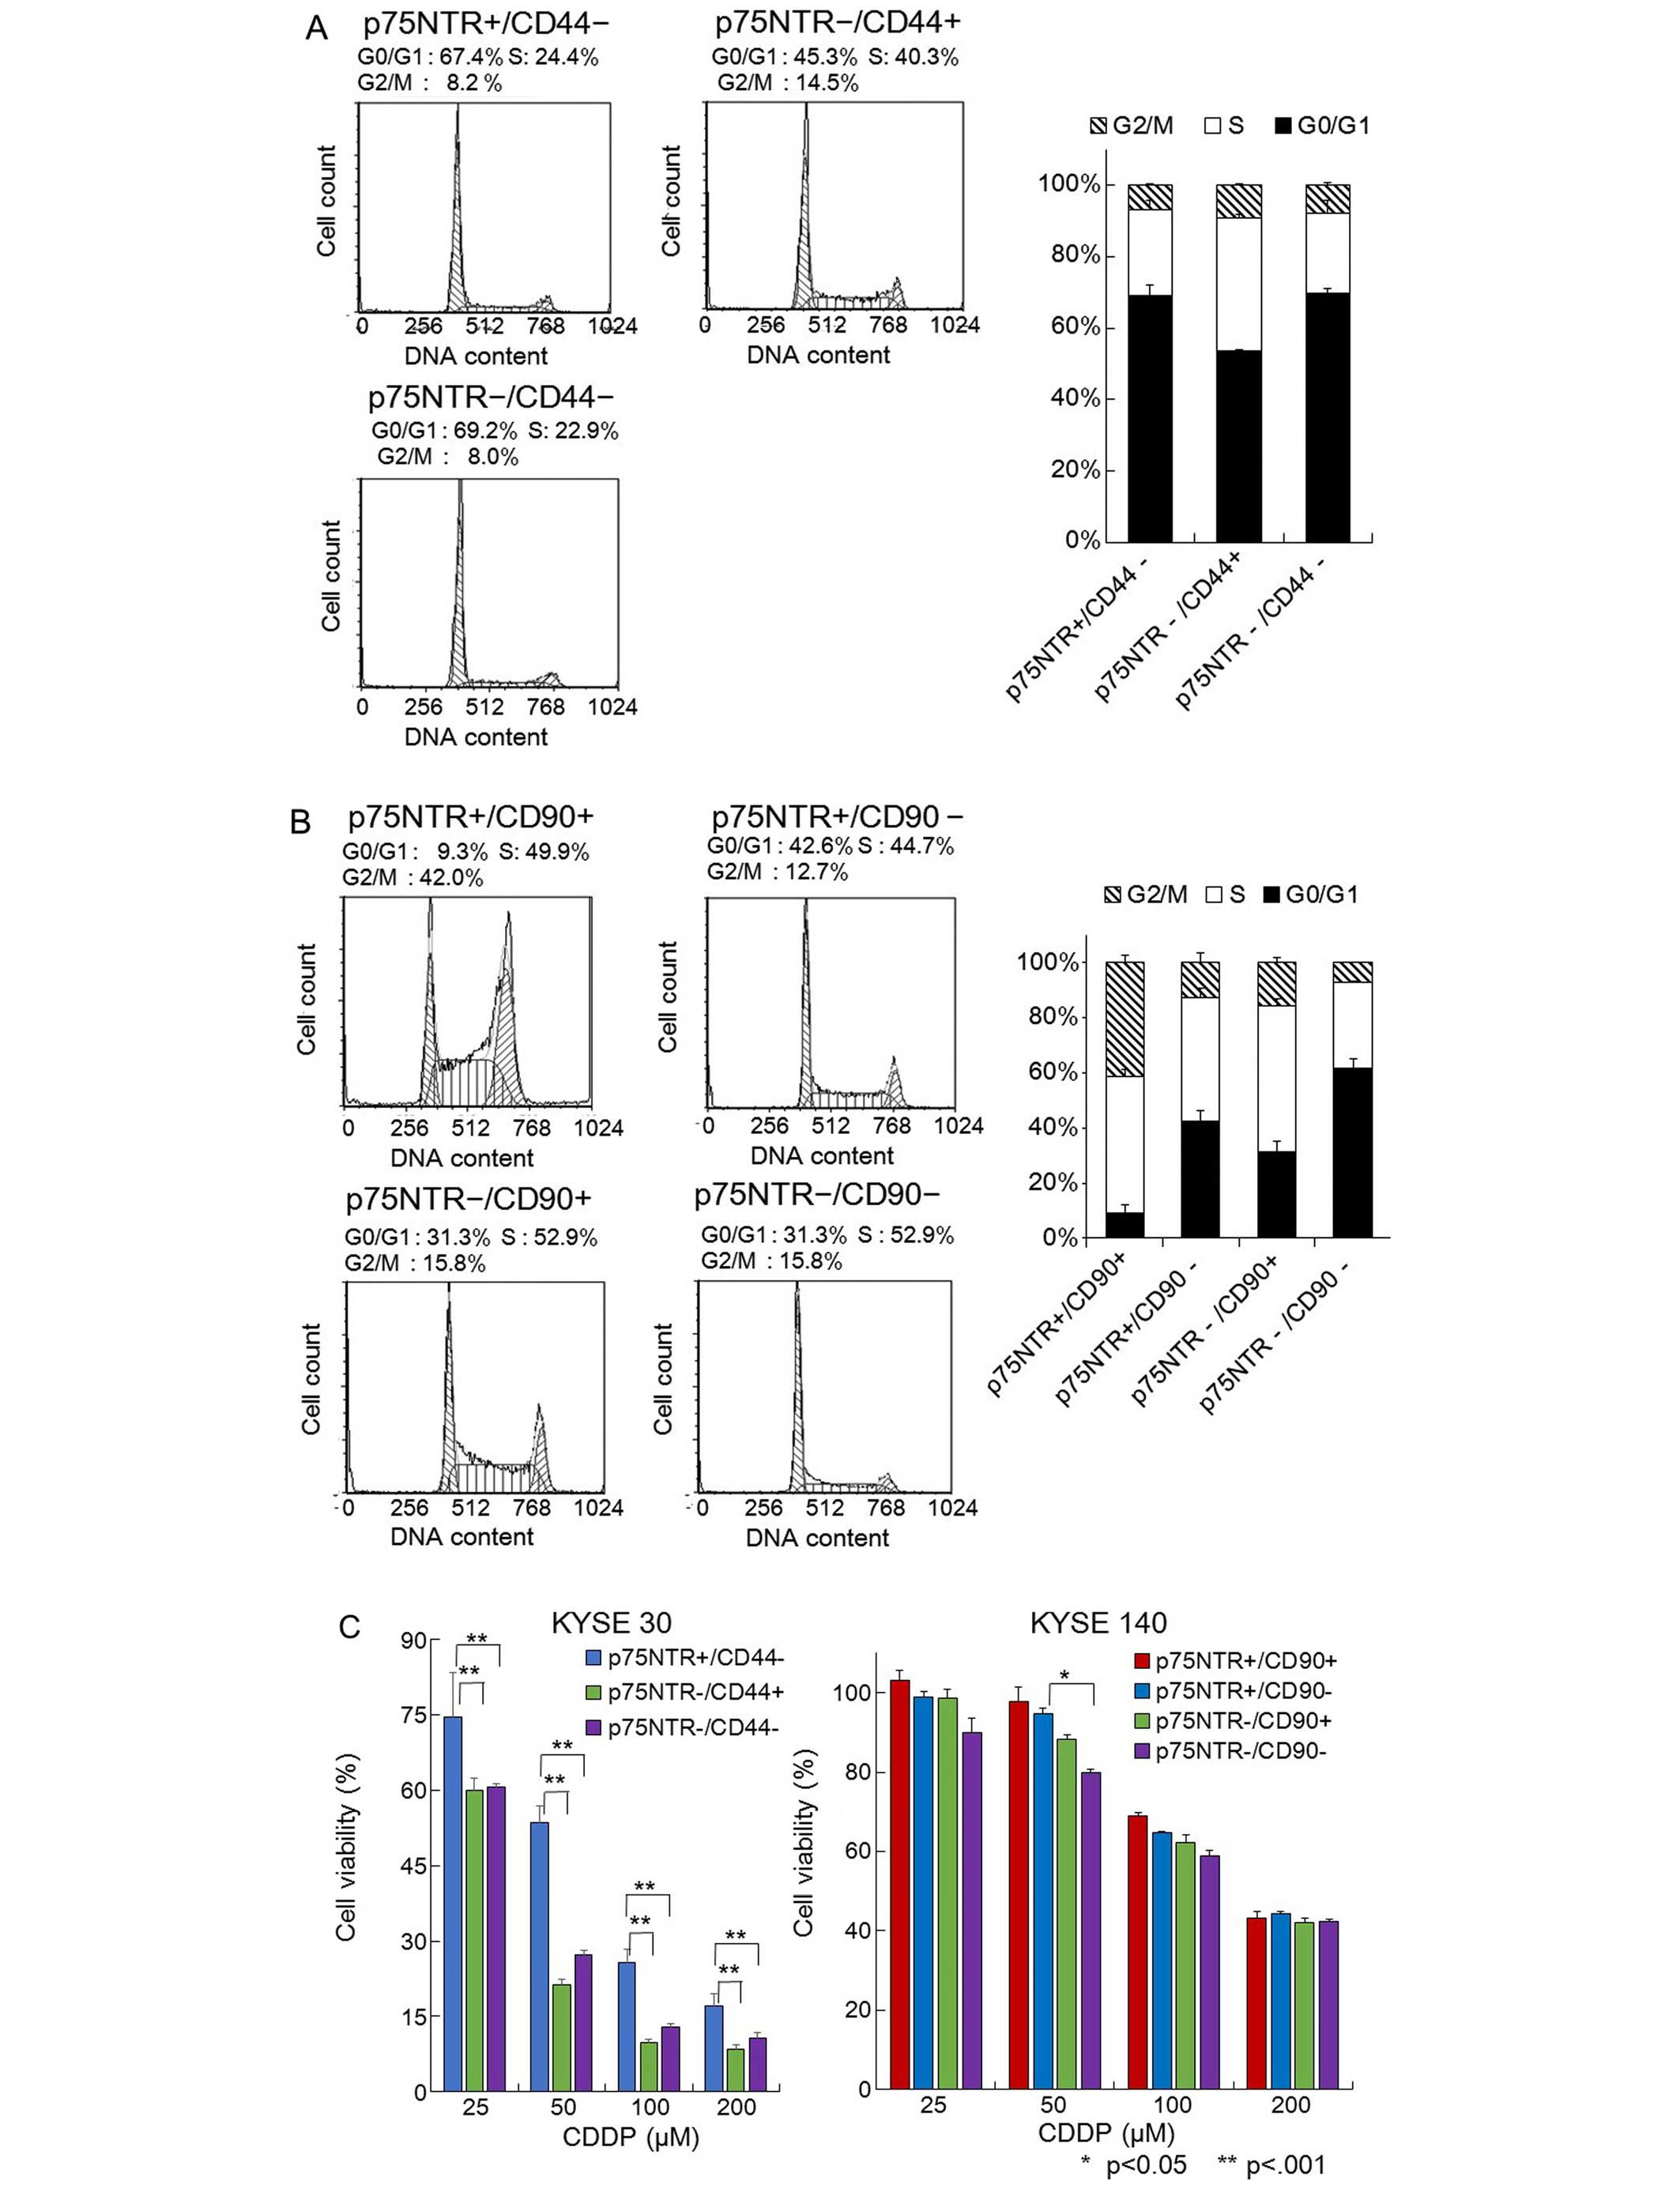
Cell cycle analysis
Flow cytometric cell cycle analysis revealed that
the p75NTR-negative/CD44-positive KYSE-30 cells were a mitotically
active subpopulation and exhibited the lowest proportion of cells
in the G0/G1 phase. On the other hand, the
p75NTR-positive/CD44-negative and p75NTR-negative/CD44-negative
fractions were relatively quiescent cell fractions, in which
>67% of the cells were in the G0/G1 phase (Fig. 4A). Among the KYSE-140 cells, the
p75NTR-positive/CD90-positive fraction contained the most actively
proliferating cells, while the p75NTR-positive/CD90-negative
fraction was composed of quiescent cells, 42.6% of which were in
the G0/G1 phase (Fig. 4B).
Comparison of drug-resistant ability
We compared the drug resistance of each cell
population using the MTT assay. Among the KYSE-30 cells, the
p75NTR-negative/CD44-positive cells exhibited significantly lower
viability than the p75NTR-positive/CD44-negative cells after being
treated with CDDP (Fig. 4C). Among
the KYSE-140 cells, the p75NTR-negative/CD90-negative cells
displayed significantly lower viability than the p75NTR-positive or
CD90-positive cells after being treated with CDDP (Fig. 4C).
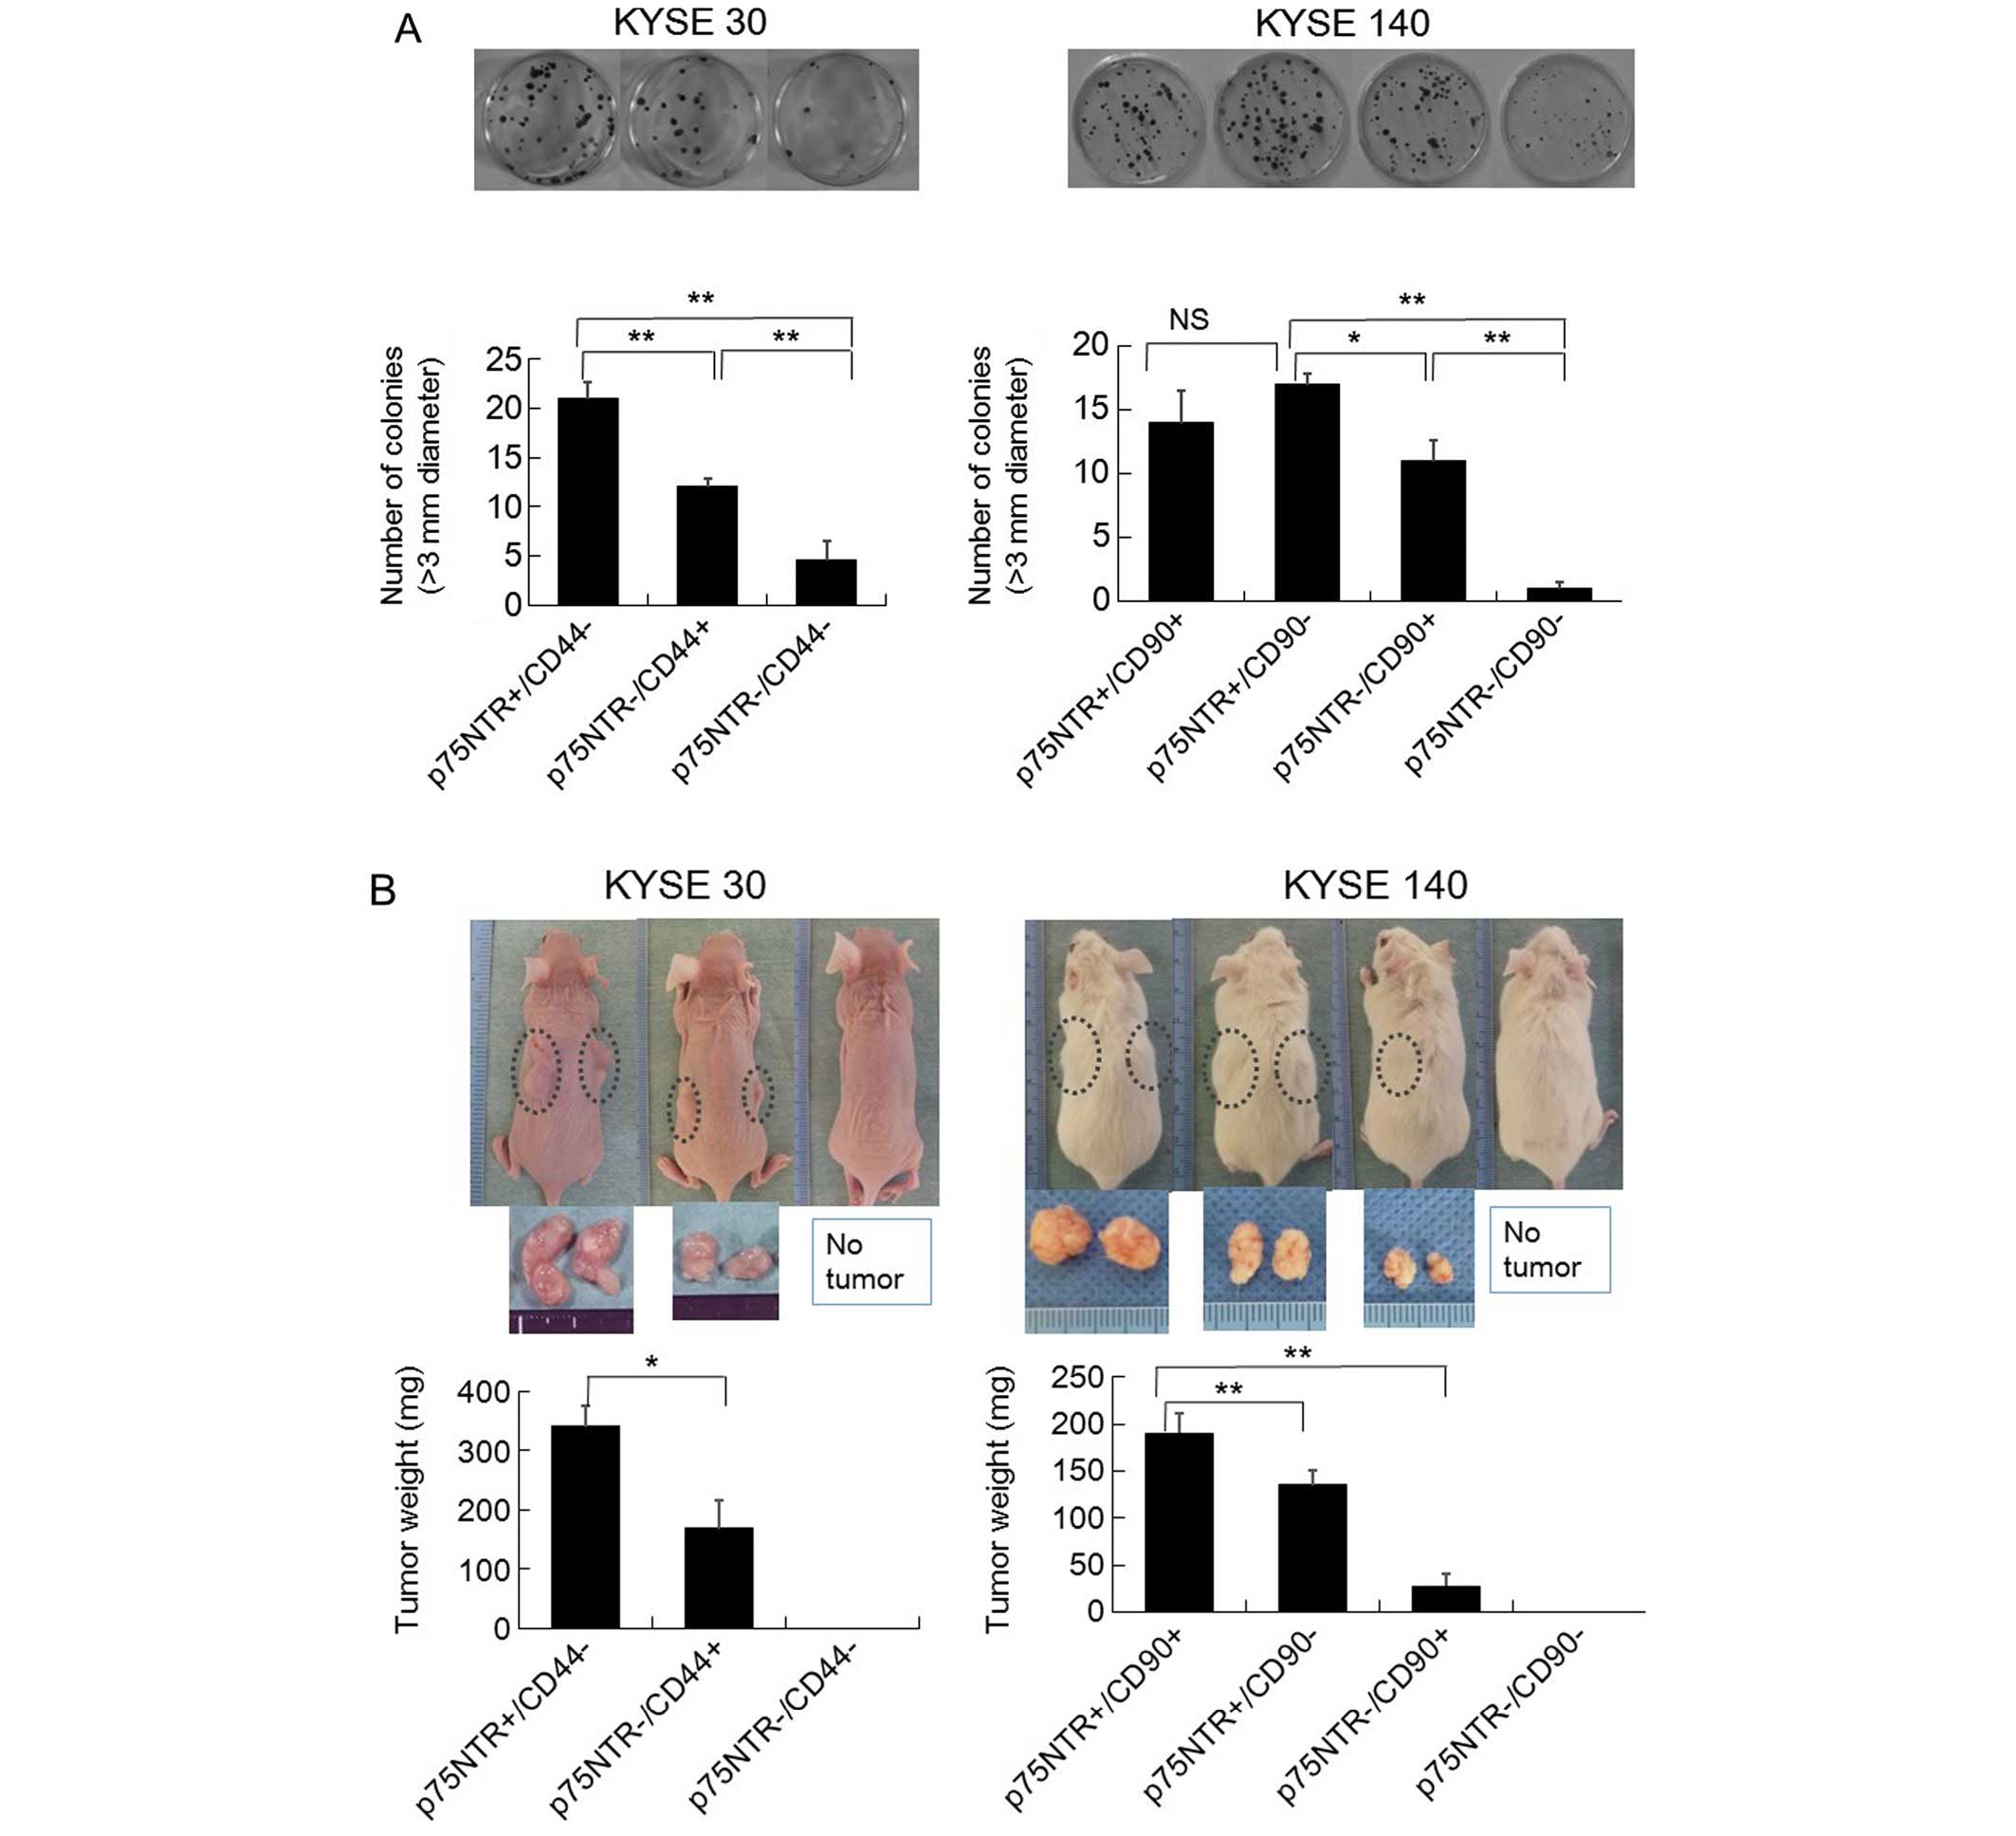
In vitro colony formation ability
The ability of the KYSE-30 cells to form colonies
exhibited the following order: p75NTR-positive/CD44-negative >
p75NTR-negative/CD44-positive > p75NTR-negative/CD44-negative
(Fig. 5A). As for the KYSE-140
cells, their ability to form colonies displayed the following
order: p75NTR-positive/CD90-negative >
p75NTR-positive/CD90-positive > p75NTR-negative/CD90-positive
> p75NTR-negative/CD90-negative (Fig. 5A).
In vivo tumor formation
Among the KYSE-30 cells, the subcutaneous injection
of as few as 3×10³ p75NTR-positive/CD44-negative cells
or p75NTR-negative/CD44-positive cells into nude mice resulted in
the development of tumors at 4/4 (100%) and 2/4 (50%) of the
injection sites, respectively, at 4 weeks after the injection
procedure. In contrast, the injection of 1×10⁴
p75NTR-negative/CD44-negative cells did not result in tumor
formation (Table IV).
| Table IVIn vivo tumor development
experiment in which p75NTR-positive/CD44-positive KYSE-30 cells
were injected into nude mice and p75NTR-positive/CD90-positive
KYSE-140 cells were injected into NOD/SCID mice. |
Table IV
In vivo tumor development
experiment in which p75NTR-positive/CD44-positive KYSE-30 cells
were injected into nude mice and p75NTR-positive/CD90-positive
KYSE-140 cells were injected into NOD/SCID mice.
| | Tumor
incidence |
|---|
| |
|
|---|
| No. of cells
injected | 30,000 | 10,000 | 3,000 |
|---|
| KYSE-30 |
p75NTR+/CD44− | 2/2 | 4/4 | 4/4 |
|
p75NTR−/CD44+ | 2/2 | 4/4 | 2/4 |
|
p75NTR−/CD44− | 2/2 | 0/4 | 0/4 |
| KYSE-140 |
p75NTR+/CD90+ | 2/2 | 2/2 | 2/4 |
|
p75NTR+/CD90− | 2/2 | 4/4 | 1/4 |
|
p75NTR−/CD90+ | 2/2 | 2/4 | 0/4 |
|
p75NTR−/CD90− | 0/2 | 0/4 | 0/4 |
The tumors that developed after the injection of
1×10⁴ p75NTR-positive/CD44-negative cells weighed
significantly more than those derived from the
p75NTR-negative/CD44-positive cells (Fig. 5B). Histological examinations of the
xenograft tumors demonstrated that their phenotypes resembled those
of primary ESCC tumors (Fig. 5C).
p75NTR was expressed in a small number of the cancer cells in the
first few layers nearest to the tumor infiltrating margins. CD44
was diffusely expressed throughout the tumors, except in the cells
residing at their margins. A detailed examination of 4 μm-thick
serial sections detected p75NTR-positive/CD44-negative cells at the
tumor infiltrating margins. Analyses of the Ki-67 labeling index
based on double immunostaining revealed that 86.9% of the
p75NTR-positive cells were in the resting phase of the cell cycle,
while 74.8% of the CD44-positive cells were actively
proliferating.
Among the KYSE-140 cells, the subcutaneous injection
of as few as 3×10³ p75NTR-positive/CD90-positive cells
or p75NTR-positive/CD90-negative cells into NOD/SCID mice resulted
in tumors forming at 2/4 (50%) and 1/4 (25%) of the injection
sites, respectively, at 4 weeks after the injection procedure
(Table IV).
On the other hand, the injection of 1×10⁴
p75NTR-negative/CD90-positive cells resulted in the establishment
of tumors at 2/4 (50%) of the injection sites. In contrast, even
the injection of 3×10⁴ p75NTR-negative/CD90-negative
cells did not result in tumor formation (Table IV). The tumors that developed
after the injection of 1×10⁴
p75NTR-positive/CD90-positive cells weighed significantly more than
those derived from the p75NTR-positive/CD90-negative (p<0.001)
or p75NTR-negative/CD90-positive cells (p<0.001) (Fig. 5B). In addition, the tumors derived
from the p75NTR-positive/CD90-negative cells were larger than those
derived from the p75NTR-negative/CD90-positive cells (p=0.002)
(Fig. 5B). A histological
examination of the xenograft tumors showed that p75NTR was
expressed in the cancer cells at their infiltrating margins. An
analysis of the Ki-67 labeling index based on double immunostaining
revealed that 59.6% of the p75NTR-positive cells were in the
resting phase of the cell cycle, while 80.4% of the tumor cells
were actively proliferating. No CD90 expression was detected in any
of the cancer cells in the xenograft tumors (p=0.017) (Fig. 5D).
Discussion
Our immunohistochemical investigation of surgical
ESCC specimens for previously reported CSC markers, such as p75NTR,
CD44 and CD90, revealed that the expression of p75NTR alone, the
expression of CD44 alone, and the expression of both p75NTR and
CD44 were detected in 21.4, 25.0 and 30.4% of the tumors,
respectively. In addition, none of the reported CSC markers were
detected in 23.2% of the tumors, demonstrating the heterogeneity of
the cell surface marker expression of ESCC tumors, as has been
shown for various other types of tumors (12).
p75NTR was expressed at the tumor infiltrating
margins, while CD44 was diffusely expressed throughout the tumors,
which is compatible with the findings of previous studies (5,7). Our
double immunostaining-based analysis of the Ki-67 labeling index
revealed that most of the p75NTR-positive cells were in a
mitotically quiescent state, while the majority of the
CD44-positive cells were actively proliferating. These findings
indicated that quiescent CSC can be found within ESCC and that it
may be possible to identify different CSC populations based on the
combination of cell surface markers that they express.
No CD90 expression was detected in any of the tumor
cells in the ESCC specimens. However, we observed positive CD90
staining in the stromal cells surrounding the cancer cells in all
of the ESCC specimens, which is compatible with the findings of a
previous report, in which CD90 expression was detected in the
stromal cells of head and neck squamous cell carcinoma (13). We also observed positive CD90
staining in the tumor cells of hepatocellular carcinoma specimens
(positive controls) (7). Although
a previous study detected CD90 expression in ESCC specimens by qPCR
and isolated CD90-positive cells from fresh cancer tissues by flow
cytometry (8), no previous studies
have detected CD90 expression in tumor cells from ESCC
specimens.
p75NTR, CD44 and CD90 expression were detected at
various cell frequencies in 6, 9 and 1 of the 10 examined KYSE cell
lines, respectively, further indicating the heterogeneity of the
cell surface marker expression seen in ESCC.
Contrary to the finding we obtained during the
immunohistochemical examination of the ESCC specimens, CD90 was
expressed in 50.9% of the KYSE-140 cells. It has been reported that
CD90 expression can be induced by various biological agents, such
as thymopoietin, prostaglandins, interleukin-1, tumor necrosis
factor-α, vascular endothelial growth factor, and nerve growth
factor (NGF) (14,15). Combining the above-mentioned
finding with the fact that an NGF autocrine loop was detected in
KYSE cells (16), it is suggested
that CD90 expression can be induced in certain cell culture
conditions.
Among the KYSE-30 cells, the p75NTR-positive
CD44-negative fraction exhibited strong stem cell-related gene
expression, weak keratinocyte differentiation marker expression,
anticancer drug resistance, in vitro colony formation and
in vivo tumorigenicity; i.e., they displayed a CSC
phenotype. Furthermore, the majority of the p75NTR-positive
CD44-negative KYSE-30 cells were in a mitotically quiescent state,
indicating that a quiescent CSC population is maintained even in
actively proliferating cells, whereas, the CD44-positive cells were
actively proliferating and exhibited a less marked CSC
phenotype.
Among the KYSE-140 cells, the p75NTR-positive cells
displayed a CSC phenotype; i.e., strong stem cell-related gene
expression, weak keratinocyte differentiation marker expression,
anticancer drug resistance, in vitro colony formation, and
in vivo tumorigenicity, regardless of whether they expressed
CD90.
Furthermore, an analysis of the KYSE-140 cells based
on their p75NTR/CD90 expression patterns identified two distinct
subpopulations in terms of their cell cycle status. The
p75NTR-positive/CD90-negative subset was mitotically quiescent
cells while the p75NTR-positive/CD90-positive subset was actively
proliferating cells, further indicating the existence of a
quiescent CSC population in ESCC.
Recent studies have demonstrated that dormant CSC
are even present in solid tumors, such as melanoma (17) and ovarian (18), breast (2) and pancreatic tumors (19). In addition, it was reported that
these cells enhance chemoresistance, invasiveness and metastasis,
as well as the risk of a late relapse after curative surgery
(1,2,12,20).
Several studies of leukemia have examined the
molecular mechanisms that regulate stem cell quiescence. These
studies suggested that inducing leukemia cells to enter the cell
cycle may enhance their chemosensitivity and that it is important
to identify molecules that will enable us to directly target
quiescent CSC (21,22).
Recently it was reported that the NGF/proNGF/p75NTR
axis plays a critical role in regulating the self-renewal of
quiescent CSC in breast cancer (23). Combining our results with the
findings of a previous report in which NGF overexpression and its
autocrine loop was shown to enhance cell proliferation in KYSE
cells (16), it is possible that
p75NTR signaling also plays a role in the regulation of quiescent
CSC in ESCC.
We used negative immunohistochemical staining of the
proliferation marker Ki-67 and flow cytometric measurements of DNA
content to detect cells in the G0/G1 phase of the cell cycle, as it
was previously reported that hematopoietic stem cells exist in the
quiescent state (according to dual staining using the DNA-binding
dye Hoechst 33342 and anti-Ki-67 antibody) (24). Moreover, label incorporation-based
assays, such as 5-bromo-2-deoxyuridine (BrdU)-based studies, have
also been used to isolate putative quiescent CSC based on their
dynamic cycling kinetics (25).
Further studies of self-renewal, asymmetric cell division and the
duration of the G0/G1 phase in the p75NTR-positive cell subset may
facilitate the elucidation of the dynamic kinetics of the CSC
present in ESCC.
In the present study, we found that EMT markers were
strongly expressed in the p75NTR-positive/CD44-negative and
p75NTR-positive/CD90-positive fractions of the KYSE-30 and KYSE-140
cells, respectively. Previous studies have demonstrated that EMT
processes play a role not only in the acquisition of a migratory
mesenchymal phenotype, which enhances invasiveness and metastasis,
but also in the acquisition of stem cell and tumorigenic
characteristics in CSC (20,26).
Combining these results with the findings of a recent report in
which it was demonstrated that NGF promoted EMT in the breast
cancer stem cell compartment (23), it is possible that p75NTR signaling
is involved in the regulation of EMT and stem cell properties. The
identification of the molecular mechanisms that regulate cell stem
cell properties, cell cycle status and EMT processes in the
p75NTR-positive cell subset of KYSE cells may provide a basis for
the development of novel treatment strategies for ESCC.
In conclusion, by examining surgical tumor specimens
and cultured cell lines we found that ESCC exhibit heterogeneous
expression patterns of cell surface markers such as p75NTR, CD44
and CD90. In addition, an analysis of the Ki-67 labeling indices in
the tumor specimens revealed that most of the p75NTR-positive cells
were in a mitotically quiescent state, while the majority of the
p75NTR-negative cells were actively proliferating. Among KYSE
cells, p75NTR-positive cells represent a CSC population that
exhibits strong stem cell-related gene expression, weak
keratinocyte differentiation marker expression, chemoresistance,
in vitro colony formation, and in vivo
tumorigenicity, regardless of whether they express CD44 or
CD90.
Furthermore, p75NTR-positive/CD44-negative and
p75NTR-positive/CD90-negative fractions KYSE cells were found to be
mitotically quiescent CSC both in vitro and in
vivo.
These results demonstrate that it is possible to
detect and isolate quiescent CSC from ESCC, providing researchers
with a target that will aid the development of novel therapeutic
strategies, as well as diagnostic tools for patient selection.
Acknowledgements
The authors wish to thank Mr. Masahiko Kawahara for
performing the cell culture experiments and providing technical
assistance. This study was supported by a Grant-in-Aid for
Scientific Research (C) from MEXT KAKENHI (grant no. 15K10088).
This study was also supported by C-CAM.
References
|
1
|
Li L and Bhatia R: Stem cell quiescence.
Clin Cancer Res. 17:4936–4941. 2011. View Article : Google Scholar : PubMed/NCBI
|
|
2
|
Pece S, Tosoni D, Confalonieri S, Mazzarol
G, Vecchi M, Ronzoni S, Bernard L, Viale G, Pelicci PG and Di Fiore
PP: Biological and molecular heterogeneity of breast cancers
correlates with their cancer stem cell content. Cell. 140:62–73.
2010. View Article : Google Scholar : PubMed/NCBI
|
|
3
|
Okumura T, Shimada Y, Imamura M and
Yasumoto S: Neurotrophin receptor p75(NTR) characterizes human
esophageal keratinocyte stem cells in vitro. Oncogene.
22:4017–4026. 2003. View Article : Google Scholar : PubMed/NCBI
|
|
4
|
Okumura T, Shimada Y, Sakurai T, Hori R,
Nagata T, Sakai Y and Tsukada K: Abnormal cell proliferation in the
p75NTR-positive basal cell compartment of the esophageal epithelium
during squamous carcinogenesis. Dis Esophagus. 28:634–643. 2015.
View Article : Google Scholar
|
|
5
|
Okumura T, Tsunoda S, Mori Y, Ito T,
Kikuchi K, Wang TC, Yasumoto S and Shimada Y: The biological role
of the low-affinity p75 neurotrophin receptor in esophageal
squamous cell carcinoma. Clin Cancer Res. 12:5096–5103. 2006.
View Article : Google Scholar : PubMed/NCBI
|
|
6
|
Huang SD, Yuan Y, Liu XH, Gong DJ, Bai CG,
Wang F, Luo JH and Xu ZY: Self-renewal and chemotherapy resistance
of p75NTR positive cells in esophageal squamous cell carcinomas.
BMC Cancer. 9:92009. View Article : Google Scholar : PubMed/NCBI
|
|
7
|
Zhao JS, Li WJ, Ge D, Zhang PJ, Li JJ, Lu
CL, Ji XD, Guan DX, Gao H, Xu LY, et al: Tumor initiating cells in
esophageal squamous cell carcinomas express high levels of CD44.
PLoS One. 6:e214192011. View Article : Google Scholar : PubMed/NCBI
|
|
8
|
Tang KH, Dai YD, Tong M, Chan YP, Kwan PS,
Fu L, Qin YR, Tsao SW, Lung HL, Lung ML, et al: A CD90(+)
tumor-initiating cell population with an aggressive signature and
metastatic capacity in esophageal cancer. Cancer Res. 73:2322–2332.
2013. View Article : Google Scholar : PubMed/NCBI
|
|
9
|
Shimada Y, Okumura T, Sekine S, Moriyama
M, Sawada S, Matsui K, Yoshioka I, Hojo S, Yoshida T, Nagata T, et
al: Expression analysis of iPS cell - inductive genes in esophageal
squamous cell carcinoma by tissue microarray. Anticancer Res.
32:5507–5514. 2012.PubMed/NCBI
|
|
10
|
Shimada Y, Imamura M, Wagata T, Yamaguchi
N and Tobe T: Characterization of 21 newly established esophageal
cancer cell lines. Cancer. 69:277–284. 1992. View Article : Google Scholar : PubMed/NCBI
|
|
11
|
Sekine S, Shimada Y, Nagata T, Moriyama M,
Omura T, Yoshioka I, Hori R, Matsui K, Sawada S, Okumura T, et al:
Establishment and characterization of a new human gallbladder
carcinoma cell line. Anticancer Res. 32:3211–3218. 2012.PubMed/NCBI
|
|
12
|
Dick JE: Stem cell concepts renew cancer
research. Blood. 112:4793–4807. 2008. View Article : Google Scholar : PubMed/NCBI
|
|
13
|
Liotta F, Querci V, Mannelli G,
Santarlasci V, Maggi L, Capone M, Rossi MC, Mazzoni A, Cosmi L,
Romagnani S, et al: Mesenchymal stem cells are enriched in head
neck squamous cell carcinoma, correlates with tumour size and
inhibit T-cell proliferation. Br J Cancer. 112:745–754. 2015.
View Article : Google Scholar : PubMed/NCBI
|
|
14
|
Chung MT, Liu C, Hyun JS, Lo DD, Montoro
DT, Hasegawa M, Li S, Sorkin M, Rennert R, Keeney M, et al: CD90
(Thy-1)-positive selection enhances osteogenic capacity of human
adipose-derived stromal cells. Tissue Eng Part A. 19:989–997. 2013.
View Article : Google Scholar :
|
|
15
|
Haeryfar SMM and Hoskin DW: Thy-1: More
than a mouse pan-T cell marker. J Immunol. 173:3581–3588. 2004.
View Article : Google Scholar : PubMed/NCBI
|
|
16
|
Tsunoda S, Okumura T, Ito T, Mori Y, Soma
T, Watanabe G, Kaganoi J, Itami A, Sakai Y and Shimada Y:
Significance of nerve growth factor overexpression and its
autocrine loop in oesophageal squamous cell carcinoma. Br J Cancer.
95:322–330. 2006. View Article : Google Scholar : PubMed/NCBI
|
|
17
|
Roesch A, Fukunaga-Kalabis M, Schmidt EC,
Zabierowski SE, Brafford PA, Vultur A, Basu D, Gimotty P, Vogt T
and Herlyn M: A temporarily distinct subpopulation of slow-cycling
melanoma cells is required for continuous tumor growth. Cell.
141:583–594. 2010. View Article : Google Scholar : PubMed/NCBI
|
|
18
|
Gao MQ, Choi YP, Kang S, Youn JH and Cho
NH: CD24+ cells from hierarchically organized ovarian
cancer are enriched in cancer stem cells. Oncogene. 29:2672–2680.
2010. View Article : Google Scholar : PubMed/NCBI
|
|
19
|
Dembinski JL and Krauss S:
Characterization and functional analysis of a slow cycling stem
cell-like subpopulation in pancreas adenocarcinoma. Clin Exp
Metastasis. 26:611–623. 2009. View Article : Google Scholar : PubMed/NCBI
|
|
20
|
Mani SA, Guo W, Liao M-J, Eaton EN,
Ayyanan A, Zhou AY, Brooks M, Reinhard F, Zhang CC, Shipitsin M, et
al: The epithelial-mesenchymal transition generates cells with
properties of stem cells. Cell. 133:704–715. 2008. View Article : Google Scholar : PubMed/NCBI
|
|
21
|
Roeder I, Horn M, Glauche I, Hochhaus A,
Mueller MC and Loeffler M: Dynamic modeling of imatinib-treated
chronic myeloid leukemia: Functional insights and clinical
implications. Nat Med. 12:1181–1184. 2006. View Article : Google Scholar : PubMed/NCBI
|
|
22
|
Zhang B, Strauss AC, Chu S, Li M, Ho Y,
Shiang KD, Snyder DS, Huettner CS, Shultz L, Holyoake T, et al:
Effective targeting of quiescent chronic myelogenous leukemia stem
cells by histone deacetylase inhibitors in combination with
imatinib mesylate. Cancer Cell. 17:427–442. 2010. View Article : Google Scholar : PubMed/NCBI
|
|
23
|
Tomellini E, Touil Y, Lagadec C, Julien S,
Ostyn P, Ziental-Gelus N, Meignan S, Lengrand J, Adriaenssens E,
Polakowska R, et al: Nerve growth factor and proNGF simultaneously
promote symmetric self-renewal, quiescence, and epithelial to
mesenchymal transition to enlarge the breast cancer stem cell
compartment. Stem Cells. 33:342–353. 2015. View Article : Google Scholar
|
|
24
|
Wilson A, Laurenti E, Oser G, van der Wath
RC, Blanco-Bose W, Jaworski M, Offner S, Dunant CF, Eshkind L,
Bockamp E, et al: Hematopoietic stem cells reversibly switch from
dormancy to self-renewal during homeostasis and repair. Cell.
135:1118–1129. 2008. View Article : Google Scholar : PubMed/NCBI
|
|
25
|
Buczacki S, Davies RJ and Winton DJ: Stem
cells, quiescence and rectal carcinoma: An unexplored relationship
and potential therapeutic target. Br J Cancer. 105:1253–1259. 2011.
View Article : Google Scholar : PubMed/NCBI
|
|
26
|
Chaffer CL, Marjanovic ND, Lee T, Bell G,
Kleer CG, Reinhardt F, D'Alessio AC, Young RA and Weinberg RA:
Poised chromatin at the ZEB1 promoter enables breast cancer cell
plasticity and enhances tumorigenicity. Cell. 154:61–74. 2013.
View Article : Google Scholar : PubMed/NCBI
|