Introduction
Acute myeloid leukemia (AML) is an aggressive
hematological malignancy accounting for ~80% of all adult leukemia
cases, and encompasses 15–20% of leukemia cases in children
(1,2). It is estimated that nearly 15% of
mortality among patients with hematologic malignancy were
attributed to AML (3), and more
than 13,000 new cases were diagnosed each year in the USA (4), thus, making AML a major cause of
hematologic disorders. AML is usually characterized by malignant
clonal proliferation of hematopoietic stem cells and progenitors
(blasts) in the bone marrow with the complete or partial blockage
at different stages of myeloid differentiation (1,2).
Despite advances in chemotherapy and hematopoietic stem cell
transplantation, the outcome of AML patients have not improved
substantially in the last four decades, with an overall 5-year
survival rate of ~25% (1,2,5).
Relapse occurs frequently, as ~50–70% of AML patients who achieve
complete remission within three years after frontline therapy
(2). Among these relapsed
patients, only one-third are salvageable with current treatment
regimens (5). Therefore, it is
urgently needed to search for new therapeutic targets for AML.
Securing further advances in therapy is dependent on our increasing
understanding of the factors and molecular mechanisms of
leukemogenesis in AML. Currently, insight into the pathogenesis of
AML has largely come from the investigations of cytogenetic
abnormalities and molecular genetic mutations. Many chromosomal
structural aberrations and somatic mutations have been identified,
which include rearrangements of RUNX1-RNNX1T1, CBFB-MYH11, PML-RARA
and MLL gene (6), mutations of
CEBPA, NPM1, FLT3, DNMT3A, TET2, IDH1/2 and ASXL1 gene (1,7,8).
Despite the pathological role and prognostic implications of these
genes have been well elucidated, understanding of the multistep
pathogenesis of AML remains limited. Specifically, the regulatory
networks of AML gene expression are still unclear.
miRNAs are small non-protein coding RNA molecules of
~19–25 nucleotides that mediate post-transcriptional regulation of
gene expression level (9).
Pri-miRNAs are transcribed by RNA polymerase II and subsequently
processed by the Drosha-DGCR8 enzyme complex in the nucleus
to form ~70 nt hairpin pre-miRNAs. Finally, pre-miRNAs were cleaved
in the cytoplasm by the endoribonuclease Dicer to yield mature
miRNAs. The mature miRNA may bind to the 3′-UTR of target mRNAs
through its seed region, which leads to mRNA degradation or
inhibition of translation (10).
miRNAs play important roles in a variety of biological processes
and are implicated in the initiation and progression of many types
of human cancers, including AML (11,12).
It has been reported that ectopic expression of miR-29a would
induce hematopoietic stem cells/progenitors progresses to AML in a
mouse model (13). High expression
of miR-100 and miR-375 was found in pediatric AML patients, which
were correlated with poorer relapse-free and overall survival
(14,15). miR-193a expression is downregulated
in AML1/ETO-positive leukemia cells, suppression of miR-193a
expands the oncogenic activity of the fusion protein AML1-ETO
involving a feedback circuitry in miR-193a and AML1-ETO/DNMTs/HDACs
(16). Recently, increased
miR-181a expression was shown to be associated with improved
prognosis in cytogenetically normal AML. In xenograft mouse models
of AML, ectopic miR-181a expression inhibits tumor growth (17). Although the aberrant expression and
molecular function of AML-related miRNAs were reported in these
investigations, the global miRNA regulatory network in AML remains
unknown.
TFs are trans-acting protein factors that control
the transcription of target genes through specifically binding to
the TFBS located within promoter region of target genes (18). As two major types of regulators of
gene expression, TFs and miRNAs are able to tightly coordinate to
ensure precise and accurate gene expression. TF and miRNA may
reciprocally regulate one another and both can regulate the
expression of target genes in a combinatorial manner (18,19).
It has been reported that miR-223 and transcription factor E2F1
regulate each other to form negative feedback loop in AML (20). Furthermore, transcription factor
C/EBPα can exert its effects by inducing miR-30c inactivating the
Notch1 protein and enhancing granulocytic differentiation in AML
(21). Nevertheless, global
regulation of gene expression involved in the TFs and miRNAs in AML
are still poorly understood. Therefore, integrated analysis
correlating changes in the expression patterns of miRNAs and TFs,
as it relates to AML pathogenesis, requires examination.
In the present study, we analyzed miRNA and TF
expression profiles in bone marrow samples of AML patients and
control groups, utilizing miRNA sequencing and TF array technology,
respectively. Based on a combined strategy of the target prediction
of miRNAs and TFs, we integrated differentially expressed miRNAs,
AML candidate genes and differentially expressed TFs to construct a
comprehensive miRNA-TF mediated regulatory network specifically for
AML. GO and pathway analysis was performed to determine associated
functions and signaling pathway of the network nodes. After
calculating the number of the node degree, we found some hub miRNAs
and TFs, and further investigated their regulation in the
subnetwork. Our results demonstrate that the altered expression
levels of miRNAs and TFs may have implications in AML pathogenesis,
and that integrative analysis of miRNAs and TFs may provide a new
foundation for molecularly targeted therapy of AML in the
future.
Materials and methods
Patient samples and ethics statement
A total of 25 bone marrow biopsy samples, including
15 patients with newly diagnosed and untreated AML and 10
age-matched controls, were enrolled in the study. The AML samples
were collected at Shenzhen People's Hospital (Shenzhen, China)
before any chemo- or radiotherapeutic treatment. Diagnosis and
classification of AML were determined according to the
French-American-British classification system (22,23).
To serve as controls, the samples with normal bone marrow
morphology were provided from 10 patients with unexplained anemia
or fever by the Affiliated Hospital of Guangdong Medical University
(Zhanjiang, China). All the clinical characteristics of AML
patients and controls are shown in Table I. The study was carried out
according to the Helsinki convention criteria and approved by the
ethics committee of the Shenzhen People's Hospital and the
Affiliated Hospital of Guangdong Medical University. Written
informed consent to use biological samples and clinical data was
obtained from patients or their parents.
 | Table IClinical characteristics of AML
patients and controls. |
Table I
Clinical characteristics of AML
patients and controls.
|
Characteristics | AML patients
(n=15) | Control patients
(n=10) |
|---|
| Age (years) | 18–77 (mean
40) | 10–73 (mean
39) |
| Gender (n) |
| Male | 9 | 6 |
| Female | 6 | 4 |
| FAB subtypes
(n) |
| M0 | 1 | - |
| M1 | 3 | - |
| M2 | 5 | - |
| M3 | 2 | - |
| M4 | 2 | - |
| M5 | 1 | - |
| M6 | 1 | - |
| Leukemic blasts in
bone marrow (%) | 30–99 (mean
78) | - |
| Disease (n) |
| AML | 15 | - |
| Unexplained
anemia | - | 9 |
| Unexplained
fever | - | 1 |
Total RNA extraction
Total RNA was extracted using TRIzol reagent
(Invitrogen, Carlsbad, CA, USA) and a RNeasy kit (Qiagen, Hilden,
Germany) following manufacturer's instructions, to include a DNase
digestion step. RNA purity and concentration were determined using
a NanoDrop ND-1000 spectrophotometer (NanoDrop Technologies,
Wilmington, DE, USA) measuring absorbance at 230, 260 and 280
nm.
miRNA sequencing and data analysis
Total RNA was ligated sequentially to 3′ and 5′ RNA
adapters using T4 RNA ligase (Promega, Madison, WI, USA). Ligation
products were then reverse-transcribed and PCR amplified using
Illumina's proprietary RT primers and amplification primers
(Illumina, San Diego, CA, USA). Subsequently, ~135–155 bp PCR
amplified fragments (correspond to ~15–35 nt small RNAs) were
isolated and purified from the PAGE gels. After quantified with
Agilent 2100 Bioanalyzer (Agilent Technologies, Palo Alto, CA,
USA), the completed libraries were diluted to a final concentration
of 8 pM and loaded on the Illumina cBot for cluster generation
using TruSeq Rapid SR cluster kit (Illumina) according to the
manufacturer's protocol. Finally, the sequencing was carried out on
Illumina HiSeq 2000 using TruSeq Rapid SBS kit (Illumina) as
recommended by the manufacturer.
After sequencing, image analysis and base calling
were carried out using Off-Line Basecaller software (version
V1.8.0; Illumina). The low quality reads were removed from raw
sequencing reads by Solexa CHASTITY quality control filter.
Subsequently, 3′ adapter sequences were deleted from clean reads
and the reads that were shorter than 15 nt were excluded from
further analysis. To identify miRNAs, the 3′-adapter-trimmed-reads
were aligned to known human pre-miRNAs in the miRBase database
(Release 19.0, http://www.mirbase.org/) using Novoalign software
(Version v2.07.11, http://www.novocraft.com/) with at most one mismatch.
In order to correct for the difference in read counts between
samples, the read counts per miRNA in each sample were normalized
to tpm (the clone number of transcripts per million based on the
sum number of reads aligned to known human pre-miRNAs in miRBase
19.0). Differentially expressed miRNAs may be identified by a
fold-change filtering. The threshold is fold-change ≥2.0 (Based on
the normalized most abundant tag counts).
Transcription factor/DNA array and
computational analysis
The transcription factor/DNA array analysis was
carried out using TranSignal™ Protein/DNA Combo Arrays (Panomics,
Redwood City, CA, USA) following the protocols provided by the
manufacturer, which included 345 major transcription factors.
Briefly, nuclear proteins were extracted using the Panomics nuclear
extract kit (Panomics) and protein concentrations were determined
by BCA protein assay kit (KangChen Bio-Tech Inc., Shanghai, China).
Nuclear extract (10 μg) were incubated with 10 μl of
biotin-labelled DNA binding oligonucleotides (TranSignal™ Probe
Mix) for 30 min at 15°C to allow the formation of transcription
factor/DNA complexes. Such complexes were isolated from the free
probes by spin column separation system (Panomics). The bound DNA
probes were extracted, denatured and hybridized to oligonucleotides
(representing 345 consensus binding sequences for TFs) on
TransSignal array membrane at 42°C overnight. Subsequently, the
blots were washed and incubated with HRP and HRP substrate working
solution (Millipore, Billerica, MA, USA), and exposed to Hyperfilm
ECL (Amersham Pharmacia Biotech, Uppsala, Sweden). Hybridization
signals were detected using GBoX Imaging System (Syngene,
Cambridge, UK), and quantitative analysis of the resulting spots
were performed using the ScanAlyze software (version 1.0.3,
http://graphics.stanford.edu/software/scanalyze/).
Any spot showing at least 2-fold increase or decrease is considered
significant.
Quantitative PCR
Total RNA from each sample was reverse transcribed
to generate cDNA with gene-specific primer (for miRNAs) and oligo
dT primer (for TFs) using a Superscript™ III reverse transcriptase
kit (Invitrogen, Carlsbad, CA, USA) in accordance with the
manufacturer's instructions. QPCR was carried out in a total
reaction volume of 10 μl, including 2 μl of template cDNA, 5 μl of
2X SYBR-Green PCR Master Mix (Applied Biosystems, Foster City, CA,
USA), 0.5 μl of PCR forward primer (10 μM), 0.5 μl of PCR reverse
primer (10 μM) and 2 μl of double-distilled water. The reactions
were incubated at 95°C for 10 min, followed by 40 cycles at 95°C
for 10 sec, 60°C for 60 sec. All reactions were run in triplicate.
After PCR amplification, melt curve analysis was carried out to
determine the reaction specificity. Human U6 snRNA and 18S rRNA was
used to normalize the expression levels of miRNAs and TFs,
respectively. Expression fold-changes were calculated using the
2−ΔΔCt method (24).
The differences in gene expression levels between AML samples and
controls were compared using the Student's t-test. Statistical
significance was set at P<0.05. All primers used in cDNA
synthesis and qPCR are shown in Tables II, III and IV.
| Table IIPrimers used for cDNA synthesis of
miRNAs. |
Table II
Primers used for cDNA synthesis of
miRNAs.
| miRNAs | Primer for cDNA
synthesis (5′-3′) |
|---|
| miR-9-5p |
GTCGTATCCAGTGCGTGTCGTGGAGTCGGCAATTGCACTGGATACGACTCATACA |
| miR-155-5p |
GTCGTATCCAGTGCGTGTCGTGGAGTCGGCAATTGCACTGGATACGACACCCCTA |
| miR-100-5p |
GTCGTATCCAGTGCGTGTCGTGGAGTCGGCAATTGCACTGGATACGACCACAAG |
| miR-223-3p |
GTCGTATCCAGTGCGTGTCGTGGAGTCGGCAATTGCACTGGATACGACTGGGGTA |
| miR-16-5p |
GTCGTATCCAGTGCGTGTCGTGGAGTCGGCAATTGCACTGGATACGACCGCCAAT |
| miR-106b-5p |
GTCGTATCCAGTGCGTGTCGTGGAGTCGGCAATTGCACTGGATACGACATCTGCA |
| U6 snRNA |
CGCTTCACGAATTTGCGTGTCAT |
| Table IIIPrimers used for real-time
quantitative PCR of miRNAs. |
Table III
Primers used for real-time
quantitative PCR of miRNAs.
| miRNAs | Sense primer
(5′-3′) | Antisense primer
(5′-3′) | Product (bp) |
|---|
| miR-9-5p |
GGGGGTCTTTGGTTATCTA |
CAGTGCGTGTCGTGGA | 68 |
| miR-155-5p |
GGGGTAATGCTAATCGTGA |
CAGTGCGTGTCGTGGAG | 66 |
| miR-100-5p |
GCAACCCGTAGATCCGAA |
CAGTGCGTGTCGTGGAGT | 62 |
| miR-223-3p |
GGGGTGTCAGTTTGTCAAA |
CAGTGCGTGTCGTGGAGT | 66 |
| miR-16-5p |
GGGTAGCAGCACGTAAATA |
CAGTGCGTGTCGTGGAGT | 65 |
| miR-106b-5p |
GGGGGTAAAGTGCTGACAGT |
GTGCGTGTCGTGGAGTCG | 64 |
| U6 snRNA |
GCTTCGGCAGCACATATACTAAAAT |
CGCTTCACGAATTTGCGTGTCAT | 89 |
| Table IVPrimers used for real-time
quantitative PCR of TFs. |
Table IV
Primers used for real-time
quantitative PCR of TFs.
| TFs | Sense primer
(5′-3′) | Antisense primer
(5′-3′) | Product (bp) |
|---|
| MYC |
ACACATCAGCACAACTACGC |
CCTCTTGACATTCTCCTCGGT | 159 |
| NFKB1 |
ACTGGCTGAGCGGATGCATC |
TGCTGTGGTCAGAAGGAATG | 165 |
| NR2F1 |
ATCGAGAGCCTGCAGGAGAA |
CTACCAAACGGACGAAGAAGAG | 163 |
| FOXO1 |
GCAACTACAGCCAAAATCAC |
TCAGAGAGCTACCAAGGATTC | 152 |
| FOXL1 |
TGAGGTTTGATGGCAGGAAT |
GATTTTCGTTGCAGACCTCTTC | 171 |
| TFAP2A |
TTGGGTACGTGTGCGAAA |
TCTGTTTTGTAGCCAGGAGCAT | 120 |
| 18S rRNA |
CCTGGATACCGCAGCTAGGA |
GCGGCGCAATACGAATGCCCC | 112 |
Association analysis of the different
expression of miRNAs and TFs
Target gene prediction for different expression
miRNAs. Differentially expressed miRNAs (fold change, ≥2.0) were
subjected to bioinformatic analysis for target gene prediction
mainly by combinatorial utilization of four different online
databases, including miRanda (version v5, http://www.ebi.ac.uk/enright-srv/microcosm/htdocs/targets/v5/),
TargetScan (Release 6.2, http://www.targetscan.org/), PicTar (Release 2007,
http://pictar.mdc-berlin.de/cgi-bin/PicTar_vertebrate.cgi)
and miRTarBase (Release 4.5, http://mirtarbase.mbc.nctu.edu.tw/) (25,26).
To decrease the number of false-positive results, we integrated the
predicted targets from miRanda, TargetScan and PicTar based on
sequence complementarity, evolutionary conservation and free energy
of RNA duplexes, which predicted by at least two of three databases
were accepted as positive (25).
(TFs were treated as genes when predicting miRNA→TF regulatory
relations). Subsequently, we merged the results with experimentally
validated miRNA targets from miRTarBase.
Combined AML candidate genes with miRNA
target prediction
To avoid the redundancy, AML-associated genes were
obtained from the MalaCards database (version 1.08.564, http://www.malacards.org/, MalaCards ID: LKM061)
(27) and overlapped with the
predicted miRNA targets above to form a miRNA→gene regulatory
relations. The extracted miRNA and target gene pairs were then
subjected to transcription factor binding site (TFBS) analysis.
TFBS prediction for different expression
miRNAs and its pair target genes
To retrieve predicted TFBS information, We utilized
the data underlying the TFBS Conserved Track (http://genome.ucsc.edu/cgi-bin/hgTables?hgsid=350051003&hgta_doSchemaDb=hg19&hgta_doSchemaTable=tfbsConsFactors)
at the UCSC Genome Browser (28).
These binding sites are conserved across the human/mouse/rat
alignment. To further reduce the false-positive prediction, P-value
of 0.05 was used as a cut-off for high-quality TFBSs. A gene is
identified as the target of a TF if at least one TFBS is located in
the gene's promoter region (5,000 bp upstream and 1,000 bp
downstream of the TSS) and its P-value was <0.05. miRNA overlaps
with a known host transcript (mRNA/lncRNA) and serve as a part of
the same transcription unit. Therefore, the promoter for this
specific transcript is used as the miRNA promoter. We identified
the target miRNAs of the TFs by using the same approach as for
protein-coding genes and lncRNAs. A miRNA is regarded as the target
of a TF if at least one TFBS falls within the TSS region (from
5,000 bp upstream to 1,000 bp downstream) of the host gene or
lncRNA and its P-value was <0.05.
Combined differentially expressed TFs
with TFBS prediction
To further increase the accuracy of TFBS prediction,
differentially expressed TFs (fold-change, ≥2.0) were overlapped
with the predicted TFs above. Subsequently, we extracted TFs and
miRNA pairs, TFs and miRNA target genes pairs to form TF→miRNA and
TF→gene regulatory relations, respectively.
miRNA-TF regulatory network construction
and network node analysis
The TF→miRNA and TF→gene interactions were
incorporated into miRNA→gene interactions to construct a
comprehensive miRNA-TF mediated regulatory network, which was
visualized using Gephi software (version 0.8.1-beta, http://gephi.github.io/). For further network
functional evaluation, GO analysis and KEGG pathway analysis were
performed using the Functional Annotation Tool of DAVID database
(version v6.7, http://david.abcc.ncifcrf.gov/) (29) to identify the functional categories
enriched and pathways for the network nodes. GO term enrichment and
the KEGG pathways utilized significant P-values (<0.05) relating
to the nodes of miRNA-TF regulatory network. To assess network
characteristics, the node degree is measured by the number of
direct links of the node in the network. Nodes having a total
degree ≥20 were defined as hub nodes inside the network. The
subnetworks were then constructed by combining all the directly
linked nodes for the hubs.
Statistical analysis
Statistical analyses were performed are presented as
means ± standard deviation (SD). The using SPSS for Windows
(version 13.0; SPSS, Inc.). All values statistical difference
between means were analyzed by the Student's t-test and P-value
<0.05 was considered significant.
Results
Aberrant miRNA and TF expression in
AML
To obtain AML-related miRNAs and TFs, we analyzed
miRNA and TF expression profiles in bone marrow samples of AML
patients and control groups, using miRNA sequencing and TF array
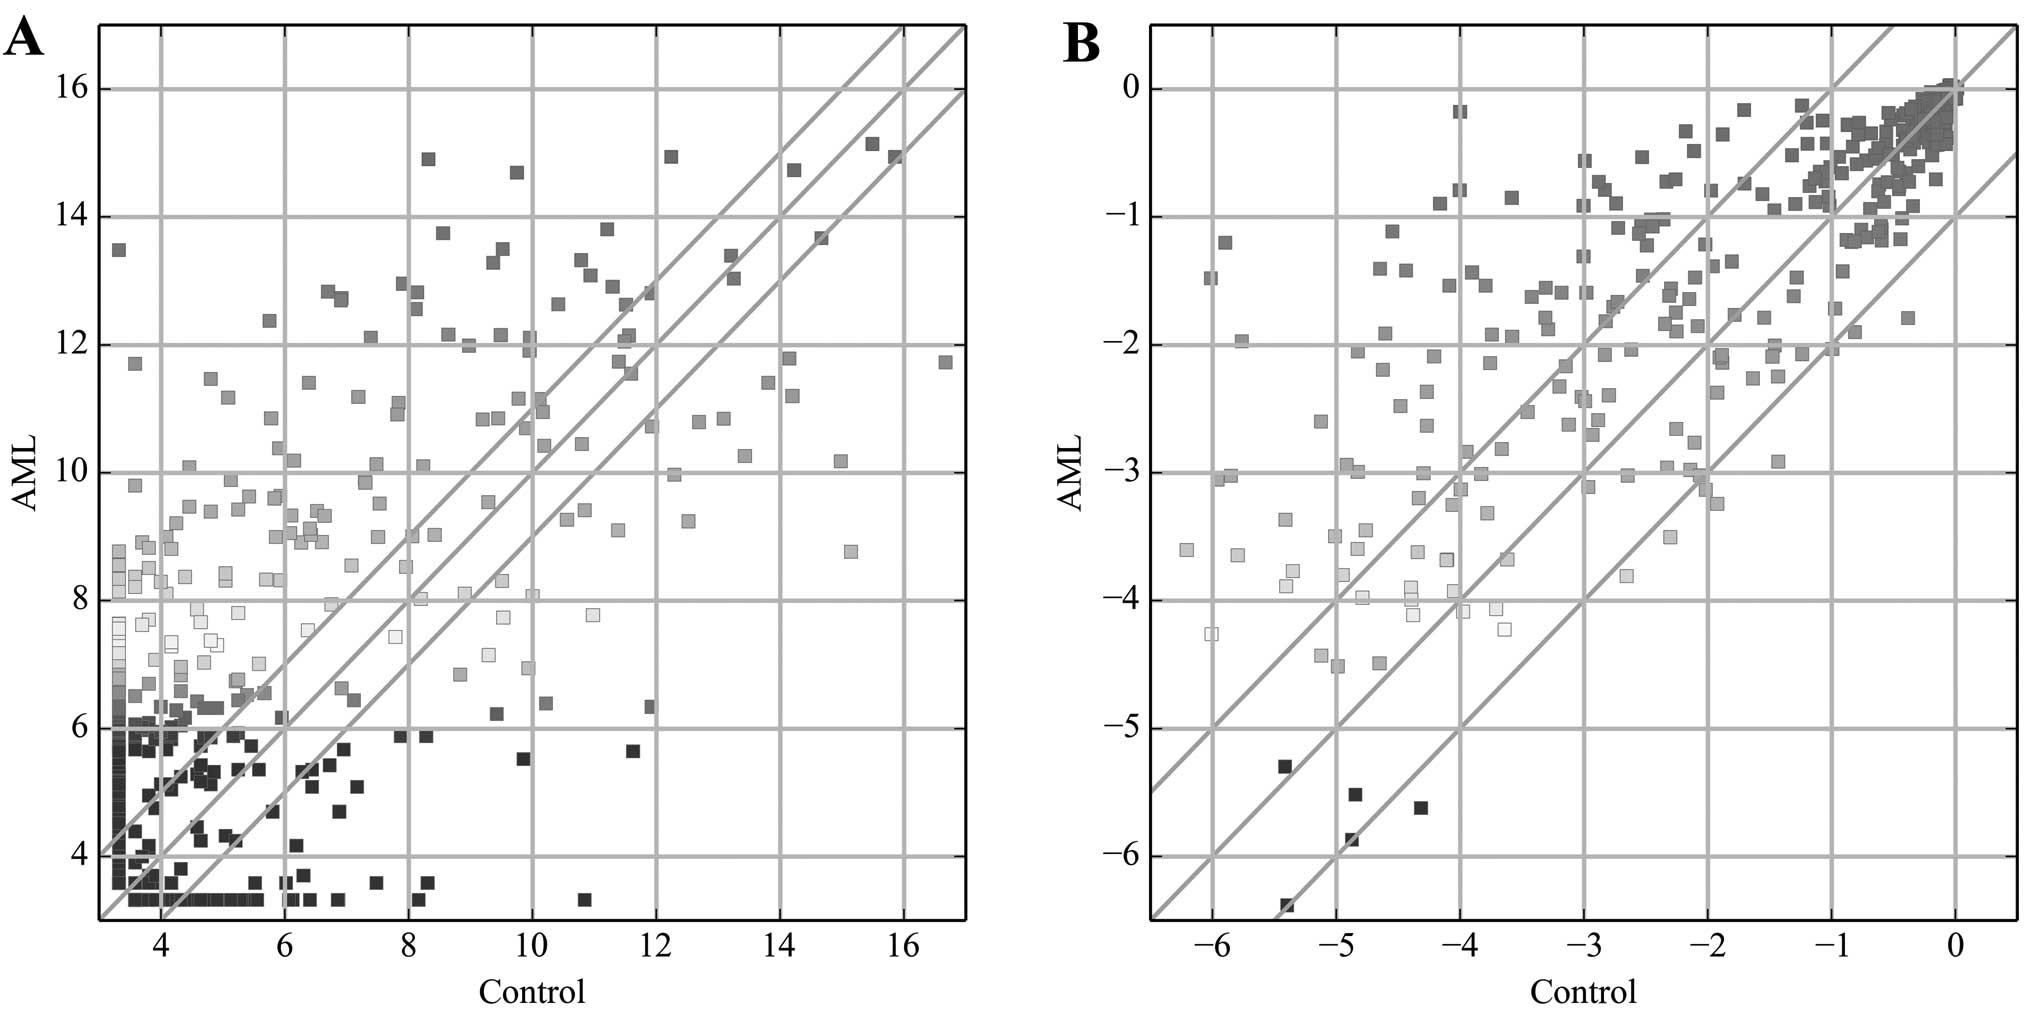
technology, respectively. Among the miRNA transcripts examined, we
found 308 miRNAs were differentially expressed (fold-change ≥2.0)
in AML samples relative to their controls (Fig. 1A), with 233 being upregulated,
while 75 were downregulated. miR-206 (fold-change, 1144) was the
most significantly upregulated miRNA, while miR-941 (fold-change,
184.2) was the most significantly downregulated miRNA.
The TF expression profiling data showed 84 TFs to be
differentially expressed (fold-change ≥2.0) in AML samples relative
to their controls (Fig. 1B), with
76 upregulated, while 8 were downregulated. Among these TFs, PREB
(fold-change, 25.9) showed the highest degree of upregulation,
while HiNF-B (fold-change, 2.8) was the most downregulated TF.
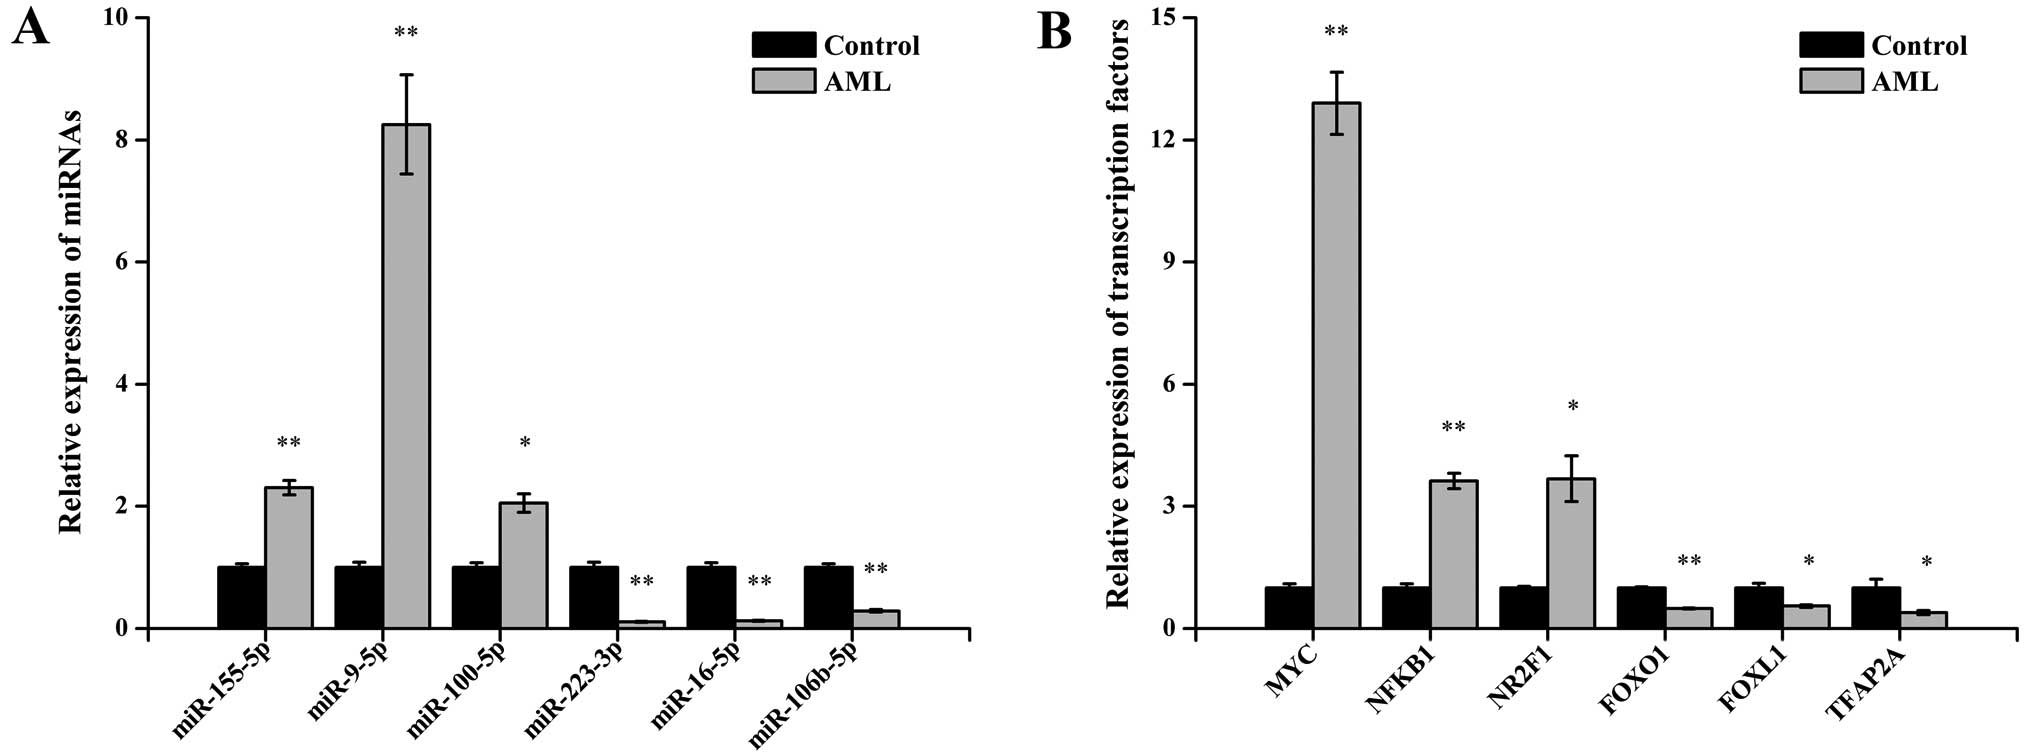
Quantitative PCR validation
To validate the miRNA sequencing and TF array
results, 6 differentially expressed miRNAs and 6 differentially
expressed TFs were selected and analyzed via qPCR. For the miRNAs,
the results demonstrated that miR-155-5p, miR-9-5p and miR-100-5p
were upregulated and that miR-223-3p, miR-16-5p and miR-106b-5p
were down-regulated in the AML samples compared with control
samples (P<0.05 for each miRNAs; Fig. 2A). For the TFs, the expression of
MYC, NFKB1, NR2F1, FOXO1, FOXL1 and TFAP2A showed statistically
significant differences between the two sets of bone marrow samples
(all P<0.05; Fig. 2B). These
qPCR results were consistent with the miRNA sequencing and TF array
data.
miRNA and TF regulatory network in
AML
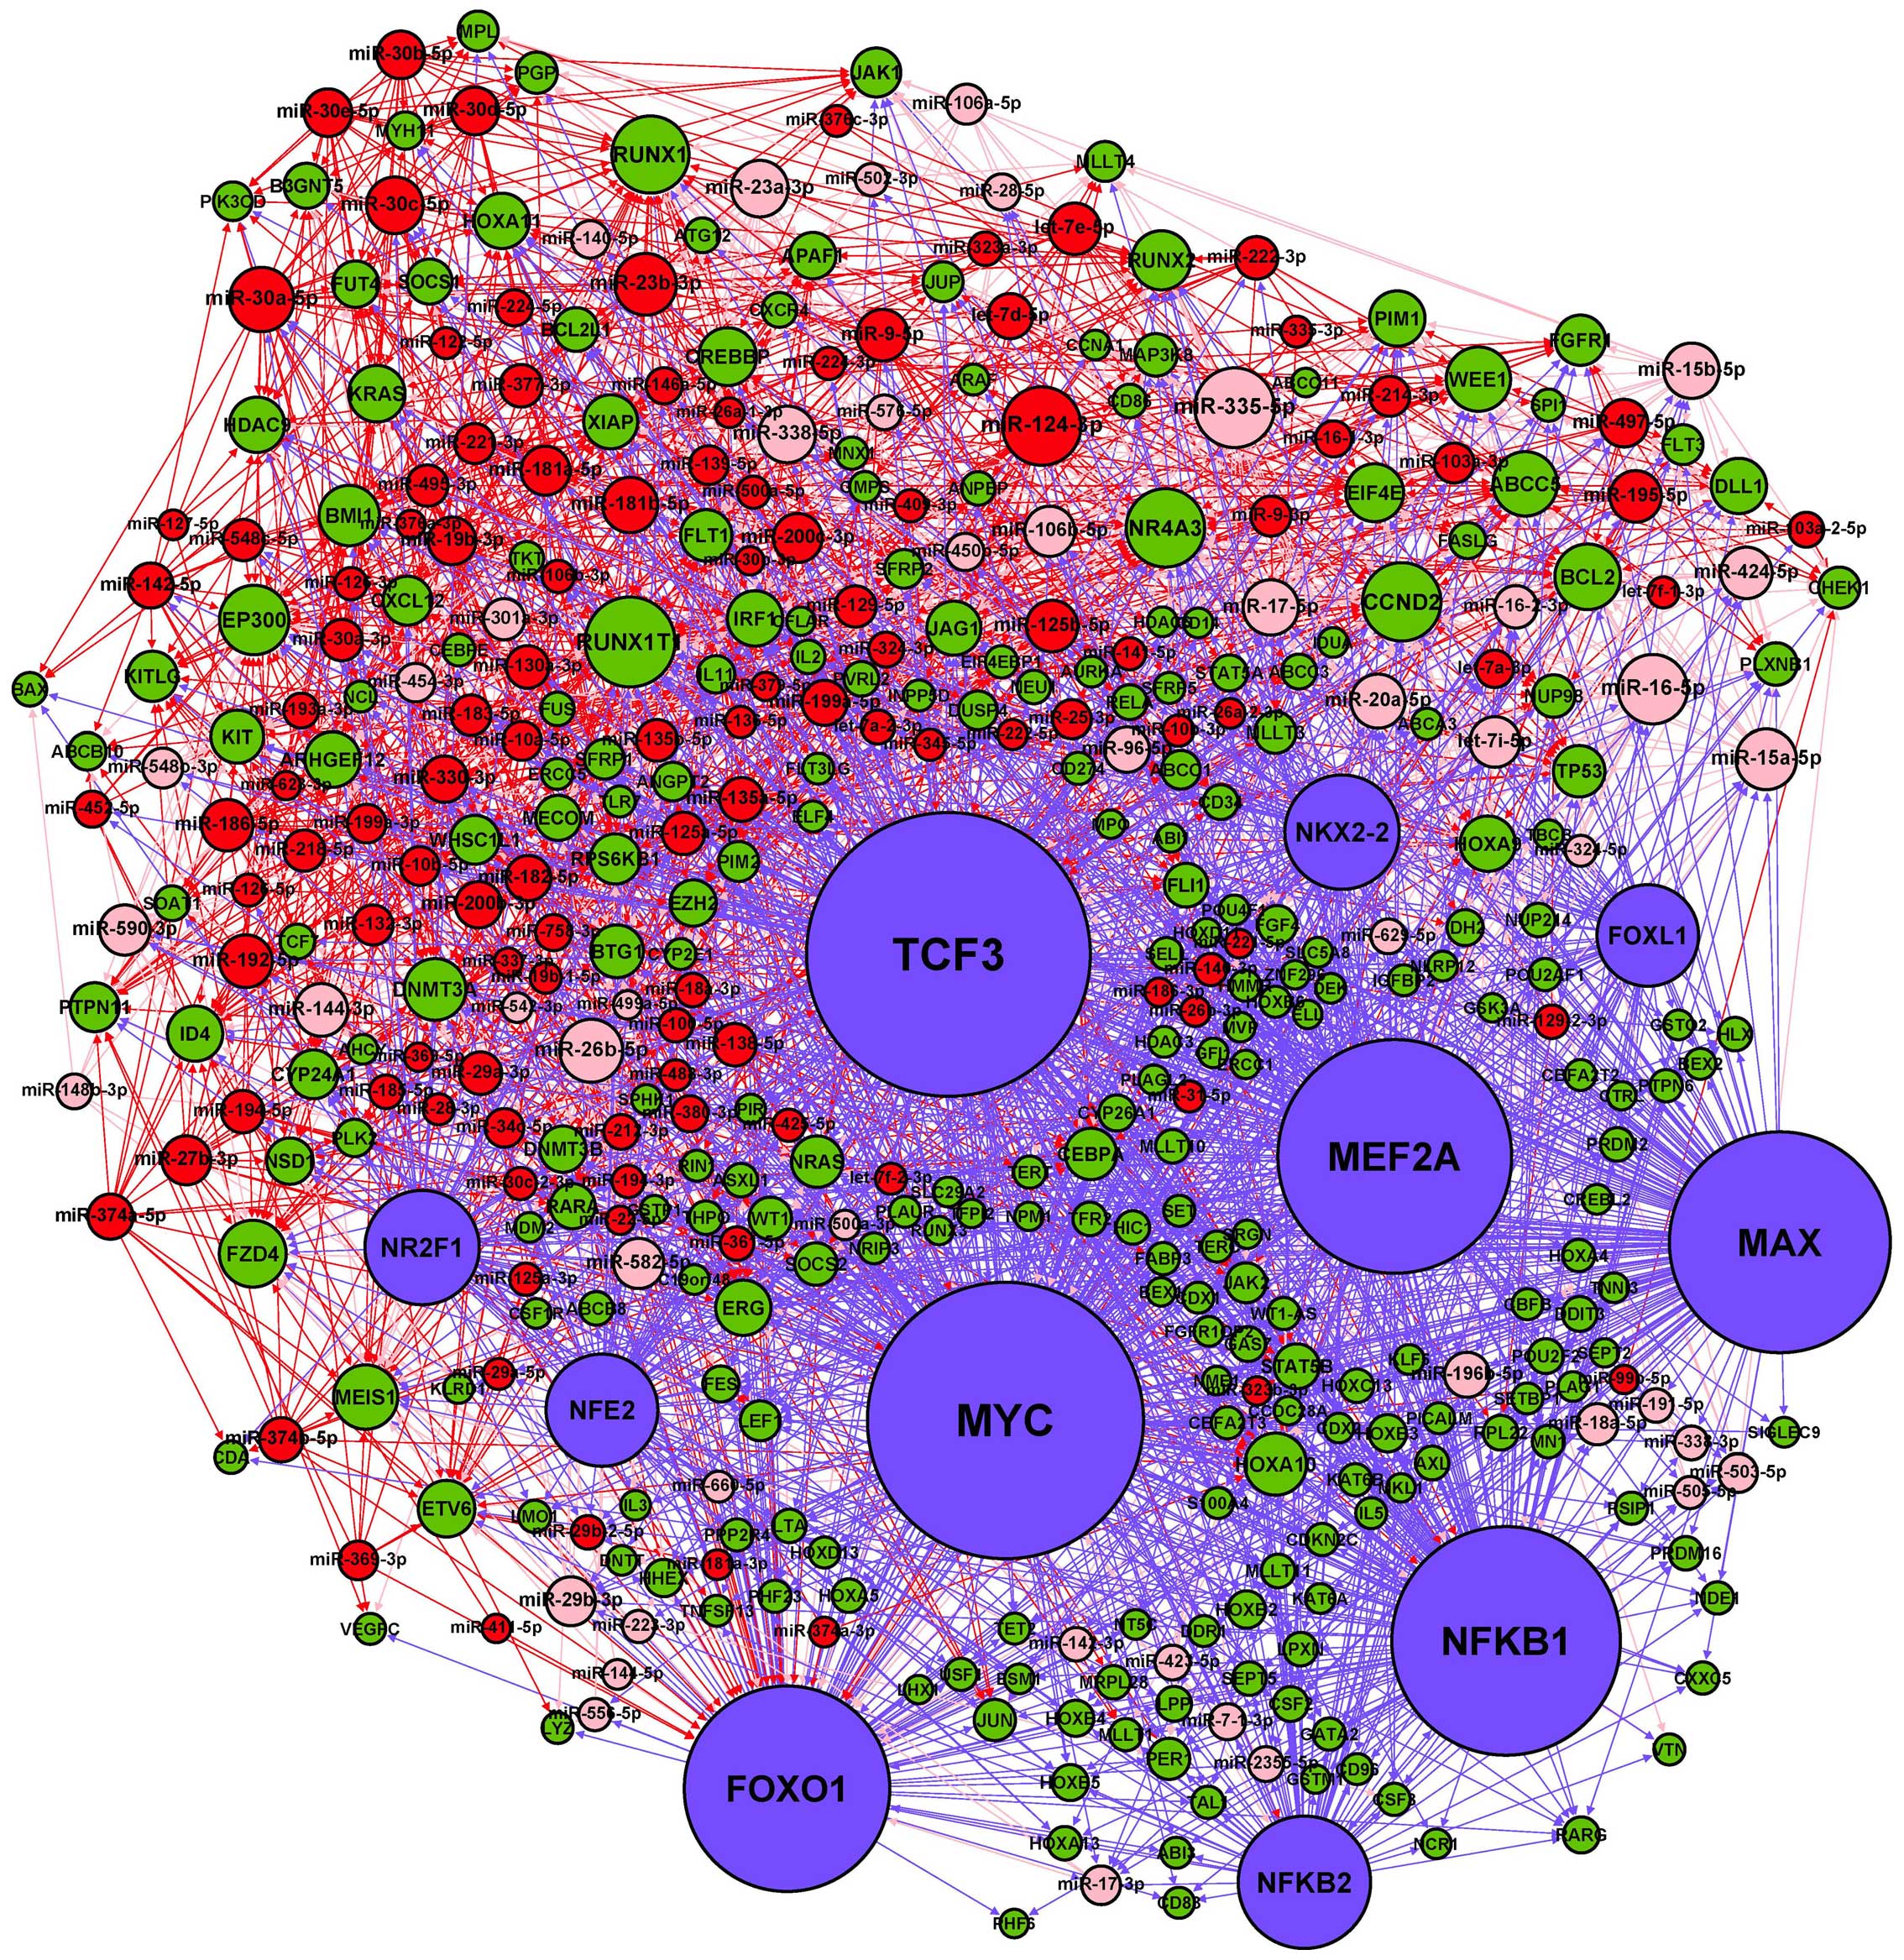
The basic integrated regulatory network for miRNA
and TF consists of three types of interactions: miRNA→gene
(including miRNA→TF), TF→miRNA and TF→gene regulatory relations.
After removing a few isolated nodes, we merged the three regulatory
relations and constructed a miRNA-TF regulatory network for AML
(Fig. 3). The numbers of nodes and
pairs in the network are listed in Table V. Among the AML-related miRNAs in
the network, most of (117/173) them are upregulated. Moreover,
there were three pairs of miRNA→gene regulatory relationships
(miR-126-5p and miR-126-3p represses PLK2 and miR-17-5p represses
RUNX1) that have been experimentally confirmed in AML (30,31).
Two TFs (NFKB1 and MYC) in this network have been reportedly
associated with the development of AML (32,33).
NFKB1 and MYC transcriptionally suppressed miR-29b-3p expression by
binding to its promoter, and MYC was confirmed as a transcriptional
repressor of miR-15a-5p, which were in accord with the same
TF→miRNA regulatory relationships in our network (34,35).
As key regulators of gene expression, miRNAs and TFs may
reciprocally regulate each other to form FBLs, or co-regulate the
expression of the same targets to form FFLs (18). In our miRNA-TF regulatory network,
we identified 13 FBL and 1156 FFL motifs, reflecting the tight
relationships between miRNAs and TFs in the network.
| Table VSummary of relationships in the
AML-related miRNA and transcription factor (TF) regulatory
network. |
Table V
Summary of relationships in the
AML-related miRNA and transcription factor (TF) regulatory
network.
| Relationship | No. of pairs | No. of miRNAs | No. of genes | No. of TFs. |
|---|
| miRNA-genea | 1462 | 173 | 150 | - |
| miRNA-TFb | 64 | 49 | - | 5 |
| TF-genec | 982 | - | 264 | 10 |
| TF-miRNAd | 296 | 114 | - | 11 |
Biological functions of the miRNA-TF
regulatory network
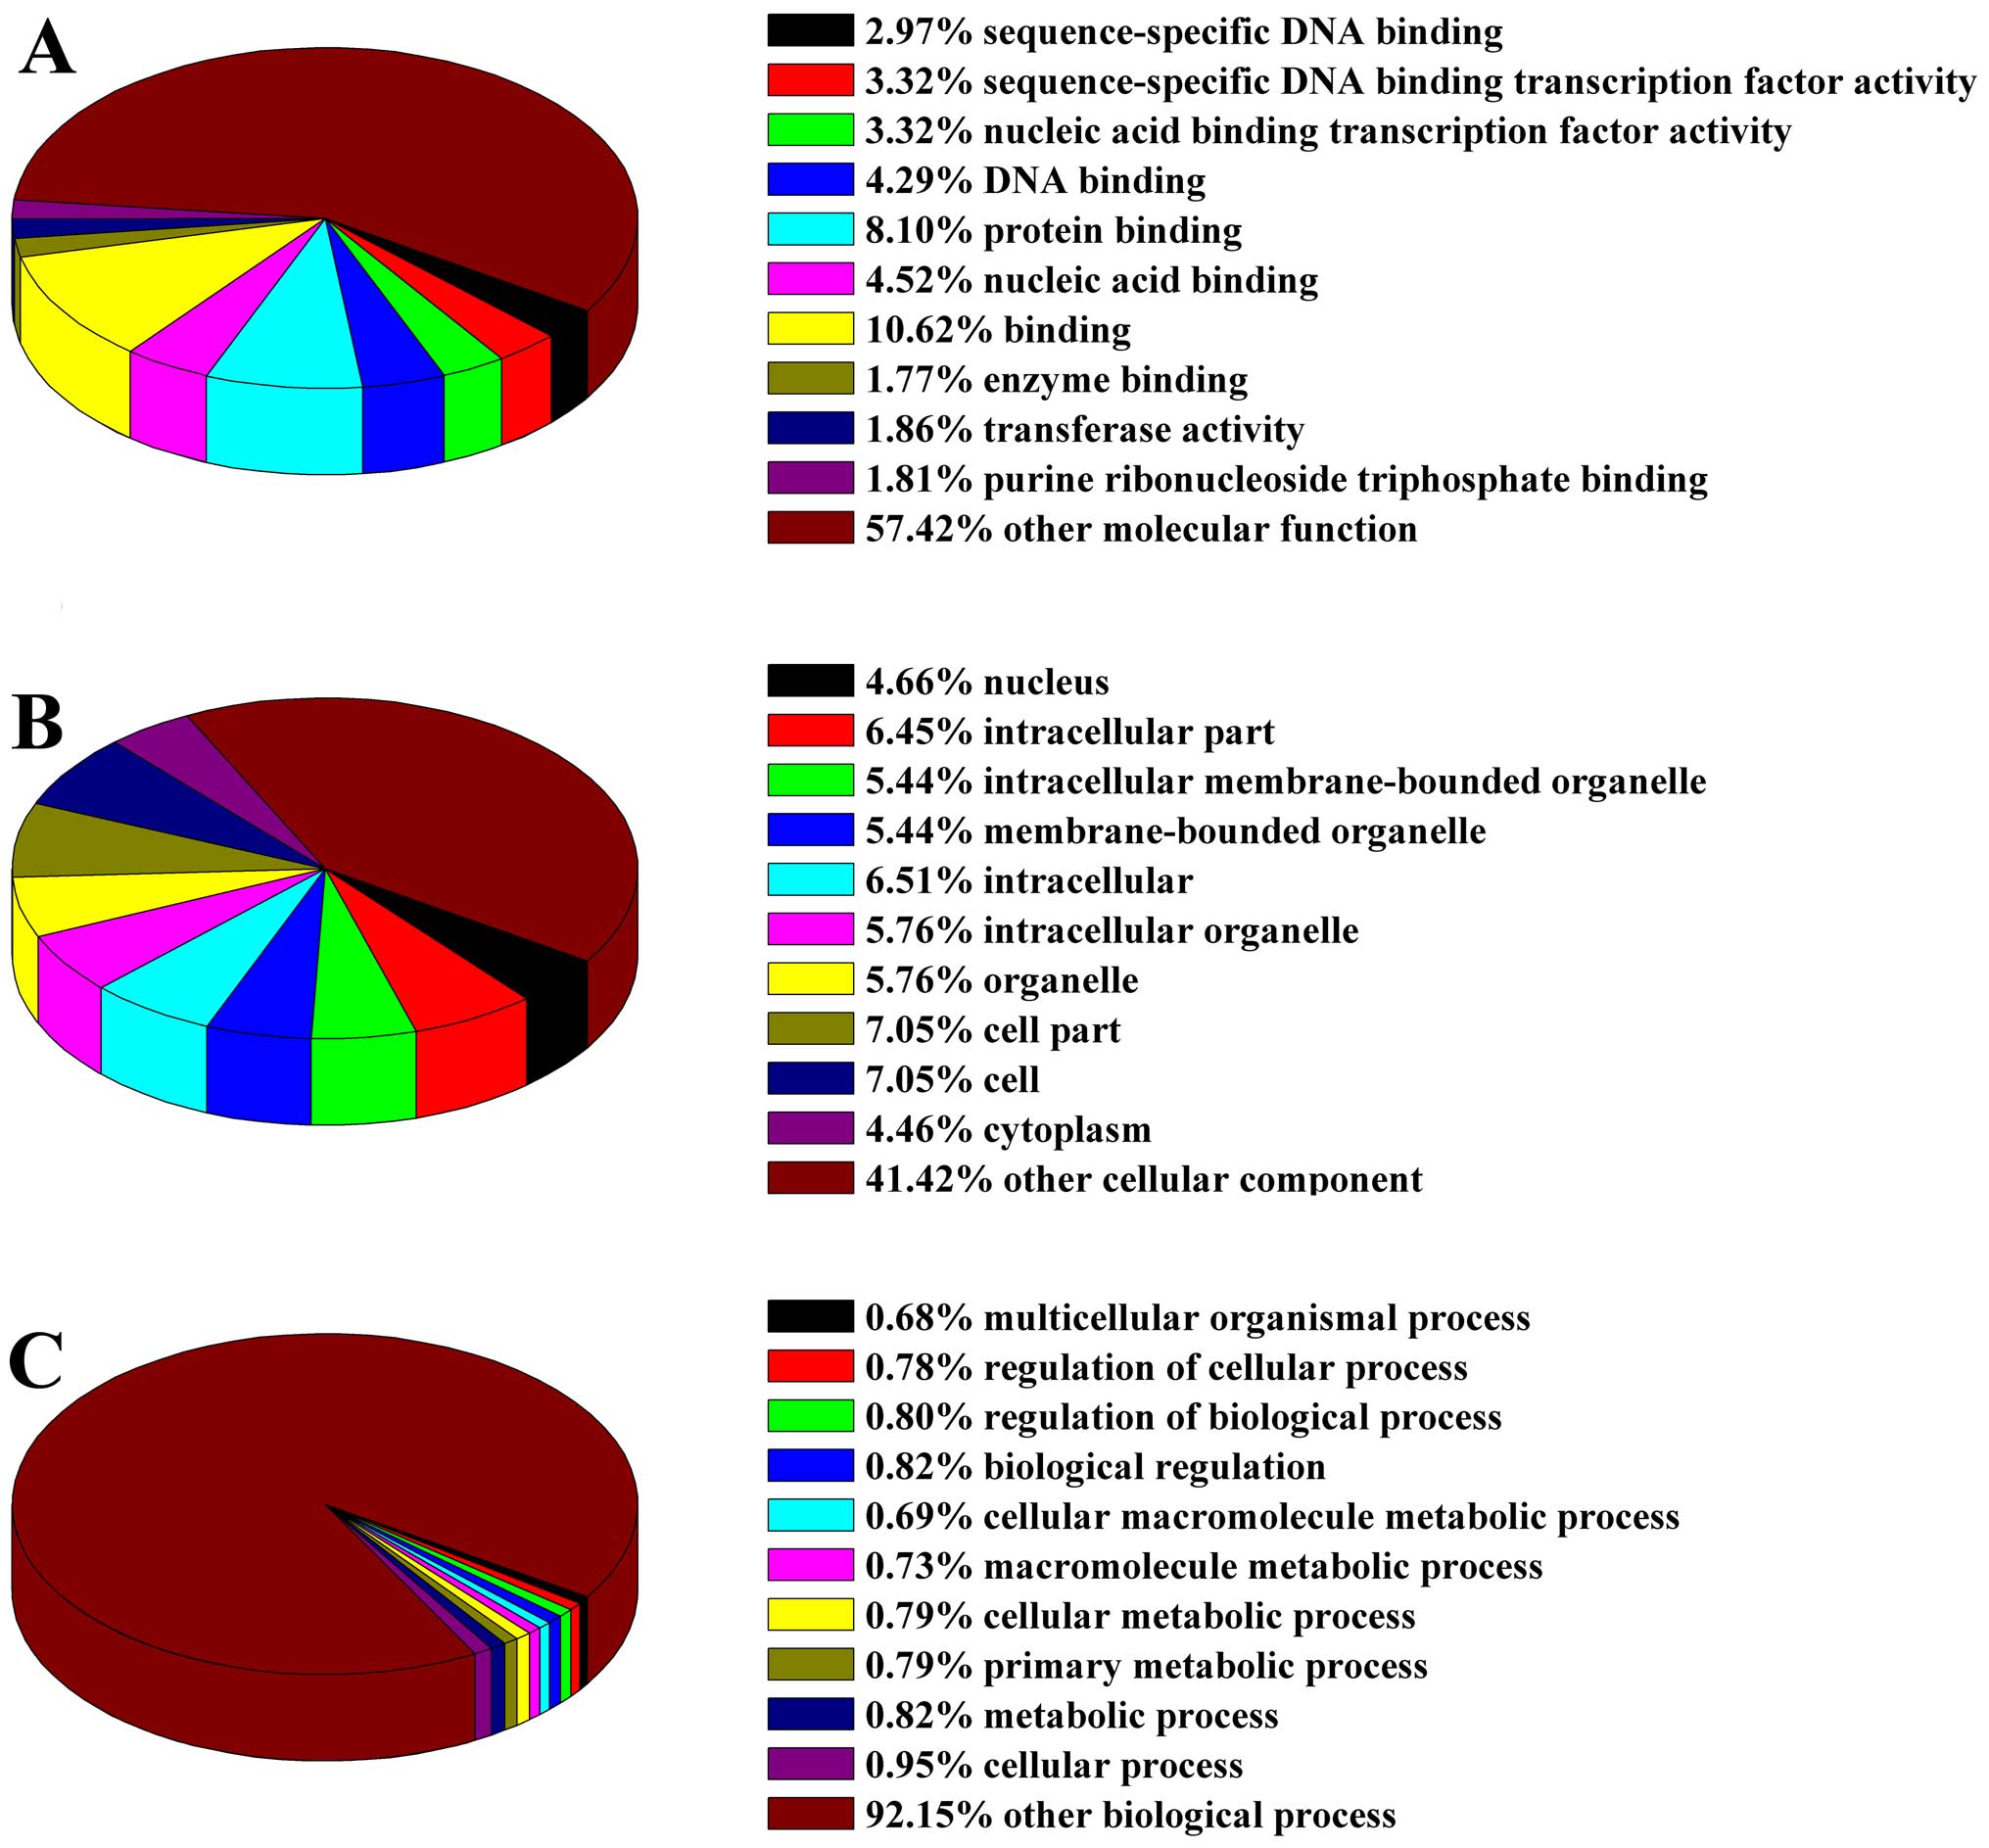
To investigate the functional groupings of the
miRNA-TF regulatory network in AML, we applied the DAVID database
to classify the distinct network nodes according to their GO
molecular function, cellular component and biological process terms
(Fig. 4). In the GO molecular
function classification, a large proportion of nodes associated
with binding, protein binding and nucleic acid binding (Fig. 4A). The nodes related to cellular
components were mainly located in the cell parts, cell and
intracellular (Fig. 4B). The GO
biological processes classification showed that nodes were mainly
involved in cellular process, metabolic process and biological
regulation (Fig. 4C). To ascertain
which pathways are enriched in the network nodes, KEGG pathway
analysis was also performed by using the DAVID database. The
results indicate that the nodes were significantly enriched in 33
different pathways, of which the AML pathway was the most
significant followed by the pathways in cancer and Jak-STAT
signaling pathways (Table VI).
Among these pathways, 17 were related to hematopoiesis and
leukemia. In addition, AML pathway, apoptosis pathway, Jak-STAT
signaling pathway, MAPK signaling pathway, Wnt signaling pathway,
p53 signaling pathway, cell cycle pathway and ABC transporter
pathway have been previously experimentally verified to be involved
in AML (2,36–42).
| Table VIPathway analysis for network nodes in
AML-related miRNA and transcription factor regulatory network. |
Table VI
Pathway analysis for network nodes in
AML-related miRNA and transcription factor regulatory network.
| Pathway ID | Definition | Gene count | % | Fisher-P-value |
|---|
| hsa05221 | Acute myeloid
leukemia | 24 | 9.09 | 1.31E-21 |
| hsa05200 | Pathways in
cancer | 43 | 16.29 | 5.77E-18 |
| hsa04630 | Jak-STAT signaling
pathway | 22 | 8.33 | 1.21E-09 |
| hsa05220 | Chronic myeloid
leukemia | 15 | 5.68 | 1.32E-08 |
| hsa05215 | Prostate
cancer | 16 | 6.06 | 1.67E-08 |
| hsa04640 | Hematopoietic cell
lineage | 15 | 5.68 | 8.18E-08 |
| hsa04210 | Apoptosis | 12 | 4.55 | 2.65E-05 |
| hsa05210 | Colorectal
cancer | 11 | 4.17 | 1.05E-04 |
| hsa04060 | Cytokine-cytokine
receptor interaction | 19 | 7.20 | 3.44E-04 |
| hsa05222 | Small cell lung
cancer | 10 | 3.79 | 5.23E-04 |
| hsa05213 | Endometrial
cancer | 8 | 3.03 | 5.57E-04 |
| hsa04012 | ErbB signaling
pathway | 10 | 3.79 | 6.78E-04 |
| hsa05211 | Renal cell
carcinoma | 9 | 3.41 | 6.95E-04 |
| hsa04660 | T cell receptor
signaling pathway | 11 | 4.17 | 8.30E-04 |
| hsa05212 | Pancreatic
cancer | 9 | 3.41 | 8.41E-04 |
| hsa05219 | Bladder cancer | 7 | 2.65 | 0.001013 |
| hsa05216 | Thyroid cancer | 6 | 2.27 | 0.001129 |
| hsa02010 | ABC
transporters | 7 | 2.65 | 0.001302 |
| hsa04722 | Neurotrophin
signaling pathway | 11 | 4.17 | 0.002384 |
| hsa04010 | MAPK signaling
pathway | 17 | 6.44 | 0.003123 |
| hsa04310 | Wnt signaling
pathway | 12 | 4.54 | 0.003263 |
| hsa05218 | Melanoma | 8 | 3.03 | 0.00355 |
| hsa04910 | Insulin signaling
pathway | 11 | 4.17 | 0.004425 |
| hsa04662 | B cell receptor
signaling pathway | 8 | 3.03 | 0.004828 |
| hsa04520 | Adherens
junction | 8 | 3.03 | 0.005583 |
| hsa04916 | Melanogenesis | 9 | 3.41 | 0.006365 |
| hsa04110 | Cell cycle | 10 | 3.79 | 0.008204 |
| hsa04672 | Intestinal immune
network for IgA production | 6 | 2.27 | 0.01157 |
| hsa04650 | Natural killer cell
mediated cytotoxicity | 10 | 3.79 | 0.012086 |
| hsa04664 | Fc epsilon RI
signaling pathway | 7 | 2.65 | 0.021766 |
| hsa04620 | Toll-like receptor
signaling pathway | 8 | 3.03 | 0.022915 |
| hsa05214 | Glioma | 6 | 2.27 | 0.031252 |
| hsa04115 | p53 signaling
pathway | 6 | 2.27 | 0.04151 |
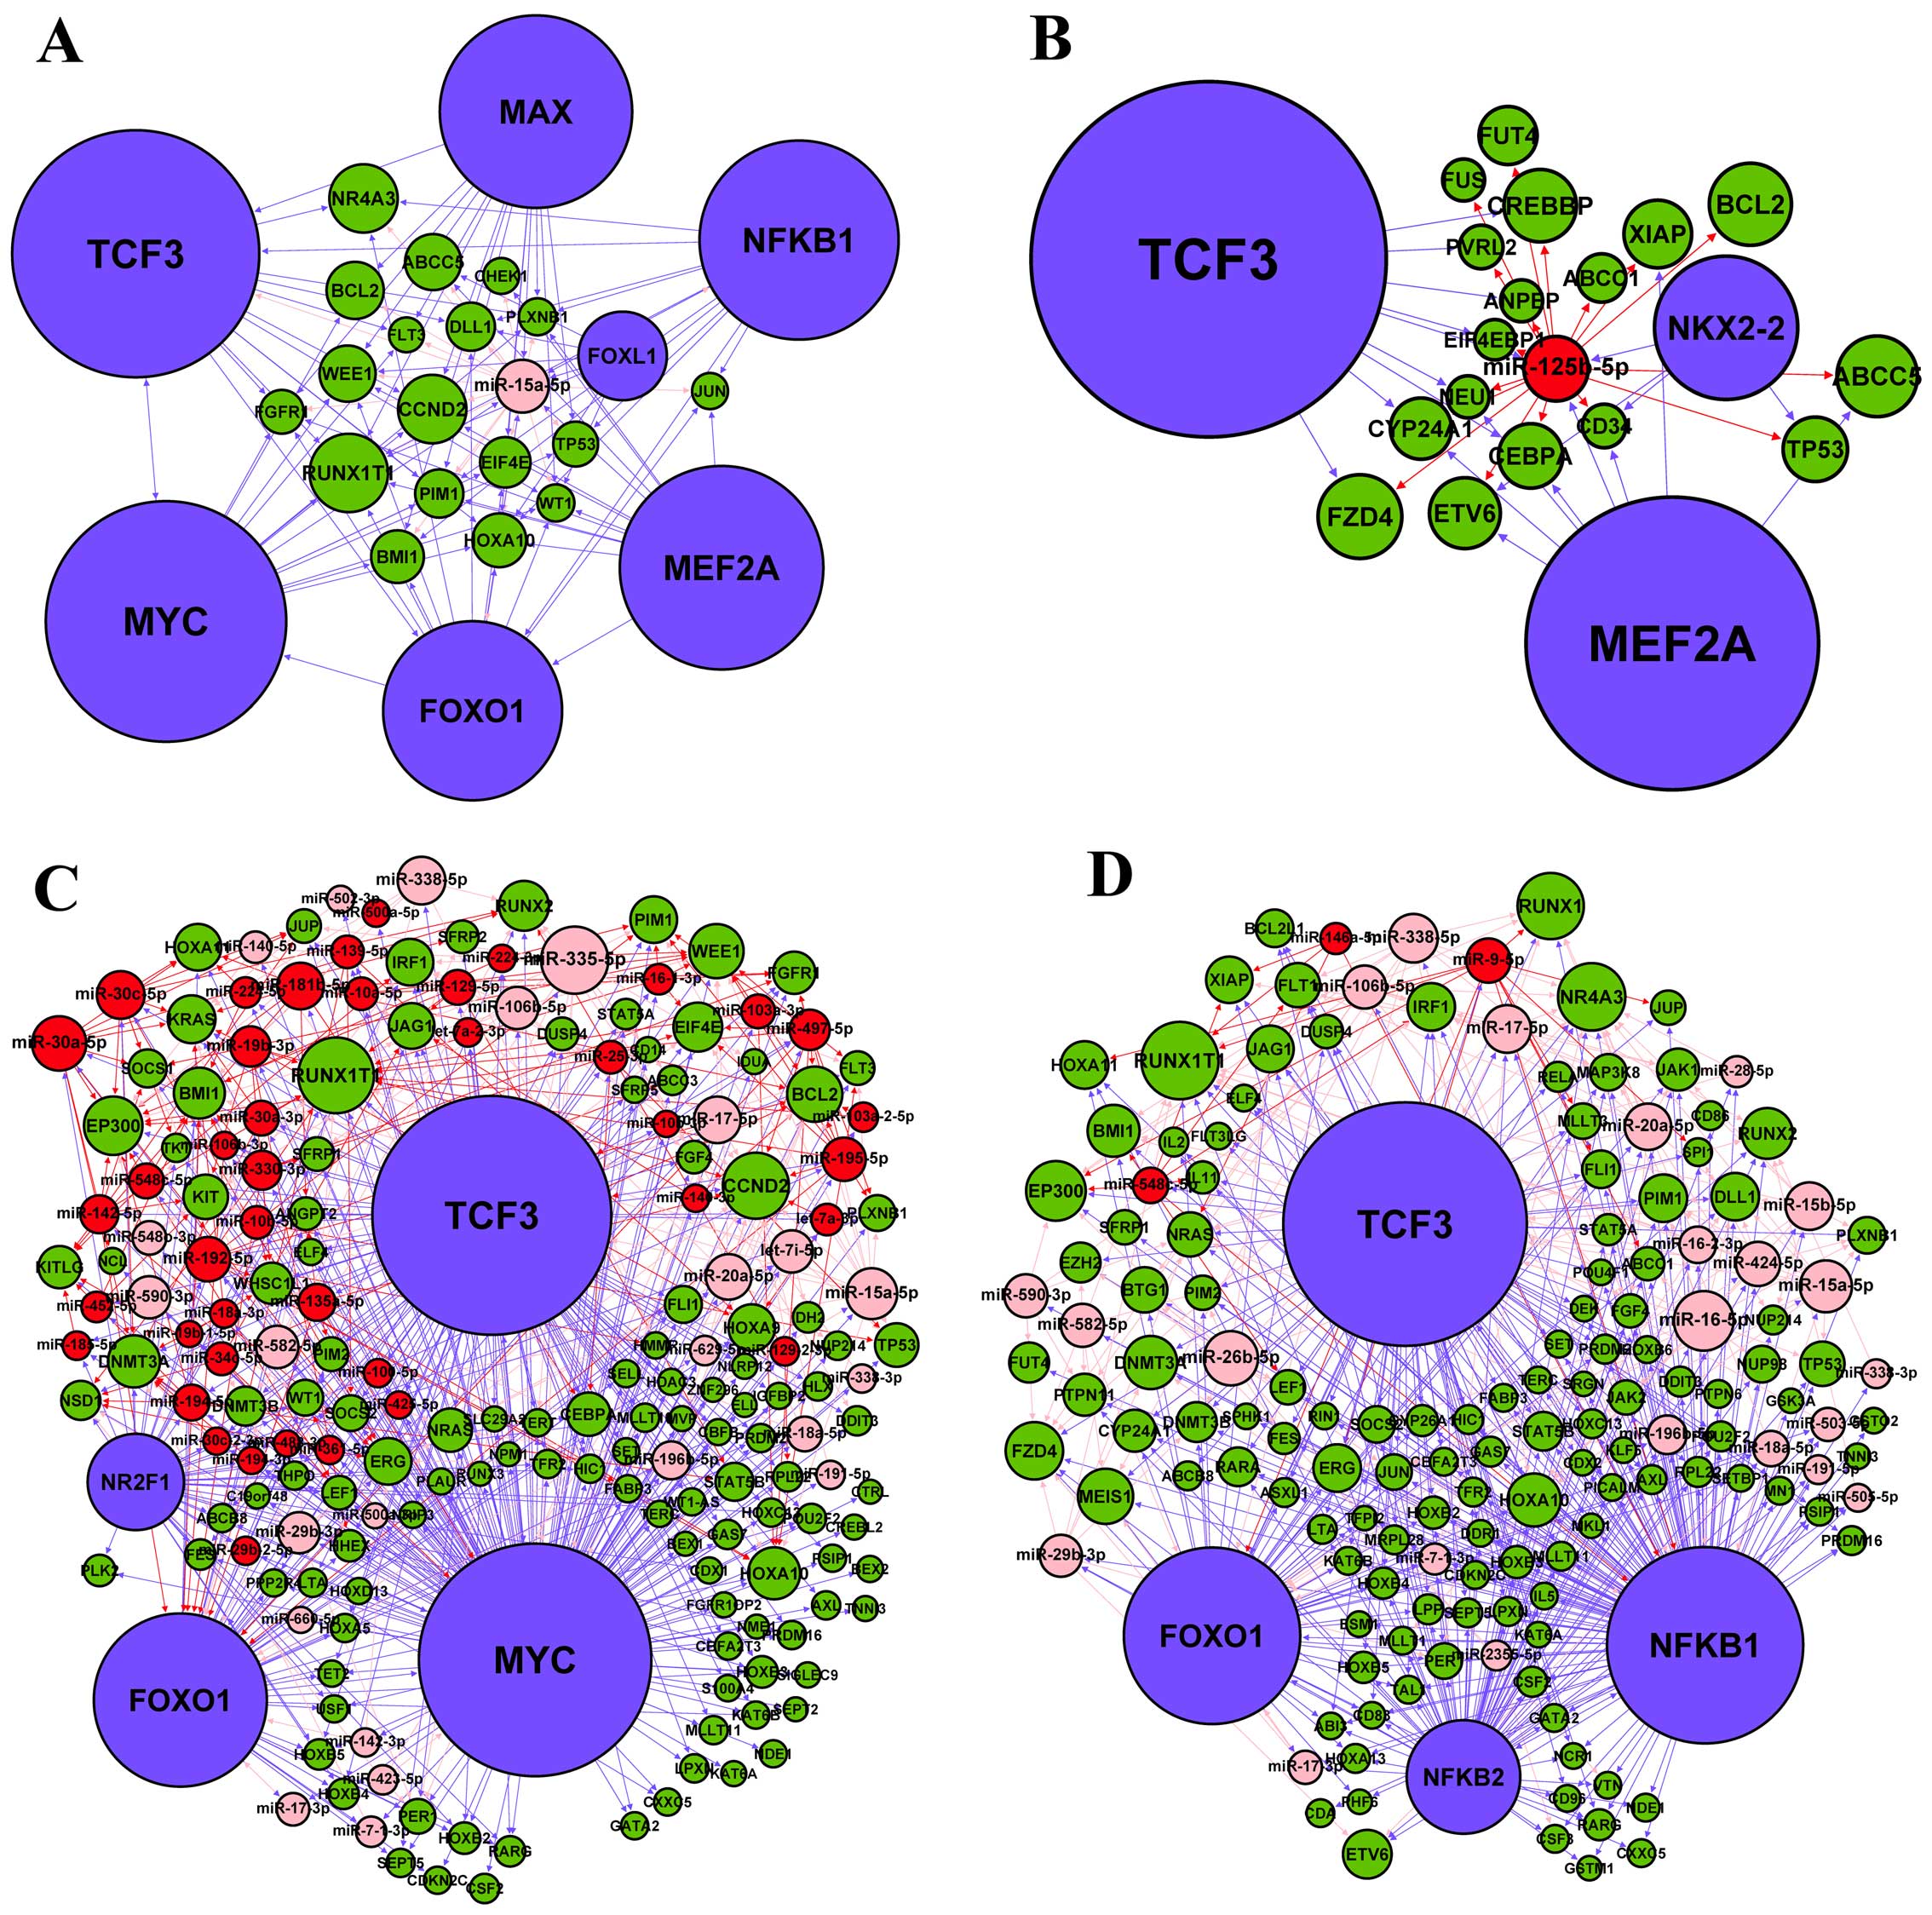
Network hubs and subnetworks for hubs in
the miRNA-TF regulatory network
To ascertain which nodes potentially have the most
influence on the overall behavior of the networks, we identified
the hub nodes based on the highest total degrees inside the
network. As shown in Tables VII
and VIII, 22 miRNAs and 11 TFs
were defined as hub nodes, which having a total degree ≥20. It is
of interest that five of the 22 hub miRNAs belonged to the miR-15
family, namely
miR-15a-5p/miR-15b-5p/miR-16-5p/miR-424-5p/miR-195-5p (Table VII), further indicating the
important role of the miR-15 family in the regulatory network of
AML. Notably, more than half of the 11 hub TFs were either
notorious leukemia regulators, such as NFE2 (43) and MYC (33), or related to leukemia development
and progression, such as NFKB1 (32), TCF3 (44), MAX (45) and FOXO1 (46). These findings are a preliminary
reflection on the robustness of our network. Among these hub nodes,
two hub miRNAs (miR-15a-5p and miR-125b-5p) and two hub TFs (MYC
and NFKB1) have been previously implicated in AML (12,32,33,47).
To further investigate the regulation of the four hub nodes, we
extracted their subnetworks by including all their directly linked
nodes in the miRNA-TF regulatory network (Fig. 5). The subnetwork analysis indicated
that many pathways related to AML and other cancers (Table IX), which suggested that
miR-15a-5p, miR-125b-5p, MYC and NFKB1 were important in cancer
development including AML. In addition, TCF3 stood out as a
promising regulator and gene, which links to all the four
subnetworks. As a TF, it regulates miR-125b-5p (Fig. 5B) and MYC (Fig. 5C); while in its capacity as a gene,
it is regulated by miR-15a-5p (Fig.
5A), MYC (Fig. 5C) and NFKB1
(Fig. 5D). In particular, 17
predicted target genes (CEBPA, FLT3, STAT5A, RELA, STAT5B, PIM1,
SPI1, RUNX1T1, LEF1, PIM2, KIT, JUP, NRAS, EIF4EBP1, KRAS, RARA and
MYC) of TCF3 in the four subnetworks participated in the AML
pathway. These analyses suggest that TCF3 may play an important
role in the miRNA-TF regulatory network linked to AML.
| Table VIIHub miRNAs in AML-related miRNA and
transcription factor regulatory network. |
Table VII
Hub miRNAs in AML-related miRNA and
transcription factor regulatory network.
| Top | miRNA | In-degree | Out-degree | Total degree |
|---|
| 1 | miR-335-5p | 1 | 41 | 42 |
| 2 | miR-124-3p | 0 | 41 | 41 |
| 3 | miR-16-5p | 4 | 30 | 34 |
| 4 | miR-30a-5p | 4 | 26 | 30 |
| 5 | miR-26b-5p | 1 | 28 | 29 |
| 6 | miR-23b-3p | 0 | 28 | 28 |
| 7 | miR-15a-5p | 6 | 21 | 27 |
| 8 | miR-23a-3p | 0 | 24 | 24 |
| 9 | miR-338-5p | 3 | 21 | 24 |
| 10 | miR-30c-5p | 4 | 20 | 24 |
| 11 | miR-15b-5p | 4 | 19 | 23 |
| 12 | miR-17-5p | 7 | 16 | 23 |
| 13 | miR-181b-5p | 4 | 19 | 23 |
| 14 | miR-20a-5p | 7 | 15 | 22 |
| 15 | miR-144-3p | 0 | 21 | 21 |
| 16 | miR-192-5p | 3 | 18 | 21 |
| 17 | miR-424-5p | 5 | 15 | 20 |
| 18 | let-7e-5p | 0 | 20 | 20 |
| 19 | miR-125b-5p | 3 | 17 | 20 |
| 20 | miR-186-5p | 1 | 19 | 20 |
| 21 | miR-195-5p | 3 | 17 | 20 |
| 22 | miR-9-5p | 1 | 19 | 20 |
| Table VIIIHub transcription factors in
AML-related miRNA and transcription factor regulatory network. |
Table VIII
Hub transcription factors in
AML-related miRNA and transcription factor regulatory network.
| Top | Transcription
factor | In-degree | Out-degree | Total degree |
|---|
| 1 | TCF3 | 14 | 192 | 206 |
| 2 | MYC | 9 | 186 | 195 |
| 3 | MEF2A | 0 | 167 | 167 |
| 4 | NFKB1 | 8 | 153 | 161 |
| 5 | MAX | 0 | 152 | 152 |
| 6 | FOXO1 | 43 | 98 | 141 |
| 7 | NFKB2 | 3 | 80 | 83 |
| 8 | NFE2 | 0 | 73 | 73 |
| 9 | NR2F1 | 0 | 73 | 73 |
| 10 | NKX2-2 | 0 | 71 | 71 |
| 11 | FOXL1 | 0 | 59 | 59 |
| Table IXPathways enriched among the nodes of
four subnetworks. |
Table IX
Pathways enriched among the nodes of
four subnetworks.
| Subnetwork | Enriched pathway of
subnetwork nodesa | P-value |
|---|
| miR-15a-5p | Pathways in
cancer | 2.66E-07 |
| Acute myeloid
leukemia | 3.25E-05 |
| Small cell lung
cancer | 1.40E-04 |
| Prostate
cancer | 1.75E-04 |
| Cell
cycle | 6.46E-04 |
| MAPK signaling
pathway | 0.001412 |
| Colorectal
cancer | 0.002502 |
| Neurotrophin
signaling pathway | 0.007495 |
| Wnt signaling
pathway | 0.012855 |
| p53 signaling
pathway | 0.021056 |
| Chronic myeloid
leukemia | 0.025301 |
|
Apoptosis | 0.033319 |
| miR-125b-5p | Pathways in
cancer | 0.001898 |
| Colorectal
cancer | 0.024629 |
| Small cell lung
cancer | 0.024629 |
|
Apoptosis | 0.026297 |
| Prostate
cancer | 0.027434 |
| MYC | Acute myeloid
leukemia | 5.58E-13 |
| Pathways in
cancer | 3.73E-08 |
| Prostate
cancer | 4.59E-05 |
| Jak-STAT
signaling pathway | 2.55E-04 |
| Thyroid cancer | 2.55E-04 |
| Wnt signaling
pathway | 0.001212 |
| Chronic myeloid
leukemia | 0.001297 |
| Hematopoietic cell
lineage | 0.002388 |
| Endometrial
cancer | 0.002413 |
| Melanogenesis | 0.004401 |
| Melanoma | 0.007421 |
| MAPK signaling
pathway | 0.008221 |
| Bladder cancer | 0.010721 |
| Cell
cycle | 0.011628 |
| Colorectal
cancer | 0.013264 |
| ErbB signaling
pathway | 0.014936 |
| Insulin signaling
pathway | 0.015823 |
| NFKB1 | Acute myeloid
leukemia | 2.05E-12 |
| Pathways in
cancer | 8.66E-11 |
| Jak-STAT
signaling pathway | 2.73E-09 |
| Chronic myeloid
leukemia | 2.73E-06 |
| T cell receptor
signaling pathway | 4.17E-05 |
| Prostate
cancer | 6.79E-04 |
| MAPK signaling
pathway | 0.004636 |
| Pancreatic
cancer | 0.011110 |
| B cell receptor
signaling pathway | 0.012775 |
| Neurotrophin
signaling pathway | 0.016993 |
| Small cell lung
cancer | 0.018703 |
| Hematopoietic cell
lineage | 0.020218 |
| NFKB1 |
Apoptosis | 0.021003 |
| Toll-like receptor
signaling pathway | 0.033987 |
| Wnt signaling
pathway | 0.036016 |
| Cytokine-cytokine
receptor interaction | 0.038854 |
| Adipocytokine
signaling pathway | 0.047655 |
| Thyroid cancer | 0.048101 |
| Epithelial cell
signaling in Helicobacter pylori infection | 0.049434 |
Discussion
AML is the most common form of aggressive leukemia
in adults (1,2). Despite extensive efforts to elucidate
the cytogenetic and molecular genetic mechanisms involved in
disease occurrence and development, the pathogenesis of AML is
still not fully understood due to the heterogeneity and complexity
of this disease. The genomic complexity makes it difficult to
identify hub regulators or genes in the pathogenesis of AML. By
integrating diverse data sources, systems biology approaches
provide a powerful tool for exploring the interactions and
searching for key regulators between disease candidate genes on the
network level, which may help to explain key aspects of disease
pathogenesis and leading to new candidates for the putative
therapeutic targets (48).
As major regulators of gene expression, miRNAs and
TFs can function as tumor suppressors or oncogenes in a cooperative
way to control gene expression, which triggering global alterations
of genetic programs are involved in cell proliferation,
differentiation, development and apoptosis in multiple human
cancers (18). Ye et al
(49) constructed a miRNA-TF
regulatory network in T-cell acute lymphoblastic leukemia and
demonstrated the roles of miR-19 (hub miRNA) and CYLD (hub gene) in
the T-cell leukemogenesis. Therefore, understanding and applying
regulatory network information for TF-miRNA-target genes could
provide clues for key driver miRNAs and genes in human cancers and
subsequently suggest novel therapeutic targets (50).
In the present study, we applied miRNA sequencing
and TF array technology to quantitatively analyze the differential
expression profiles of miRNAs and TFs, respectively, in bone marrow
samples of AML patients and their age-matched controls (Fig. 1). The expression profiling data
showed that 308 miRNAs and 84 TFs were differentially expressed
(fold-change ≥2.0) in AML samples relative to their controls, with
a subset of these findings further validated by qPCR (Fig. 2). It is difficult to achieve by
only direct experimental methods to systematically infer the
comprehensive miRNA-TF regulatory network, which has promoted
development of computational approaches. Therefore, we integrated
expression profiling data of miRNAs and TFs, computational miRNA
and TF target prediction, and AML candidate genes obtained from
MalaCards database to construct a miRNA and TF regulatory network
specifically for AML (Fig. 3),
which might provide important insights into the pathogenesis of
AML. Moreover, we found that some miRNA→gene and TF→miRNA
regulatory relationships in our network have been experimentally
verified in previous studies. For further network functional
evaluation, GO category and KEGG pathway annotation were applied to
analyze the network node pool (Fig.
4 and Table VI). Among 33
enriched pathways, the AML pathway was the most significant
(Table VI), more than half of
these pathways were related to hematopoiesis and leukemia
development, and eight pathways have been reported to be implicated
in AML pathogenesis. These results preliminarily confirmed the
reliability of our network.
In the miRNA-TF regulatory network, we identified 22
hub miRNAs and 11 hub TFs. With a large number of nodes linked to
them, these hubs have the most influence on the networks overall
behavior, which likely play critical regulatory roles in AML. To
decipher this massive and complex network, and mine the key
regulatory components, we subsequently constructed the subnetworks
(Fig. 5) from two hub miRNAs
(miR-15a-5p and miR-125b-5p) and two hub TFs (MYC and NFKB1) which
were well-known regulators in AML. miR-15a-5p plays an important
role in myeloid and erythroid differentiation, which was reported
as a tumor suppressor in multiple myeloma, chronic lymphocytic
leukemia and AML cells (51,52).
Overexpression of miR-15a-5p significantly inhibited AML cell
proliferation by downregulating the WT1 oncogene (51). miR-125b-5p is an oncogenic miRNA,
which was highly expressed in AML carrying the t(2;11)(p21;q23)
translocation and inhibited myeloid differentiation (12). Mice overexpressing miR-125b-5p
causes a highly aggressive myeloid leukemia related to targeting
the gene Lin28A (53). MYC is a
basic transcription factor of the helix-loop-helix-leucine zipper
family, which is found upregulated in AML and has been shown to
block the myeloid cell differentiation (33). Retroviral transduction of MYC into
murine bone marrow cells results in AML development (33,54).
Similarly, sustained expression of a human MYC transgene culminated
in the formation of AML in mice (33). NFKB1 is a transcription factor that
is constitutively activated in primitive human AML cells, while
inhibition of NFKB1 displayed a rapid induction of apoptosis in AML
cells (32,55). After analyzing the topology of
subnetwork, we found that TCF3 was a potential key regulator in our
network due to its direct linking to all the four hubs in the
subnetworks (Fig. 5), which may
establish cross-talk among these subnetworks. In particular, TCF3
was predicted to regulate 17 target genes which have been involved
in AML pathway in the four subnetworks. As a member of the TCF/LEF
transcription factor family, TCF3 is essential for development,
lymphopoiesis and stem cell function (44,56).
Emerging evidence suggests that TCF3 is involved in the
pathogenesis of several types of human cancer including colorectal
cancer, prostate cancer and breast cancer (57–59).
Furthermore, the t(1;19) translocation between TCF3 and PBX1 genes
causes expression of a TCF3-PBX1 fusion protein, and has been
identified in B-cell acute lymphoblastic leukemia (B-ALL), which
established a potential relationship between TCF3 and the etiology
of B-ALL (44). However, the exact
molecular mechanism of TCF3 as it relates to AML occurrence and
development is still unknown.
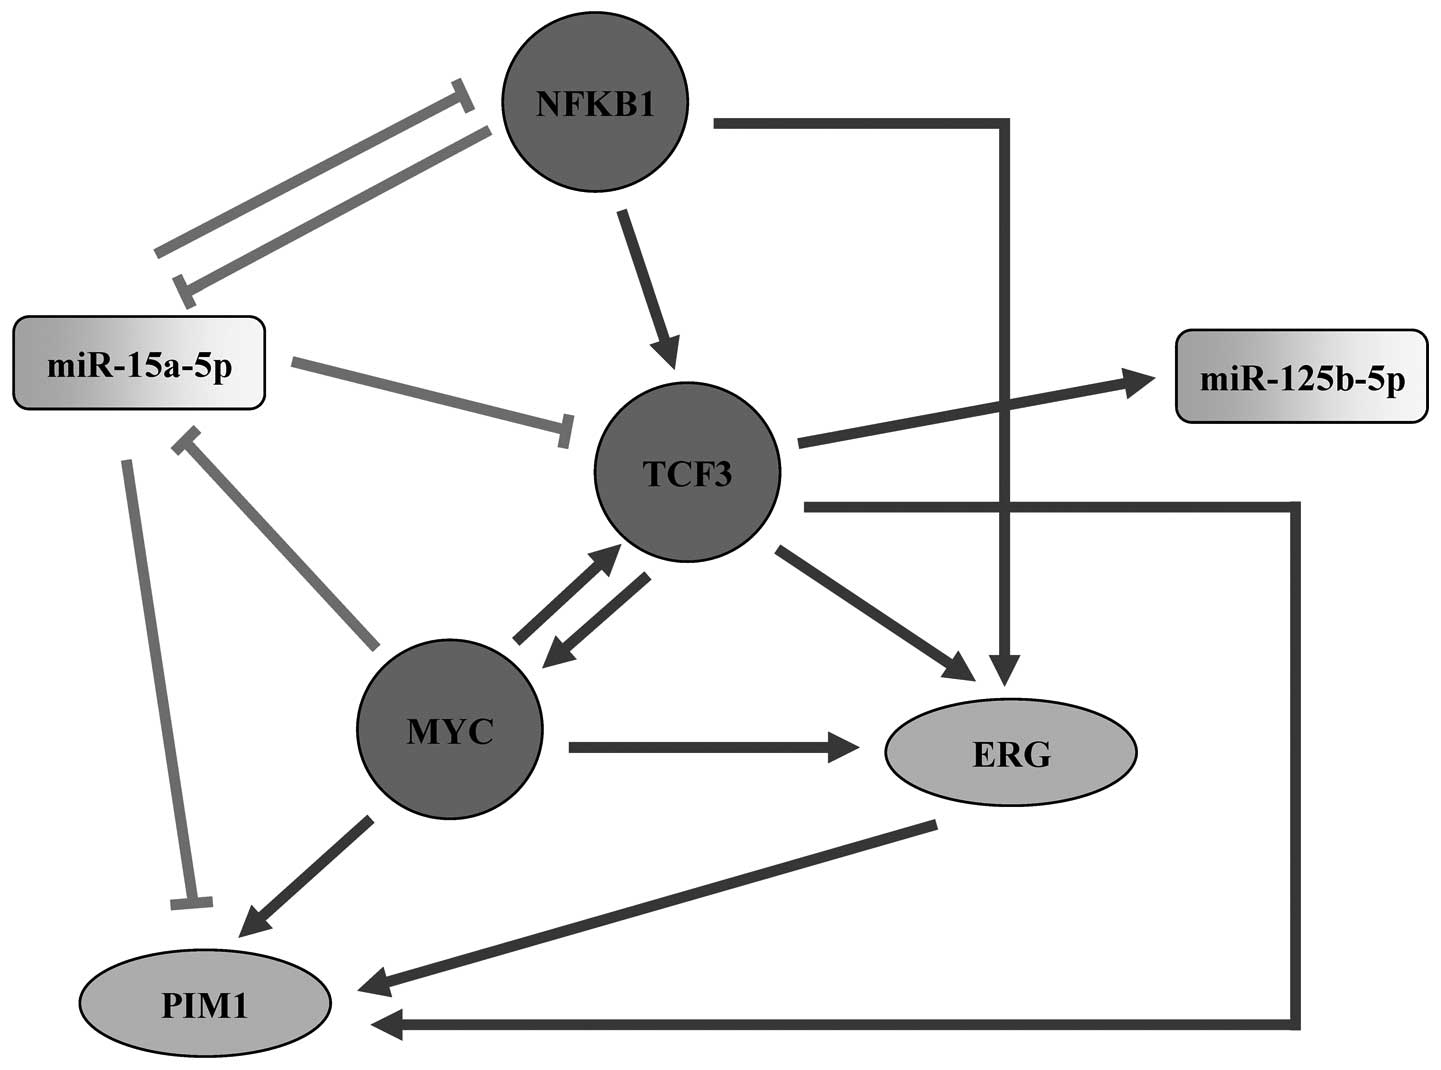
In the subnetworks, TCF3 was potentially targeted by
miR-15a-5p, MYC and NFKB1, and also targeting miR-125b-5p, MYC, ERG
and PIM1 (Fig. 5). ERG is a
megakaryocytic oncogene, which is required for normal
megakaryopoiesis and play crucial role in establishing definitive
hematopoiesis (60). A high
expression level of ERG in AML is associated with poor prognosis
(61). Transgenic expression of
the human ERG causes early progenitor myeloid leukemia in mice
similar to human AML, which was mediated by inducing the expression
of the oncogenic kinase PIM1 through binding to a novel 3′ enhancer
(62). PIM1 is a constitutively
active serine/threonine protein kinase that normally functions in
the proliferation and survival of hematopoietic cells in response
to cytokines and growth factors (63). Overexpression of PIM1 has been
detected in a range of solid cancers and hematologic malignancies
(64). In AML, PIM1 has been
suggested to have important roles in cell proliferation, survival,
homing and migration, and the prognostic relevance of PIM1
upregulation was also observed in high ERG-expressing AML by the
significantly decreased survival of these patients (62). In addition, ERG was the predicted
target of MYC, NFKB1 and TCF3, while PIM1 was predicted to be
regulated by miR-15a-5p, MYC and TCF3 in our subnetworks (Fig. 5). The above discussion led us to
present a model of the involvement of TCF3 and the four hub nodes
in subnetworks within AML (Fig.
6). According to the literature surveys and our subnetwork
analysis, we propose that TCF3 is a potential key regulator in the
miRNA-TF regulatory network linked to AML, which may play its
regulatory role via miR-15a-5p, miR-125b-5p, MYC, NFKB1, ERG or
PIM1.
In summary, this is the first study that describes
the global expression profiling of miRNAs and TFs relating to AML
using miRNA sequencing and TF array technology, respectively.
Applying systems biology approaches to integrate the experimental
data to multiple types of computational prediction on gene
regulation, we constructed a miRNA-TF regulatory network
specifically for AML, which may provide some hub regulators and
clues for exploring the molecular mechanisms of AML. Furthermore,
the present study also provides potential therapeutic targets for
AML and proposes directions for further experimental research.
Acknowledgements
We sincerely thank all donors who participated in
this investigation.
Abbreviations:
|
AML
|
acute myeloid leukemia
|
|
miRNA
|
microRNA
|
|
TF
|
transcription factor
|
|
pri-miRNA
|
primary miRNA
|
|
pre-miRNA
|
precursor miRNA
|
|
3′-UTR
|
3′-untranslated region
|
|
TFBS
|
transcription factor binding site
|
|
TSS
|
transcription start sites
|
|
GO
|
Gene Oncology
|
|
KEGG pathway
|
Kyoto Encydopedia of Gene and
Genomes
|
|
qPCR
|
quantitative PCR
|
|
PAGE
|
polyacrylamide gel electrophoresis
|
|
HRP
|
streptavidin-conjugated horseradish
peroxidase
|
|
lncRNA
|
long non-coding RNA
|
|
FBL
|
feedback loop
|
|
FFL
|
feed-forward loop
|
|
DAVID
|
the database for annotation,
visualization and integrated discovery
|
References
|
1
|
Conway O'Brien E, Prideaux S and Chevassut
T: The epigenetic landscape of acute myeloid leukemia. Adv Hematol.
2014:1031752014.PubMed/NCBI
|
|
2
|
Lee HJ, Daver N, Kantarjian HM, Verstovsek
S and Ravandi F: The role of JAK pathway dysregulation in the
pathogenesis and treatment of acute myeloid leukemia. Clin Cancer
Res. 19:327–335. 2013. View Article : Google Scholar
|
|
3
|
Zaidi SK, Trombly DJ, Dowdy CR, Lian JB,
Stein JL, van Wijnen AJ and Stein GS: Epigenetic mechanisms in
leukemia. Adv Biol Regul. 52:369–376. 2012. View Article : Google Scholar : PubMed/NCBI
|
|
4
|
Jamieson K and Odenike O: Late-phase
investigational approaches for the treatment of relapsed/refractory
acute myeloid leukemia. Expert Opin Pharmacother. 13:2171–2187.
2012. View Article : Google Scholar : PubMed/NCBI
|
|
5
|
Sabnis H, Bradley HL, Bunting ST, Cooper
TM and Bunting KD: Capillary nano-immunoassay for Akt 1/2/3 and
4EBP1 phosphorylation in acute myeloid leukemia. J Transl Med.
12:1662014. View Article : Google Scholar : PubMed/NCBI
|
|
6
|
Naoe T and Kiyoi H: Gene mutations of
acute myeloid leukemia in the genome era. Int J Hematol.
97:165–174. 2013. View Article : Google Scholar : PubMed/NCBI
|
|
7
|
Larsson CA, Cote G and Quintás-Cardama A:
The changing mutational landscape of acute myeloid leukemia and
myelodysplastic syndrome. Mol Cancer Res. 11:815–827. 2013.
View Article : Google Scholar : PubMed/NCBI
|
|
8
|
Abdel-Wahab O and Levine RL: Mutations in
epigenetic modifiers in the pathogenesis and therapy of acute
myeloid leukemia. Blood. 121:3563–3572. 2013. View Article : Google Scholar : PubMed/NCBI
|
|
9
|
Yan S, Yim LY, Lu L, Lau CS and Chan VS:
MicroRNA regulation in systemic lupus erythematosus pathogenesis.
Immune Netw. 14:138–148. 2014. View Article : Google Scholar : PubMed/NCBI
|
|
10
|
van Rooij E and Kauppinen S: Development
of microRNA therapeutics is coming of age. EMBO Mol Med. 6:851–864.
2014. View Article : Google Scholar : PubMed/NCBI
|
|
11
|
Babashah S, Sadeghizadeh M, Tavirani MR,
Farivar S and Soleimani M: Aberrant microRNA expression and its
implications in the pathogenesis of leukemias. Cell Oncol (Dordr).
35:317–334. 2012. View Article : Google Scholar
|
|
12
|
Marcucci G, Mrózek K, Radmacher MD, Garzon
R and Bloomfield CD: The prognostic and functional role of
microRNAs in acute myeloid leukemia. Blood. 117:1121–1129. 2011.
View Article : Google Scholar :
|
|
13
|
Han YC, Park CY, Bhagat G, Zhang J, Wang
Y, Fan JB, Liu M, Zou Y, Weissman IL and Gu H: microRNA-29a induces
aberrant self-renewal capacity in hematopoietic progenitors, biased
myeloid development, and acute myeloid leukemia. J Exp Med.
207:475–489. 2010. View Article : Google Scholar : PubMed/NCBI
|
|
14
|
Bai J, Guo A, Hong Z and Kuai W:
Upregulation of microRNA-100 predicts poor prognosis in patients
with pediatric acute myeloid leukemia. Onco Targets Ther.
5:213–219. 2012.PubMed/NCBI
|
|
15
|
Wang Z, Hong Z, Gao F and Feng W:
Upregulation of microRNA-375 is associated with poor prognosis in
pediatric acute myeloid leukemia. Mol Cell Biochem. 383:59–65.
2013. View Article : Google Scholar : PubMed/NCBI
|
|
16
|
Li Y, Gao L, Luo X, Wang L, Gao X, Wang W,
Sun J, Dou L, Li J, Xu C, et al: Epigenetic silencing of
microRNA-193a contributes to leukemogenesis in t(8;21) acute
myeloid leukemia by activating the PTEN/PI3K signal pathway. Blood.
121:499–509. 2013. View Article : Google Scholar
|
|
17
|
Hickey CJ, Schwind S, Radomska HS,
Dorrance AM, Santhanam R, Mishra A, Wu YZ, Alachkar H, Maharry K,
Nicolet D, et al: Lenalidomide-mediated enhanced translation of
C/EBPα-p30 protein up-regulates expression of the antileukemic
microRNA-181a in acute myeloid leukemia. Blood. 121:159–169. 2013.
View Article : Google Scholar :
|
|
18
|
Zhang HM, Kuang S, Xiong X, Gao T, Liu C
and Guo AY: Transcription factor and microRNA co-regulatory loops:
Important regulatory motifs in biological processes and diseases.
Brief Bioinform. 16:45–58. 2015. View Article : Google Scholar
|
|
19
|
Cheng C, Yan KK, Hwang W, Qian J, Bhardwaj
N, Rozowsky J, Lu ZJ, Niu W, Alves P, Kato M, et al: Construction
and analysis of an integrated regulatory network derived from
high-throughput sequencing data. PLoS Comput Biol. 7:e10021902011.
View Article : Google Scholar : PubMed/NCBI
|
|
20
|
Pulikkan JA, Dengler V, Peramangalam PS,
Peer Zada AA, Müller-Tidow C, Bohlander SK, Tenen DG and Behre G:
Cell-cycle regulator E2F1 and microRNA-223 comprise an
auto-regulatory negative feedback loop in acute myeloid leukemia.
Blood. 115:1768–1778. 2010. View Article : Google Scholar :
|
|
21
|
Katzerke C, Madan V, Gerloff D,
Bräuer-Hartmann D, Hartmann JU, Wurm AA, Müller-Tidow C, Schnittger
S, Tenen DG, Niederwieser D, et al: Transcription factor
C/EBPα-induced microRNA-30c inactivates Notch1 during
granulopoiesis and is downregulated in acute myeloid leukemia.
Blood. 122:2433–2442. 2013. View Article : Google Scholar : PubMed/NCBI
|
|
22
|
Padró T, Ruiz S, Bieker R, Bürger H,
Steins M, Kienast J, Büchner T, Berdel WE and Mesters RM: Increased
angiogenesis in the bone marrow of patients with acute myeloid
leukemia. Blood. 95:2637–2644. 2000.
|
|
23
|
Aurelius J, Martner A, Brune M, Palmqvist
L, Hansson M, Hellstrand K and Thoren FB: Remission maintenance in
acute myeloid leukemia: Impact of functional histamine H2 receptors
expressed by leukemic cells. Haematologica. 97:1904–1908. 2012.
View Article : Google Scholar : PubMed/NCBI
|
|
24
|
Pfaffl MW: A new mathematical model for
relative quantification in real-time RT-PCR. Nucleic Acids Res.
29:e452001. View Article : Google Scholar : PubMed/NCBI
|
|
25
|
Sui W, Lin H, Peng W, Huang Y, Chen J,
Zhang Y and Dai Y: Molecular dysfunctions in acute rejection after
renal transplantation revealed by integrated analysis of
transcription factor, microRNA and long noncoding RNA. Genomics.
102:310–322. 2013. View Article : Google Scholar : PubMed/NCBI
|
|
26
|
Lin Y, Wu J, Chen H, Mao Y, Liu Y, Mao Q,
Yang K, Zheng X and Xie L: Cyclin-dependent kinase 4 is a novel
target in micoRNA-195-mediated cell cycle arrest in bladder cancer
cells. FEBS Lett. 586:442–447. 2012. View Article : Google Scholar : PubMed/NCBI
|
|
27
|
Rappaport N, Twik M, Nativ N, Stelzer G,
Bahir I, Stein TI, Safran M and Lancet D: MalaCards: A
comprehensive automatically-mined database of human diseases. Curr
Protoc Bioinformatics. 47:1.24.1–1.24.19. 2014. View Article : Google Scholar
|
|
28
|
Felice B, Cattoglio C, Cittaro D, Testa A,
Miccio A, Ferrari G, Luzi L, Recchia A and Mavilio F: Transcription
factor binding sites are genetic determinants of retroviral
integration in the human genome. PLoS One. 4:e45712009. View Article : Google Scholar : PubMed/NCBI
|
|
29
|
Huang DW, Sherman BT, Tan Q, Kir J, Liu D,
Bryant D, Guo Y, Stephens R, Baseler MW, Lane HC, et al: DAVID
Bioinformatics Resources: Expanded annotation database and novel
algorithms to better extract biology from large gene lists. Nucleic
Acids Res. 35(Web Server): W169–W175. 2007. View Article : Google Scholar : PubMed/NCBI
|
|
30
|
Li Z, Lu J, Sun M, Mi S, Zhang H, Luo RT,
Chen P, Wang Y, Yan M, Qian Z, et al: Distinct microRNA expression
profiles in acute myeloid leukemia with common translocations. Proc
Natl Acad Sci USA. 105:15535–15540. 2008. View Article : Google Scholar : PubMed/NCBI
|
|
31
|
Fischer J, Rossetti S, Datta A, Eng K,
Beghini A and Sacchi N: miR-17 deregulates a core RUNX1-miRNA
mechanism of CBF acute myeloid leukemia. Mol Cancer. 14:72015.
View Article : Google Scholar : PubMed/NCBI
|
|
32
|
Grosjean-Raillard J, Adès L, Boehrer S,
Tailler M, Fabre C, Braun T, De Botton S, Israel A, Fenaux P and
Kroemer G: Flt3 receptor inhibition reduces constitutive NFkappaB
activation in high-risk myelodysplastic syndrome and acute myeloid
leukemia. Apoptosis. 13:1148–1161. 2008. View Article : Google Scholar : PubMed/NCBI
|
|
33
|
Brondfield S, Umesh S, Corella A, Zuber J,
Rappaport AR, Gaillard C, Lowe SW, Goga A and Kogan SC: Direct and
indirect targeting of MYC to treat acute myeloid leukemia. Cancer
Chemother Pharmacol. 76:35–46. 2015. View Article : Google Scholar : PubMed/NCBI
|
|
34
|
Mott JL, Kurita S, Cazanave SC, Bronk SF,
Werneburg NW and Fernandez-Zapico ME: Transcriptional suppression
of mir-29b-1/mir-29a promoter by c-Myc, hedgehog, and NF-kappaB. J
Cell Biochem. 110:1155–1164. 2010. View Article : Google Scholar : PubMed/NCBI
|
|
35
|
Tao J, Zhao X and Tao J: c-MYC-miRNA
circuitry: A central regulator of aggressive B-cell malignancies.
Cell Cycle. 13:191–198. 2014. View Article : Google Scholar : PubMed/NCBI
|
|
36
|
Steffen B, Müller-Tidow C, Schwäble J,
Berdel WE and Serve H: The molecular pathogenesis of acute myeloid
leukemia. Crit Rev Oncol Hematol. 56:195–221. 2005. View Article : Google Scholar : PubMed/NCBI
|
|
37
|
Schimmer AD: Novel therapies targeting the
apoptosis pathway for the treatment of acute myeloid leukemia. Curr
Treat Options Oncol. 8:277–286. 2007. View Article : Google Scholar : PubMed/NCBI
|
|
38
|
Kim HS, Lim GY, Hwang J, Ryoo ZY, Huh TL
and Lee S: Induction of apoptosis by obovatol as a novel
therapeutic strategy for acute myeloid leukemia. Int J Mol Med.
34:1675–1680. 2014.PubMed/NCBI
|
|
39
|
Mikesch JH, Steffen B, Berdel WE, Serve H
and Müller-Tidow C: The emerging role of Wnt signaling in the
pathogenesis of acute myeloid leukemia. Leukemia. 21:1638–1647.
2007. View Article : Google Scholar : PubMed/NCBI
|
|
40
|
Li L, Tan Y, Chen X, Xu Z, Yang S, Ren F,
Guo H, Wang X, Chen Y, Li G, et al: MDM4 overexpressed in acute
myeloid leukemia patients with complex karyotype and wild-type
TP53. PLoS One. 9:e1130882014. View Article : Google Scholar : PubMed/NCBI
|
|
41
|
Chim CS, Wong AS and Kwong YL: Epigenetic
inactivation of INK4/CDK/RB cell cycle pathway in acute leukemias.
Ann Hematol. 82:738–742. 2003. View Article : Google Scholar : PubMed/NCBI
|
|
42
|
Fukuda Y, Lian S and Schuetz JD: Leukemia
and ABC transporters. Adv Cancer Res. 125:171–196. 2015. View Article : Google Scholar : PubMed/NCBI
|
|
43
|
Li YJ, Higgins RR, Pak BJ, Shivdasani RA,
Ney PA, Archer M and Ben-David Y: p45NFE2 is a negative
regulator of erythroid proliferation which contributes to the
progression of friend virus-induced erythroleukemias. Mol Cell
Biol. 21:73–80. 2001. View Article : Google Scholar
|
|
44
|
Somasundaram R, Prasad MA, Ungerbäck J and
Sigvardsson M: Transcription factor networks in B-cell
differentiation link development to acute lymphoid leukemia. Blood.
126:144–152. 2015. View Article : Google Scholar : PubMed/NCBI
|
|
45
|
Zada AA, Pulikkan JA, Bararia D, Geletu M,
Trivedi AK, Balkhi MY, Hiddemann WD, Tenen DG, Behre HM and Behre
G: Proteomic discovery of Max as a novel interacting partner of
C/EBPalpha: A Myc/Max/Mad link. Leukemia. 20:2137–2146. 2006.
View Article : Google Scholar : PubMed/NCBI
|
|
46
|
Pellicano F, Scott MT, Helgason GV,
Hopcroft LE, Allan EK, Aspinall-O'Dea M, Copland M, Pierce A,
Huntly BJ, Whetton AD, et al: The antiproliferative activity of
kinase inhibitors in chronic myeloid leukemia cells is mediated by
FOXO transcription factors. Stem Cells. 32:2324–2337. 2014.
View Article : Google Scholar : PubMed/NCBI
|
|
47
|
Gao SM, Xing CY, Chen CQ, Lin SS, Dong PH
and Yu FJ: miR-15a and miR-16-1 inhibit the proliferation of
leukemic cells by down-regulating WT1 protein level. J Exp Clin
Cancer Res. 30:1102011. View Article : Google Scholar : PubMed/NCBI
|
|
48
|
Cho JH, Gelinas R, Wang K, Etheridge A,
Piper MG, Batte K, Dakhallah D, Price J, Bornman D, Zhang S, et al:
Systems biology of interstitial lung diseases: Integration of mRNA
and microRNA expression changes. BMC Med Genomics. 4:82011.
View Article : Google Scholar : PubMed/NCBI
|
|
49
|
Ye H, Liu X, Lv M, Wu Y, Kuang S, Gong J,
Yuan P, Zhong Z, Li Q, Jia H, et al: MicroRNA and transcription
factor co-regulatory network analysis reveals miR-19 inhibits CYLD
in T-cell acute lymphoblastic leukemia. Nucleic Acids Res.
40:5201–5214. 2012. View Article : Google Scholar : PubMed/NCBI
|
|
50
|
Yan Z, Shah PK, Amin SB, Samur MK, Huang
N, Wang X, Misra V, Ji H, Gabuzda D and Li C: Integrative analysis
of gene and miRNA expression profiles with transcription
factor-miRNA feed-forward loops identifies regulators in human
cancers. Nucleic Acids Res. 40:e1352012. View Article : Google Scholar : PubMed/NCBI
|
|
51
|
Gao SM, Xing CY, Chen CQ, Lin SS, Dong PH
and Yu FJ: miR-15a and miR-16-1 inhibit the proliferation of
leukemic cells by down-regulating WT1 protein level. J Exp Clin
Cancer Res. 30:1102011. View Article : Google Scholar : PubMed/NCBI
|
|
52
|
Aqeilan RI, Calin GA and Croce CM: miR-15a
and miR-16-1 in cancer: Discovery, function and future
perspectives. Cell Death Differ. 17:215–220. 2010. View Article : Google Scholar
|
|
53
|
Chaudhuri AA, So AY, Mehta A, Minisandram
A, Sinha N, Jonsson VD, Rao DS, O'Connell RM and Baltimore D:
Oncomir miR-125b regulates hematopoiesis by targeting the gene
Lin28A. Proc Natl Acad Sci USA. 109:4233–4238. 2012. View Article : Google Scholar : PubMed/NCBI
|
|
54
|
Luo H, Li Q, O'Neal J, Kreisel F, Le Beau
MM and Tomasson MH: c-Myc rapidly induces acute myeloid leukemia in
mice without evidence of lymphoma-associated antiapoptotic
mutations. Blood. 106:2452–2461. 2005. View Article : Google Scholar : PubMed/NCBI
|
|
55
|
Guzman ML, Neering SJ, Upchurch D, Grimes
B, Howard DS, Rizzieri DA, Luger SM and Jordan CT: Nuclear
factor-kappaB is constitutively activated in primitive human acute
myelogenous leukemia cells. Blood. 98:2301–2307. 2001. View Article : Google Scholar : PubMed/NCBI
|
|
56
|
Howard JM, Nuguid JM, Ngole D and Nguyen
H: Tcf3 expression marks both stem and progenitor cells in multiple
epithelia. Development. 141:3143–3152. 2014. View Article : Google Scholar : PubMed/NCBI
|
|
57
|
Slyper M, Shahar A, Bar-Ziv A, Granit RZ,
Hamburger T, Maly B, Peretz T and Ben-Porath I: Control of breast
cancer growth and initiation by the stem cell-associated
transcription factor TCF3. Cancer Res. 72:5613–5624. 2012.
View Article : Google Scholar : PubMed/NCBI
|
|
58
|
Li C, Cai S, Wang X and Jiang Z:
Hypomethylation-associated up-regulation of TCF3 expression and
recurrence in stage II and III colorectal cancer. PLoS One.
9:e1120052014. View Article : Google Scholar : PubMed/NCBI
|
|
59
|
Patel D and Chaudhary J: Increased
expression of bHLH transcription factor E2A (TCF3) in prostate
cancer promotes proliferation and confers resistance to doxorubicin
induced apoptosis. Biochem Biophys Res Commun. 422:146–151. 2012.
View Article : Google Scholar : PubMed/NCBI
|
|
60
|
Salek-Ardakani S, Smooha G, de Boer J,
Sebire NJ, Morrow M, Rainis L, Lee S, Williams O, Izraeli S and
Brady HJ: ERG is a megakaryocytic oncogene. Cancer Res.
69:4665–4673. 2009. View Article : Google Scholar : PubMed/NCBI
|
|
61
|
Marcucci G, Maharry K, Whitman SP,
Vukosavljevic T, Paschka P, Langer C, Mrózek K, Baldus CD, Carroll
AJ, Powell BL, et al; Cancer and Leukemia Group B Study. High
expression levels of the ETS-related gene, ERG, predict adverse
outcome and improve molecular risk-based classification of
cytogenetically normal acute myeloid leukemia: A Cancer and
Leukemia Group B Study. J Clin Oncol. 25:3337–3343. 2007.
View Article : Google Scholar : PubMed/NCBI
|
|
62
|
Goldberg L, Tijssen MR, Birger Y, Hannah
RL, Kinston SJ, Schütte J, Beck D, Knezevic K, Schiby G,
Jacob-Hirsch J, et al: Genome-scale expression and transcription
factor binding profiles reveal therapeutic targets in transgenic
ERG myeloid leukemia. Blood. 122:2694–2703. 2013. View Article : Google Scholar : PubMed/NCBI
|
|
63
|
Burger MT, Han W, Lan J, Nishiguchi G,
Bellamacina C, Lindval M, Atallah G, Ding Y, Mathur M, McBride C,
et al: Structure guided optimization, in vitro activity, and in
vivo activity of Pan-PIM kinase inhibitors. ACS Med Chem Lett.
4:1193–1197. 2013. View Article : Google Scholar
|
|
64
|
Shah N, Pang B, Yeoh KG, Thorn S, Chen CS,
Lilly MB and Salto-Tellez M: Potential roles for the PIM1 kinase in
human cancer - a molecular and therapeutic appraisal. Eur J Cancer.
44:2144–2151. 2008. View Article : Google Scholar : PubMed/NCBI
|