Introduction
Colorectal cancer is one of the most common cancers
worldwide and has good prognosis if detected early. However,
metastasis of colorectal cancer causes cancer-related deaths.
Increasing evidence suggests that epithelial-mesenchymal transition
(EMT) plays an important role in tumor progression and metastasis
formation in several types of cancers, including colorectal cancer
(1–4). EMT is a biologic process that enables
a polarized epithelial cell to undergo several biochemical changes.
This biological process enables epithelial cells to acquire the
mesenchymal cell phenotype, including enhanced migratory ability
and invasiveness (5). During this
process, epithelial cells lose E-cadherin expression and exhibit
loss of cell-cell adhesion, reorganization of the cytoskeleton by
switching from keratin to vimentin intermediate filaments, loss of
apical-basal polarity, acquisition of a fibroblast-like cell shape
and increase in motility (6,7).
Many molecular targets are involved in EMT. Some key
transcription factors, including SNAIL, zinc-finger E-box-binding
homeobox (ZEB), and basic helix-loop-helix transcription factors,
are considered to play central roles in EMT (2,4).
These molecules can directly bind the promoter region of the
E-cadherin gene and inhibit E-cadherin transcription (8). Consequently, tumor cells exhibit
mesenchymal features and obtain abilities for migration and
invasiveness. Activation of these molecules is triggered by many
signaling pathways such as the TGFβ superfamily, Wnt, Notch, VEGF,
epidermal growth factor (EGF) and hypoxia-inducible factor pathways
(9,10). These signaling pathways are
involved in carcinogenesis via the mutual influence of the tumor
and components of its microenvironment on the dynamic control of
EMT (2). microRNAs also
participate in the regulation of EMT by binding to mRNAs, and then
microRNAs control the translation or degradation of mRNAs (11,12).
EMT allows individual cells to delaminate from primary tumors and
migrate along the extracellular matrix network (10,13).
These processes are observed in vitro, but not in
vivo; in vitro studies are often subject to criticism
because the stromal interactions and tumor environment in
vivo cannot be replicated in vitro (6,9,14,15).
There is little evidence of EMT in human tumors due to the great
diversity in cellular organization (13,15,16).
Tumors accumulate somatic aberrations through an evolutionary
process (16), inducing
heterogeneous features in a tumor; this is known as intratumor
heterogeneity. Multiple genetically distinct subclones have been
detected within a primary tumor (17–19).
Improvements in technologies, including next-generation sequencing,
have enabled in-depth verification of intratumor heterogeneity at
the molecular level. In clear cell renal cell carcinoma, tumor
subclones within the primary tumor appear geographically distinct
(18,19). Intratumor heterogeneity in other
tumor types has also been noted and has been reported to influence
targeted therapy and polygenic drug resistance (20). Therefore, intratumor heterogeneity
should be considered while studying EMT-associated genes.
In the present study, we obtained multiple spatially
separated samples from primary colorectal carcinomas and their
metastatic sites to elucidate the heterogeneous molecular profiles
of EMT. We investigated the distribution of EMT-associated gene
expression and activation of EMT-associated signaling pathways and
microRNAs and compared gene expression between the tumor center
(TC) and invasive front (IF) of metastatic and non-metastatic
tumors.
Materials and methods
Patients and tissues
The colorectal cancer tissue samples were obtained
from 8 patients who had metastatic colorectal cancer and 8 patients
who had non-metastatic colorectal cancer; these 16 patients had
undergone surgery from December 2013 to December 2014 at the
Saitama Medical Center, Jichi Medical University, Japan. The
present study was approved by the Research Ethics Committee at
Jichi Medical University. Written informed consent was obtained
from each study participant. Table
I displays the clinical and histopathological characteristics
of the patients.
 | Table IPatient characteristics. |
Table I
Patient characteristics.
| Patient | Gender | Age | Locationa | T | N | M | UICC-stage | Histologic
typeb | Distant
metastasisc |
|---|
| 1 | M | 65 | A | T3 | 0 | 0 | II A | Well | No |
| 2 | M | 51 | R | T3 | 0 | 0 | II A | Well | No |
| 3 | M | 79 | S | T4b | 0 | 0 | II C | Well | No |
| 4 | M | 70 | S | T4a | 0 | 0 | II B | Well | No |
| 5 | M | 57 | R | T3 | 2 | 1a | IV a | Well | Liver |
| 6 | F | 64 | S | T4a | 2 | 1a | IV a | Mode | Liver |
| 7 | F | 76 | T | T4a | 1 | 1b | IV b | Mode | Liver, per,
ovary |
| 8 | F | 61 | S | T4a | 2 | 1b | IV b | Mode | Per, ovary |
| 9 | F | 73 | R | T2 | 0 | 0 | I | Well | No |
| 10 | F | 77 | A | T3 | 0 | 0 | II A | Well | No |
| 11 | F | 78 | T | T4a | 1 | 0 | III B | Well | No |
| 12 | F | 46 | S | T3 | 1 | 0 | III B | Well | No |
| 13 | F | 86 | A | T4a | 2 | 1a | IV a | Muc | Lung |
| 14 | M | 78 | A | T4a | 2 | 1a | IV a | Well | Liver |
| 15 | M | 72 | R | T3 | 1 | 1a | IV a | Mode | Distant lymph
nodes |
| 16 | F | 41 | S | T4a | 1 | 1a | IV a | Well | Liver |
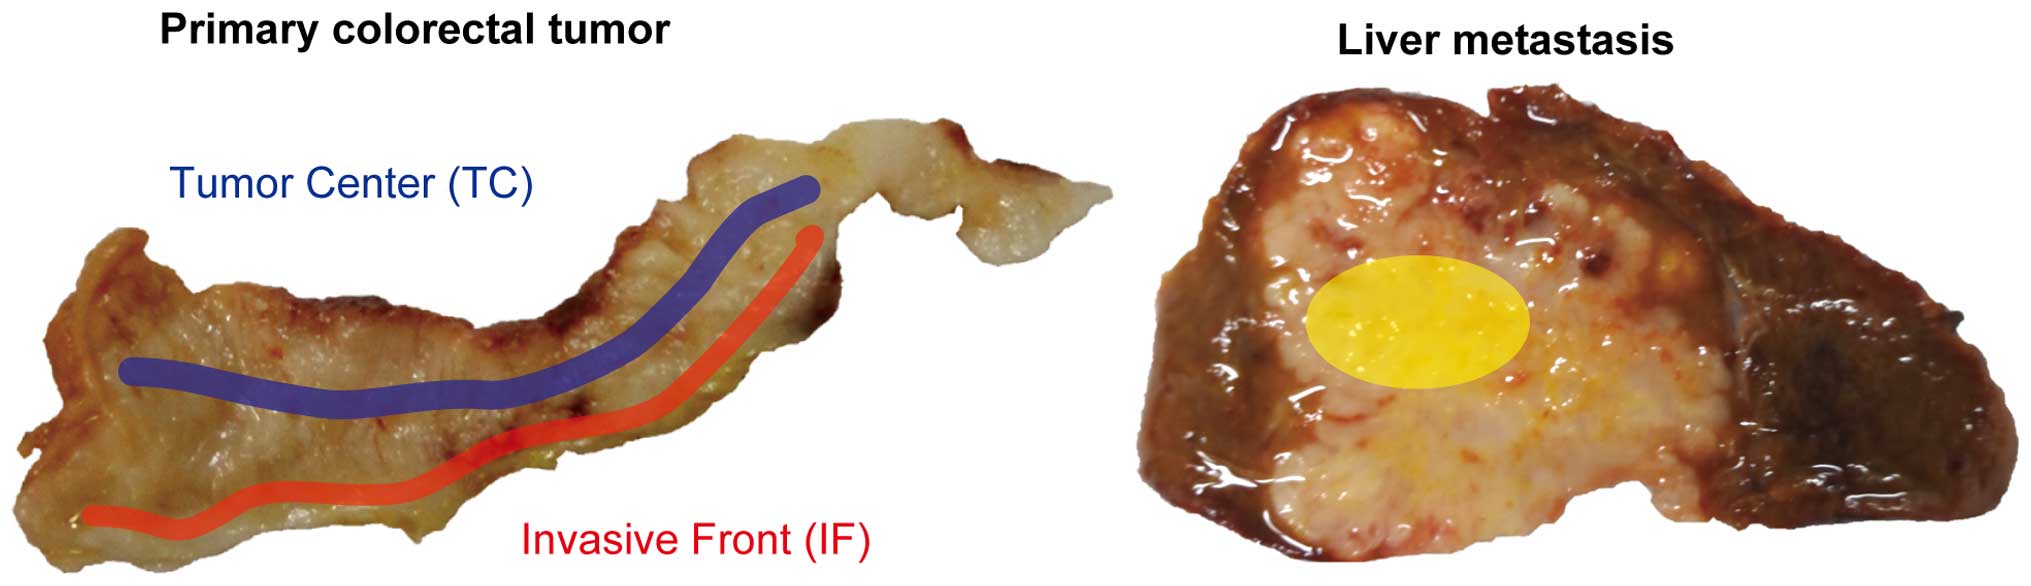
Multiple spatially separated samples were taken from
the TC or IF in each tumor. The TC was defined as an area with a
depth of 5–10 mm from the surface of the tumor. The IF was defined
as an area 1–3 mm away from the boundary between the tumor and
muscle, serosa, or other organs (Fig.
1). Tissue samples were obtained from metastasis areas in 6
patients and normal mucosa in 11 patients (Table II).
| Table IICharacteristics of samples. |
Table II
Characteristics of samples.
| Patient | Normal colon
tissue | Tumor center | Invasive front | Metastasis | Other | Subtotal |
|---|
| 1 | 0 | 1 | 1 | 0 | - | 2 |
| 2 | 0 | 1 | 2 | 0 | - | 3 |
| 3 | 0 | 2 | 3 | 0 | - | 5 |
| 4 | 0 | 5 | 3 | 0 | - | 8 |
| 5 | 1 | 1 | 2 | 1 | - | 5 |
| 6 | 1 | 4 | 2 | 1 | - | 8 |
| 7 | 0 | 1 | 2 | 1 | - | 4 |
| 8 | 1 | 4 | 3 | 3 | - | 11 |
| 9 | 1 | 6 | 3 | 0 | - | 10 |
| 10 | 1 | 5 | 1 | 0 | - | 7 |
| 11 | 1 | 4 | 4 | 0 | - | 9 |
| 12 | 1 | 3 | 3 | 0 | Lymph node | 8 |
| 13 | 1 | 6 | 6 | 1 | - | 14 |
| 14 | 1 | 11 | 3 | 4 | - | 19 |
| 15 | 1 | 5 | 6 | 0 | - | 12 |
| 16 | 1 | 5 | 2 | 0 | - | 8 |
| Subtotal | 11 | 64 | 46 | 11 | 1 | 133 |
Both normal and tumor tissues were obtained
immediately after surgery, immersed in RNAlater (Ambion,
Inc., Austin, TX, USA), and stored at −80°C in our laboratory until
processing. RNA isolated from samples obtained from 38 sites of 8
tumors were used for microarray analysis and RNA obtained from 133
sites of 16 tumors were used for quantitative real-time
reverse-transcription (RT) PCR (RT-qPCR). Eighty-eight samples
obtained from the TC and IF of 8 tumors that had sufficient sample
volume for obtaining microRNA were used for the microRNA analysis.
Formalin-fixed paraffin embedded (FFPE) samples were also obtained
from the abovementioned 16 patients.
RNA extraction
Total RNA was extracted from samples using the
Illustra RNAspin Mini RNA Isolation kit (GE Healthcare UK,
Buckinghamshire, UK) and the miRCURY RNA Isolation kit (Exiqon,
Vedbaek, Denmark) according to the manufacturer’s instructions. For
assessing RNA quality and yield, A260/A280
and A260/A230 ratios for RNA preparation
samples were analyzed with a Nano-Drop® ND-1000
spectrophotometer (NanoDrop Technologies, Inc., Wilmington, DE,
USA) and RNA integrity number (RIN) was calculated by an Agilent
2100 Bioanalyzer (Agilent Technologies, Santa Clara, CA, USA)
(21). RNAs with RINs of 7–10 were
used for microarray and RT-qPCR.
Microarray expression profiling
The gene expression microarray experiments were
performed using Agilent SurePrint G3 Human Gene Expression 8x60K
ver2.0 (Agilent Technologies) according to the manufacturer’s
instructions (One-Color Microarray-Based Gene Expression Analysis
Protocol Version Jan. 2012; Agilent Technologies). In brief,
cyanine-3 (Cy3)-labeled cRNA was prepared from 75 ng RNA using the
One-Color Low Input Quick Amp labeling kit (Agilent Technologies),
followed by purification with the RNeasy Mini kit (Qiagen, Hilden,
Germany). Dye incorporation and cRNA yield were checked with the
NanoDrop spectrophotometer. For hybridization, 600 ng of
Cy3-labeled cRNA was fragmented at 60°C for 30 min. On completion
of the fragmentation reaction, 25 μl of 2X Agilent hybridization
buffer was added to the fragmentation mixture and hybridized for 17
h at 65°C in a rotating Agilent hybridization oven. After
hybridization, microarrays were washed with GE Wash Buffer. Slides
were scanned after washing on the Agilent Technologies Microarray
scanner. The fluorescence intensities on scanned images were
extracted and preprocessed by Agilent Feature Extraction software
(v10.7.3.1). The raw signals were normalized using the percentile
shift normalization method; the value was set at 75th percentile
and log transformed. Universal Human Reference RNA (Agilent
Technologies) was used as the control. Data have been deposited in
Gene Expression Omnibus (accession number GSE75117).
RT-qPCR assay for mRNA expression
RT was performed using the High Capacity RNA-to-cDNA
kit (Applied Biosystems, Carlsbad, CA, USA). RT-qPCR assays were
performed using TaqMan® Gene Expression Assays (Applied
Biosystems; Table III) and
TaqMan® Gene Expression Master Mix on the QuantStudio™
12K Flex Real-Time PCR system (Applied Biosystems). Thermal cycling
conditions were as follows: 95°C for 10 min, followed by 40 cycles
of 95°C for 15 sec and 60ºC for 1 min. The expression level of each
gene was determined using the fluorescence intensity measurements
from the QuantStudio™ 12K Flex Data Analysis software. A GAPDH
fragment was amplified as an internal control. RT-qPCR assays were
repeated two times.
| Table IIIPrimers for gene expression assay and
micro RNA assays used in the present study. |
Table III
Primers for gene expression assay and
micro RNA assays used in the present study.
| Target | Product number | Manufacturer |
|---|
| TaqMan®
Gene Expression assays |
| ZEB1 | Hs00232783_m1 | Applied
Biosystems |
| ZEB2 | Hs00207691_m1 | Applied
Biosystems |
| SNAI1 | Hs00195591_m1 | Applied
Biosystems |
| CDH1 | Hs01023894_m1 | Applied
Biosystems |
| GAPDH | Hs03929097_g1 | Applied
Biosystems |
| microRNA LNA™ PCR
primers |
|
hsa-miR-200a-3p | 204707 | Exiqon |
|
hsa-miR-200b-3p | 206071 | Exiqon |
|
hsa-miR-200c-3p | 204482 | Exiqon |
|
hsa-miR-141-3p | 204504 | Exiqon |
|
hsa-miR-423-3p | 204488 | Exiqon |
RT-qPCR assay for miR-200 expression
Total RNA (10 ng) extracted with the use of the
miRCURY RNA Isolation kit was reverse transcribed in 10-μl
reactions by using the miRCURY LNATM Universal cDNA
Synthesis kit II (Exiqon). RT-qPCR assays for microRNAs were
performed with specific microRNA LNA PCR primers (Exiqon; Table III) and ExiLENT SYBR®
Green Master Mix (Exiqon). All RT-qPCR reactions were carried out
in 96-well plates with the ROX Reference Dye (Applied Biosystems)
in the QuantStudio™ 12K Flex Real-Time PCR System (Applied
Biosystems). Thermal cycling conditions were as follows: 95°C for
10 min; 40 cycles of 95°C for 10 sec and 60°C for 1 min; and 95ºC
for 15 sec, 60°C for 1 min, and 95°C for 15 sec. A miR-423-3p
primer was used as the reference microRNA.
Immunohistochemistry
Immunohistochemistry (IHC) staining was performed on
FFPE samples according to standard procedures. In summary, FFPE
samples on slides were baked for 30 min at 58°C, deparaffinized in
xylene, rehydrated through graded alcohol, and antigen-retrieved at
98°C in a water bath for 30 min in sodium citrate buffer (10 mM
sodium citrate, pH 6.0). Then, the slides were immersed in 0.3%
hydrogen peroxide diluted in methanol for 20 min to block
endogenous peroxidase activity and preincubated with 5% bovine
serum albumin (BSA) at 15–20°C for 15 min to reduce non-specific
reaction. Subsequently, the slides were incubated with anti-ZEB1
(#NBP1-05987; Novus Biologicals, Littleton, CO, USA, 1:500
dilution, 4°C overnight), anti-ZEB2 (#HPA003456; Sigma, St. Louis,
MO, USA, 1:400 dilution, 4°C overnight) or anti-VEGF (#ab46154;
Abcam, Cambridge, UK, 1:200 dilution, 15–20°C for 30 min). The
slides were sequentially incubated with a secondary antibody,
Histofine® Simple Stain™ MAX PO MULTI (Nichirei
Biosciences Inc., Tokyo, Japan), at 15–20°C for 30 min, and stained
with DAB (Dako, Glostrup, Denmark). Finally, the slides were
counterstained with Mayer’s hematoxylin, dehydrated in graded
concentrations of ethanol and mounted.
The staining intensity of each slide for the IF was
evaluated by scanning of the whole section at low (x40) and high
magnification (x200) by 2 independent researchers in a blinded
manner.
Statistical analysis
Continuous variable comparisons between 2 groups
were performed with the Student’s t-test for variables following a
normal distribution, or with the non-parametric
Mann-Whitney-Wilcoxon test for variables that did not follow a
normal distribution. To determine the significant genes from
multiple samples, analysis of variance (ANOVA) was carried out
using MeV, using which hierarchical clustering sample and gene
trees were also drawn simultaneously (22). The level of statistical
significance was set at P<0.05, unless otherwise specified.
Statistical analyses were performed with EZR (Saitama Medical
Center, Jichi Medical University, Saitama, Japan), a graphical user
interface for R 2.13.0 (R Foundation for Statistical Computing,
Vienna, Austria) (23). More
precisely, EZR is a modified version of R commander (version
1.6-3), designed to add statistical functions used frequently in
biostatistics.
Results
Heterogeneous expression in
EMT-associated genes and activation of the VEGF and WNT signaling
pathways
Unsupervised hierarchical clustering was performed
to elucidate distinct gene profiles among 3 locations, including
the IF, TC and metastasis, but no clear differences were seen (data
not shown). We then used ANOVA to determine whether there was
location-associated gene expression; the results revealed that 7920
probes (13% of whole probes) exhibited significant differences in
levels of gene expression among 3 locations. The IF in tumors
displayed higher expression of ZEB1, an EMT-associated gene, than
that seen in the TC and metastasis (P<0.01) (Fig. 2A). There was no significant
difference among the 3 locations with respect to the expression
levels of other EMT-associated genes, including SNAIL, basic
helix-loop-helix transcription factors and E-cadherin.
Heterogeneous gene expression of ZEB1 was seen such that high
levels of ZEB1 expression were found in a small part of the IF,
whereas no increase in expression was seen in the TC (Fig. 2B). The ANOVA-constructed
hierarchical tree revealed that expression patterns in several
samples (nos. 3, 4, 5, 6 and 8) were influenced by individual
differences rather than the differences between the TC and IF
(Fig. 2A).
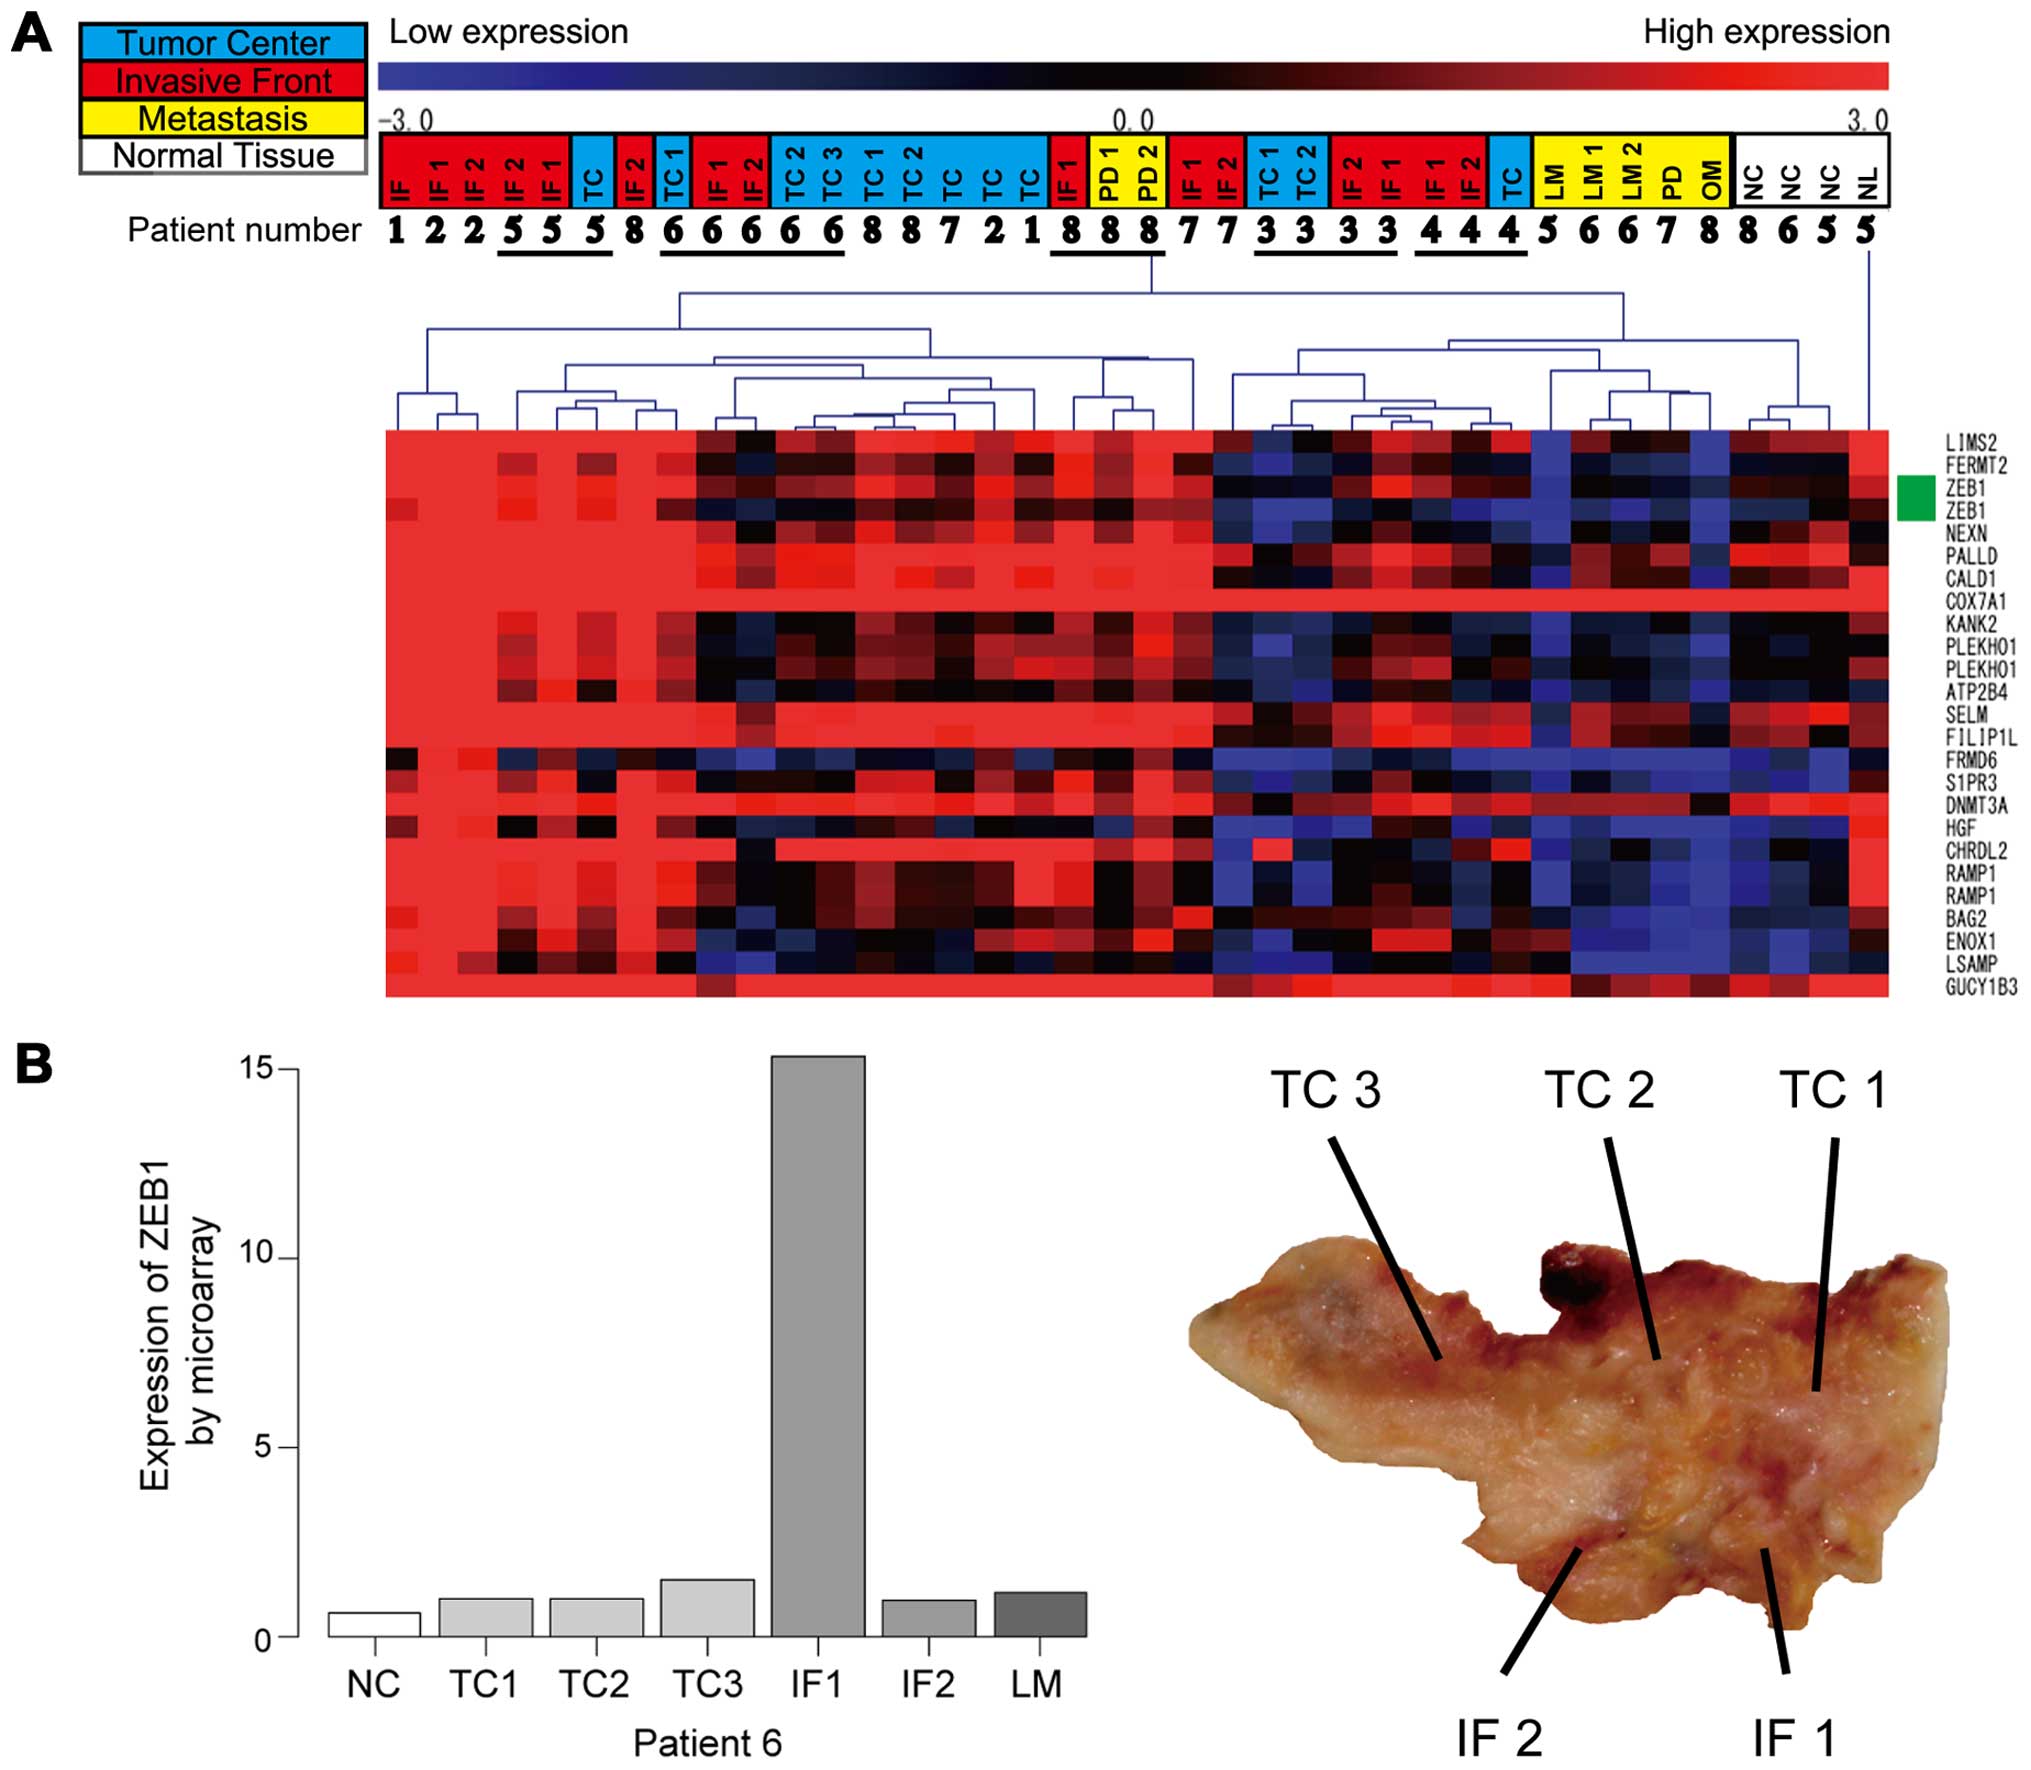 | Figure 2Gene expression microarray analysis.
(A) Clustering of the samples according to their expression
profile. High expression is indicated in red. Low expression is
indicated in blue. Samples are shown at the top of the heatmap.
Colors in upper row indicate the following: tumor center in light
blue, invasive front in red, metastasis in yellow. Patient number
is indicated in the lower row. On the right side of the heatmap,
the genes associated with gene expression array probes are shown.
ZEB1 probes are indicated in green. Clustering was performed by
complete linkage using Pearson’s correlation on a subset of array
probes previously selected by ANOVA. A part of the heatmap is
displayed in this figure. (B) Left panel showed the expression of
ZEB1 of the tumor in patient 6 by gene expression microarray. Right
panel display the sampling area of the tumor in patient 6. TC,
tumor center; IF, invasive front; NC, normal colon mucosa; LM,
liver metastasis; NL, normal liver tissue; OM, ovarian metastasis;
PD, peritoneal dissemination. |
We then calculated the expression ratios between the
TC and IF in each tumor to exclude these individual differences.
These ratios were applied to the t-test comparing metastatic tumors
and non-metastatic tumors. This analysis identified 1512
distinctive probes (2% of whole probes) according to the status of
metastasis. Gene annotation and pathway ontology analyses were
performed using the Database for Annotation, Visualization and
Integrated Discovery (DAVID) and Kyoto Encyclopedia of Genes and
Genomes (KEGG), which revealed that several genes were associated
with the VEGF signaling pathway and Wnt signaling pathway (Table IV).
| Table IVResults of gene annotation and
pathway ontology. |
Table IV
Results of gene annotation and
pathway ontology.
| Term | Count | P-value | Benjamini |
|---|
| Axon guidance | 18 | 4.3E-4 | 3.4E-2 |
| Endocytosis | 16 | 6.5E-2 | 4.3E-1 |
| VEGF signaling
pathway | 14 | 1.4E-4 | 2.1E-2 |
| T cell receptor
signaling pathway | 14 | 4.5E-3 | 1.1E-1 |
| Wnt signaling
pathway | 14 | 5.8E-2 | 4.1E-1 |
| ErbB signaling
pathway | 13 | 2.0E-3 | 7.7E-2 |
| Neurotrophin
signaling pathway | 13 | 3.2E-2 | 3.1E-1 |
| Tight junction | 13 | 5.2E-2 | 4.1E-1 |
| Pancreatic
cancer | 11 | 4.5E-3 | 1.3E-1 |
| B cell receptor
signaling pathway | 11 | 6.0E-3 | 1.3E-1 |
| Fc epsilon RI
signaling pathway | 11 | 7.9E-3 | 1.5E-1 |
| Fc gamma R-mediated
phagocytosis | 11 | 2.9E-2 | 3.0E-1 |
| Leukocyte
transendothelial migration | 11 | 9.7E-2 | 5.1E-1 |
| Chronic myeloid
leukemia | 10 | 1.7E-2 | 2.4E-1 |
| Prostate
cancer | 10 | 4.6E-2 | 3.9E-1 |
|
Progesterone-mediated oocyte
maturation | 9 | 8.6E-2 | 4.8E-1 |
| Linoleic acid
metabolism | 8 | 5.1E-4 | 2.7E-2 |
| Non-small cell lung
cancer | 8 | 2.3E-2 | 2.7E-1 |
| Glycerophospholipid
metabolism | 8 | 6.8E-2 | 4.3E-1 |
| Renal cell
carcinoma | 8 | 7.8E-2 | 4.6E-1 |
| Bladder cancer | 7 | 2.3E-2 | 2.8E-1 |
| Endometrial
cancer | 7 | 5.6E-2 | 4.2E-1 |
| Metabolism of
xenobiotics by cytochrome P450 | 7 | 9.8E-2 | 5.0E-1 |
| Dorso-ventral axis
formation | 6 | 9.1E-3 | 1.5E-1 |
Comparison of gene expression of ZEB
according to sample locations and the status of metastasis
We verified expression levels of EMT-associated
genes, including ZEB, by RT-qPCR in a series of 133 clinical
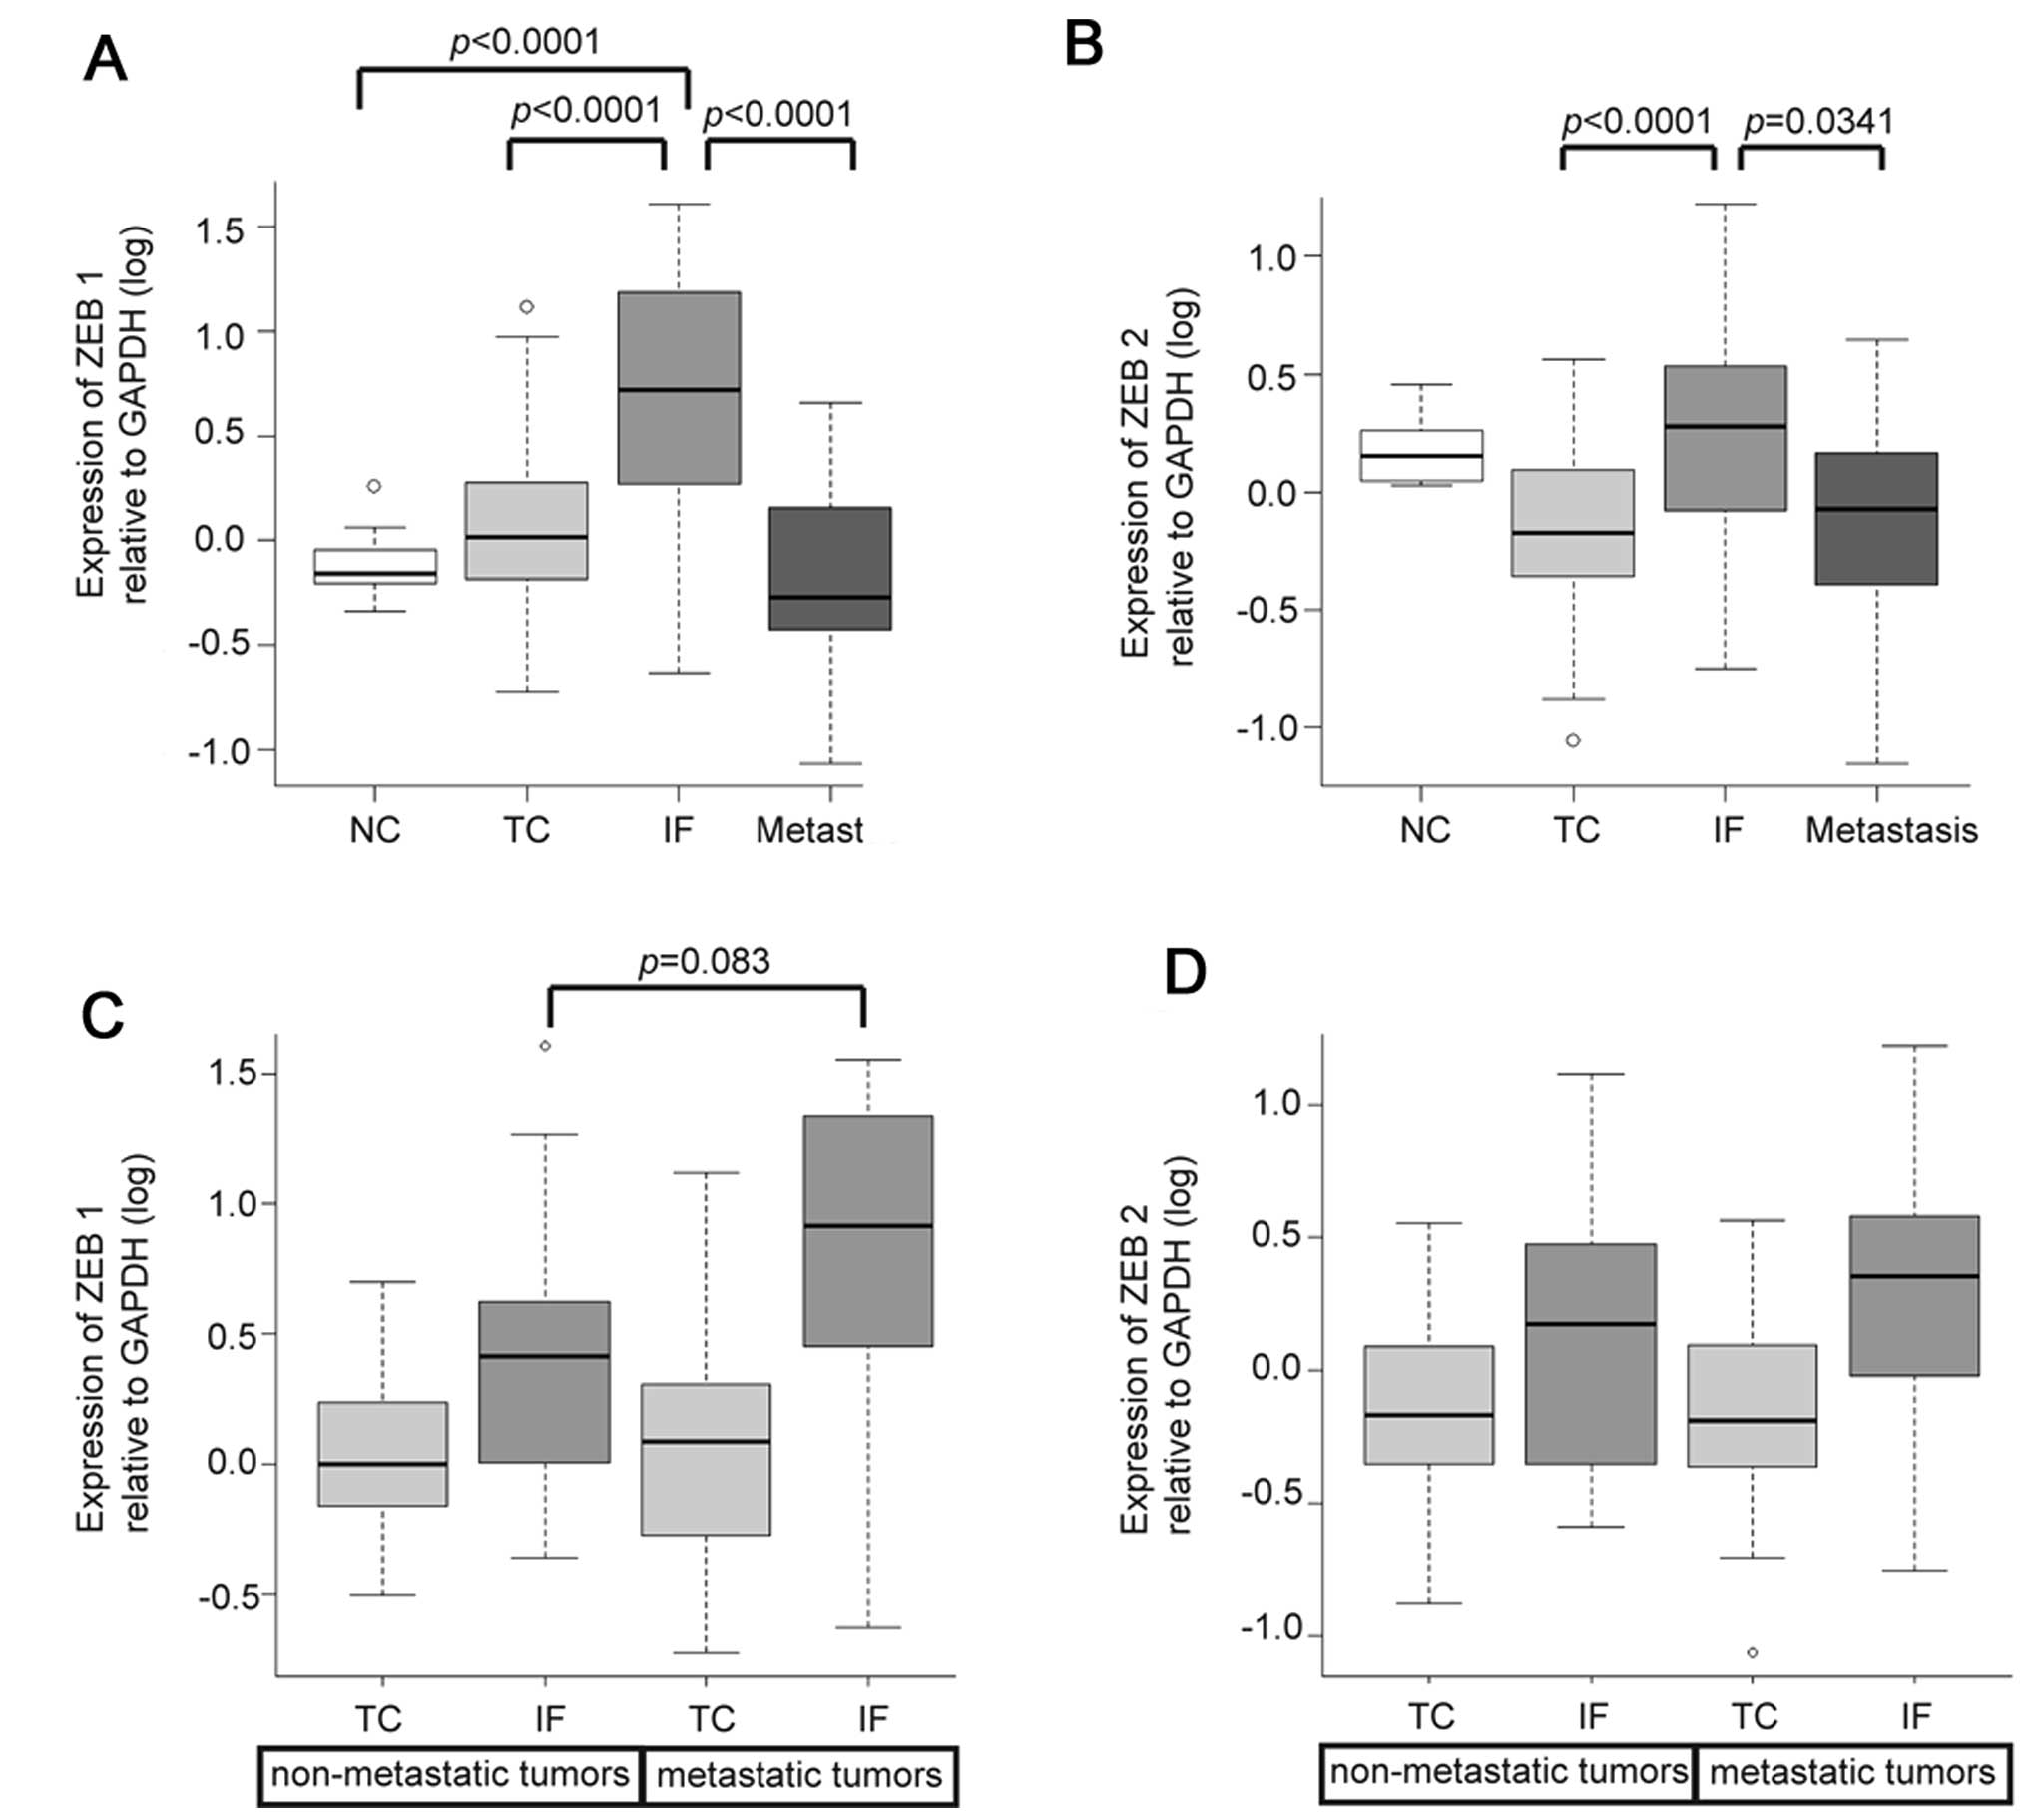
samples from 16 tumors. Expression levels of ZEB1 and ZEB2 in IF
were significantly higher than those in the TC and metastasis
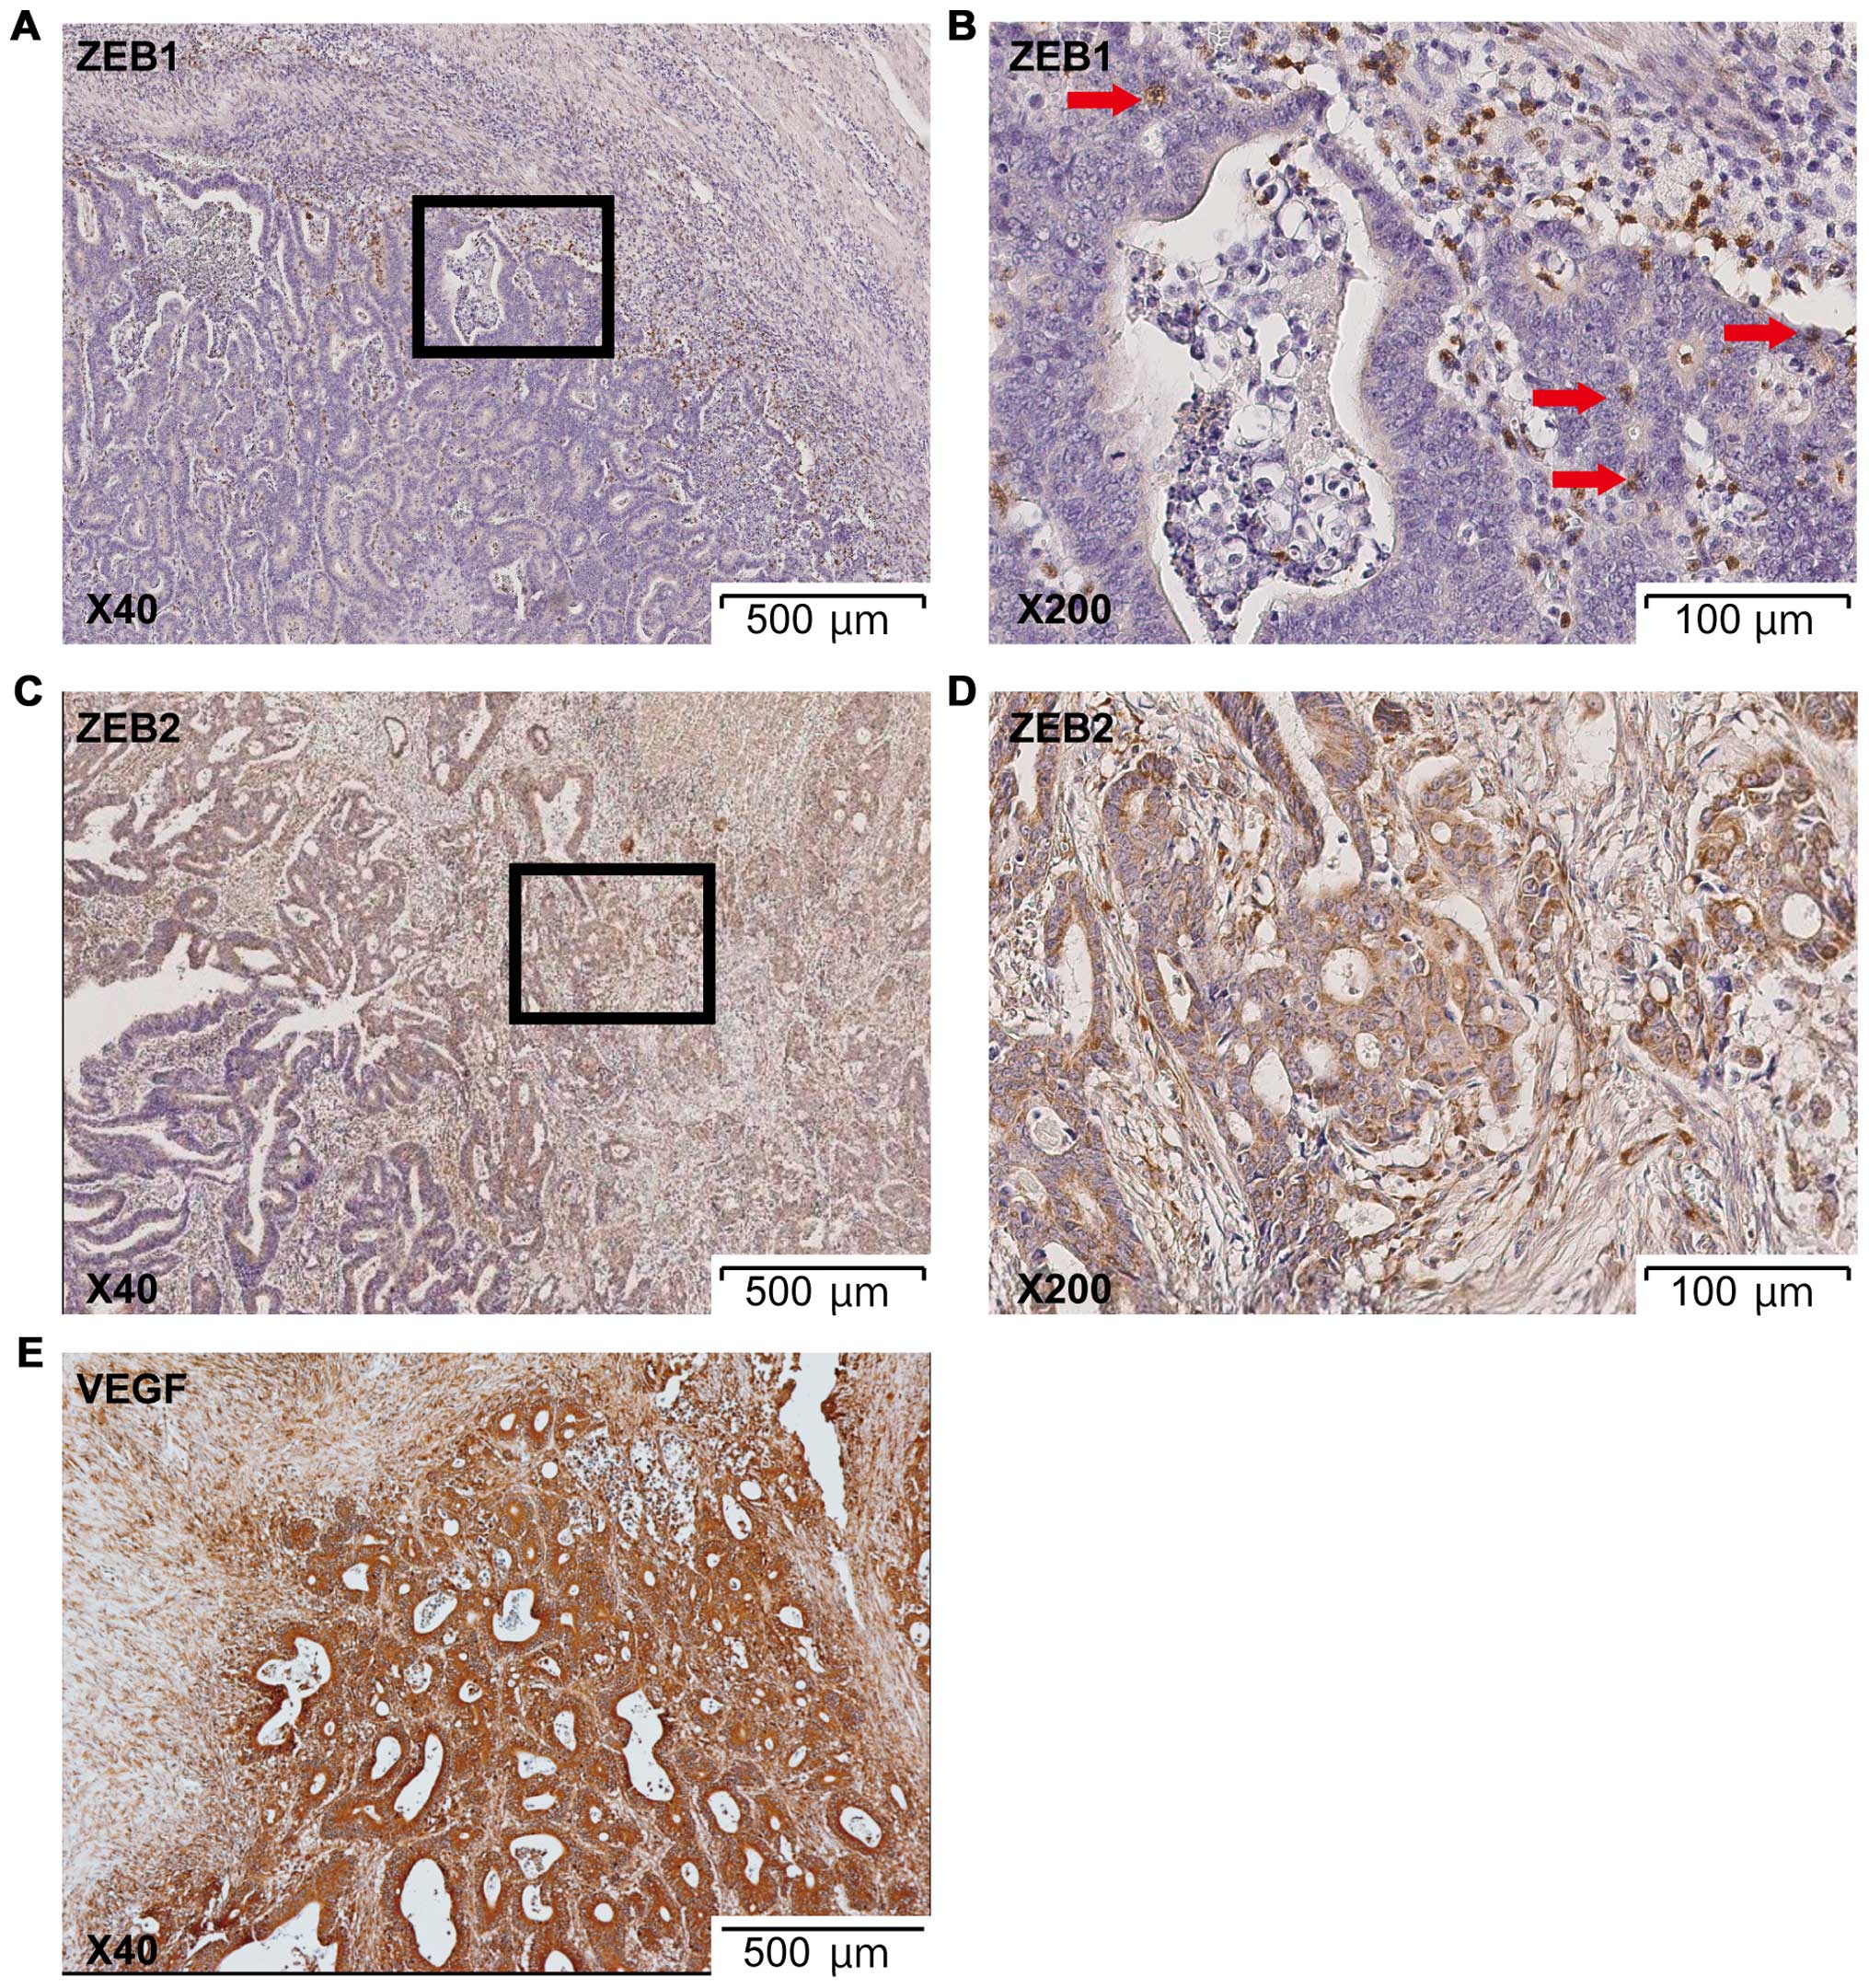
(Fig. 3A and B). Heterogeneous
expression of ZEB proteins was ascertained by IHC. A representative
sample with overexpression of ZEB1 and ZEB2 in the IF is shown in
Fig. 5; ZEB1 and ZEB2 showed
heterogeneous expression even in the IF. In contrast, VEGF did not
display heterogeneity in the IF (Fig.
5E). Metastatic tumors preferentially expressed ZEB proteins
but no statistically significant difference was found on comparing
the status of metastasis.
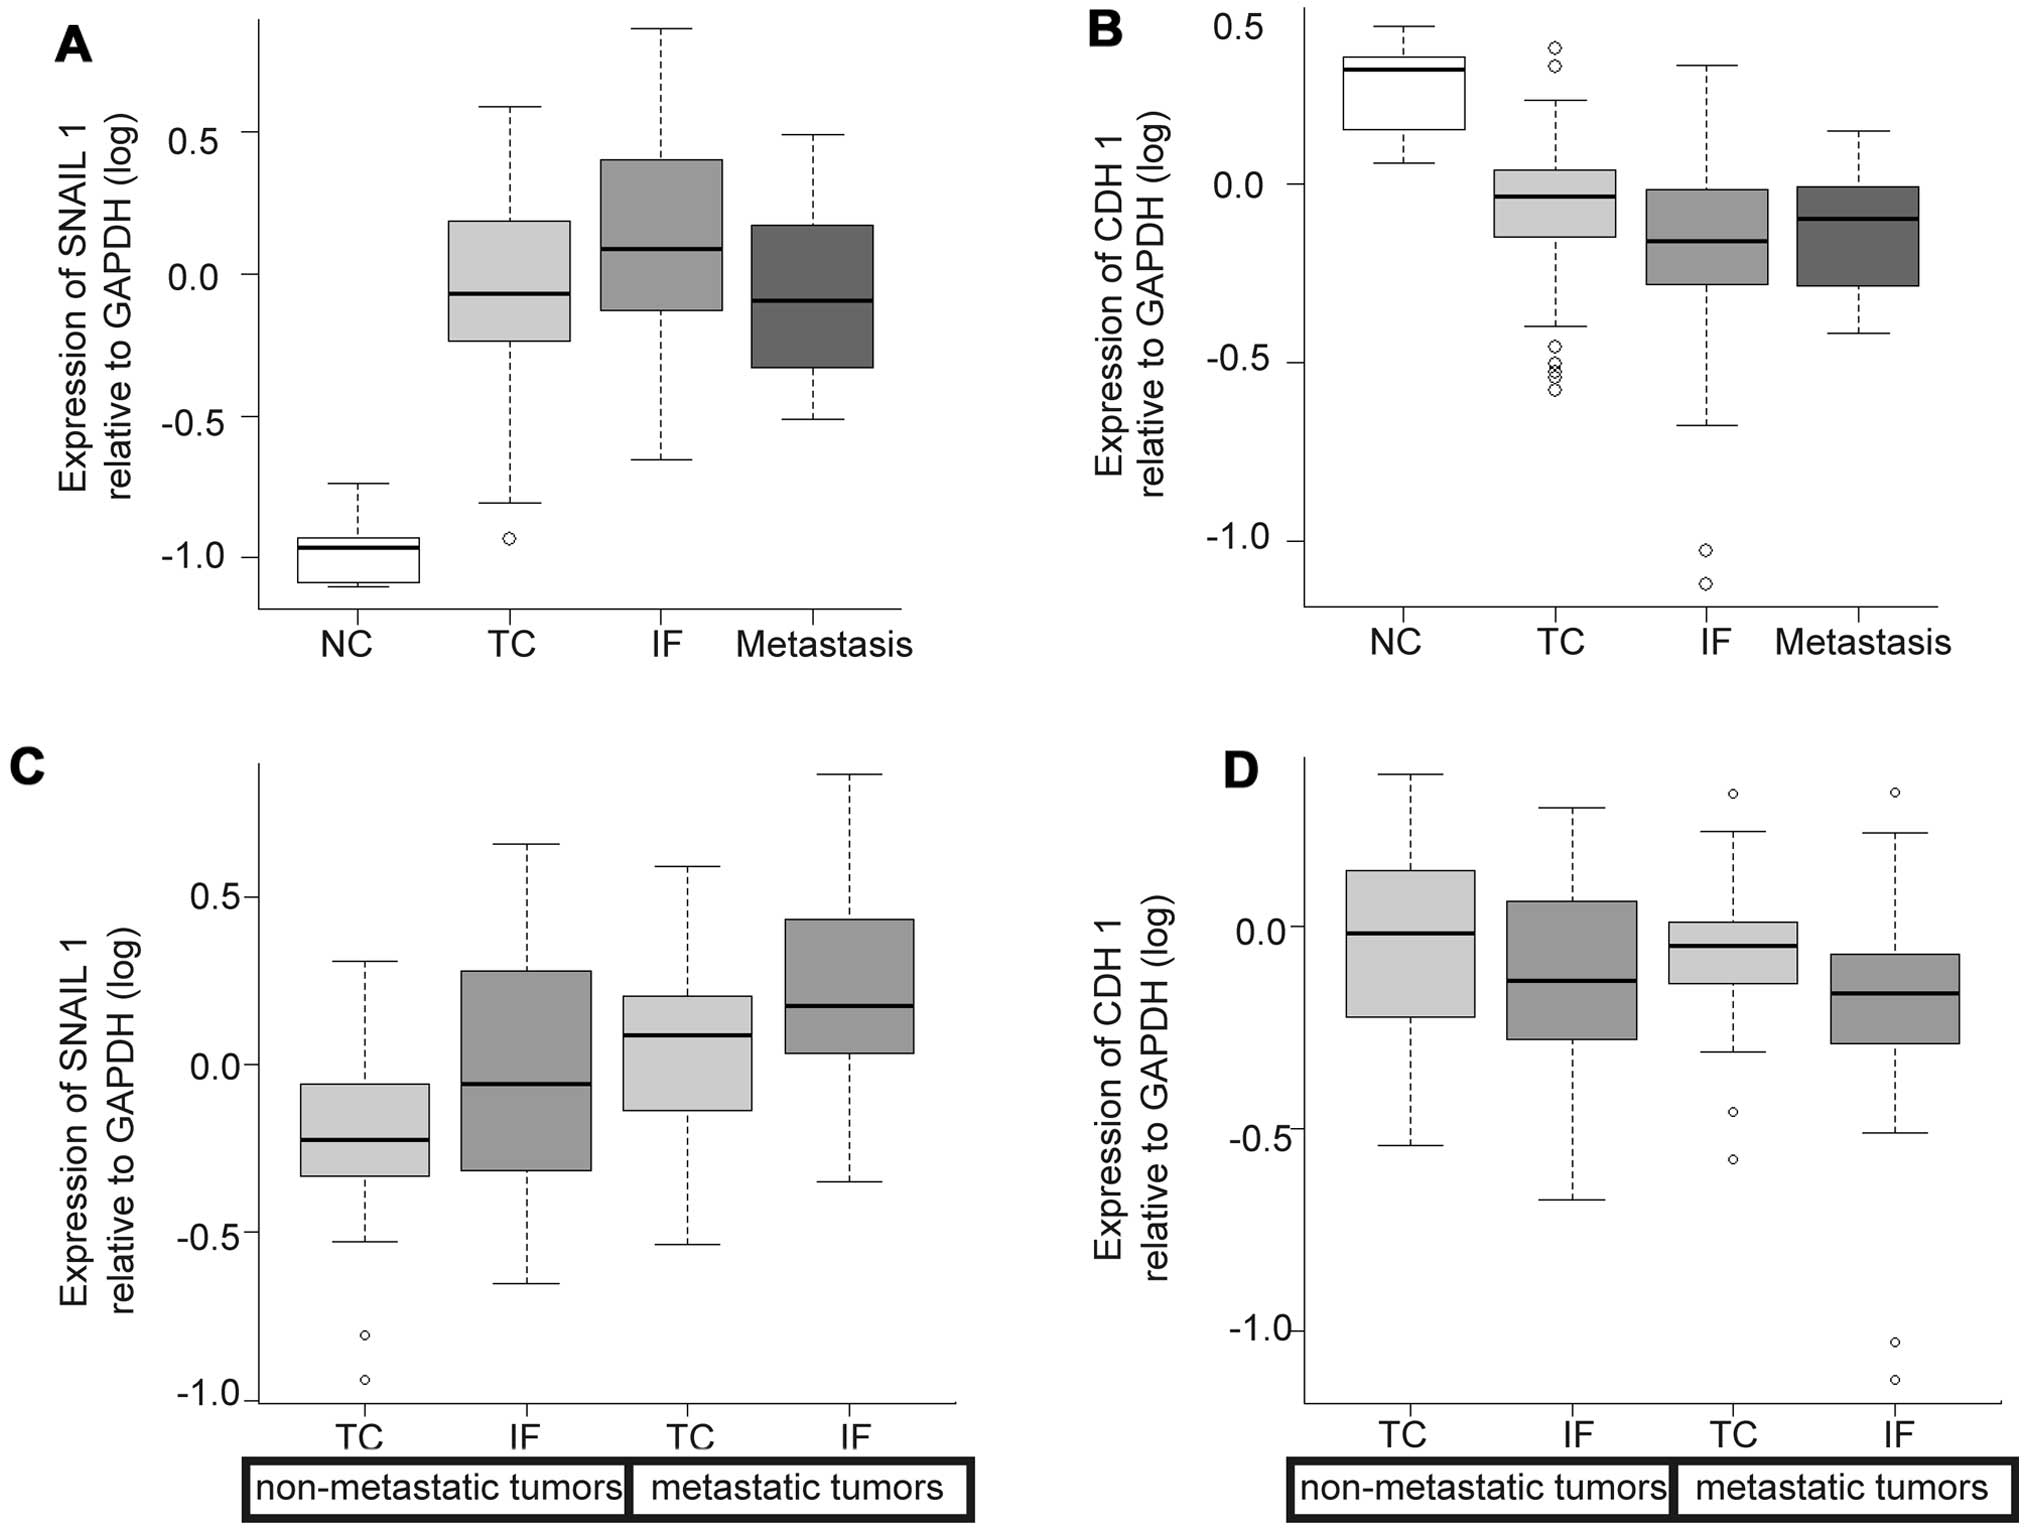
Expression levels of SNAIL1 were higher in the IF
than in the TC and metastasis, but the differences were not
statistically significant. Expression of CDH1 (E-cadherin)
displayed almost the same levels among the 3 locations (Fig. 4A and B).
We compared expression levels of ZEB1 and ZEB2
between metastatic tumors and non-metastatic tumors according to
sample locations. Expression levels of ZEB1 in the IF tended to be
higher in metastatic tumors than in non-metastatic tumors, while
little variation of expression levels in TC was seen regardless of
the presence or absence of metastasis (Fig. 3C). ZEB2 expression in the IF
displayed little variation between metastatic tumors and
non-metastatic tumors (Fig. 3D).
No variation was seen in either SNAIL1 or CDH1 regardless of
locations and the status of metastasis (Fig. 4C and D).
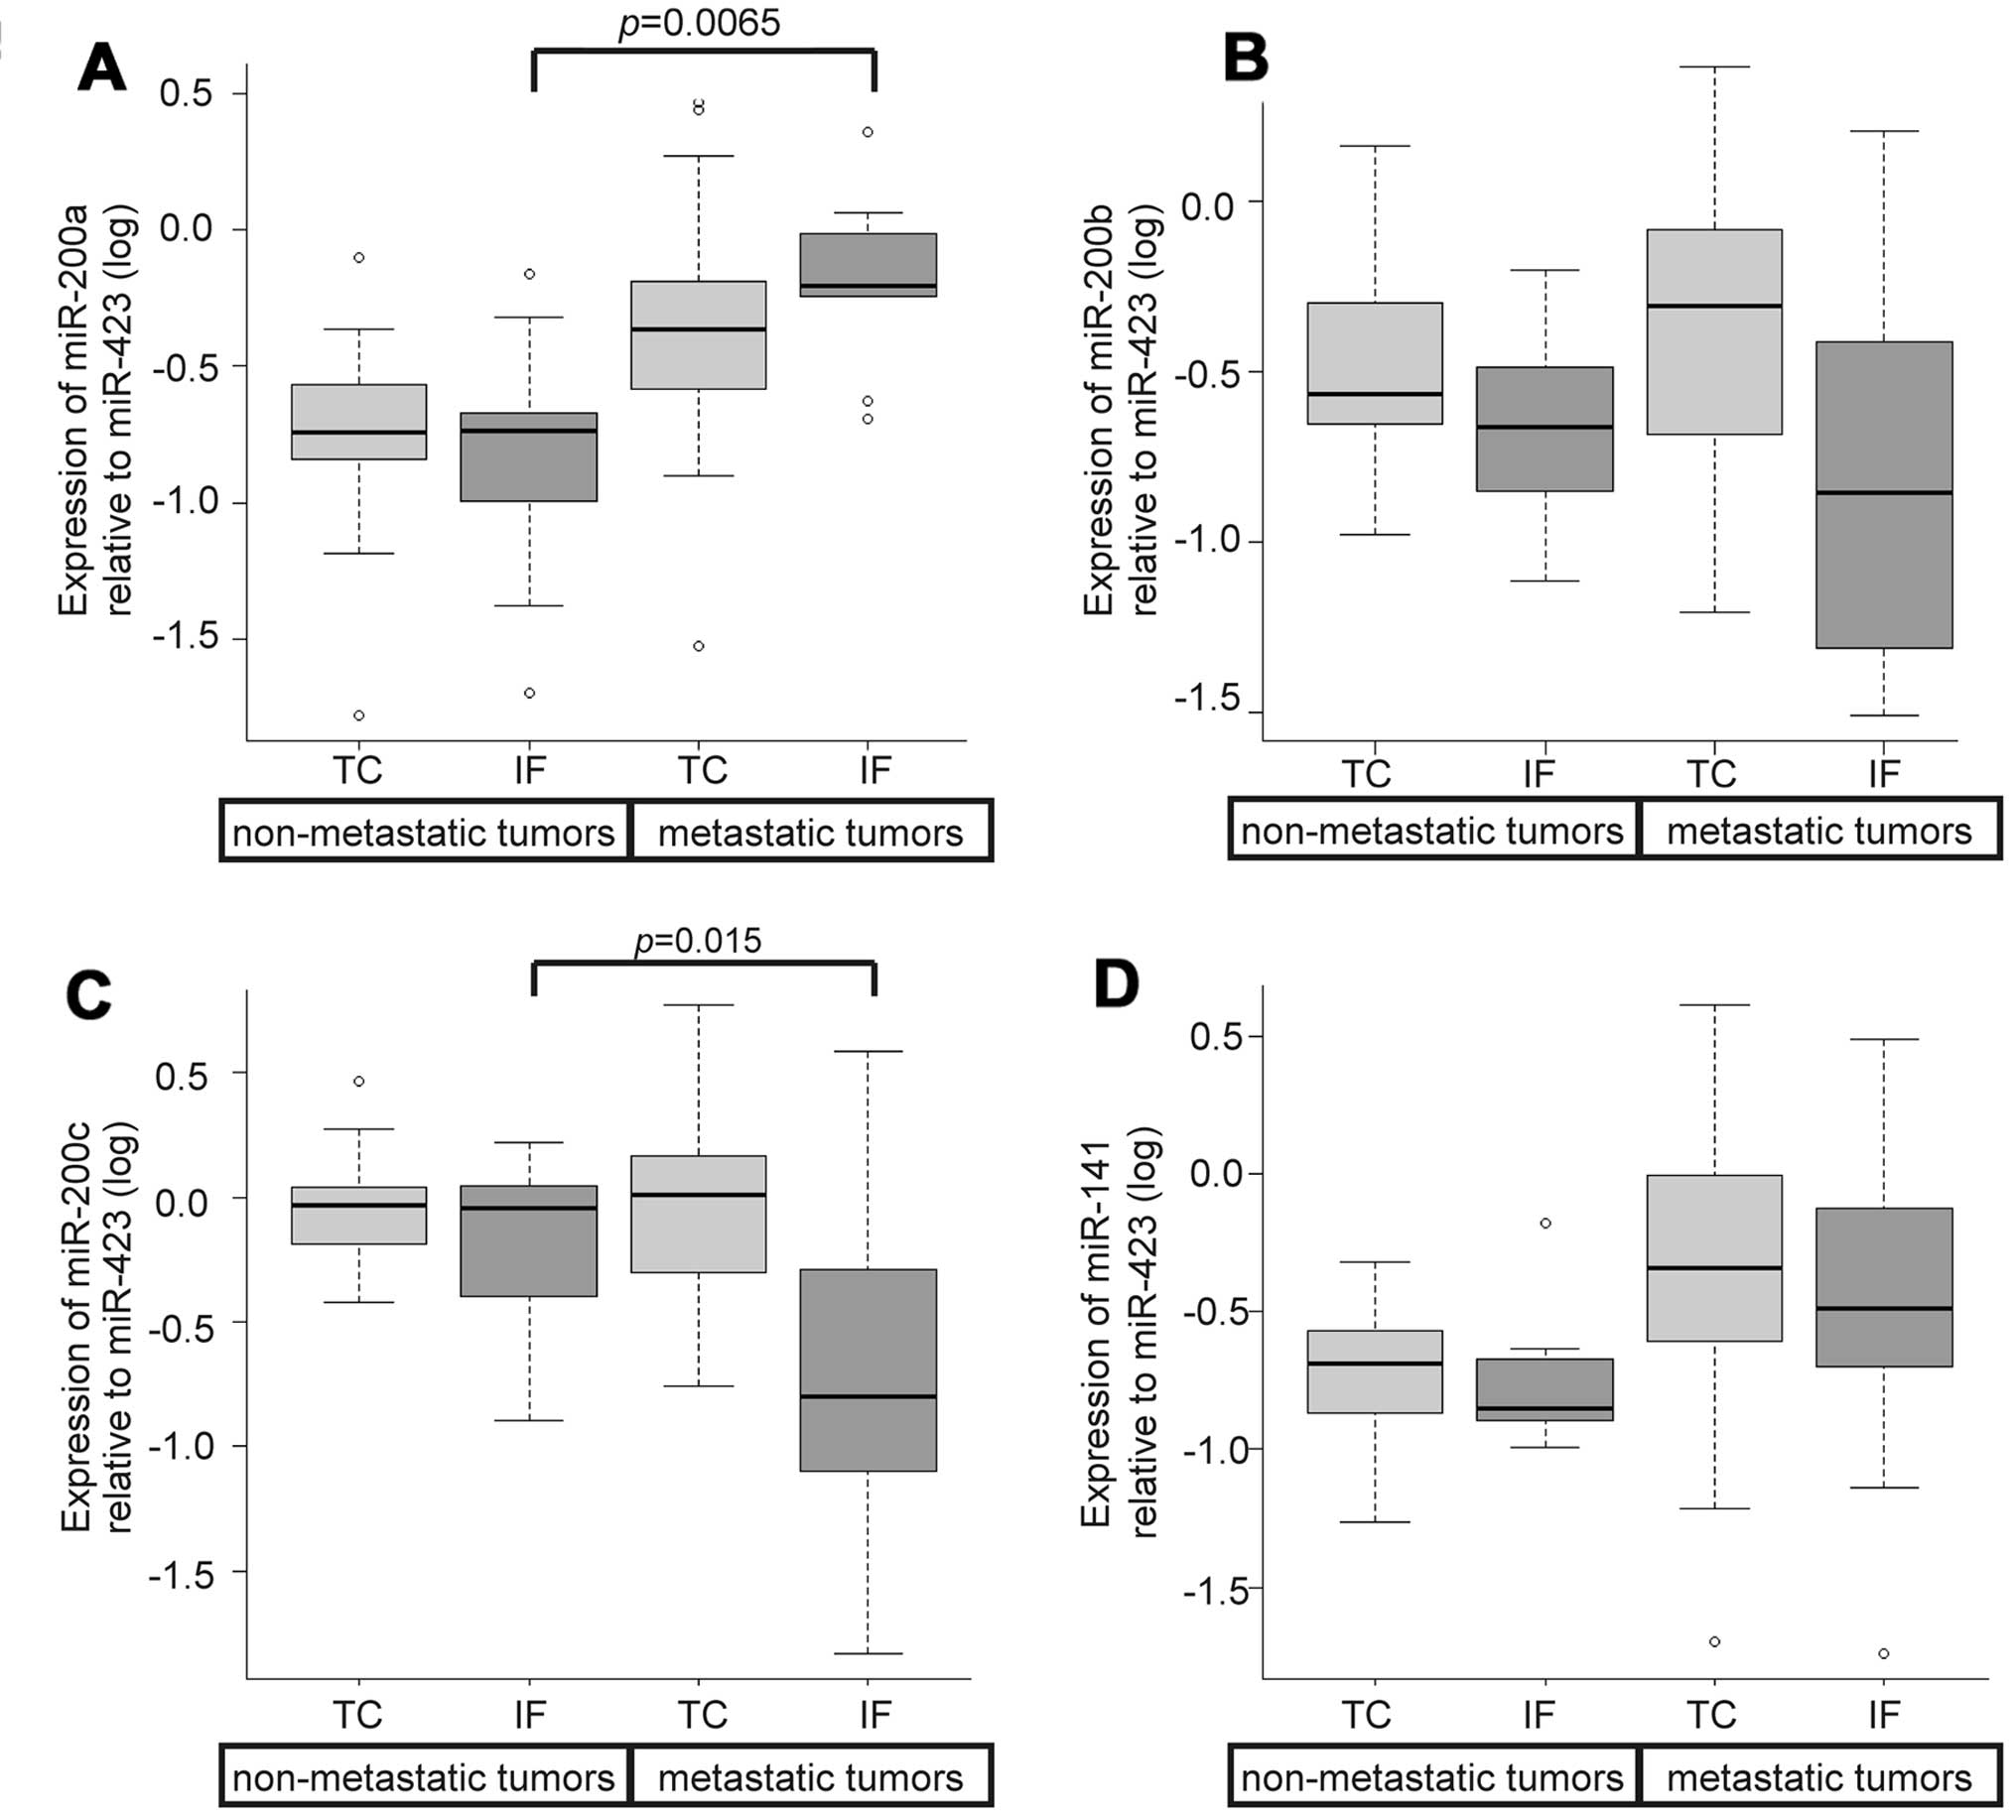
Expression levels of the miR-200 family
and their correlation with ZEB
Expression levels of ZEB1 increased in metastatic
tumors but the level was not significantly different from those in
non-metastatic tumors. We analyzed the miR-200 family, which
regulates ZEB genes, and measured the expression levels of this
family in 88 samples. None of the variants of the miR-200 family
displayed any significant difference in expression between the IF
and TC regardless of the status of metastasis. When we focused on
the IF for expression levels of the miR-200 family while comparing
the status of metastasis, we noted lower levels of miR-200c and
higher levels of miR-200a in metastatic tumors as compared to those
in non-metastatic tumors; these differences were statistically
significant (P=0.015 and P=0.0065, respectively; Fig. 6A and C). None of the variants of
the miR-200 family in the TC displayed any significant difference
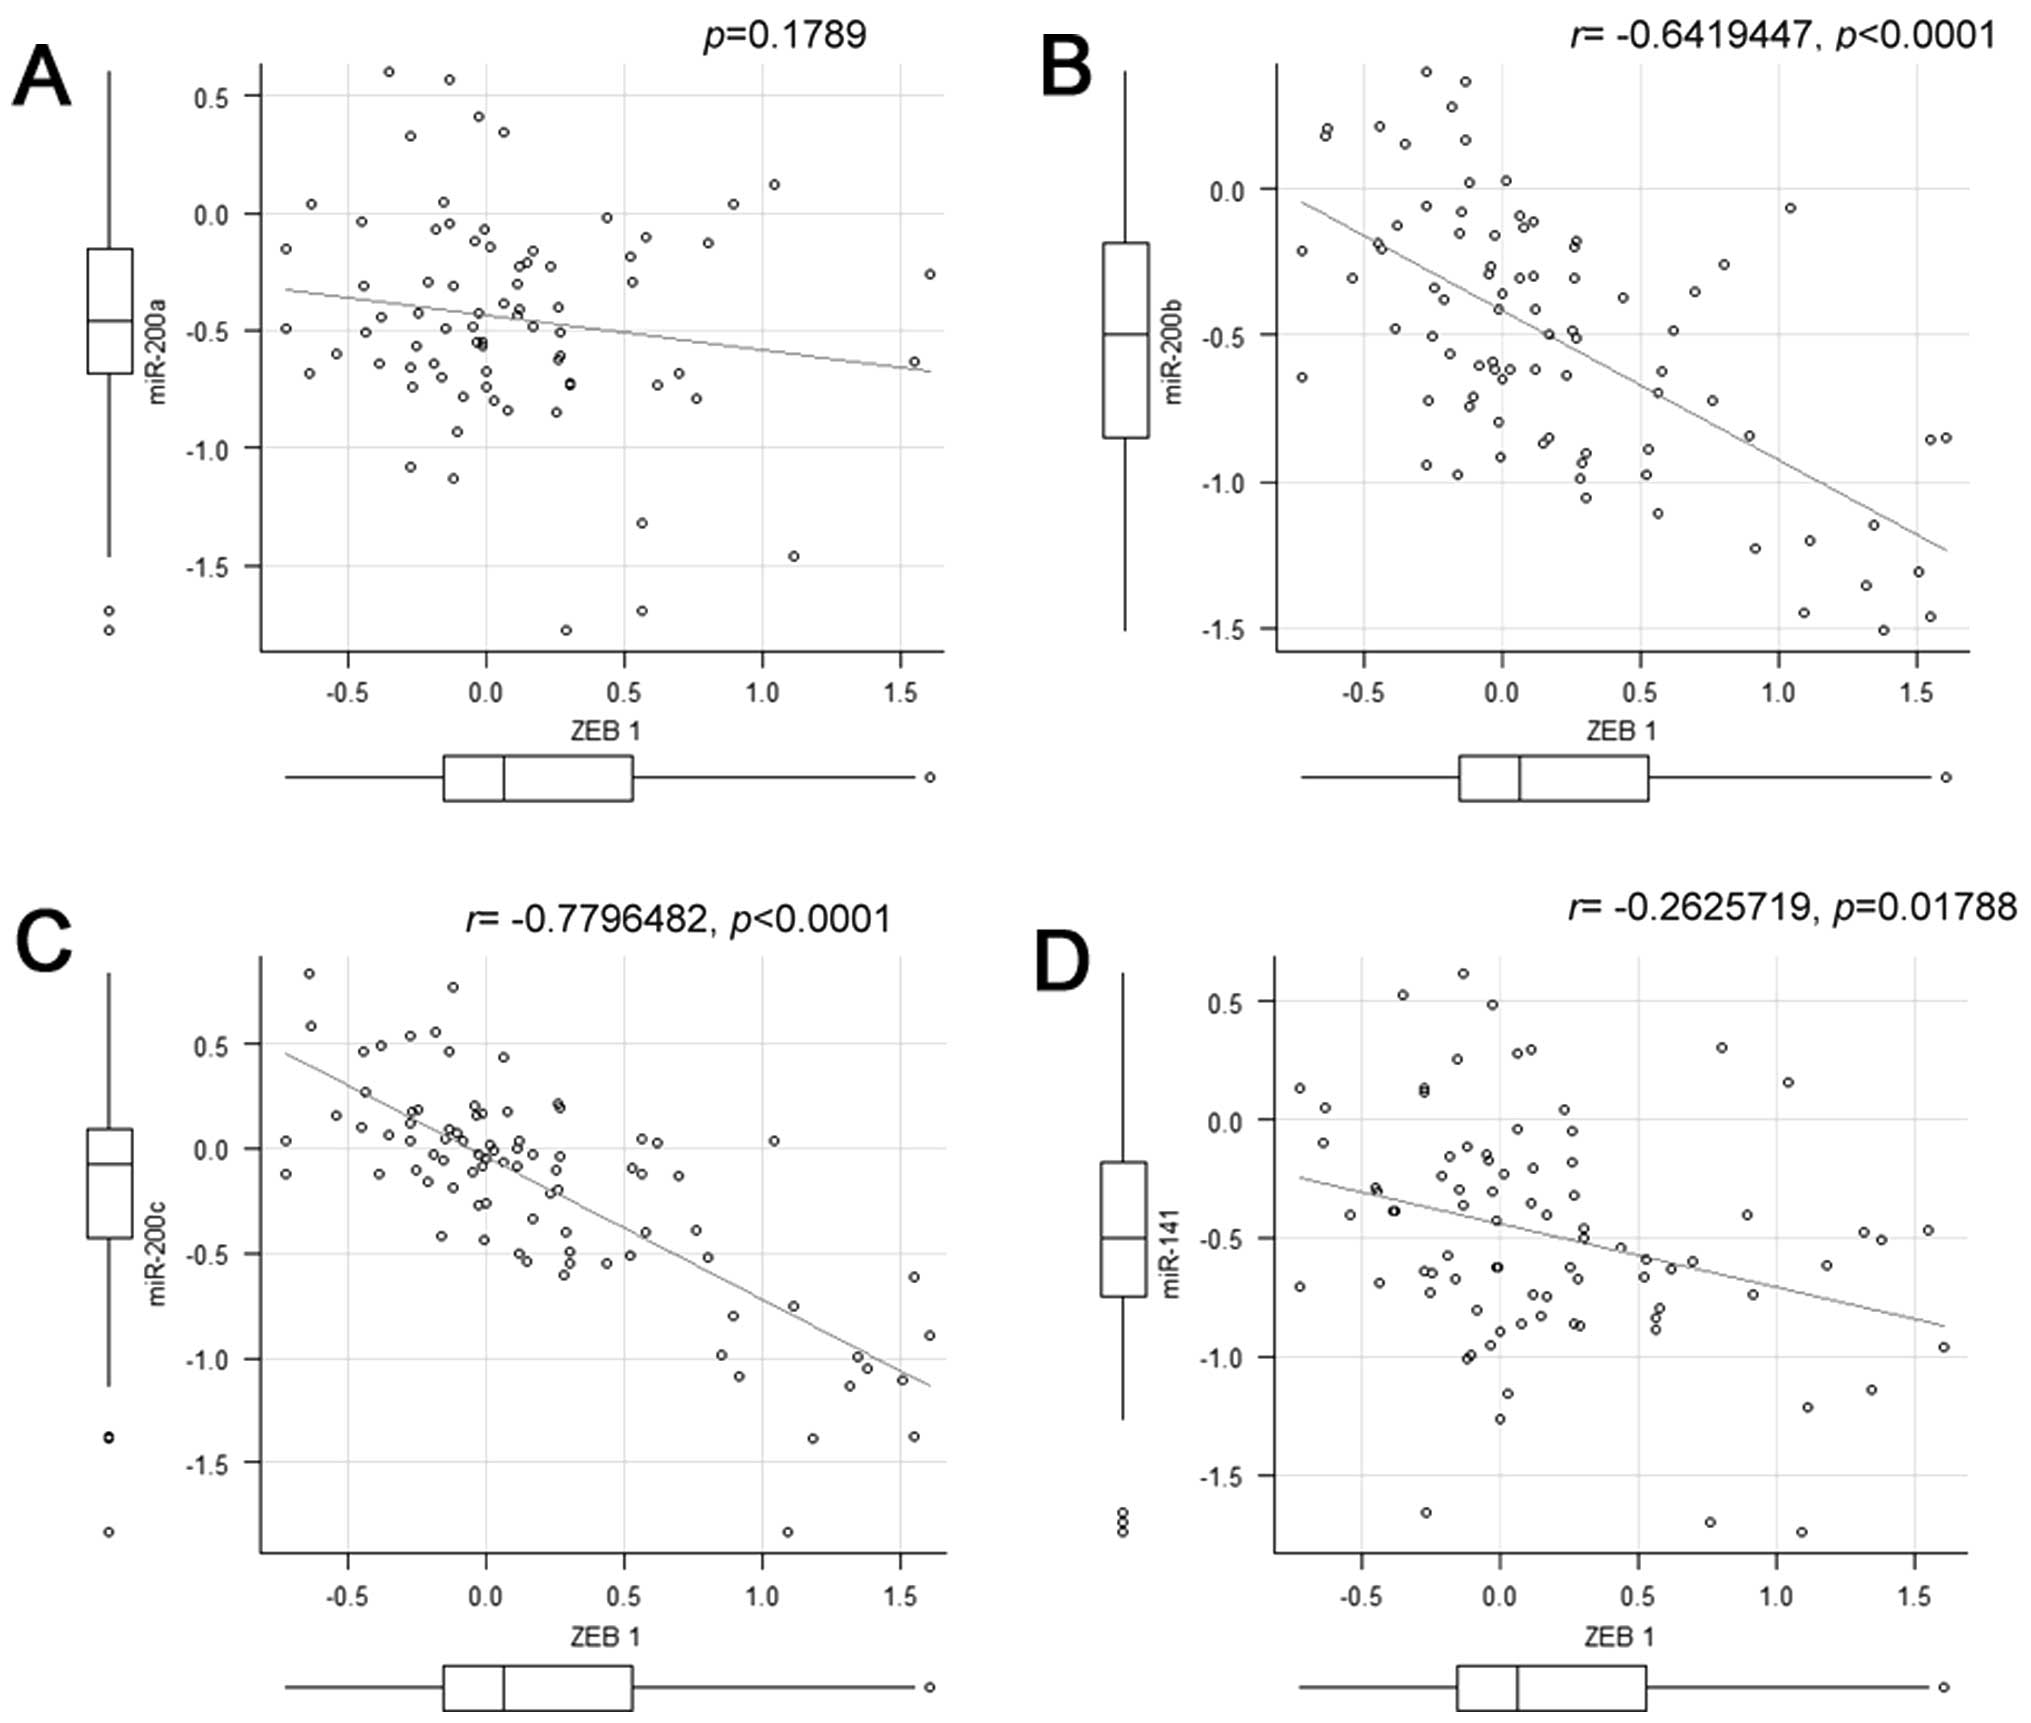
between metastatic tumors and non-metastatic tumors. Correlation
analysis revealed that miR-200b and miR-200c displayed high inverse
correlation with ZEB1 (Fig.
7).
Discussion
In this study, multiple spatially separated sampling
in a tumor revealed heterogeneous expression of the EMT-associated
gene ZEB1 and its negative regulator miR-200c. Heterogeneous
expression of these genes was seen in the IF of metastatic tumors,
in which EMT-inducing signal pathways such as the VEGF and Wnt
pathways were activated.
Although EMT plays a fundamental role in tumor
progression and metastasis formation in vitro, evidence of
EMT in human cancers has not been verified. We addressed intratumor
heterogeneity of primary colorectal cancers in this study.
To investigate heterogeneous molecular profiles
underlying invasion and metastasis in a tumor, we compared gene
expression in the TC and IF, and the expression ratio between TC
and IF was applied to the analysis. This approach enabled us to
recognize the activation of some signaling pathways such as the
VEGF signaling pathway and the Wnt signaling pathway (Table IV). These pathways were
preferentially activated at the IF in metastatic tumors, while no
activation was seen at the TC, regardless of whether the tumor was
metastatic or non-metastatic. These pathways are involved in
metastasis by promoting EMT. VEGFR-1 has been reported to lead to
morphologic and molecular alterations in pancreatic cancer cells;
these alterations are potentially similar to that of EMT to
facilitate the induction of migration and invasion. In addition,
VEGFR-1 activation increases the expression of EMT-associated
transcription factors (24). The
Wnt signaling pathway stabilizes the EMT-associated gene SNAIL by
inhibition of GSK3β kinase (25).
β-catenin is the key molecule implicated in the Wnt signaling
pathway, and its activation was observed at IF in colorectal
cancers through the process of EMT (26), which is consistent with our
data.
Heterogeneous expression of EMT-associated genes was
seen not only in an entire tumor but also in a small part of the
tumor such as the IF (Fig. 2B),
which indicated the importance of multiple spatially separated
sampling. A single sample obtained from IF is insufficient to
evaluate differences in expression levels of EMT-associated genes.
Gerlinger et al (18,19)
stated that intratumor heterogeneity might lead to underestimation
of the genetic complexity of a tumor when single-biopsy procedures
are used.
One of the EMT-associated genes, ZEB1, plays crucial
roles in colorectal cancer progression (27), and high expression of ZEB1 leads to
poor prognosis in primary colorectal cancer (28). However, to the best of our
knowledge, no study has analyzed the relationship between
ZEB-encoding genes and metastasis in primary colorectal cancers. In
this study, analysis of the heterogeneous expression of ZEB1 in the
IF and TC showed that the gene expression patterns for the IF
differed from those for the TC. Metastatic tumors exhibited higher
expression of ZEB1 at the IF than non-metastatic tumors (Fig. 3), indicating that ZEB1 was involved
in metastasis. However, a statistically significant relationship
between expression of ZEB1 and metastasis was not seen in the
analysis.
We next focused on the microRNAs that regulate ZEB1
because microRNAs regulate multiple targets post-transcriptionally
and are more stable than mRNAs in human tissue (29,30).
The miR-200 family is composed of five distinct microRNAs and
controls EMT by downregulating the expression of the ZEB factors
(31,32). Among them, expression levels of
miR-200c decreased at the IF in metastatic tumors. miR-200c
expression showed a statistically significant difference between
metastatic and non-metastatic tumors while no statistical
significance was seen for ZEB1. Expression levels of miR-200c
showed an inverse correlation with those of ZEB1 (Fig. 7), which is consistent with the
report that miR-200 regulates the expression of ZEB1 in cultured
cells (11). Considering these
findings and the fact that microRNAs are stable in tissues,
miR-200c would provide more useful information for predicting
metastasis than ZEB1. The expression of miR-200a increased at the
IF in metastatic tumors while that of miR-200c decreased (Fig. 6). This may be due to differences in
structure between miR-200c and miR-200a although they have homology
in their sequences (32). The
expression of miR-200a did not show significant correlation with
the expression of ZEB1.
In this study, heterogeneous expression of
EMT-associated genes was identified by multiple spatially separated
sampling. However, this procedure is too complicated and
time-consuming for clinical practice. One of the ideal tools for
clinical application could be ‘liquid biopsy’ for detecting
tumor-originating genes and cells in blood; a recent study showed
that miR-200c could be detected in serum, which correlated with the
prognosis in primary colorectal cancers (33). Although more convenient tools
should be applied to clinical practice, we believe that our data
obtained by multiple sampling in a tumor could provide insights
into the intratumor heterogeneity of EMT-associated genes in
connection with tumor metastasis in primary colorectal cancers.
Tumors likely exhibit the feature of potential metastasis at the
IF, in which altered expression of ZEB1 and miR-200c was seen,
along with activation of EMT-inducing signaling pathways such as
the VEGF and Wnt pathways.
Acknowledgements
The present study was supported in part by a
grant-in-aid from The Research Award to JMU Graduate Student, JSPS
KAKENHI Grant Number 15K10147, and the JKA Foundation through its
promotion funds from Keirin Racing.
References
|
1
|
Thompson EW, Newgreen DF and Tarin D:
Carcinoma invasion and metastasis: A role for
epithelial-mesenchymal transition? Cancer Res. 65:5991–5995;
discussion 5995. 2005. View Article : Google Scholar : PubMed/NCBI
|
|
2
|
Peinado H, Olmeda D and Cano A: Snail, Zeb
and bHLH factors in tumour progression: An alliance against the
epithelial phenotype? Nat Rev Cancer. 7:415–428. 2007. View Article : Google Scholar : PubMed/NCBI
|
|
3
|
Eccles SA and Welch DR: Metastasis: Recent
discoveries and novel treatment strategies. Lancet. 369:1742–1757.
2007. View Article : Google Scholar : PubMed/NCBI
|
|
4
|
Lamouille S, Xu J and Derynck R: Molecular
mechanisms of epithelial-mesenchymal transition. Nat Rev Mol Cell
Biol. 15:178–196. 2014. View
Article : Google Scholar : PubMed/NCBI
|
|
5
|
Kalluri R and Weinberg RA: The basics of
epithelial-mesenchymal transition. J Clin Invest. 119:1420–1428.
2009. View
Article : Google Scholar : PubMed/NCBI
|
|
6
|
Chui MH: Insights into cancer metastasis
from a clinicopathologic perspective: Epithelial-mesenchymal
transition is not a necessary step. Int J Cancer. 132:1487–1495.
2013. View Article : Google Scholar
|
|
7
|
Nieto MA: Epithelial plasticity: A common
theme in embryonic and cancer cells. Science. 342:12348502013.
View Article : Google Scholar : PubMed/NCBI
|
|
8
|
Nieto MA: The snail superfamily of
zinc-finger transcription factors. Nat Rev Mol Cell Biol.
3:155–166. 2002. View
Article : Google Scholar : PubMed/NCBI
|
|
9
|
Yang J and Weinberg RA:
Epithelial-mesenchymal transition: At the crossroads of development
and tumor metastasis. Dev Cell. 14:818–829. 2008. View Article : Google Scholar : PubMed/NCBI
|
|
10
|
Thiery JP, Acloque H, Huang RY and Nieto
MA: Epithelial-mesenchymal transitions in development and disease.
Cell. 139:871–890. 2009. View Article : Google Scholar : PubMed/NCBI
|
|
11
|
Gregory PA, Bert AG, Paterson EL, Barry
SC, Tsykin A, Farshid G, Vadas MA, Khew-Goodall Y and Goodall GJ:
The miR-200 family and miR-205 regulate epithelial to mesenchymal
transition by targeting ZEB1 and SIP1. Nat Cell Biol. 10:593–601.
2008. View
Article : Google Scholar : PubMed/NCBI
|
|
12
|
Lamouille S, Subramanyam D, Blelloch R and
Derynck R: Regulation of epithelial-mesenchymal and
mesenchymal-epithelial transitions by microRNAs. Curr Opin Cell
Biol. 25:200–207. 2013. View Article : Google Scholar : PubMed/NCBI
|
|
13
|
Thiery JP: Epithelial-mesenchymal
transitions in tumour progression. Nat Rev Cancer. 2:442–454. 2002.
View Article : Google Scholar : PubMed/NCBI
|
|
14
|
Busch EL, McGraw KA and Sandler RS: The
potential for markers of epithelial-mesenchymal transition to
improve colorectal cancer outcomes: A systematic review. Cancer
Epidemiol Biomarkers Prev. 23:1164–1175. 2014. View Article : Google Scholar : PubMed/NCBI
|
|
15
|
Bates RC and Mercurio AM: The
epithelial-mesenchymal transition (EMT) and colorectal cancer
progression. Cancer Biol Ther. 4:365–370. 2005. View Article : Google Scholar : PubMed/NCBI
|
|
16
|
Nowell PC: The clonal evolution of tumor
cell populations. Science. 194:23–28. 1976. View Article : Google Scholar : PubMed/NCBI
|
|
17
|
Yachida S, Jones S, Bozic I, Antal T,
Leary R, Fu B, Kamiyama M, Hruban RH, Eshleman JR, Nowak MA, et al:
Distant metastasis occurs late during the genetic evolution of
pancreatic cancer. Nature. 467:1114–1117. 2010. View Article : Google Scholar : PubMed/NCBI
|
|
18
|
Gerlinger M, Rowan AJ, Horswell S, Larkin
J, Endesfelder D, Gronroos E, Martinez P, Matthews N, Stewart A,
Tarpey P, et al: Intratumor heterogeneity and branched evolution
revealed by multiregion sequencing. N Engl J Med. 366:883–892.
2012. View Article : Google Scholar : PubMed/NCBI
|
|
19
|
Gerlinger M, Horswell S, Larkin J, Rowan
AJ, Salm MP, Varela I, Fisher R, McGranahan N, Matthews N, Santos
CR, et al: Genomic architecture and evolution of clear cell renal
cell carcinomas defined by multiregion sequencing. Nat Genet.
46:225–233. 2014. View
Article : Google Scholar : PubMed/NCBI
|
|
20
|
McGranahan N and Swanton C: Biological and
therapeutic impact of intratumor heterogeneity in cancer evolution.
Cancer Cell. 27:15–26. 2015. View Article : Google Scholar : PubMed/NCBI
|
|
21
|
Schroeder A, Mueller O, Stocker S,
Salowsky R, Leiber M, Gassmann M, Lightfoot S, Menzel W, Granzow M
and Ragg T: The RIN: An RNA integrity number for assigning
integrity values to RNA measurements. BMC Mol Biol. 7:32006.
View Article : Google Scholar : PubMed/NCBI
|
|
22
|
Saeed AI, Sharov V, White J, Li J, Liang
W, Bhagabati N, Braisted J, Klapa M, Currier T, Thiagarajan M, et
al: TM4: A free, open-source system for microarray data management
and analysis. Biotechniques. 34:374–378. 2003.PubMed/NCBI
|
|
23
|
Kanda Y: Investigation of the freely
available easy-to-use software ‘EZR’ for medical statistics. Bone
Marrow Transplant. 48:452–458. 2013. View Article : Google Scholar
|
|
24
|
Yang AD, Camp ER, Fan F, Shen L, Gray MJ,
Liu W, Somcio R, Bauer TW, Wu Y, Hicklin DJ, et al: Vascular
endothelial growth factor receptor-1 activation mediates epithelial
to mesenchymal transition in human pancreatic carcinoma cells.
Cancer Res. 66:46–51. 2006. View Article : Google Scholar : PubMed/NCBI
|
|
25
|
Zhou BP, Deng J, Xia W, Xu J, Li YM,
Gunduz M and Hung MC: Dual regulation of Snail by
GSK-3beta-mediated phosphorylation in control of
epithelial-mesenchymal transition. Nat Cell Biol. 6:931–940. 2004.
View Article : Google Scholar : PubMed/NCBI
|
|
26
|
Brabletz T, Jung A, Reu S, Porzner M,
Hlubek F, Kunz-Schughart LA, Knuechel R and Kirchner T: Variable
beta-catenin expression in colorectal cancers indicates tumor
progression driven by the tumor environment. Proc Natl Acad Sci
USA. 98:10356–10361. 2001. View Article : Google Scholar : PubMed/NCBI
|
|
27
|
Spaderna S, Schmalhofer O, Hlubek F, Berx
G, Eger A, Merkel S, Jung A, Kirchner T and Brabletz T: A
transient, EMT-linked loss of basement membranes indicates
metastasis and poor survival in colorectal cancer.
Gastroenterology. 131:830–840. 2006. View Article : Google Scholar : PubMed/NCBI
|
|
28
|
Peña C, García JM, Silva J, García V,
Rodríguez R, Alonso I, Millán I, Salas C, de Herreros AG, Muñoz A,
et al: E-cadherin and vitamin D receptor regulation by SNAIL and
ZEB1 in colon cancer: Clinicopathological correlations. Hum Mol
Genet. 14:3361–3370. 2005. View Article : Google Scholar : PubMed/NCBI
|
|
29
|
Pasquinelli AE: MicroRNAs and their
targets: Recognition, regulation and an emerging reciprocal
relationship. Nat Rev Genet. 13:271–282. 2012.PubMed/NCBI
|
|
30
|
Peiró-Chova L, Peña-Chilet M,
López-Guerrero JA, García-Giménez JL, Alonso-Yuste E, Burgues O,
Lluch A, Ferrer-Lozano J and Ribas G: High stability of microRNAs
in tissue samples of compromised quality. Virchows Arch.
463:765–774. 2013. View Article : Google Scholar : PubMed/NCBI
|
|
31
|
Wellner U, Schubert J, Burk UC,
Schmalhofer O, Zhu F, Sonntag A, Waldvogel B, Vannier C, Darling D,
zur Hausen A, et al: The EMT-activator ZEB1 promotes tumorigenicity
by repressing stemness-inhibiting microRNAs. Nat Cell Biol.
11:1487–1495. 2009. View
Article : Google Scholar : PubMed/NCBI
|
|
32
|
Uhlmann S, Zhang JD, Schwäger A,
Mannsperger H, Riazalhosseini Y, Burmester S, Ward A, Korf U,
Wiemann S and Sahin O: miR-200bc/429 cluster targets PLCgamma1 and
differentially regulates proliferation and EGF-driven invasion than
miR-200a/141 in breast cancer. Oncogene. 29:4297–4306. 2010.
View Article : Google Scholar : PubMed/NCBI
|
|
33
|
Toiyama Y, Hur K, Tanaka K, Inoue Y,
Kusunoki M, Boland CR and Goel A: Serum miR-200c is a novel
prognostic and metastasis-predictive biomarker in patients with
colorectal cancer. Ann Surg. 259:735–743. 2014. View Article : Google Scholar :
|