Introduction
Lung cancer is one of the most prevalent cancers
(1.6 million new cases yearly) and one of the most common cause of
deaths (more than million per year) with the mortality to incidence
ratio 0.86. Lung cancer stands for 21.2% of all diagnosed cancers
in men, and 8.6% among women (after breast and colorectal cancers)
(1,2). In clinical classification two main
types of lung cancer are distinguished: small cell lung cancer
(SCLC) and non-small cell lung cancer (NSCLC) accounting for almost
80% of lung cancers (3). The three
main NSCLC subtypes are squamous cell carcinoma (SSC),
adenocarcinoma (AC) and large cell cancer (LCC) (4). Late detection of lung tumor (AJCC
stage III/IV) drastically reduces the chance for a cure; the 5-year
survival rate is ~6.6% (2).
Detection of lung cancer in stage I increase the survival up to 83%
(5). For this reason, it is
important to search for candidate biomarkers, which will enable to
recognize NSCLC on early stage and will help to distinguish its
subtypes.
Tumor suppressor genes (TSG) are potential cancer
markers because their expression in tumor tissues is suppressed or
lost. Loss of function can occur as an effect of genetic
instability (inactivating mutations, loss of heterozygosity) or by
the promoter region hypermethylation (epigenetic mechanism). In
lung cancer TSG inactivation frequently occurs in critical regions
on 3p, such as 3p21 covering the loci of RASSF1A, RARB,
MLH1 (6). One of the potential
biomarker is FHIT located in 3p14.2 described as FRA3B
fragile site, the region frequently altered in lung carcinogenesis.
FHIT (member of the histidine triad gene family) encodes a
diadenosine 5′,5‴-P1, P3-triphosphate hydrolase involved in purine
metabolism. FHIT protein is homologous to Ap4A hydrolase from the
yeast Schizosaccharomyces pombe and also exhibits Ap3A
activity in enzymatic assays (7).
FHIT inhibits the serine/threonine kinase Akt, a key effector in
PI3K pathway, promoting survival and cell growth in response to
extracellular signals (8). The TSG
function of this gene is reflected by regulation of programmed cell
death and suppression of tumor metastasis (8). FHIT protein also plays a role in the
modulation of response to DNA damage, for example, preventing the
replication of stress-induced DNA damage. FHIT interacts
with C-terminal domain of β-catenin, inhibiting the Wnt signaling
pathway and its target genes, including cyclin D1, MMP14 and
survivin (9). FHIT protein
with Chk1 kinase plays important role in S phase checkpoint.
Introduction of a wild-type FHIT gene suppresses
tumorigenicity and FHIT transfection in
‘FHIT-lacking’ human cancer cells appears to induce
apoptosis and inhibit cell growth (10,11).
Several investigators have shown that loss of FHIT function
in preneoplastic lesions can lead to the accumulation of DNA damage
and cell transformation; therefore it is defined as the guardian of
the preneoplastic genome (12–14).
Aberrant FHIT expression caused by truncated
transcripts or promoter region hypermethylation has been found in
esophageal, stomach, and colon carcinomas (7,15).
Lack of FHIT expression in several studies was demonstrated
to have impact on tumor aggressiveness (16). In addition, decreased FHIT
expression present in preneoplastic lesions of the lung has been
proposed to predict NSCLC outcome (12). LOH-dependent FHIT decreased
expression have been linked with high proliferation and low
apoptotic index in tumor cells, particularly in SCC (17). It has also been proven that
co-hypermethylation of p16 and FHIT genes in early stage of
NSCLC is poor prognostic factor and can confer cisplatin resistance
in NSCLC cells (18).
The aim of this study was to assess the relationship
between FHIT gene promoter methylation level and FHIT
gene expression, both in lung cancer tissue and macroscopically
unchanged tissue from the operational margin. FHIT protein
expression level was also evaluated. The obtained results were
correlated with the clinical features of patients, tobacco
addiction and histopathological characteristics of lung tumors.
Materials and methods
Clinical characterization of patients and
the NSCLC tissue samples
The study received the approval of the Ethics
Committee of the Medical University of Lodz, Poland, agreement no.
RNN/140/10/KE. All patients were informed and written consent was
obtained from each patient.
The lung tissues were obtained from 65 patients who
underwent lobectomy or pneumonectomy between July 2010 and March
2013 in the Department of Thoracic Surgery, General and Oncologic
Surgery, Medical University of Lodz, Poland. Patients selected for
the study had primary tumors and were preoperatively cytologically
and histopathologically assessed. Patients did not undergo chemo-
or radiotherapy treatment prior to the surgery. The resected tumors
were post-operatively subjected to the histopathological analysis.
Based on the histopathological results, the NSCLC diagnoses were
confirmed for 59 patients, and those patients qualified for further
studies. NSCLC samples in the histopathological evaluation were
classified as: squamous cell carcinoma (SCC, n=34), adenocarcinoma
(AC, n=20), and large cell carcinoma (LCC, n=5). The tumor samples
were classified according to the AJCC staging (19) as well as TNM classification (pTNM)
post-operative tumor node metastasis classification according to
the WHO Histological Typing of Lung Tumors). The study group
comprised of 24 women and 35 men. The smoking history was obtained
from each patient. Detailed clinicopathological information on
NSCLC patients is presented in Table
I.
 | Table IPatient profile and tumor
characteristics. |
Table I
Patient profile and tumor
characteristics.
|
Characteristics | Mean age ± SD | No. of
patients |
|---|
| Gender |
| Women | 63.08±7.820 | 24 (40.7%) |
| Men | 65.78±7.315 | 35 (59.3%) |
| NSCLC
histopathological verification |
| SCC | 67.46±6.13 | 34 (58%) |
| AC | 65.93±5.13 | 20 (34.4%) |
| LCC | 60.91±3.54 | 5 (8.6%) |
| Tobacco addiction
and consumption |
| Current
smokers | | 31 (53.5%) |
| Former
smokers | | 23 (43%) |
| Non-smokers | | 4 (6.75%) |
| Pack Yearsa (PYs) |
| <40 PYs | | 26 (48%) |
| ≥40 PYs | | 28 (52%) |
| Lung cancer
staging |
| AJCC
Stagingb |
| IA/IB | | 14 (25%) |
| IIA/IIB | | 23 (41%) |
| IIIA/IIIB | | 18 (32%) |
| pTNM staging |
| pT1 | | 15 (27%) |
| pT2 | | 23 (41%) |
| pT3/pT4 | | 17 (30%) |
For the study purposes a pair of lung tissue samples
was collected from each patient: from the center of the lesion and
from the operational margin (obtained from the most distant site
from the resected lesion) - the macroscopically unchanged lung
tissue, that served as control tissue. The resected lung tissues
(100–150 mg) were immediately placed in RNA stabilizing buffer
(RNAlater®, Qiagen, Hilden, Germany), cut into smaller
parts and stored in −80°C until further use.
Genomic DNA and total RNA isolation
Genomic DNA and total RNA from NSCLC samples and
macroscopically unchanged lung tissues were isolated using the
column methods, QIAamp DNA Mini kit (Qiagen) and Universal RNA
Purification kit (Eurx Ltd., Gdansk, Poland), according to the
manufacturer’s protocol. After the isolation, quality and quantity
of DNA and RNA was spectrophotometrically assessed (BioPhotometer™
Plus; Eppendorf, Hamburg, Germany). For further analysis only high
quality DNA samples with a 260/280 nm ratio in the range of 1.8–2.0
and DNA concentration over 50 ng/μl were used. RNA was additionally
submitted to qualitative and quantitative assessment in automated
capillary electrophoresis on Agilent 2100 Bioanalyzer (Agilent
Technologies, Santa Clara, CA, USA) using RNA 6000 Pico/Nano
LabChip kit (Agilent Technologies) in order to estimate the 18S/28S
rRNA ratio.
Evaluation of FHIT gene promoter
methylation
Bisulfite conversion: In order to distinguish
methylated from unmethylated cytosine in DNA sequence, the
bisulfite conversion reaction was performed (20). The conversion was performed with
commercially available kit CpGenome™ Turbo Bisulfide
Modification kit (Chemicon International, Millipore, USA),
according to the manufacturer’s protocol. For the reaction with
sodium bisulfite 1 μg of genomic DNA was used. After conversion,
the quality and quantity of DNA was spectrophotometrically assessed
at 260/280 nm in biophotometer (BioPhotometer™ Plus;
Eppendorf).
Methylation specific PCR
In order to assess the methylation status of the
studied gene, the methylation-specific polymerase chain reaction
(MS-PCR) was performed using two pairs of primers (methylated and
unmethylated) and bisulfite converted DNA. MS-PCR was performed in
a total volume of 12.5 μl and the mix contained: 2.5 μM dNTPs mix,
2.5 μM MgCl2, Hot Start AmpliTaq Gold® 360
Polymerase (5 U/μl), 10X Universal PCR buffer, nuclease-free water
(Applied Biosystems, Foster City, CA, USA), 0.7 μM of each primer
(Sigma-Aldrich, Poznań, Poland) and 1000 ng of converted DNA. The
set of primers for the studied gene was flanking the 1 kb 5′ region
upstream from the translation start point. Two pairs of primers for
MS-PCR were designed to amplify the same fragment of FHIT
promoter region, according to the criteria described by Feltus
et al (21) using the
online MethPrimer tool (22). The
primer sequences and product length are presented in Table II.
| Table IIMS-PCR primer sequences and expected
product length. |
Table II
MS-PCR primer sequences and expected
product length.
| Primer sequence
(5′-3′) |
|---|
| Meth F |
AAAAGAAATTTAGTTAGTGGGAAGTC |
| Meth R |
AAAAAAATTTAAAACATAAATCGCA |
| Unmeth F |
AGAAATTTAGTTAGTGGGAAGTTGT |
| Unmeth R |
AAAAAAATTTAAAACATAAATCACA |
The amplification was conducted in a Thermocycler
SureCycler 8800 (Agilent Technologies). MS-PCR conditions were as
follows: initial denaturation at 95°C for 5 min, followed by 35
cycles involving denaturation at 95°C for 45 sec, annealing
temperature 52.5°C for 45 sec and elongation at 72°C for 1 min; the
final elongation at 72°C for 10 min. In order to evaluate the
methylation-specific PCR, positive and negative MS-PCR controls
were included. In each experiment, blank sample with nuclease-free
water instead of DNA was used as a control for PCR contamination.
CpGenome universal methylated DNA (enzymatically methylated human
male genomic DNA) served as a positive methylation control and
CpGenome universal unmethylated DNA (human fetal cell line) was
used as a negative control (Chemicon International, Millipore).
CpGenome universal methylated and unmethylated DNA were submitted
to the bisulfide conversion.
MS-PCR products analysis
In order to analyze the MS-PCR products, the
electrophoretic separation was conducted on 2% agarose gel and
visualized in UV transilluminator. Products were also analyzed in
automated capillary electrophoresis, using DNA1000 LabChip kit on
Agilent 2100 Bioanalyzer (Agilent Technologies). Concentrations
(ng) and length of MS-PCR products, U and M, were
spectrophotometrically estimated using DNA size marker (DNA Ladder;
Agilent Technologies). Based on the concentrations results the
Methylation Index (MI) was assessed for each sample, using the
following formula: peak height of methylated products / (peak
height of methylated products + peak height of unmethylated
product), MI=(M)/(M+U).
Evaluation of FHIT expression
In order to analyze the FHIT gene expression
reverse transcription was performed first, using High-Capacity cDNA
Reverse Transcription kit (Applied Biosystems). Reverse
transcription (RT) master mix contained: 10X RT buffer, 25X dNTP
Mix (100 mM), 10X RT Random Primers, MultiScribe™ Reverse
Transcriptase, RNase Inhibitor and nuclease-free water. In RT
reaction 100 ng of total RNA was transcribed to complementary DNA
(cDNA). RT reaction, in a total volume of 20 μl, was performed in a
Thermocycler SureCycler 8800 (Agilent Technologies). The RT
reaction conditions were as follows: 10 min at 25°C, followed by
120 min at 37°C, then the samples were heated to 85°C for 5 sec,
and held at 4°C.
The relative expression of FHIT gene was
conducted on Micro Fluidic Cards - TLDA (TaqMan® Low
Density Arrays, Applied Biosystems) in Applied Biosystems 7900HT
Fast Real-Time PCR System (Applied Biosystems). The qPCR mix
contained: 50 ng of cDNA diluted to 50 μl in RNAse/DNAse free
water, and 50 μl TaqMan Universal Master Mix (Applied Biosystems).
The selected assays: Hs00179987_m1 for FHIT and
Hs00382667_m1 for ESD (esterase D - reference gene) were pre-loaded
on the Micro Fluidic Cards. Real-time PCR reaction was processed in
program containing 2 min of initial incubation at 50°C, 10 min at
94.5°C for polymerase activation, followed by 40 cycles of 30 sec
denaturation at 97°C and 1 min elongation step at 59.7°C. The
FHIT relative expression was assessed using the comparative
delta-delta CT method in TaqMan Relative Quantification Assay
software (Applied Biosystems). ESD RNA expression level served as
the reference gene to adjust the gene of interest expression value
(RQ - relative quantity). Normal lung tissue RNA was used as a
calibrator - Human Lung Total RNA (Ambion®, Life
Technologies, CA, USA).
Evaluation of FHIT protein
expression
Lung tissue samples (10–40 mg) from 51 patients were
rinsed in ice-cold PBS buffer (0.01 mol/l, pH 7.0–7.2) and
homogenized in 5 ml of PBS buffer. The resulting suspension was
subjected to two cycles of freezing and thawing. Then, the
homogenates were centrifuged for 5 min at 5000 x g, the supernatant
was removed and the suspension was aliquoted and stored at −80°C
until further analysis. FHIT immunoexpression levels in lung
tissue homogenates were assessed using ELISA kit for Fragile
Histidine Triad Protein (Aviva Systems Biology Corp., San Diego,
CA, USA) according to the manufacturer’s procedure. The intensity
of the final colorimetric reaction, in proportion to the amount of
protein bound, was measured in a plate reader (ELx800; BioTek
Instruments Inc., Winooski, VT, USA) at the wavelength 450 nm. The
obtained results were compared to the standard solutions of known
concentrations (100–1000 ng/ml).
Statistical analysis
Statistical analysis was performed using the
Statistica for Windows 10.0 software (StatSoft, Cracow, Poland)
(v.10). Nonparametrical statistical tests: ANOVA Kruskal-Wallis,
Mann-Whitney U test and Spearman’s rank correlation coefficient
were used in order to evaluate the relationships between gene
expression level (RQ), immunoexpression level, gene promoter
methylation level (MI) and patient characteristics: age and gender,
smoking status (current/former/never smoker), history of smoking
measured in pack years (PYs) and clinical features of the tumor
(staging according to TNM, AJCC, histopathological NSCLC subtype).
The results of relative expression analysis (RQ value),
immunoexpression level and gene promoter methylation level (MI) are
presented as mean ± SEM and mean ± SD values. Statistical
significance for all tests were set at p<0.05, and assessed by
calculating the p-value.
To identify the parameters associated with
FHIT immuno expression, RQ and MI level stepwise logistic
regression analysis with backward selection were performed using
patient gender, age, history of smoking measured in pack-years
(PY), AJCC and histopathological NSCLC subtype as independent
variables selected after exclusion of autocorrelated
covariates.
Results
Evaluation of FHIT gene promoter
methylation
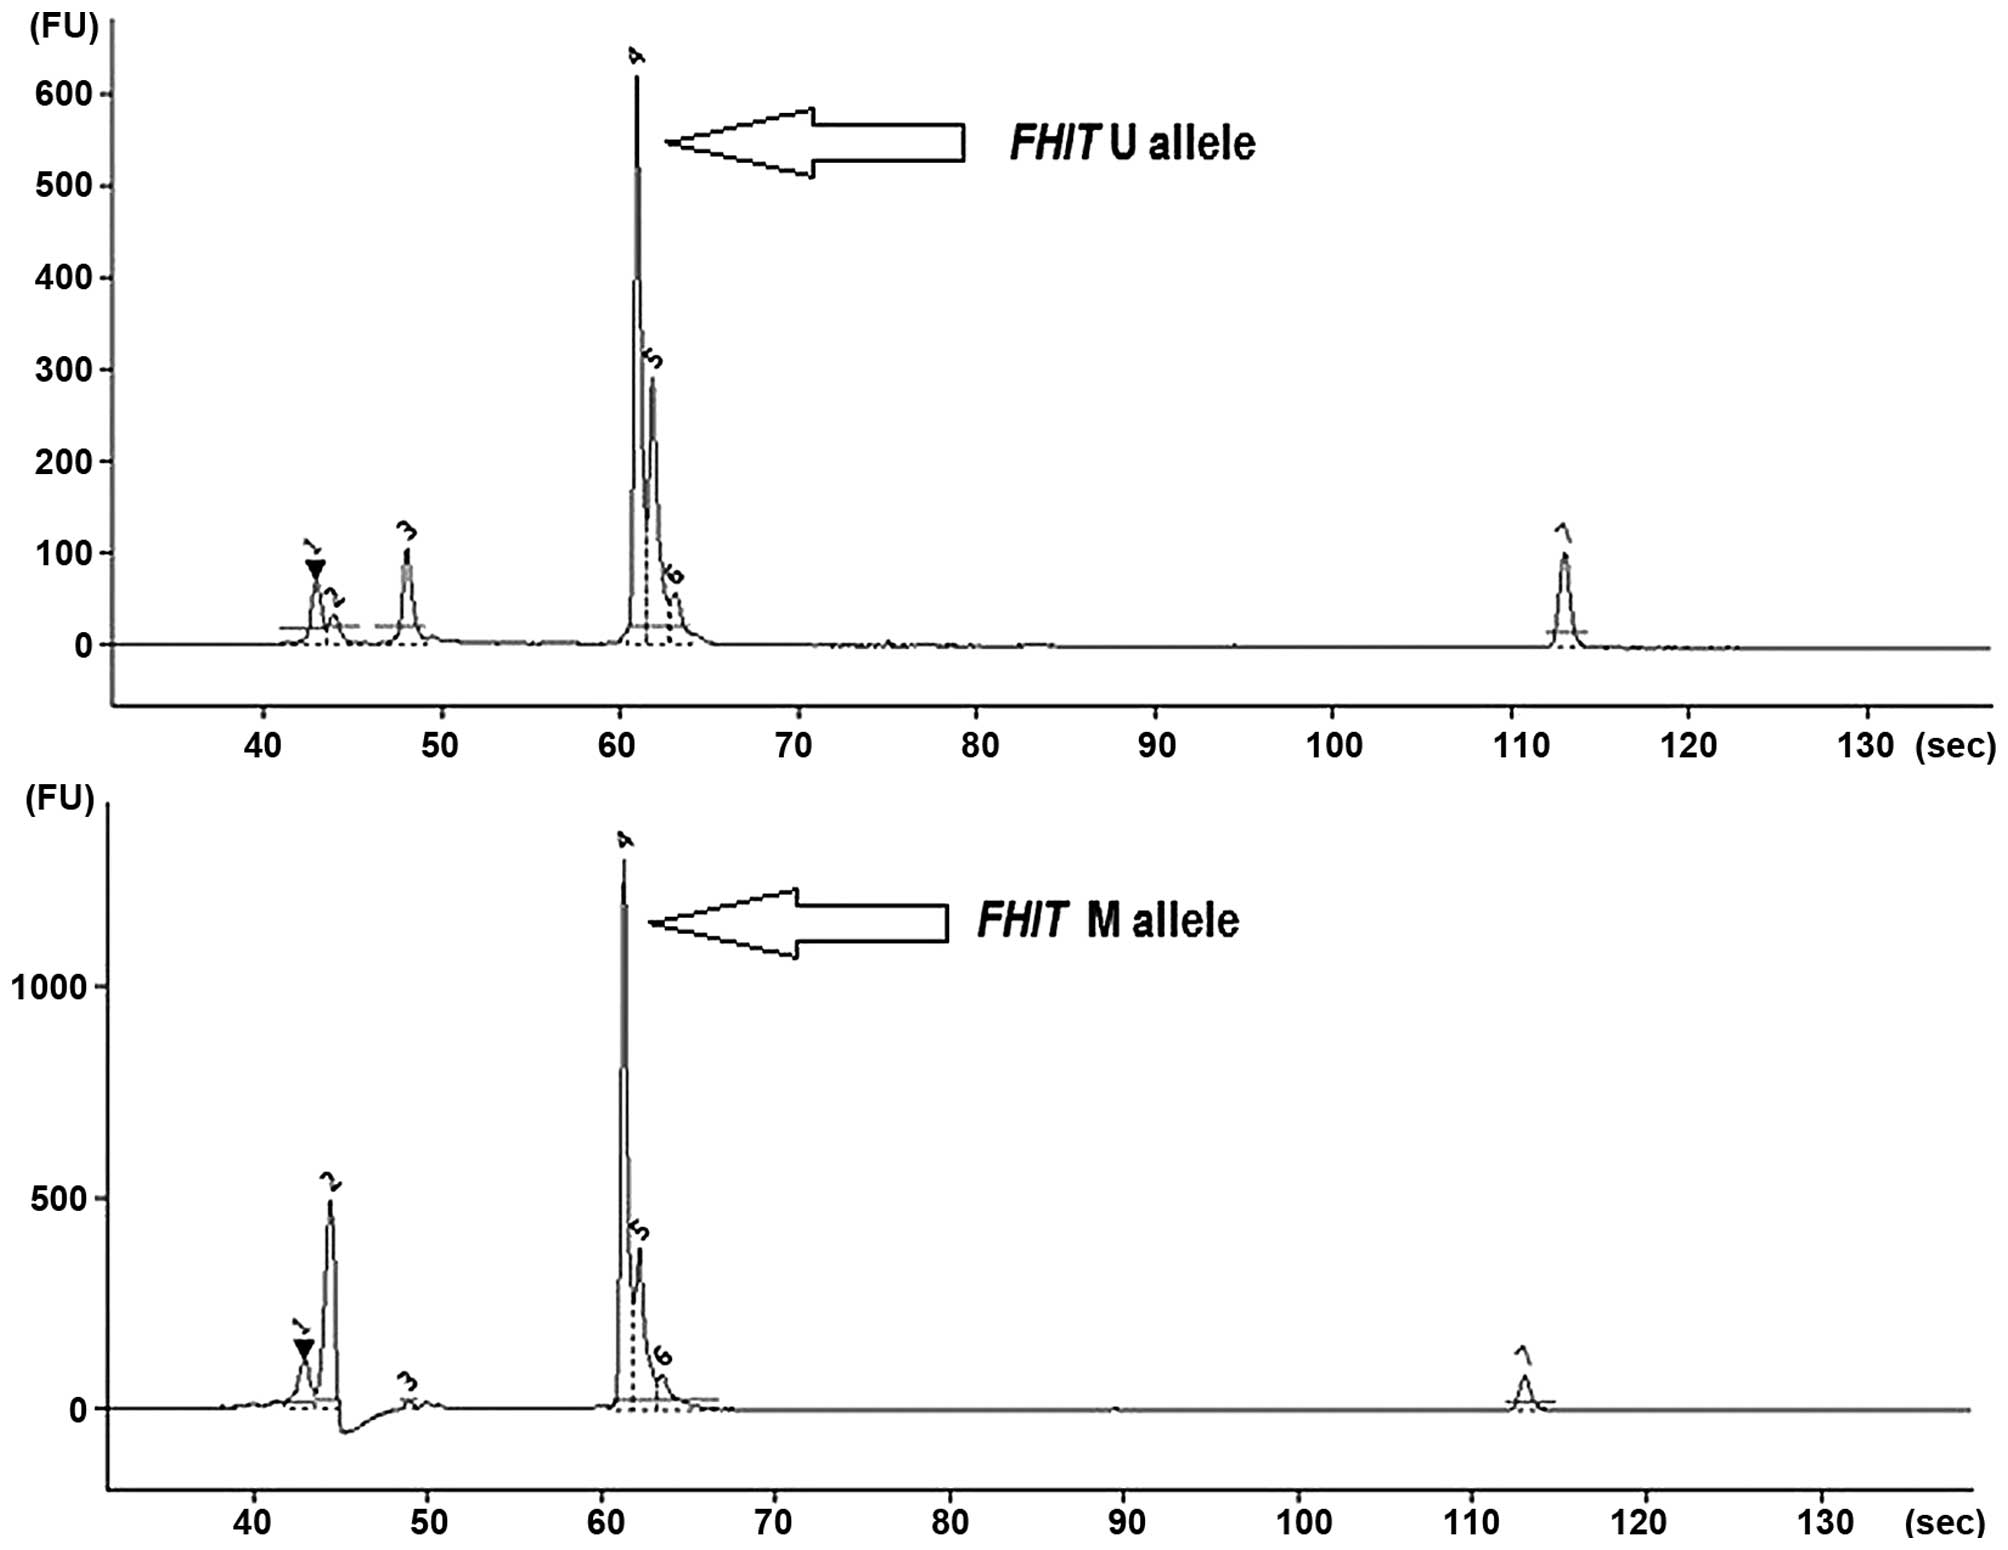
The MS-PCR analysis (gel electrophoresis) revealed
the presence of methylated (M) and unmethylated (U) FHIT
alleles both in NSCLC and control specimens (Fig. 1).
Due to degradations of several DNA samples after
bisulfite conversion, methylation levels of 52 NSCLC samples and 31
control specimens (macroscopically unchanged tissues) were assessed
in automated capillary electrophoresis (Agilent 2100 Bioanalyzer).
The co-presence of U and M alleles was the most common, and this
was observed for 43 cancer tissue samples (83%) and for 21 control
specimens (67.5%). The presence of only M alleles was detected in 6
cancer tissue samples (11.5%) and 6 controls (19.5%). No
methylation (only U alleles) was observed in 4 cancers (5.5%) and 3
controls (11%). Regarding SCC and LCC subtypes, methylated
FHIT alleles were present more often in macroscopically
unchanged tissue when compared to cancer. Only in AC subtype
FHIT methylation was more frequent in cancer tissue, and the
difference was statistically significant (p=0.024, Spearman’s rank
correlation coefficient). The MI value reflects the observation on
the M and U allele frequency ratio in cancer and control groups.
Methylation level of FHIT (mean MI value) was higher in
control tissue (0.472) than in cancer (0.382), but without
statistical significance (p>0.05, Spearman’s rank correlation
coefficient). Data on the presence of M and U alleles in NSCLC
subtypes are shown in Table
III.
| Table IIIThe presence of methylated (M) and
unmethylated (U) alleles in histopathological subtypes (SCC, AC,
LCC) and paired macroscopically unchanged tissues. |
Table III
The presence of methylated (M) and
unmethylated (U) alleles in histopathological subtypes (SCC, AC,
LCC) and paired macroscopically unchanged tissues.
| NSCLC subtype | Control | SCC | Control | AC | Control | LCC |
|---|
| n | 18 | 29 | 9 | 18 | 5 | 5 |
| MI=1 (only M
alleles) | 5 (28%) | 2 (7%) | 0 | 4 (22%) | 1 (20%) | - |
| 0<MI<1 (U and
M alleles) | 11 (61%) | 25 (86%) | 7 (78%) | 13 (72.5%) | 4 (80%) | 5 (100%) |
| MI=0 (only U
alleles) | 2 (11%) | 2 (7%) | 2 (22%) | 1 (5.5%) | - | - |
| MI value | 0.506 | 0.370 | 0.315 | 0.433 | 0.638 | 0.314 |
| p-valuea | p>0.05 | 0.024 | p>0.05 |
The analysis of MI level between control and cancer
tissues in gender groups revealed that higher levels of MI were
observed in men vs. women in both tissues: cancer and control (N:
0.416 vs. 0.343; C: 0.555 vs. 0.347, respectively), however the
differences did not reach statistical significance (p>0.05,
Mann-Whitney U test). No statistically significant difference was
observed between gender groups, In NSCLC subtypes (SCC, AC, LCC)
the differences in MI values according to the gender groups were
also evaluated. Mean MI values in men vs. women were higher in SCC
(0.382 vs. 0.302) and AC (0.593 vs. 0.256), and lower in LCC (0.201
vs. 0.389) (p>0.05, Mann-Whitney U test). MI values in cancer
tissues were increasing with the patient age (in years), however
without statistical significance (p>0.05, Spearman’s rank
correlation coefficient).
Analysis of MI values in groups according to the
AJCC classifications demonstrated higher MI in AJCC I (0.481) than
in AJCC II (0.326) or AJCC IIIA/B (0.366), (p>0.05,
Kruskal-Wallis test). Mean MI values in groups according to TNM
staging were similar in pT1 and pT3/4 (0.446 and 0.442,
respectively), and lower in pT2 (0.338) (p>0.05, Kruskal-Wallis
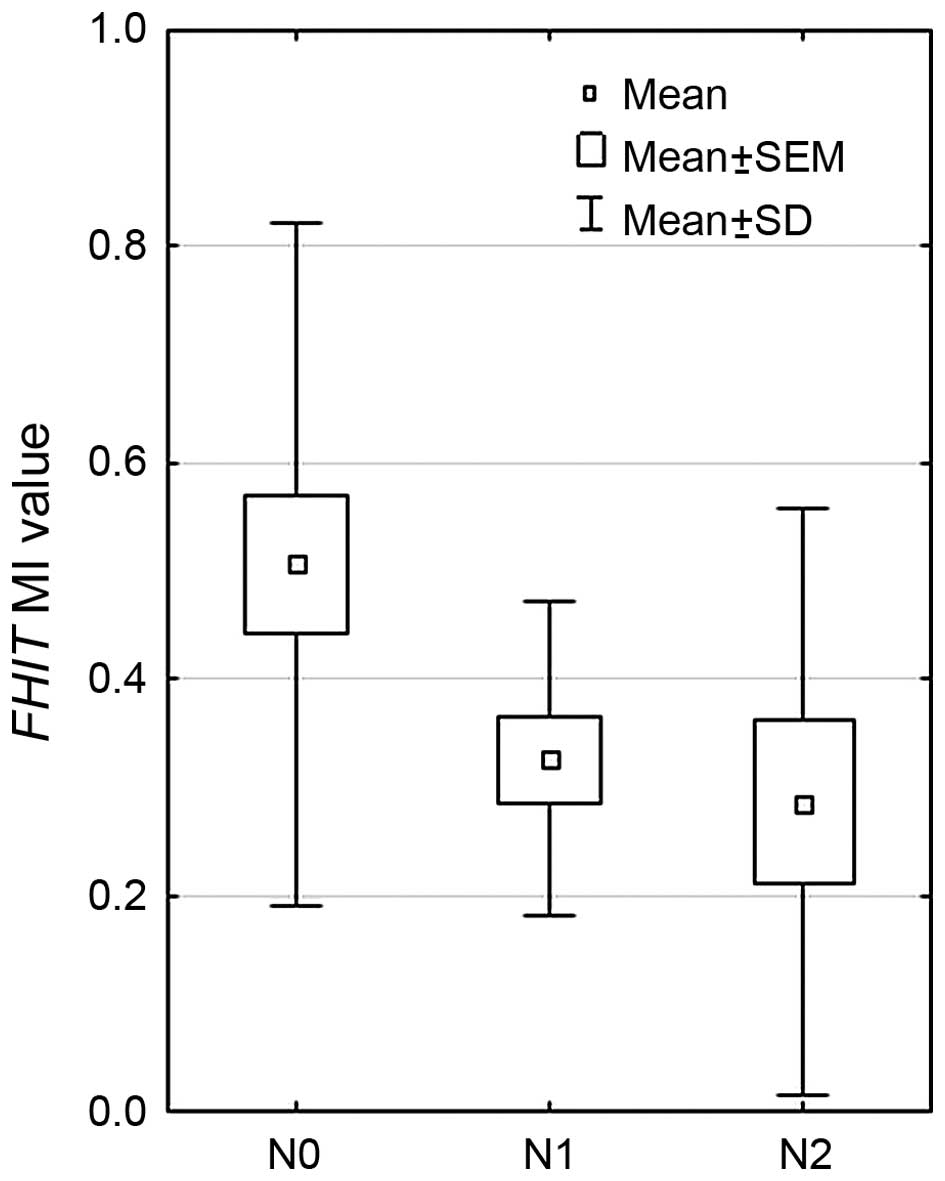
test). According to the presence of metastasis, it was observed
that mean MI value was decreasing with lymph node involvement (pTNM
staging, according to the ‘N’ value): the highest MI was observed
in patient with N0 (0.526), lower in N1 (0.271) and the lowest in
N2 (0.222) (p=0.0073, Kruskal-Wallis test), the results are
presented in Fig. 2. Significant
differences were observed between N0 vs. N1, and N0 vs. N2 groups
(p=0.0113 and p=0.008, respectively, Mann-Whitney U test).
No significant relationships were found between
FHIT MI values (total NSCLC group, NSCLC subtypes, cancer
and control tissues) and smoking history (the length of addiction
in years, or tobacco intake in PYs) (p>0.05, Kruskal-Wallis
test, Mann-Whitney U test, followed by Spearman’s rank correlation
coefficient). Mean MI value was lower in current smokers (0.345)
than in former (0.431) or never-smokers (0.435), but in all control
tissue groups the MI values were higher than in cancer (0.381,
0.552, 0.704, respectively) (p>0.05, Kruskal-Wallis test).
FHIT gene expression analysis
The expression of FHIT gene, in relation to
calibrator sample (RNA from the normal lung tissue), was elevated
in all analyzed NSCLC subtypes, and also in macroscopically
unchanged tissue. Higher FHIT expression level was detected
in the tumor (1.83) than the control (1.57) (p>0.05, U-Mann
Whitney test). Statistically significant higher RQ levels in cancer
when compared to control tissue were observed in AC and NSCC
subtypes (p=0.000153 and p=0.001073, respectively, U-Mann Whitney
test). The obtained results are presented in Table IV.
| Table IVFHIT expression levels (mean
RQ values) in NSCLC subtypes (SCC, AC, LCC) and paired
macroscopically unchanged tissues. |
Table IV
FHIT expression levels (mean
RQ values) in NSCLC subtypes (SCC, AC, LCC) and paired
macroscopically unchanged tissues.
| Tissue | n | Mean RQ | p-value |
|---|
| NSCLC group | Cancer | 59 | 1.83 | >0.05a |
| Control tissue | 58 | 1.57 | |
| SCC subtype | Cancer | 34 | 1.40 | >0.05a |
| Control tissue | 34 | 1.59 | |
| NSCC subtype (AC +
LCC) | Cancer | 25 | 2.41 |
0.001073a |
| Control tissue | 24 | 1.55 | |
| AC subtype | Cancer | 20 | 2.27 |
0.000153a |
| Control tissue | 19 | 1.61 | |
| LCC subtype | Cancer | 5 | 1.81 | >0.05a |
| Control tissue | 5 | 1.30 | |
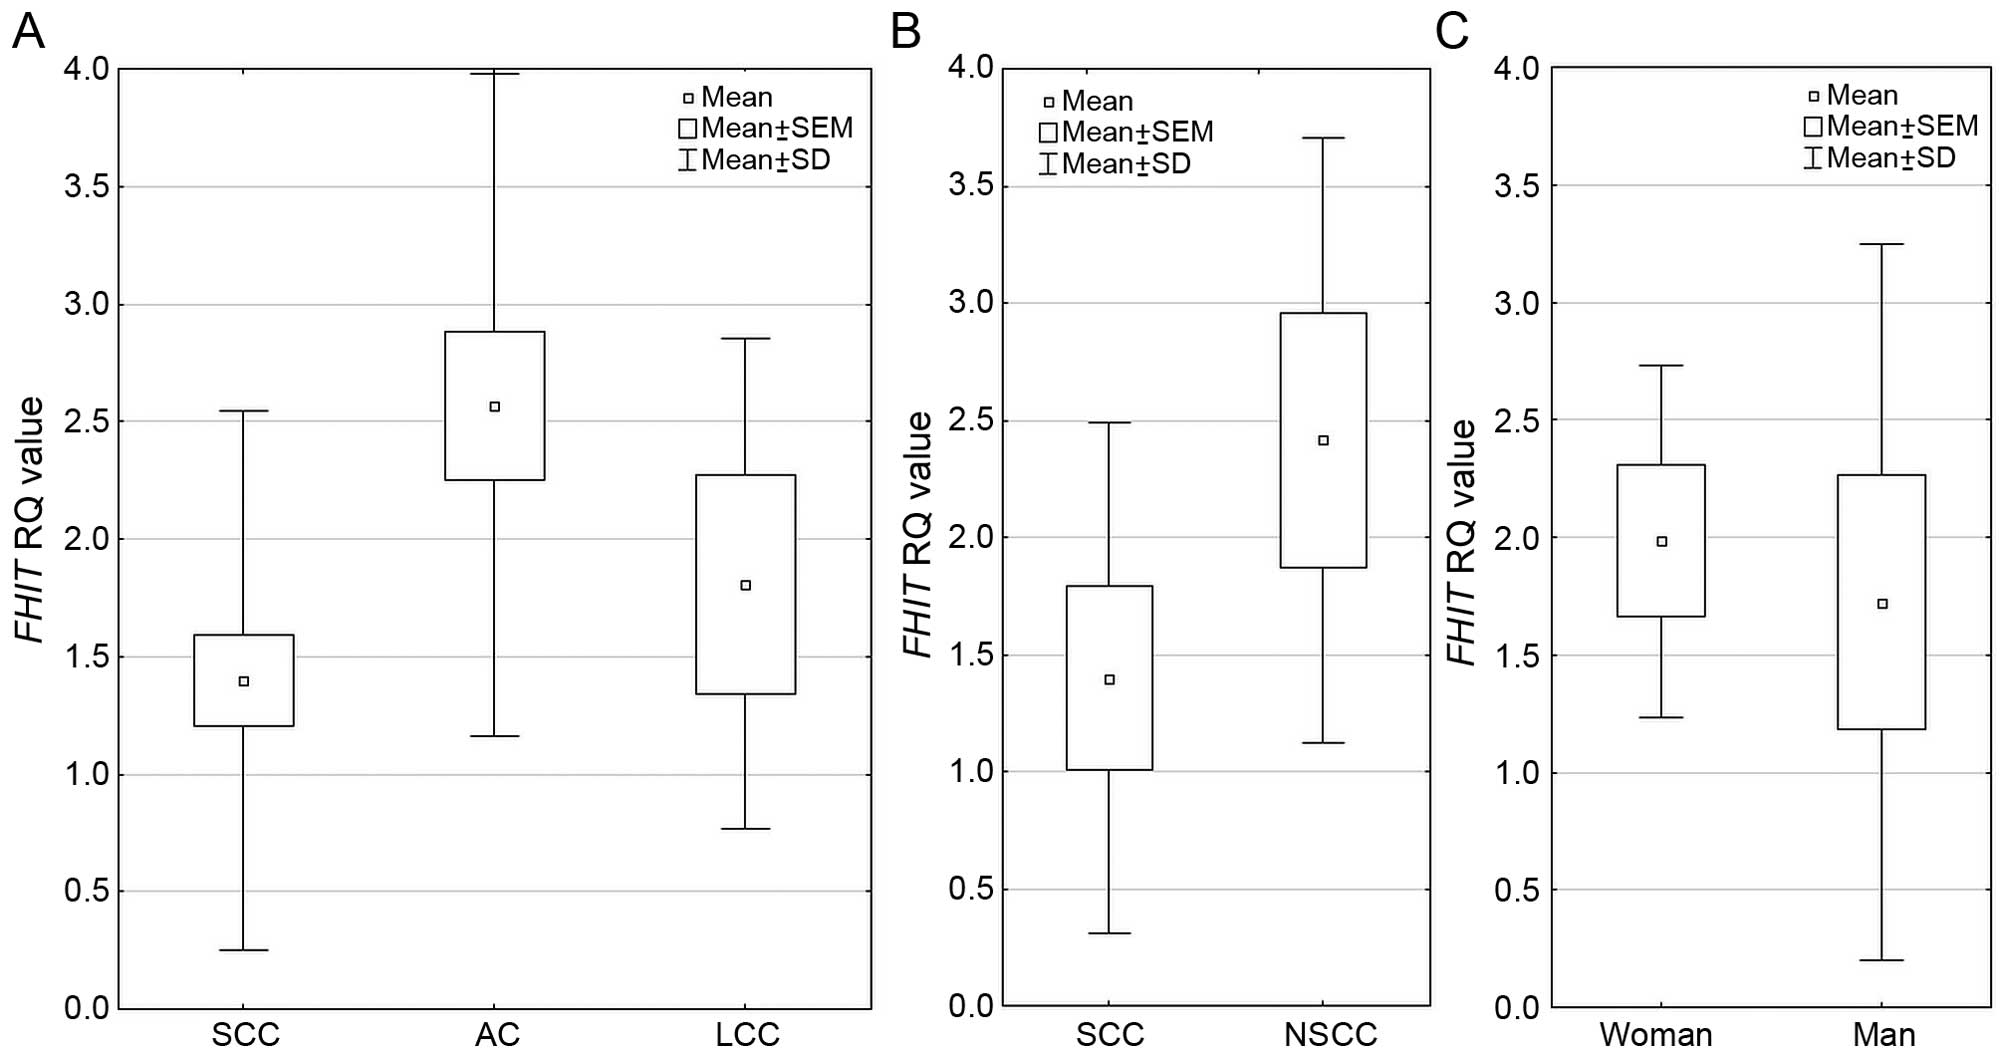
Regarding FHIT expression among the three
NSCLC histopathological subtypes, the difference was statistically
significant p=0.000009 (Kruskal-Wallis test) and mean RQ value was
the highest in AC group. Analysis performed between 2 histological
subtypes SCC vs. NSCC (non-squamous cell carcinoma, comprising of
AC and LCC) revealed statistically significant increase in
FHIT expression in NSCC group (p=0.00001, U-Mann Whitney
test). In gender groups, FHIT expression was significantly
higher in women than in men (1.984 vs. 1.723, respectively;
p=0.0351 U-Mann Whitney test). These results are presented in
Fig. 3. With increasing age of
patients, the relative expression level of FHIT was
decreasing in cancer tissues (p>0.05, Spearman’s rank
correlation coefficient).
According to TNM classification, in total NSCLC
group, the RQ value increased with tumor size: pT1 (1.457), pT2
(1.789), pT3/4 (2.25), and similar observation was made in NSCLC
subtypes - in SCC and NSCC groups, however the differences were not
significant (p>0.05, Kruskal-Wallis test). In AJCC groups, the
mean RQ value was the lowest in AJCC III, and the highest in AJCC
II (p>0.05, Kruskal-Wallis test). In relation to smoking history
of patients, FHIT expression was higher in current smokers
(1.96), than in former smokers (1.68) and non-smokers (1.70)
(p>0.05, Kruskal-Wallis test). No statistically significant
relationships were found between FHIT expression (total
NSCLC group, NSCLC subtypes) and smoking history (the length of
addiction in years, or tobacco intake in PYs) (p>0.05,
Kruskal-Wallis test, Mann-Whitney U test). Of note, in the group of
active smokers with the highest intake in PYs (>45 PYs) the RQ
level was the lowest.
FHIT protein expression analysis
The immunoexpression level of FHIT <350 ng/ml (in
tissue homogenates) was considered as decreased. The decreased
immunoexpression was observed in 71% of all NSCLC samples, and was
in the range of 60–88%, depending on the histotype. The results are
presented in Table V.
| Table VFHIT immunoexpression levels assessed
by ELISA method and percentage of samples with decreased and
without decreased expression level in all studied histopathological
NSCLC subtypes. |
Table V
FHIT immunoexpression levels assessed
by ELISA method and percentage of samples with decreased and
without decreased expression level in all studied histopathological
NSCLC subtypes.
| Histopathological
NSCLC subtype | Median IE value
(ng/ml) | Decreased IE value
(range) (ng/ml) | Samples with: |
|---|
|
|---|
| Decreased IE value
(%) | Non-decreased IE
(%) |
|---|
| SCC (n=30) | 326 | 307 (118–493) | 18 (60) | 12 (40) |
| AC (n=16) | 246 | 262 (126–409) | 14 (88) | 2 (12) |
| LCC (n=5) | 235 | 275 (128–469) | 4 (80) | 1 (20) |
| Total (n=51) | 246 | 290 (118–493) | 36 (71) | 15 (29) |
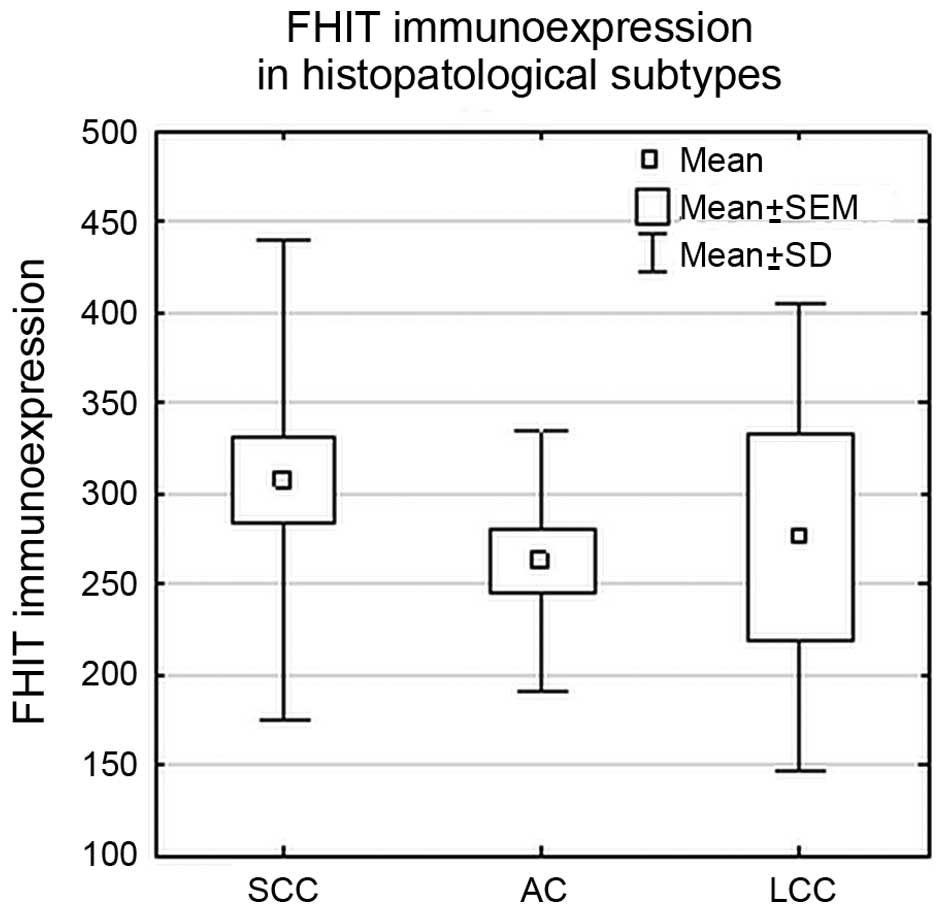
Statistical analysis did not reveal significant
differences in FHIT protein expression levels between studied
histopathological subtypes (SCC, AC and LCC) (p>0.05; ANOVA
Kruskal-Wallis test) or between SCC and NSCC group (p>0.05; U
Mann-Whitney’s test), as shown in Fig.
4.
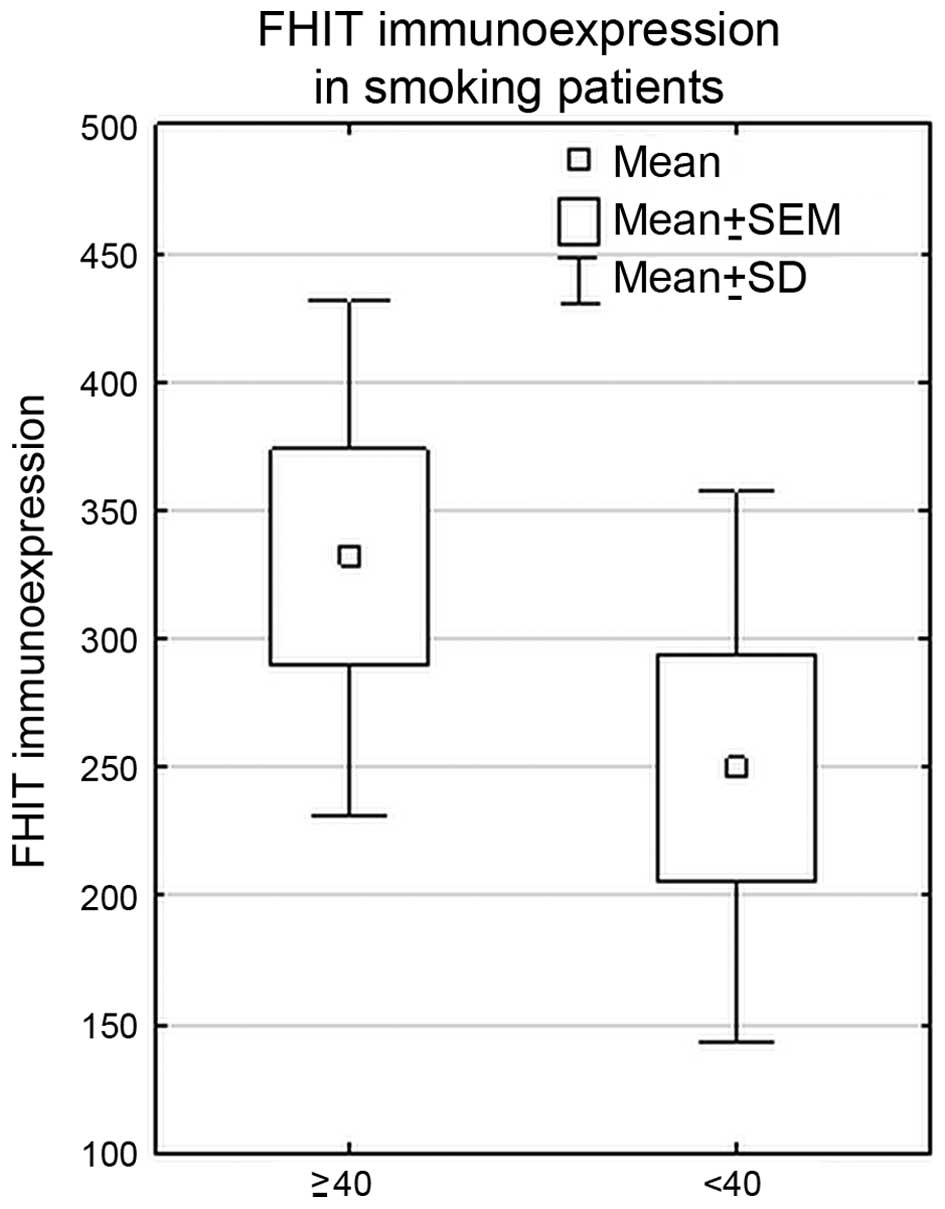
In the whole cohort of NSCLC patients, statistically
significant higher FHIT immunoexpression was revealed in the group
of heavy smokers (PYs ≥40) (PY <40 vs. PY ≥40, p=0.01,
Mann-Whitney U test). Such correlation was also found in SCC
subtype (p=0.01, Mann-Whitney U test). The results are shown in
Fig. 5.
Multivariate stepwise logistic regression analysis
with backward selection revealed that higher protein
immunoexpression level was correlated with lower value of PYs
smoked in a lifetime. This significant correlation was confirmed in
multivariate logistic regression model shown in Table VI. The PYs variable explains only
9% of total immunoexpression variance (R2=0.09).
| Table VIMultivariate logistic regression
model for FHIT immunoexpression coefficients and
summary. |
Table VI
Multivariate logistic regression
model for FHIT immunoexpression coefficients and
summary.
| Factor | B | Std. Error | Beta | t | p-value | R | R2 | Adjusted R
square | Std. Error of the
estimate |
|---|
| PY | −0.34 | 0.15 | −80.637 | −2.28 | 0.02 | 0.34 | 0.12 | 0.09 | 111.69 |
There were no statistically significant correlations
between FHIT protein levels and the clinical features of the
studied NSCLC patients, i.e., patient age, gender, and status of
smoking (p>0.05; Mann-Whitney U test, ANOVA Kruskal-Wallis test,
followed by Spearman’s rank correlation coefficient). Statistical
analysis did not reveal any associations between FHIT
immunoexpression level and pTNM or AJCC classifications (p>0.05;
ANOVA Kruskal-Wallis test).
Correlations between gene expression and
methylation or protein expression values
It was observed that in all analyzed groups the mean
RQ values were elevated in cancer when compared to control tissue,
and MI was lower in cancer, however we did not find any significant
correlations (p>0.05, Spearman’s rank correlation coefficient).
No significant association between MI and RQ values was found among
NSCLC subtypes (SCC, AC, LCC), gender and age groups, tobacco
addiction or cancer staging (p>0.05, Spearman’s rank correlation
coefficient). Similarly, there were no statistically significant
correlations between FHIT expression and protein
immunoexpression among NSCLC subtypes (SCC, AC, LCC), gender and
age groups, tobacco addiction or cancer staging (p>0.05,
Spearman’s rank correlation coefficient). In addition, there were
no statistically significant correlations between FHIT protein
immunoexpression and MI levels (p>0.05, Spearman’s rank
correlation coefficient).
Discussion
FHIT, the tumor suppressor gene localized on
3p fragile site (3p14.2), is frequently altered in many human
cancers (renal, lung, gastric, lymphomas) (7,12).
FHIT expression loss was detected frequently during the
early onset of disease progression in cancer (14,23).
Loss of function of the FHIT gene can lead to constitutive
accumulation of high levels of intracellular diadenosine
tetraphosphate and the stimulation of DNA synthesis and
proliferation (25,26). Reduction of FHIT expression
is consider as poor diagnostic factor correlated with tumor
aggressiveness due to the epithelial-mesenchymal transition (EMT)
(16,26–28).
The EMT is considered as crucial step in the early stage of cancer
metastasis. Activation of FHIT gene can enhance the cell
ability to enter apoptosis and to inhibit cell growth (29). Several studies have underlined the
putative function of FHIT gene as lung cancer biomarker
(12,18). In mouse lung cancer model
FHIT function was linked with protecting against
chemically-induced cancerogenesis (30). In lung cancer cell lines
restoration of FHIT expression resulted in induction of
apoptosis and tumorigenicity suppression, therefore the gene was
proposed as potential agent in targeted gene therapy (11).
In the present study, we assessed FHIT
expression on mRNA and protein level, as well as gene promoter
methylation. Analysis was performed in primary lung lesions and in
macroscopically unchanged lung tissues to deepen the knowledge of
potential significance of FHIT as an early diagnostic
biomarker. Searching for such biomarkers is very important,
especially when lack of effective diagnostic tools at the early
stage of the disease can cause up to 85% mortality rate (in 5
years) (2).
In the previously conducted studies, the presence of
FHIT alteration (LOH, expression alteration) was detected in
preneoplastic bronchial lesions (12). Our study is the first one where
both mRNA expression level and gene methylation status were
analyzed in cancer and macroscopically unchanged lung tissue. We
demonstrated that altered gene expression was not only
characteristic for cancer, we also observed increased gene
expression both in NSCLC tissue and macroscopically unchanged lung
tissue from the same patients.
In our study we found elevated FHIT
expression in all NSCLC subtypes which is contrary to the results
of other groups (14,23,26,31).
Also, in our study, FHIT expression level in macroscopically
unchanged tissue, regarded as ‘normal’, although surrounding the
primary lesion, was elevated, when compared to calibrator RNA. This
can stand for the hypothesis that FHIT activation in lung
carcinogenesis process is a response to accumulation of genetic
changes in the cells (12,32). The differences in FHIT
expression between samples from the same patient could suggest the
important role of FHIT gene in a very early stage of lung
carcinogenesis.
Also in methylation analysis we demonstrated
promoter region hypermethylation in both tissues. This finding is
inconsistent with the results of Feng et al, who found no
methylation in cancerous or non-cancerous tissues (33). In our study, in case of AC subtype,
FHIT promoter methylation status was significantly higher
than in normal tissue.
Statistically significant differences in the
FHIT expression between histopathological subtypes AC, LCC
and SCC could suggest the possibility to deepen the study on the
gene as a differentiating marker for NSCLC subtypes. Additionally,
it might help in the selection of therapy. Differences between
expression in subtypes (the lowest in SCC, the highest in AC) may
be under consideration as NSCLC prognostic marker. Unfortunately,
these differences between subtypes were not observed in the
methylation analysis.
Increased expression of FHIT gene, identified
in the current work, would suggest the resulting elevation of its
product the FHIT protein. However such result was not confirmed.
The analysis of immunoexpression revealed the reduction of FHIT
protein level in NSCLCs tissue samples, which was generally
consistent with earlier results (23,25,31,32,34,35).
We observed FHIT protein reduction in 71% of NSCLCs, and there was
no difference between the histopathological subtypes (88% AC, 60%
SCC). It is contrary to the findings of other authors, who reported
significant loss of protein expression mainly in SCC (25,34).
Tomizawa et al (34)
described the decreased level of FHIT expression in only 10% of AC
samples in comparison to 86% of SCCs. The possible reason of the
inconsistency between our results and the compared reports could be
different material and molecular techniques used to evaluate FHIT
immunoexpression. We assessed it in tumor tissue homogenates, while
others used paraffin-embedded tissue blocks (17), thus the data cannot be compared
reliably. On the other hand, such divergent results suggest poor
usage of FHIT immunoexpression as a differentiating marker, that
has been recently confirmed in the review article by Lindskog et
al (36).
Many studies revealed that loss of FHIT
expression or immunoexpression was significantly associated with
tumors occurring in heavy smokers (24,25,32,35,37).
We have not confirmed this on mRNA level - neither in relation to
the length of smoking or to the amount of cigarettes smoked.
Interestingly, we found significant differences on protein level:
in heavy smokers group FHIT protein level was significantly higher
(in total NSCLC group and in SCC group). Sozzi et al
(25) obtained the opposite
results, the protein expression decreased with heavy smoking.
This discrepancy can be explained by the results of
multivariate regression model showing that only 9% of FHIT
immunoexpression variance can be explained by the number of PYs.
Such low contribution of smoking history to the FHIT protein level
in our study suggest the impact of other, probably more important
factors on FHIT protein reduction. Several other possible
explanations could be considered, including the method used. In our
study we analyzed FHIT immunoexpression with ELISA method in cancer
tissue homogenates, not immunohistochemically stained
paraffin-embedded tissues. The methodological difference might be
also due to the contamination of tumor specimens with non-cancerous
cells, because the tumors analyzed in this study were
macrodissected and not microdissected.
In many studies it was confirmed that FHIT
activation or enforced expression significantly suppressed
metastasis, accompanied by inhibition of EMT (26,27,28).
We demonstrated statistically significant differences in gene
methylation status according to the node infiltration status (TNM
staging) in the group N0 vs. N1 and N2. Lower gene methylation in
groups of patients with nodes infiltration could be due to the
actions taken by the cell leading to growth inhibition, as FHIT
plays role in EMT inhibition. However, these lower methylation
levels did not correlate with expression enhancement. In Suh et
al study (28), the elevated
expressions of FHIT gene and FHIT-dependent miR-30c
were proposed as metastasis predictor, as patients with elevated
expression had improved metastasis free-survival. In our study the
observed difference in FHIT methylation level between
patients with and without nodes infiltration could be considered as
prognostic marker.
In conclusion, we demonstrated the presence of
FHIT promoter methylation both in cancer and control tissue
and altered gene expression in both tissue types. It is worth
mentioning, that our results give information on methylation level
of gene promoter, not only the presence of methylated gene. This
can give deeper insight into epigenetic landscape of the lung
cancer tissue. The presence of gene promoter hypermethylation both
in cancer and control tissue and in different TNM groups suggests
early involvement of epigenetic alterations in the development of
NSCLC. Differences in FHIT methylation status between NSCLC
patients with and without nodes infiltration seems to be considered
as prognostic marker. However, these findings do not confirm the
observations of other scientist, especially we did not prove the
negative correlation between FHIT expression and
methylation. Reassuming, the results of our study indicate the
value of FHIT gene expression as a differentiating marker of
histopathological subtypes of NSCLC. Ambiguous results concerning
relationship between FHIT protein level and the amount of
cigarettes smoked in a lifetime, suggest unclear impact of smoking
on this particular gene. Results of our study indicate that the
observed level of FHIT promoter methylation was not enough
to suppress gene expression. Lack of negative correlation between
FHIT expression and methylation, or positive correlation
between gene expression and immunoexpression suggest the role of
another molecular mechanisms regulating FHIT expression on mRNA and
protein levels in NSCLC patients.
Acknowledgements
The study was funded by the scientific grant of the
Polish National Science Centre, no. UMO-2011/01/B/NZ4/04966.
References
|
1
|
Wojciechowska U, Didkowska J and Zatoński
W: Malignant neoplasms. Cancer in Poland in 2012. Oncology Centre -
Marie Curie Institute, . Warszawa: pp. 11–25. 2012
|
|
2
|
Ferlay J, Shin HR, Bray F, Forman D,
Mathers C and Parkin DM: Estimates of worldwide burden of cancer in
2008: GLOBOCAN 2008. Int J Cancer. 127:2893–2917. 2010. View Article : Google Scholar
|
|
3
|
Travis WD, Travis LB and Devesa SS: Lung
cancer. Cancer. 75(Suppl): 191–202. 1995. View Article : Google Scholar : PubMed/NCBI
|
|
4
|
Travis WD, Brambilla E, Müller-Hermelink
HK and Harris CC: Tumours of the lung. WHO Classification Pathology
and Genetics of Tumours of the Lung, Pleura, Thymus and Heart. IARC
Press; pp. 9–122. 2004
|
|
5
|
Kathuria H, Gesthalter Y, Spira A, Brody
JS and Steiling K: Updates and controversies in the rapidly
evolving field of lung cancer screening, early detection, and
chemoprevention. Cancers (Basel). 6:1157–1179. 2014. View Article : Google Scholar
|
|
6
|
Zabarovsky ER, Lerman MI and Minna JD:
Tumor suppressor genes on chromosome 3p involved in the
pathogenesis of lung and other cancers. Oncogene. 21:6915–6935.
2002. View Article : Google Scholar : PubMed/NCBI
|
|
7
|
Ohta M, Inoue H, Cotticelli MG, Kastury K,
Baffa R, Palazzo J, Siprashvili Z, Mori M, McCue P, Druck T, et al:
The FHIT gene, spanning the chromosome 3p14.2 fragile site and
renal carcinoma-associated t(3;8) breakpoint, is abnormal in
digestive tract cancers. Cell. 84:587–597. 1996. View Article : Google Scholar : PubMed/NCBI
|
|
8
|
Semba S, Trapasso F, Fabbri M, McCorkell
KA, Volinia S, Druck T, Iliopoulos D, Pekarsky Y, Ishii H, Garrison
PN, et al: Fhit modulation of the Akt-survivin pathway in lung
cancer cells: Fhit-tyrosine 114 (Y114) is essential. Oncogene.
25:2860–2872. 2006. View Article : Google Scholar : PubMed/NCBI
|
|
9
|
Weiske J, Albring KF and Huber O: The
tumor suppressor Fhit acts as a repressor of beta-catenin
transcriptional activity. Proc Natl Acad Sci USA. 104:20344–20349.
2007. View Article : Google Scholar : PubMed/NCBI
|
|
10
|
Siprashvili Z, Sozzi G, Barnes LD, McCue
P, Robinson AK, Eryomin V, Sard L, Tagliabue E, Greco A, Fusetti L,
et al: Replacement of Fhit in cancer cells suppresses
tumorigenicity. Proc Natl Acad Sci USA. 94:13771–13776. 1997.
View Article : Google Scholar
|
|
11
|
Roz L, Gramegna M, Ishii H, Croce CM and
Sozzi G: Restoration of fragile histidine triad (FHIT) expression
induces apoptosis and suppresses tumorigenicity in lung and
cervical cancer cell lines. Proc Natl Acad Sci USA. 99:3615–3620.
2002. View Article : Google Scholar : PubMed/NCBI
|
|
12
|
Fong KM, Biesterveld EJ, Virmani A,
Wistuba I, Sekido Y, Bader SA, Ahmadian M, Ong ST, Rassool FV,
Zimmerman PV, et al: FHIT and FRA3B 3p14.2 allele loss are common
in lung cancer and preneoplastic bronchial lesions and are
associated with cancer-related FHIT cDNA splicing aberrations.
Cancer Res. 57:2256–2267. 1997.PubMed/NCBI
|
|
13
|
Pichiorri F, Okumura H, Nakamura T,
Garrison PN, Gasparini P, Suh SS, Druck T, McCorkell KA, Barnes LD,
Croce CM, et al: Correlation of fragile histidine triad (Fhit)
protein structural features with effector interactions and
biological functions. J Biol Chem. 284:1040–1049. 2009. View Article : Google Scholar :
|
|
14
|
Saldivar JC, Bene J, Hosseini SA, Miuma S,
Horton S, Heerem NA and Huebner K: Characterization of the role of
Fhit in suppression of DNA damage. Adv Biol Regul. 53:77–85. 2013.
View Article : Google Scholar :
|
|
15
|
Wang HL, Zhou PY, Liu P and Zhang Y:
Abnormal FHIT protein expression may be correlated with poor
prognosis in gastric cancer: A meta-analysis. Tumour Biol.
35:6815–6821. 2014. View Article : Google Scholar : PubMed/NCBI
|
|
16
|
Joannes A, Bonnomet A, Bindels S, Polette
M, Gilles C, Burlet H, Cutrona J, Zahm JM, Birembaut P and
Nawrocki-Raby B: Fhit regulates invasion of lung tumor cells.
Oncogene. 29:1203–1213. 2010. View Article : Google Scholar
|
|
17
|
Toledo G, Sola JJ, Lozano MD, Soria E and
Pardo J: Loss of FHIT protein expression is related to high
proliferation, low apoptosis and worse prognosis in non-small-cell
lung cancer. Mod Pathol. 17:440–448. 2004. View Article : Google Scholar : PubMed/NCBI
|
|
18
|
Kim JS, Kim JW, Han J, Shim YM, Park J and
Kim DH: Cohypermethylation of p16 and FHIT promoters as a
prognostic factor of recurrence in surgically resected stage I
non-small cell lung cancer. Cancer Res. 66:4049–4054. 2006.
View Article : Google Scholar : PubMed/NCBI
|
|
19
|
American Joint Committee on Cancer Staging
according to the IASLC Staging Project. 7th edition. Cancer. 2010,
http://cancerstaging.org/references-tools/quickreferences/documents/lungmedium.pdf.
|
|
20
|
Herman JG, Graff JR, Myöhänen S, Nelkin BD
and Baylin SB: Methylation-specific PCR: A novel PCR assay for
methylation status of CpG islands. Proc Natl Acad Sci USA.
93:9821–9826. 1996. View Article : Google Scholar : PubMed/NCBI
|
|
21
|
Feltus FA, Lee EK, Costello JF, Plass C
and Vertino PM: Predicting aberrant CpG island methylation. Proc
Natl Acad Sci USA. 100:12253–12258. 2003. View Article : Google Scholar : PubMed/NCBI
|
|
22
|
Li LC and Dahiya R: MethPrimer: Designing
primers for methylation PCRs. Bioinformatics. 18:1427–1431. 2002.
View Article : Google Scholar : PubMed/NCBI
|
|
23
|
Sozzi G, Tornielli S, Tagliabue E, Sard L,
Pezzella F, Pastorino U, Minoletti F, Pilotti S, Ratcliffe C,
Veronese ML, et al: Absence of Fhit protein in primary lung tumors
and cell lines with FHIT gene abnormalities. Cancer Res.
57:5207–5212. 1997.PubMed/NCBI
|
|
24
|
Sozzi G, Sard L, De Gregorio L, Marchetti
A, Musso K, Buttitta F, Tornielli S, Pellegrini S, Veronese ML,
Manenti G, et al: Association between cigarette smoking and FHIT
gene alterations in lung cancer. Cancer Res. 57:2121–2123.
1997.PubMed/NCBI
|
|
25
|
Sozzi G, Pastorino U, Moiraghi L,
Tagliabue E, Pezzella F, Ghirelli C, Tornielli S, Sard L, Huebner
K, Pierotti MA, et al: Loss of FHIT function in lung cancer and
preinvasive bronchial lesions. Cancer Res. 58:5032–5037.
1998.PubMed/NCBI
|
|
26
|
Zhao P, Li XY and Chen LZ: Loss of fragile
histidine triad expression and metastasis in breast cancer. Ai
Zheng. 21:668–670. 2002.(In Chinese). PubMed/NCBI
|
|
27
|
Bekar A, Ceçener G, Tunca B, Guler G,
Egeli U and Tolunay S: Investigation of mutations and expression of
the FHIT gene in Turkish patients with brain metastases derived
from non-small cell lung cancer. Tumori. 93:604–607. 2007.
|
|
28
|
Suh SS, Yoo JY, Cui R, Kaur B, Huebner K,
Lee TK, Aqeilan RI and Croce CM: FHIT suppresses
epithelial-mesenchymal transition (EMT) and metastasis in lung
cancer through modulation of microRNAs. PLoS Genet.
10:e10046522014. View Article : Google Scholar : PubMed/NCBI
|
|
29
|
Song X, Tian Z, Wang S, Peng Z and Feng J:
Restoration of fragile histidine triad (FHIT) expression inhibits
cell growth and induces apoptosis in cutaneous T-cell lymphoma cell
line. Cancer Invest. 28:1019–1023. 2010. View Article : Google Scholar : PubMed/NCBI
|
|
30
|
Zanesi N, Fidanza V, Fong LY, Mancini R,
Druck T, Valtieri M, Rüdiger T, McCue PA, Croce CM and Huebner K:
The tumor spectrum in FHIT-deficient mice. Proc Natl Acad Sci USA.
98:10250–10255. 2001. View Article : Google Scholar : PubMed/NCBI
|
|
31
|
Geradts J, Fong KM, Zimmerman PV and Minna
JD: Loss of Fhit expression in non-small-cell lung cancer:
Correlation with molecular genetic abnormalities and
clinicopathological features. Br J Cancer. 82:1191–1197. 2000.
View Article : Google Scholar : PubMed/NCBI
|
|
32
|
Pavelić K, Krizanac S, Cacev T, Hadzija
MP, Radosević S, Crnić I, Levanat S and Kapitanović S: Aberration
of FHIT gene is associated with increased tumor proliferation and
decreased apoptosis-clinical evidence in lung and head and neck
carcinomas. Mol Med. 7:442–453. 2001.
|
|
33
|
Feng Q, Hawes SE, Stern JE, Wiens L, Lu H,
Dong ZM, Jordan CD, Kiviat NB and Vesselle H: DNA methylation in
tumor and matched normal tissues from non-small cell lung cancer
patients. Cancer Epidemiol Biomarkers Prev. 17:645–654. 2008.
View Article : Google Scholar : PubMed/NCBI
|
|
34
|
Tomizawa Y, Nakajima T, Kohno T, Saito R,
Yamaguchi N and Yokota J: Clinicopathological significance of Fhit
protein expression in stage I non-small cell lung carcinoma. Cancer
Res. 58:5478–5483. 1998.PubMed/NCBI
|
|
35
|
Tseng JE, Kemp BL, Khuri FR, Kurie JM, Lee
JS, Zhou X, Liu D, Hong WK and Mao L: Loss of Fhit is frequent in
stage I non-small cell lung cancer and in the lungs of chronic
smokers. Cancer Res. 59:4798–4803. 1999.PubMed/NCBI
|
|
36
|
Lindskog C, Edlund K, Mattsson JS and
Micke P: Immunohistochemistry-based prognostic biomarkers in NSCLC:
Novel findings on the road to clinical use? Expert Rev Mol Diagn.
15:471–490. 2015. View Article : Google Scholar : PubMed/NCBI
|
|
37
|
Marchetti A, Pellegrini S, Bertacca G,
Buttitta F, Gaeta P, Carnicelli V, Nardini V, Griseri P, Chella A,
Angeletti CA, et al: FHIT and p53 gene abnormalities in
bronchioloalveolar carcinomas. Correlations with
clinicopathological data and K-ras mutations. J Pathol.
184:240–246. 1998. View Article : Google Scholar : PubMed/NCBI
|