Introduction
Liver cancer is one of the most common cancers and
the third major cause of cancer-related mortality worldwide
(1,2). As a major histological subtype,
hepatocellular carcinoma (HCC), account for 70 to 80% of primary
liver cancers (3). Despite
improvements in clinical treatments, such as surgical resection,
liver transplantation and interventional therapy, HCC prognoses
remain very poor (1).
Conventional chemotherapies for liver cancer are
generally ineffective and the multi-kinase inhibitor sorafenib is
the only drug for which randomized control trials have shown an
improved survival in advanced HCC (4). Sorafenib inhibits tumor growth
through inducing tumor cell apoptosis by suppressing the kinase
activity of Raf, an enzyme of the mitogen-activated protein kinase
(MAPK) signaling pathway. In addition, sorafenib inhibits VEGF
receptor (VEGFR) and platelet-derived growth factor receptor-β
(PDGF-β) signaling to block tumor angiogenesis (5). However, sorafenib is proved to merely
extend the life expectancy of patients with HCC by a few months
(4,6) because of the heterogeneity of HCC.
Therefore, sorafenib is insufficient to suppress HCC for both
primary and secondary drug resistance.
Metformin, a first-line oral anti-type II diabetes
agent used worldwide, suppresses tumorigenesis, according to recent
epidemic and laboratory studies (7,8).
Various explanations for the efficacy of metformin have been
proposed, such as the activation of AMPK and the inhibition of
insulin-like growth factor signaling and the mammalian target of
rapamycin (mTOR) pathway (9). In
patients with type II diabetes mellitus, metformin reduced HCC risk
and seemed to suppress HCC development (10). In our previous studies, we explored
the anti-proliferative effect of metformin in intra-hepatic
cholangiocarcinoma (ICC) cell lines (11). Metformin may enhance the
chemosensitivity of ICC to sorafenib by targeting the AMPK/mTOR
complex 1 pathway and the MAPK pathway. In addition, metformin
reversed multi-drug resistance (MDR) in the HCC BEL/FU cell line by
targeting mTOR/HIF-1α/p-gp/MRP1 (12).
Agent combination based chemotherapy is common used
for cancer patients. To develop a novel approach to benefit
sorafenib based HCC treatment, we designed this study to evaluate
the therapeutic effects and the underlying molecular mechanisms of
a combined sorafenib and metformin treatment in a series of
pre-clinical studies.
Materials and methods
Reagents
1,1-Dimethylbiguanide hydrochloride (metformin,
#D150959-5G), chloroquine (CQ, #C6628) and 3-methylad-enine (3MA,
#M9281) was purchased from Sigma-Aldrich (St. Louis, MO, USA);
sorafenib (C21H16ClF3N4O3C7H8O3S, CAS 475207-59-1) was purchased
from Selleck Chemicals (Houston, TX, USA); and the cell counting
kit-8 (CCK-8, KGA317), the Annexin V-FITC apoptosis detection kit
(KGA108), the terminal deoxynucleotidyltransferase-mediated
deoxyuridine triphosphate (dUTP) nick-end labeling (TUNEL) assay
kit (KGA707), the cell cycle detection kit (KGA512) and the ROS
detection kit (KGT010) were purchased from KeyGen Biotech (Nanjing,
China). The Histostain™-Plus kits (IgG/Bio, S-A/HRP, DAB) were
purchased from Zhongshan Golden Bridge Co., Ltd. (Beijing,
China).
Cell culture
The HCC cell lines Bel-7402 and HepG2 were purchased
from the Type Culture Collection of the Chinese Academy of Sciences
(Shanghai, China). The cell lines were cultured in RPMI-1640
supplemented with 10% fetal bovine serum (FBS) (both from Gibco,
Carlsbad, CA, USA) and 100 µg/ml each of penicillin and
streptomycin (Invitrogen, Carlsbad, CA, USA) in 5% CO2
at 37°C.
Antibodies
The following antibodies were used in western blot
analysis: β-actin (sc-47778, diluted 1:1,000) was from Santa Cruz
Biotechnology, Inc. (Santa Cruz, CA, USA). AKT (ab126811, diluted
1:1,000) and phosphorylated AKT (phospho-Ser473, ab66138, diluted
1:1,000) were from Abcam (Cambridge, MA, USA). Caspase-3 (AP7563C,
diluted 1:1,000), cleaved caspase-3 (AJ1131b, diluted 1:1,000),
CDK4 (AP7520b, diluted 1:1,000) and cyclin D1 (AP2612c, diluted
1:1,000) were from Abgent (San Diego, CA, USA). AMPKα (#2532,
diluted 1:1,000) and phosphorylated AMPKα (phospho-Thr172, #2535,
diluted 1:1,000), mTOR (#2983, diluted 1:1,000), phosphorylated
mTOR (phospho-Ser2448, #5536, diluted 1:1,000), phosphorylated mTOR
(phospho-Ser2481, #2974, diluted 1:1,000), phosphorylated Raptor
(phospho-Ser792, #2083, diluted 1:1,000), phosphorylated p70 S6
kinase (phospho-Thr389, #9234, diluted 1:1,000), phosphorylated
4E-BP1 (phospho-Thr37/46, #2855, diluted 1:1,000), PARP (#9532,
diluted 1:1,000), cleaved PARP (#5626, diluted 1:1,000), ERK
(#4696, diluted 1:2,000), phosphorylated ERK
(phospho-Thr202/Tyr204, #4370, diluted 1:2,000), Ki-67 (#9449,
diluted 1:1,000), LC3-I/II (#12741, diluted 1:1,000) and p62
(#8025, diluted 1:1,000) were from Cell Signaling Technology, Inc.
(Danvers, MA, USA). Goat anti-rabbit and goat anti-mouse IgG
peroxidase-conjugated secondary antibodies (31460 and 31430, both
diluted 1:10,000) were from Thermo-Pierce (Rockford, IL, USA). The
following antibodies used in the IHC assays were as described
above: phosphorylated mTOR (phospho-Ser2448, diluted 1:200),
phosphorylated mTOR (phospho-Ser2481, diluted 1:200),
phosphorylated AKT (phospho-Ser473, diluted 1:200), phosphorylated
ERK (phospho-Thr202/Tyr204, diluted 1:200), cleaved caspase-3
(diluted 1:200), and Ki-67 (diluted 1:200).
Cell viability assay
Cell viability was determined using the CCK-8 assay
according to the manufacturer's instructions. Cells
(5×10³) were seeded into a well of a 96-well plate and
cultured in 100 µl of RPMI-1640 supplemented with 10% FBS,
100 µg/ml penicillin and 100 µg/ml streptomycin.
After 24 h, the agents (10 mmol/l metformin and/or 5 µmol/l
sorafenib) was added to the culture medium. After the cells were
incubated at 37°C for different times (24, 48 or 72 h), the medium
was changed for 100 µl of RPMI-1640 and 10 µl of
CCK-8 reagent. The cells were incubated for 2 h at 37°C. Finally,
the optical density was measured using an EnSpire™ 2300 Multilabel
Reader (Perkin-Elmer, Waltham, MA, USA) at 450 nm. Five replicates
were prepared for each condition. The mean values were calculated
and growth curves were drawn.
Clonogenic assay
The inhibitory effect of metformin and sorafenib on
HCC cell proliferation was also determined by clonogenic assay.
Logarithmic-phase HCC cells were trypsinized and collected, and the
resuspended cells were seeded into 6-well plates in triplicates at
a density of 500 cells/well in 2 ml of medium containing 10% FBS.
After a 24 h incubation, the cultures were replaced with fresh
medium containing 2% FBS and 5 mmol/l metformin, 2.5 µmol/l
sorafenib or their combination and grown for 10 days. The cell
clones were stained with a solution containing 1% crystal violet
and 25% methanol for 2 min. The excess dye was removed by gently
rinsing with tap water for 15 min. The average surface of the
clones was determined by Image Pro Plus 6.0 software.
Western blot analysis
Cells after different treatments or tumor tissues
from xenografts were harvested and lysed in RIPA buffer (KGP702)
supplemented with 1 mM phenylmethylsulfonyl fluoride (PMSF; KGP610)
and 1 mM phosphatase inhibitor cocktail (KGP602; all from KeyGen
Biotech). The mixture was centrifuged at 12,000 × g for 20 min and
the supernatant was collected. The protein concentration was
determined using the BCA assay kit (KGPBCA) and each sample
contained 30 µg protein per 10 µl. The protein
samples were mixed with loading buffer (KGP101) and the proteins
were separated using 6, 8 or 10% sodium dodecyl
sulfate-polyacrylamide gel electrophoresis (SDS-PAGE) followed by
transfer to polyvinylidenedifluoride (PVDF) membranes (Bio-Rad
Laboratories, Hercules, CA, USA). After soaking in blocking buffer
for 2 h, the blots were incubated with the primary antibody with
gentle agitation overnight at 4°C and were subsequently incubated
at 37°C for 1 h with the HRP-conjugated secondary antibody. The
bands were visualized by chemiluminescence, imaged using a ChemiDoc
XRS and analyzed using Image Lab (both from Bio-Rad).
Cell cycle, apoptosis and ROS
evaluation
To evaluate the effects of metformin on cell cycle
arrest, induction of apoptosis and intracellular ROS, the cells
were examined using the cell cycle detection kit, the Annexin
V-FITC apoptosis detection kit and the ROS detection kit,
respectively, according to the manufacturer's protocols. Bel-7402
and HepG2 cells were seeded into 6-well plates (5×10⁴
and 1×10⁵ cells/dish for analysis of cell cycle arrest
and apoptosis, respectively) and incubated for 24 h. For cell cycle
analysis, after treatment with agents for 48 h, a total of
1×10⁶ cells was pelleted by centrifugation and washed
twice with PBS. Then, the cell pellets were resuspended in 500
µl of ice-cold 70% ethanol and incubated at 4°C overnight.
The fixed cells were centrifuged and the pellets were washed with
PBS. After incubation with 100 µl RNase A (10 µg/ml)
for 30 min at 37°C in the dark, the cells were resuspended in 400
µl propidium iodide (PI) (50 µg/ml) and placed at 4°C
in the dark for 30 min. The stained cells were analyzed using an
Accuri C6 flow cytometer (Accuri Cytometers Inc., Ann Arbor, MI,
USA).
For the apoptosis analysis, the cells were
trypsinized, washed with cold PBS and suspended in PBS. Then, the
cells were stained using the Annexin V-FITC reaction reagent (5
µl of Annexin V-FITC, 5 µl of PI) at 37°C for 30 min
in the dark. The stained cells were analyzed using an Accuri C6
flow cytometer (Accuri Cytometers Inc.).
For the detection of intracellular ROS, an
oxidation-sensitive fluorescent probe (DCFH-DA) was used. After
treatment with agents for 24 h, a total of 1×10⁶ cells
was trypsinized and pelleted by centrifugation and washed twice
with PBS. Then, the cell pellets were resuspended in 1 ml RPMI-1640
(serum-free) with 10 µm/l DCFH-DA and incubated for 20 min
at 37°C. The positive control was treated with Rosup according to
the manufacturer's protocol (data not shown). The stained cells
were analyzed using an Accuri C6 flow cytometer (Accuri Cytometers
Inc.). The FL1-A received the fluorescence induced by DCF. For each
sample, 20,000 events were collected.
Xenograft model analysis
To investigate the anti-proliferative effect of
metformin and sorafenib in combination on HCC cells in vivo,
a nude mouse model bearing HCC cell xenografts was established.
Five-week-old male athymic nude mice were obtained from the Animal
Facility of Dalian Medical University. The mice were maintained
under pathogen-free conditions and were provided with sterilized
food and water. First, 5×10⁶ Bel-7402 cells were
injected subcutaneously into the right flank near the hind leg of
each nude mouse. When the mice bore palpable tumors (the tumor
volume was ~100 mm3), they were randomly divided into
control [100 µl normal saline (NS) by intraperitoneal
injection plus 100 µl 1% dimethyl sulfoxide (DMSO)] and 0.5%
carboxymethyl cellulose [(CMC)-Na sterile water), metformin (200
mg/kg/day by intraperitoneal injection plus 100 µl 1% DMSO
and 0.5% CMC-Na sterile water)], sorafenib (30 µg/kg/day by
intragastric administration plus 100 µl NS by
intraperitoneal injection) and combination (metformin, 200
mg/kg/day by intraperitoneal injection plus sorafenib 30
µg/kg/day by intragastric administration) groups (n=6
animals/group). The treatments were performed for 4 weeks, 5
times/week. The tumor volume was detected every week and was
calculated by the following formula: volume = 1/2 (length x
width2). After 4 weeks, the mice were euthanized and the
tumors were isolated.
Immunohistochemical staining
The tumors isolated from the mice were
paraffin-embedded and cut into 10 µm sections in a microtome
cryostat (HM 500 OM; Carl Zeiss, Jena, Germany).
Immunohistochemical staining was conducted according to the
manufacturer's protocols for the Histostain™-Plus kits. Primary
antibodies (as described in the antibodies section) were incubated
at 4°C overnight. Images were captured with a light microscope
(Axiolab; Carl Zeiss) and 5 images/sample were prepared. The
Image-Pro Plus 4.5 software was used to analyze the staining
data.
TUNEL assay
In situ detection of apoptotic cells in the
tumors isolated from the mice was performed by TUNEL assay. The
tumors were paraffin embedded and cut into 10 µm sections in
a microtome cryostat (HM 500 OM; Carl Zeiss). The TUNEL assay was
conducted according to the manufacturer's protocols.
3,3-diaminobenzidine (DAB) was used as the substrate for the
peroxidase. The images were captured with a light microscope
(Axiolab; Carl Zeiss) and 5 images/sample were prepared. Image-Pro
Plus 4.5 software was used to analyze the staining data.
Autophagy analysis by transmission
electron microscopy
HCC cells were harvested by trypsinization and fixed
by immersion in 2.5% glutaraldehyde in 0.1 ml phosphate buffer (pH
7.4). The cells were then post-fixed in 1% osmium tetroxide,
dehydrated in a graded series of ethanol and embedded in epoxy
resin. The cells were sliced into 1 µm sections and stained
with 0.2% lead citrae and 2% uranyl acetate. Representative areas
were chosen for ultra-thin sections to view with a Tecnai Spirit
electron microscope.
Statistical analysis
SPSS 13.0 statistical software was used for the
statistical analysis. The values are presented as the mean ± SD.
Statistical analyses were performed using Student's t-test. The
analysis of multiple groups was performed with ANOVA with an
appropriate post-hoc test.
Results
Combined treatment of metformin with
sorafenib induces impaired proliferation as well as cell cycle
arrest in HCC
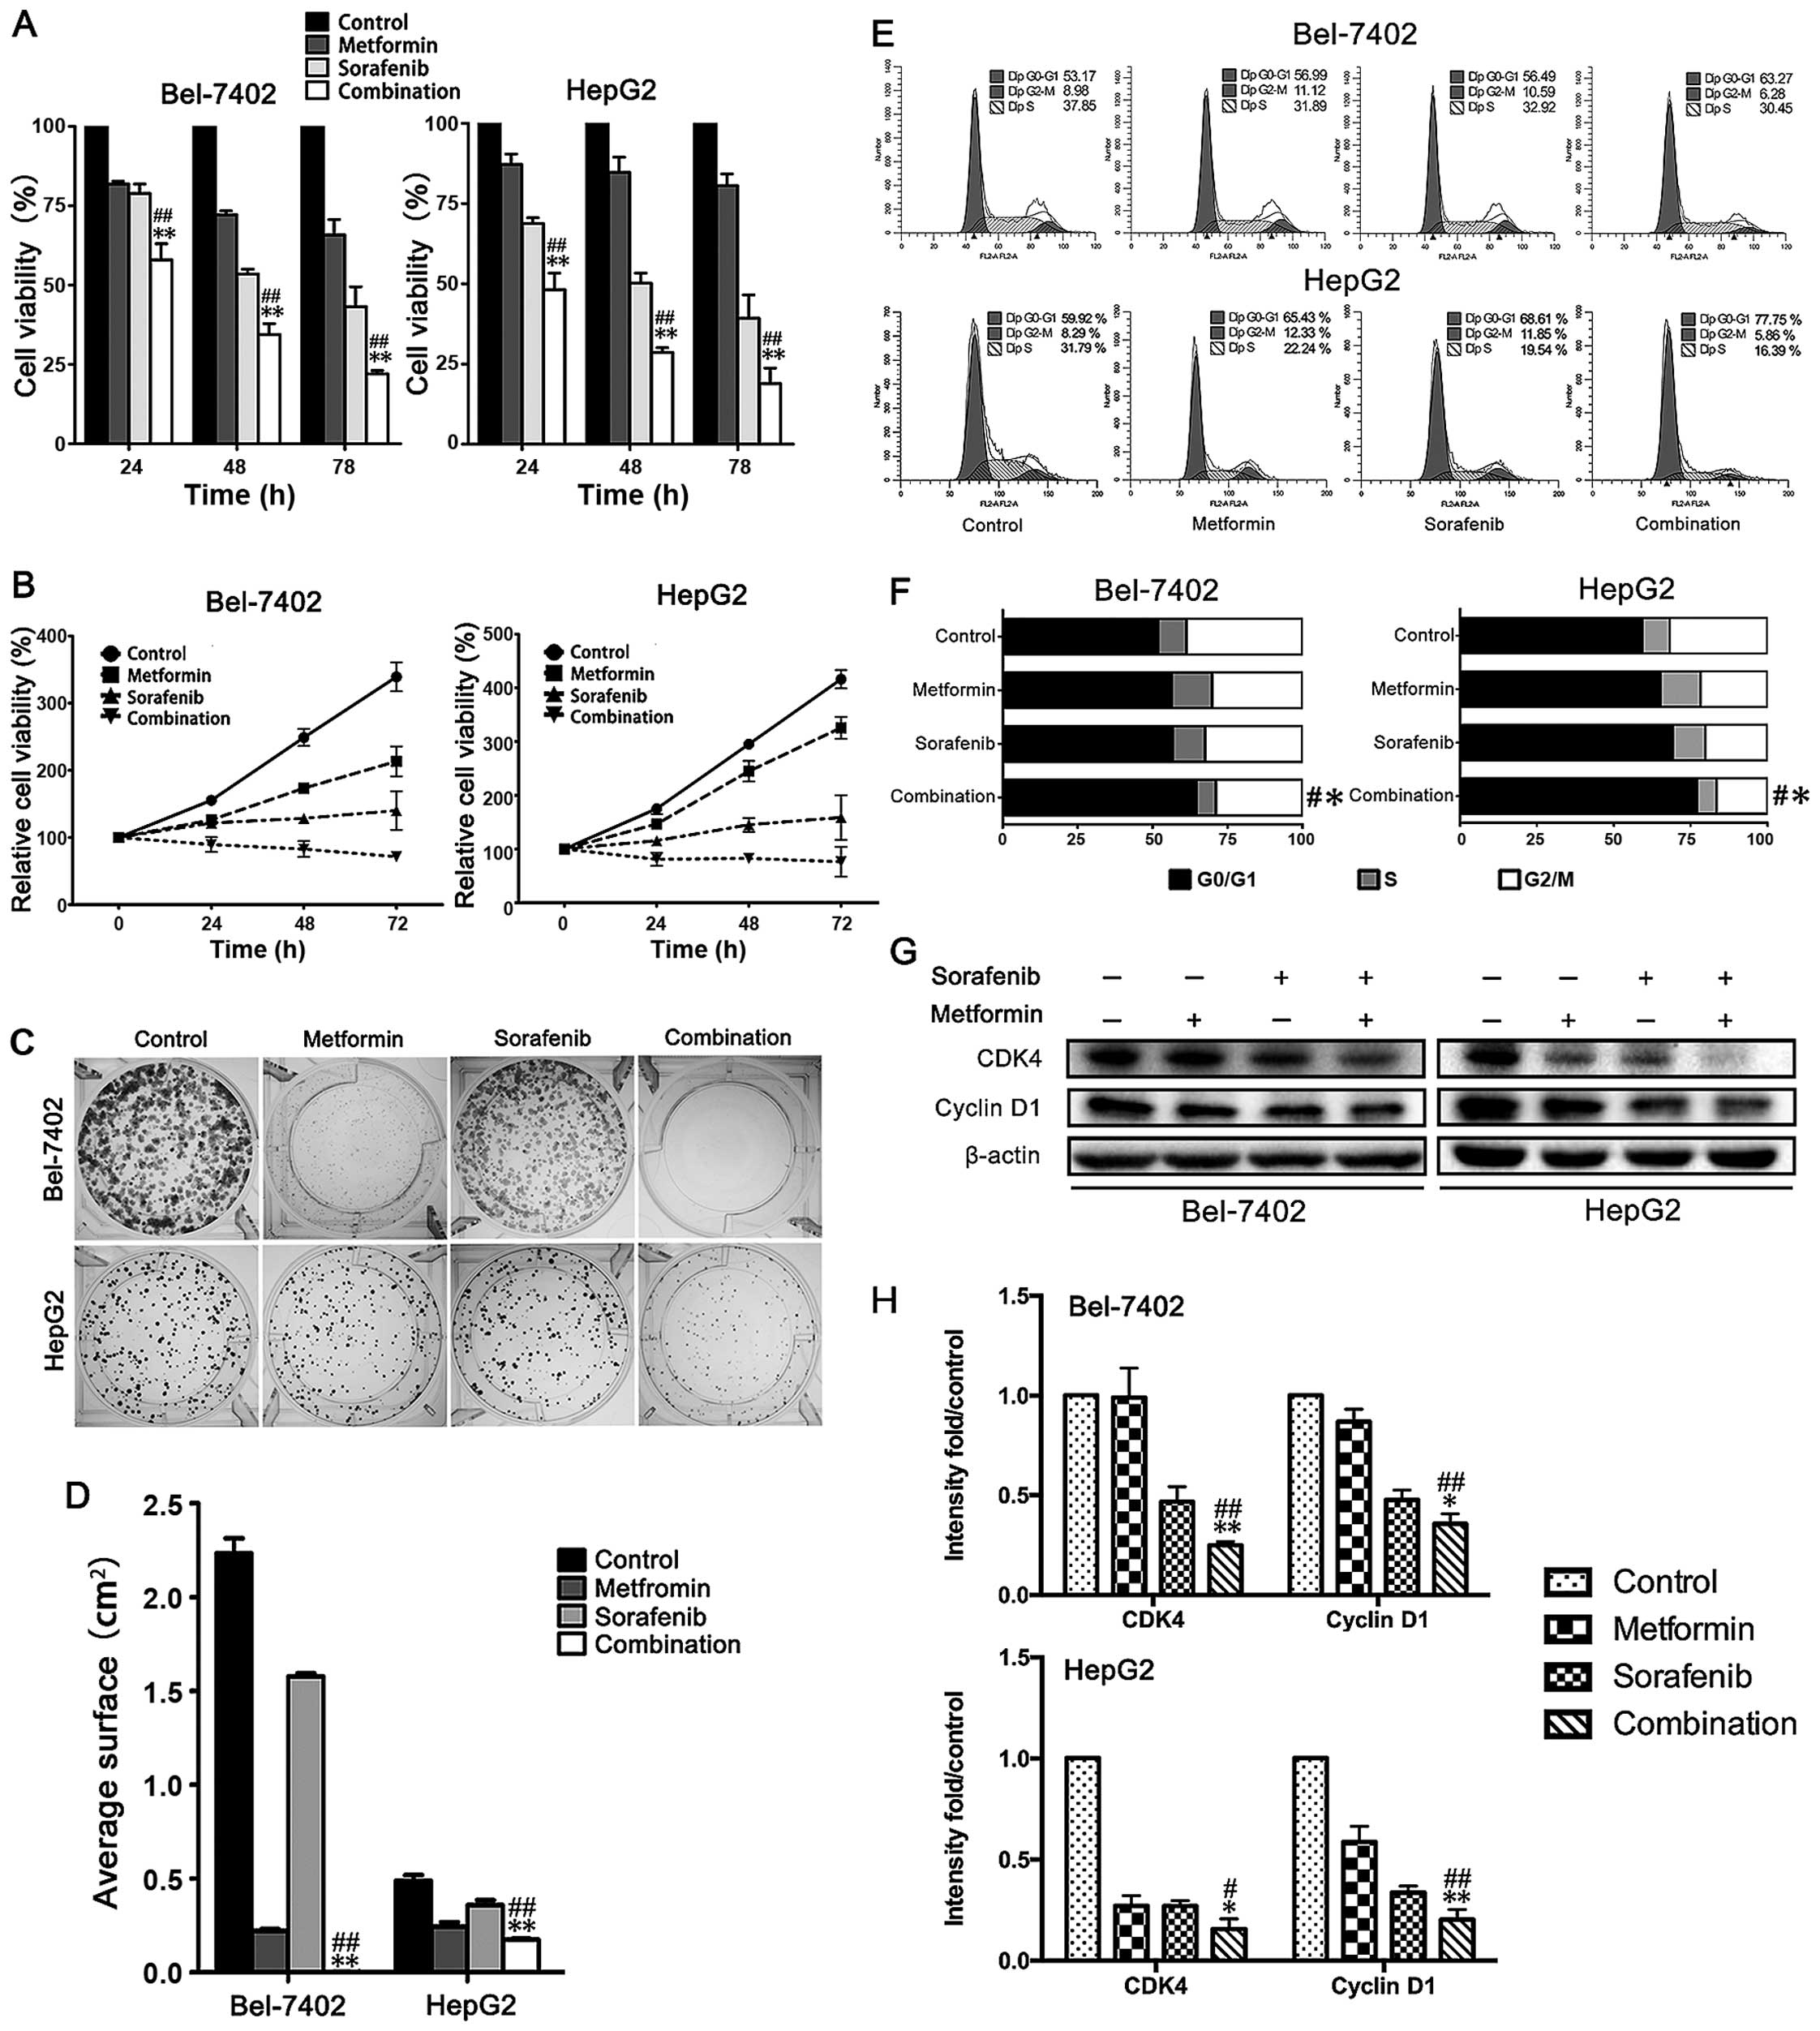
The effect of a combination treatment of metformin
and sorafenib on HCC proliferation was investigated in Bel-7402 and
HepG2 cells using CCK-8 and clonogenic assays. The CCK-8 assay
revealed a much stronger inhibitory effect of the combination than
any single drug treatment for 3 days (Fig. 1A and B). A comparable defect was
detected in single cell colony formation (Fig. 1C and D). Over a 10-day treatment,
although metformin and sorafenib suppressed single cell colony
progression, the combination almost eliminated colony formation.
Next, we performed cell cycle analysis. A significant increase in
the number of cells arrested in G0/G1 phase was observed in
Bel-7402 and HepG2 cells with a combined treatment of metformin and
sorafenib compared to the single drug treatment (Fig. 1E and F). Consequently, cyclin D1
and CDK4, the key regulators for G0/G1 to S phase transition, were
further reduced in Bel-7402 and HepG2 cells (Fig. 1G and H) by the combined treatment
when compared to the any single treatment. Remarkably, 10 mmol/l
metformin and 5 µmol/l sorafenib were used for the CCK-8
assay and 5 mmol/l metformin and 2.5 µmol/l sorafenib were
used for the clonogenic assay which are described in the figure
legends. We had used the same drug concentration of CCK-8 assay in
clonogenic assay, but no clones grew (data not shown). Thus, we
think the lower cell concentration may increase the sensitivity of
HCC cells to metformin and sorafeinib and we decreased the drug
concentration in clonogenic assay. So the different drug
concentration may be responsible for the different results between
CCK-8 and clonogenic assay. Collectively, these results revealed
that a combined treatment of metformin and sorafenib remarkably
promotes anti-proliferative effects and G0/G1 cell cycle arrest in
HCC cells.
Metformin facilitates sorafenib-induced
apoptosis in HCC cells through promoting ROS production
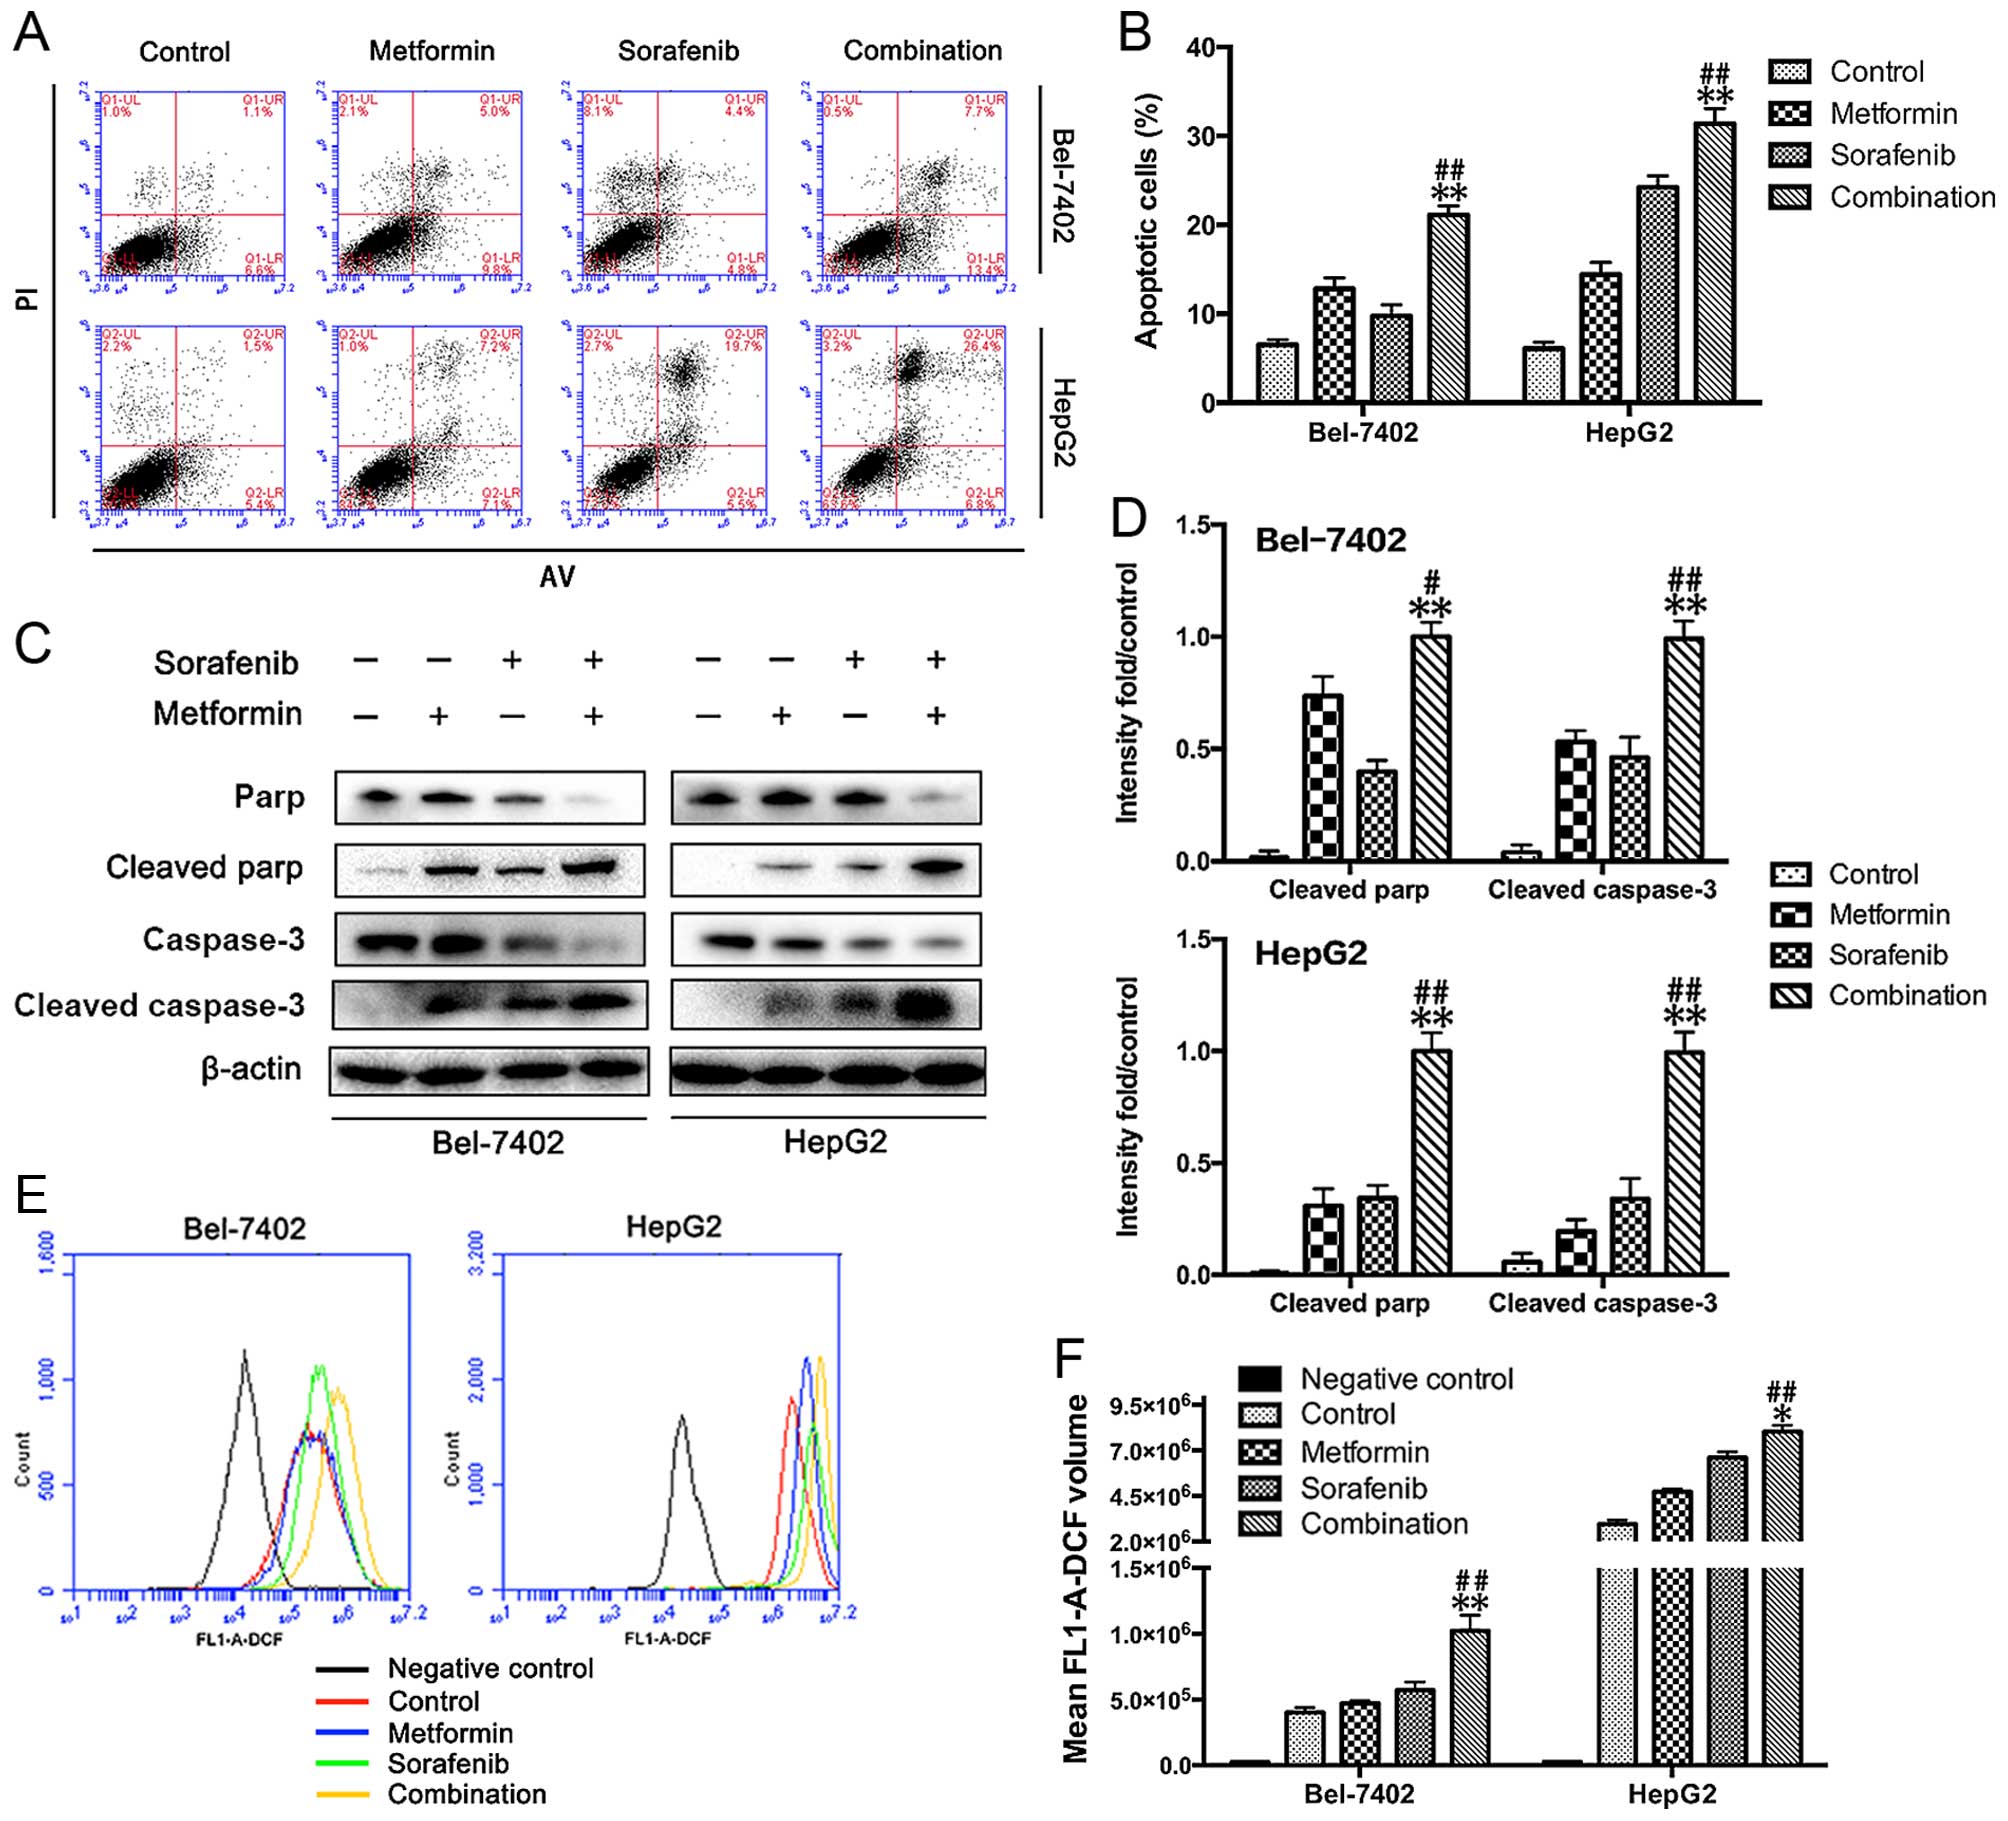
Apoptosis is an underlying antitumor mechanism for
both metformin and sorafenib. Here, we investigated the effects of
the combined treatment on apoptosis in Bel-7402 and HepG2 cells.
The apoptosis assay (Annexin V/PI staining), as shown in Fig. 2A and B, revealed a significant
increase in the number of apoptotic cells observed in Bel-7402 and
HepG2 cells with a combined treatment of metformin and sorafenib
compared to the single drug treatment. To confirm these results, we
performed western blot analysis and found increased expression of
cleaved PARP and cleaved caspase-3 in both metformin- and
sorafenib-treated Bel-7402 and HepG2 cells. Consistent with the
greater apoptotic events, the combined treatment led to higher
levels of cleaved PARP and cleaved caspase-3 in both Bel-7402 and
HepG2 cells compared to single drug treatment alone (Fig. 2C and D). As sorafenib can induce
mitochondrial-dependent ROS production, which elicits cell death in
hepatomas (13), we next
determined the influence of metformin on sorafenib-induced ROS
production. As expected, data in Fig.
2E and F present that metformin (10 mmol/l) was readily to
promote sorafenib (5 µmol/l) induced ROS production.
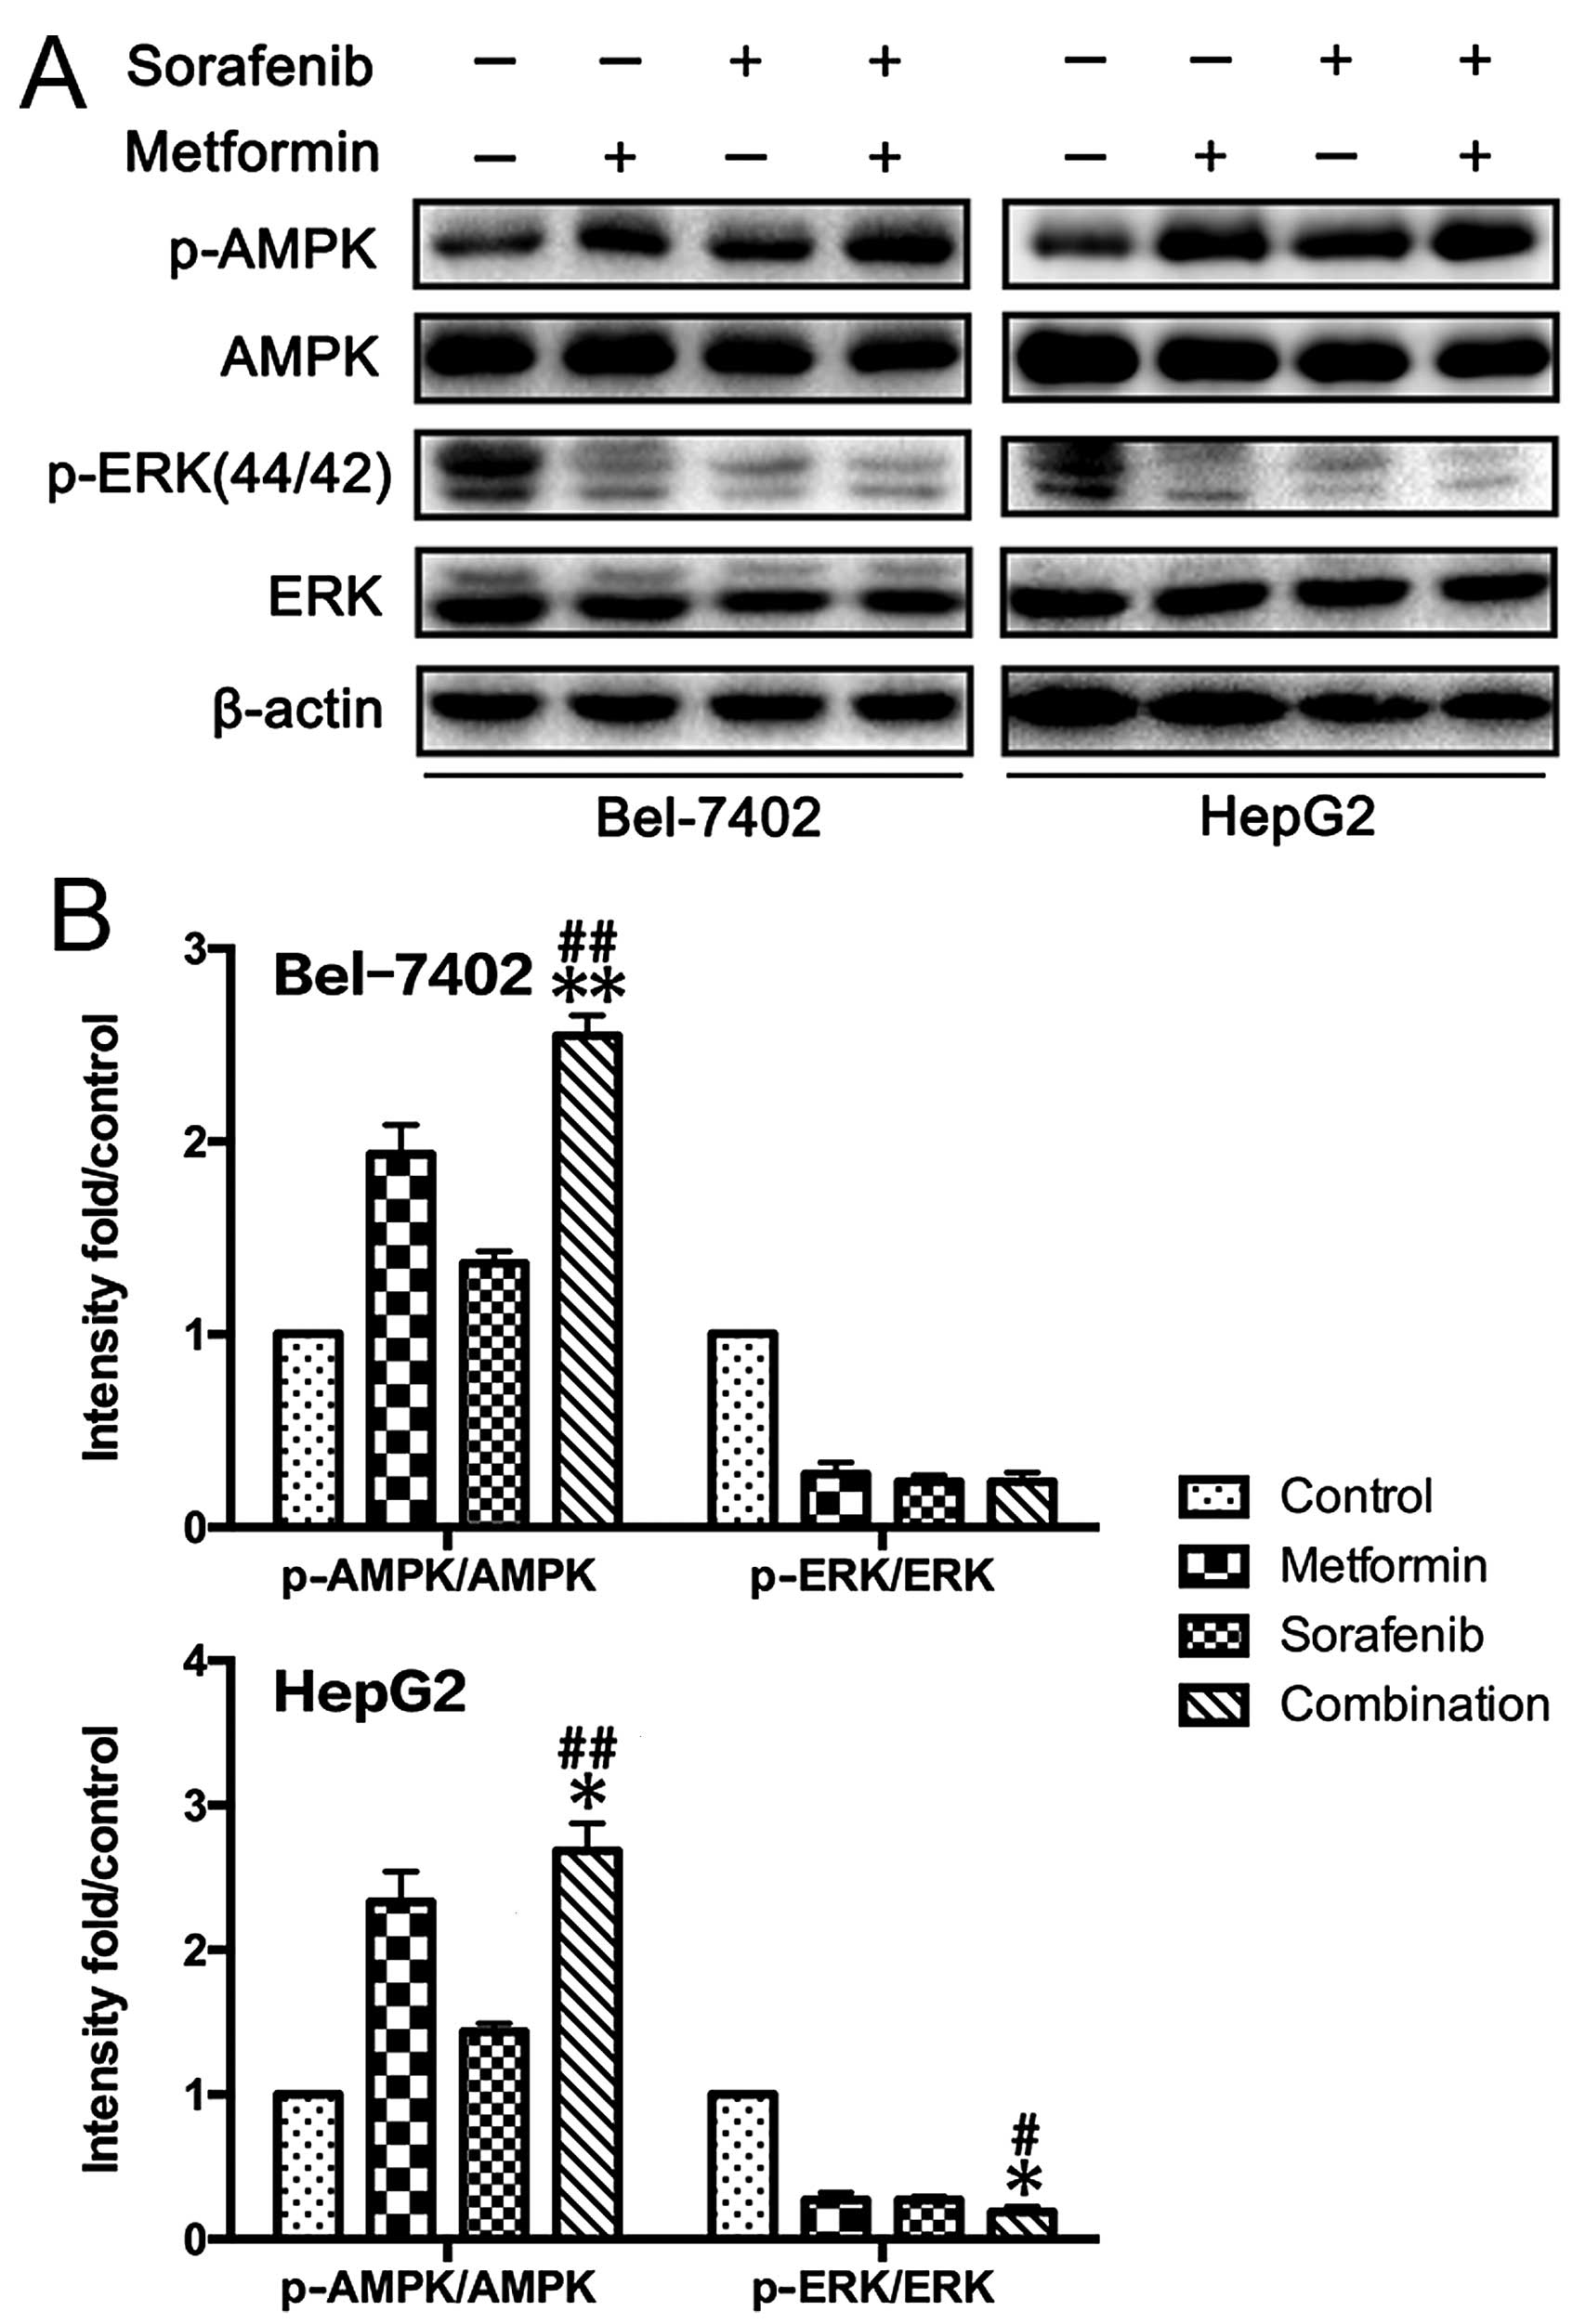
Metformin and sorafenib regulate the
AMPK/ERK and mTORC1/2 pathways
To analyze the potential molecular mechanism, we
investigated the effects of metformin and sorafenib on the AMPK/ERK
and mTOR pathways in HCC cells (Fig.
3). Both metformin (10 mmol/l) and sorafenib (5 µmol/l)
activated AMPK and inhibited ERK compared to untreated HCC cells.
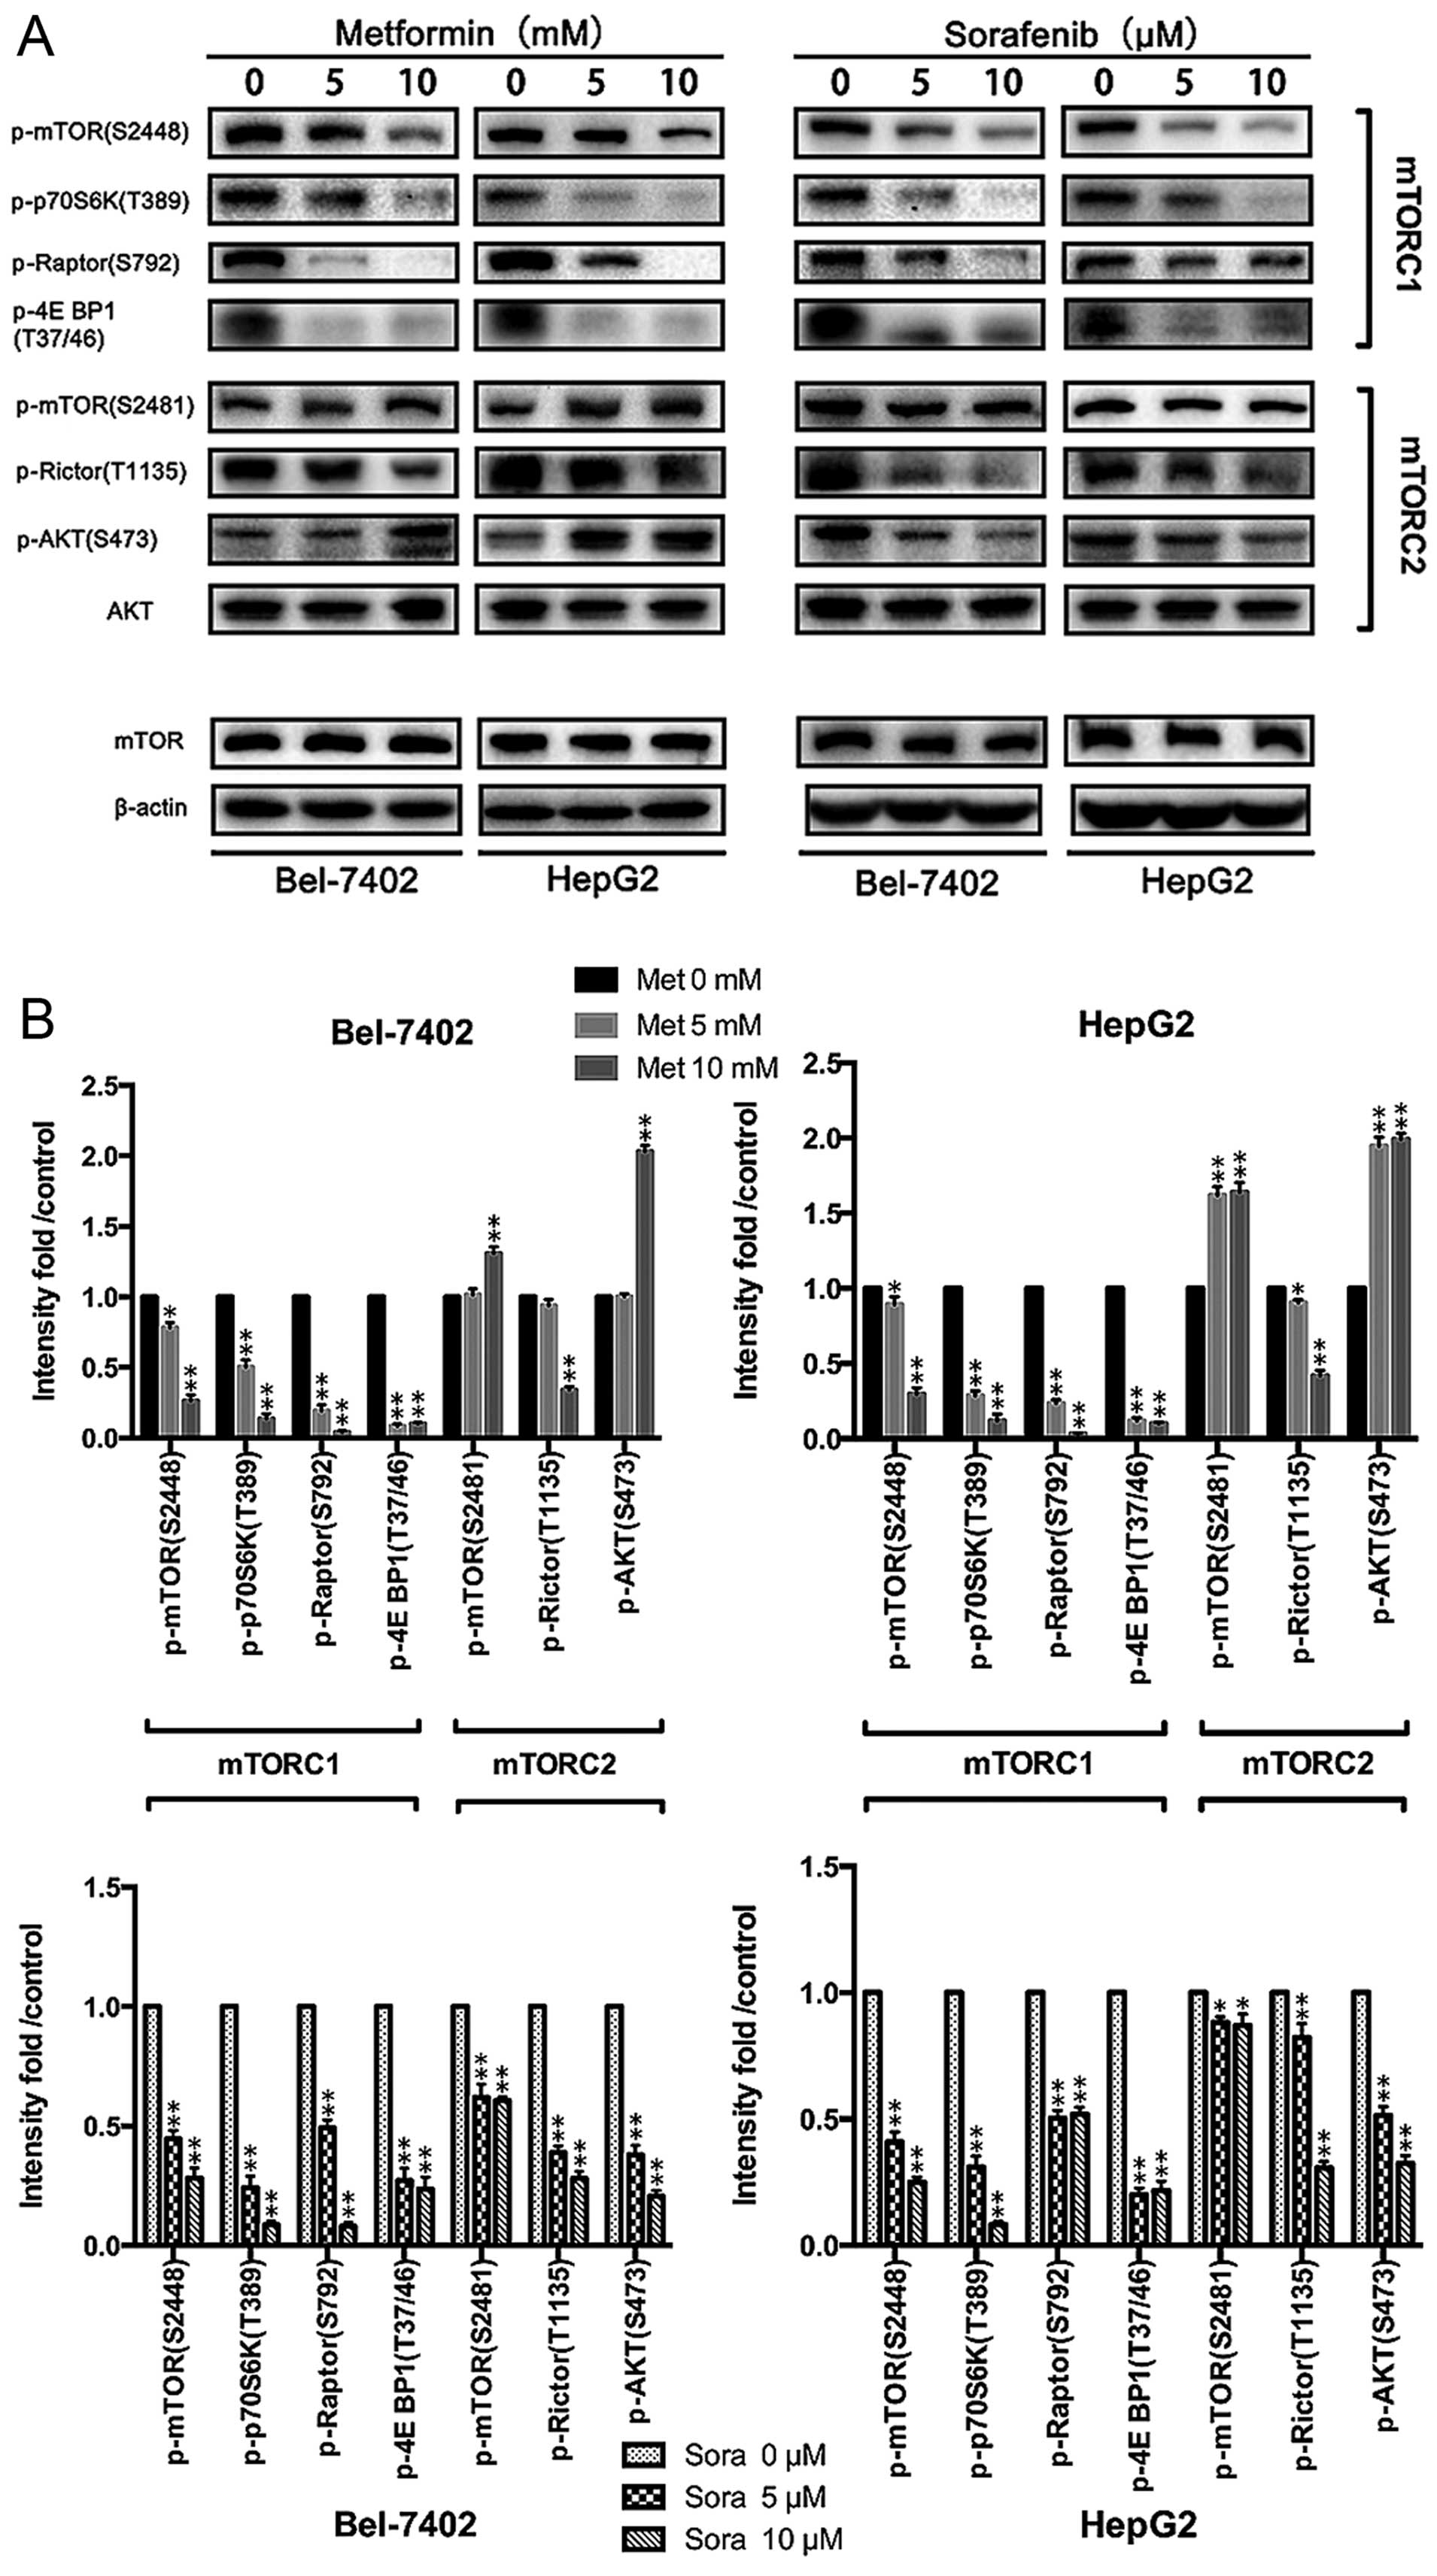
At concentrations of 0, 5 and 10 mmol/l, metformin significantly
inhibited the mTORC1 (p-mTOR Ser2448, p-p70S6K Thr389, p-Raptor
Ser792, p-4E BP1 Thr37/46) but activated the mTORC2 (p-mTOR
Ser2481, p-Rictor Thr1135, p-AKT Ser473) (Fig. 3) pathway. Inconsistent results were
obtained after sorafenib treatment, which suppressed the activation
of both the mTORC1 and the mTORC2 pathway in HepG2 and Bel-7042
cells (Fig. 4A and B). The
consequences of the combination of metformin and sorafenib on
mTOR1/2 networks was further investigated, revealing that sorafenib
reversed the activation status of mTORC2 induced by metformin and
enhanced the suppression of mTORC1 by metformin in HCC cells
(Fig. 4C and D). This result may
explain the additional reduction in proliferation upon combined
treatment.
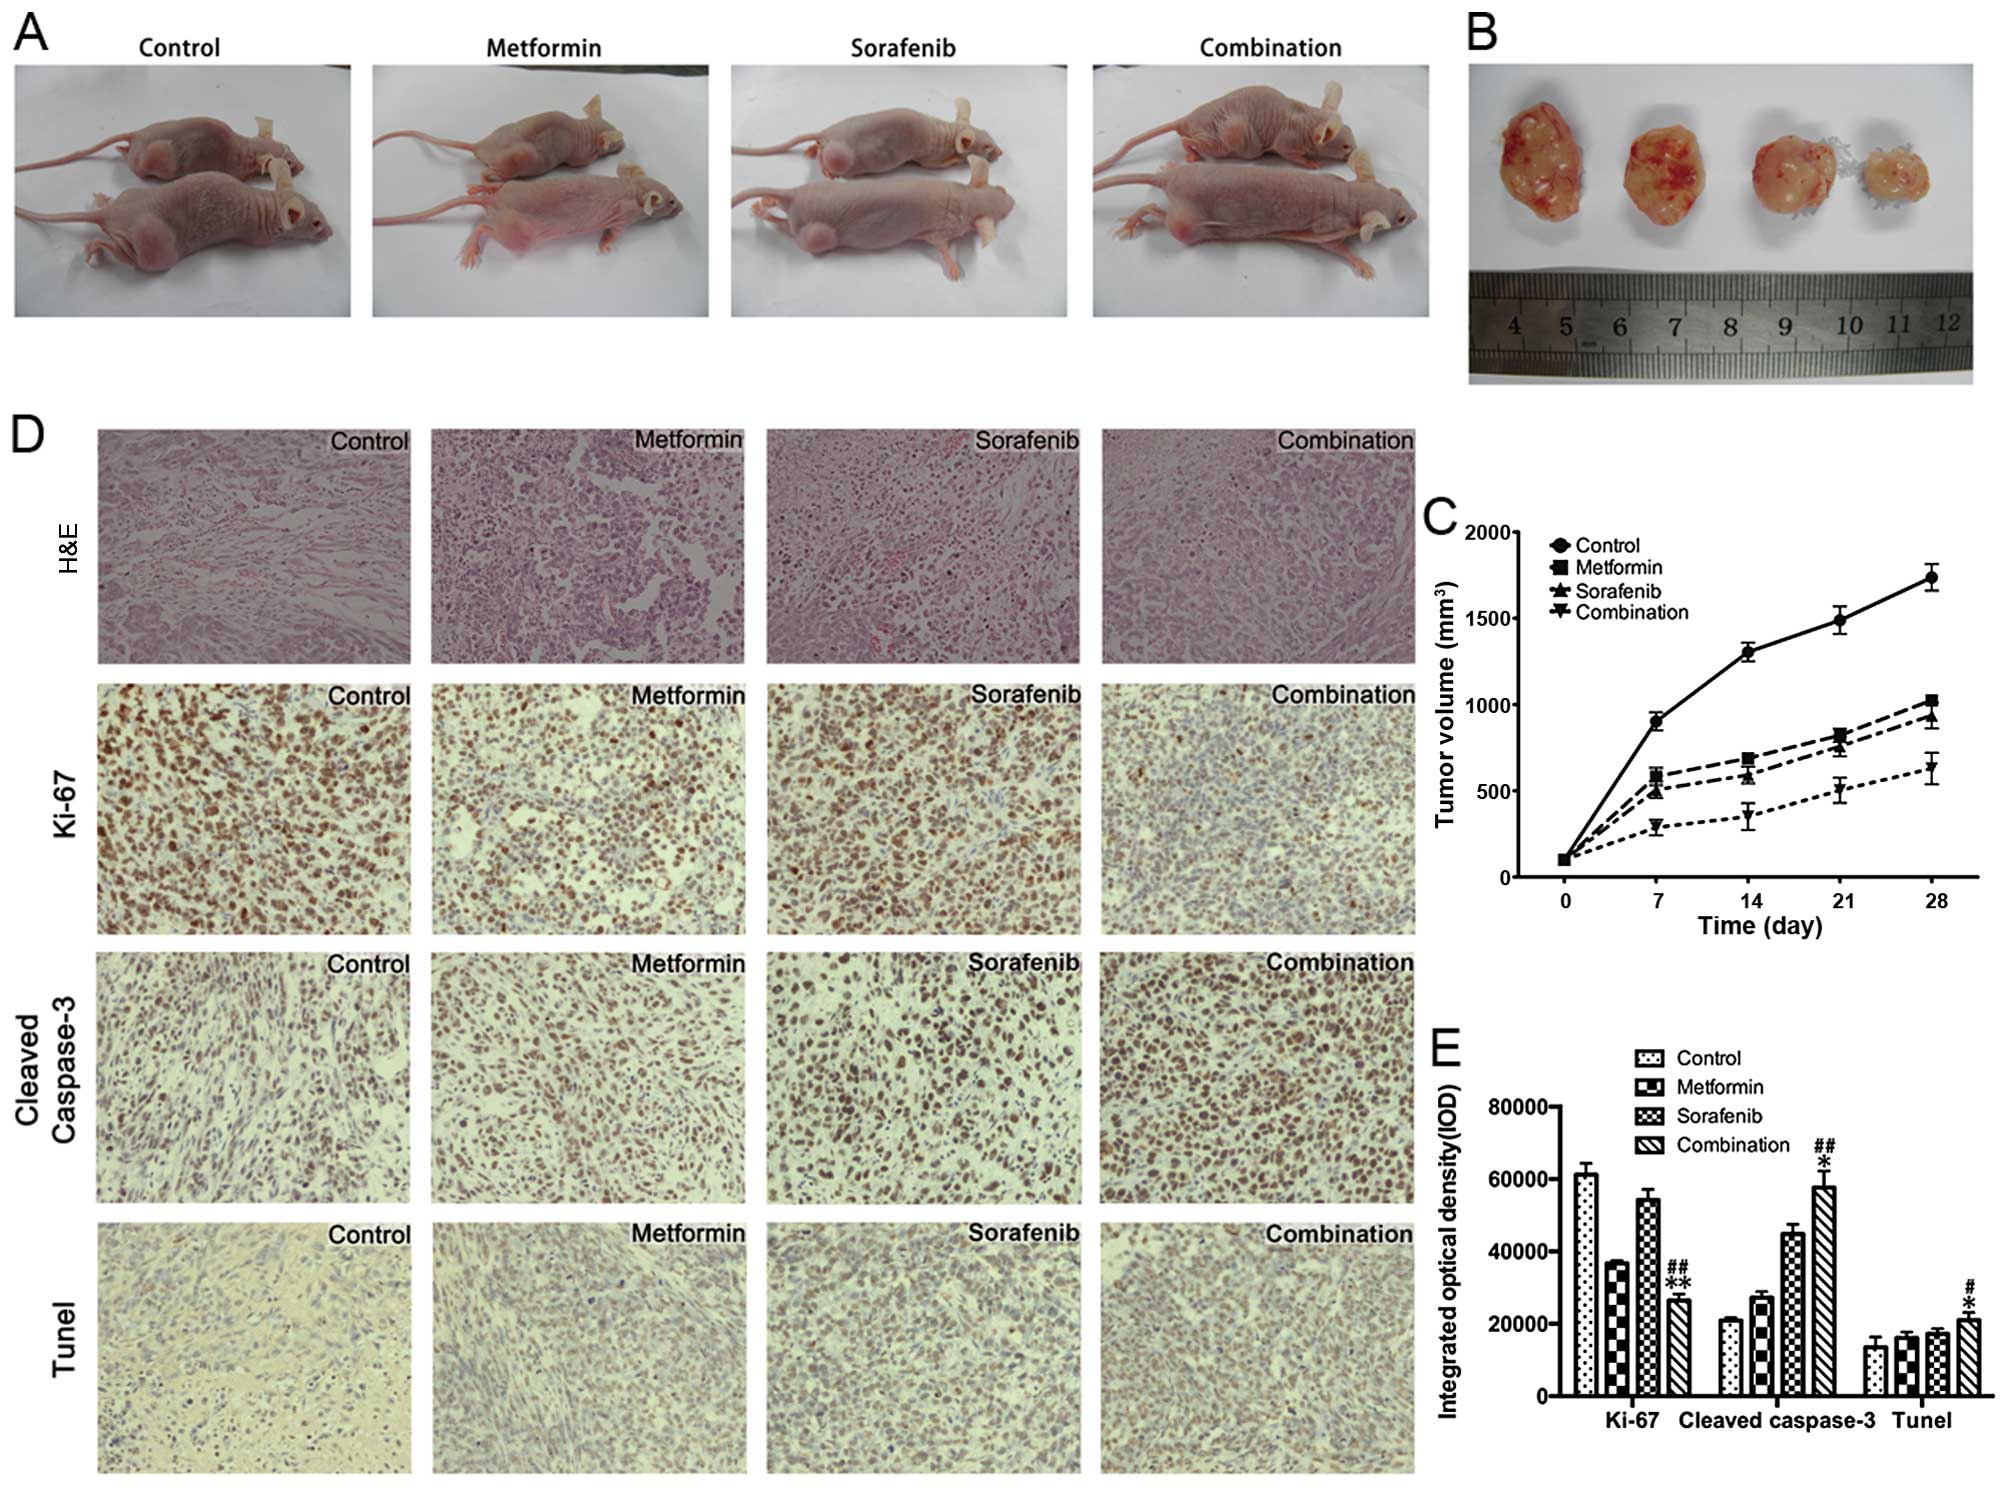
Combined treatment with metformin and
sorafenib efficiently reduces HCC growth in a HCC xenograft
model
To further validate our in vitro results
showing the anti-proliferative effects of combined treatment of
metformin and sorafenib, we treated male athymic nude mice bearing
palpable tumors (~100 mm3) of Bel-7402 xenografts with
control (vehicle-treated mice), metformin (200 mg/kg/day),
sorafenib (30 µg/kg/day) and their combination (Fig. 5A–C) for 28 days. The tumor volumes
of the combined treatment group were significantly reduced compared
to the groups treated with either metformin or sorafenib.
Consistent with the in vitro data, immunohistochemistry and
TUNEL analyses (Fig. 5D and E) of
the xenograft tumors revealed that the metformin and sorafenib
combination effectively inhibited the expression of Ki-67, a marker
for representing tumor proliferation. Moreover, metformin
facilitated the sorafenib induced apoptosis in xenograft tumors as
evaluated by the cleaved caspase-3 staining and TUNEL assay.
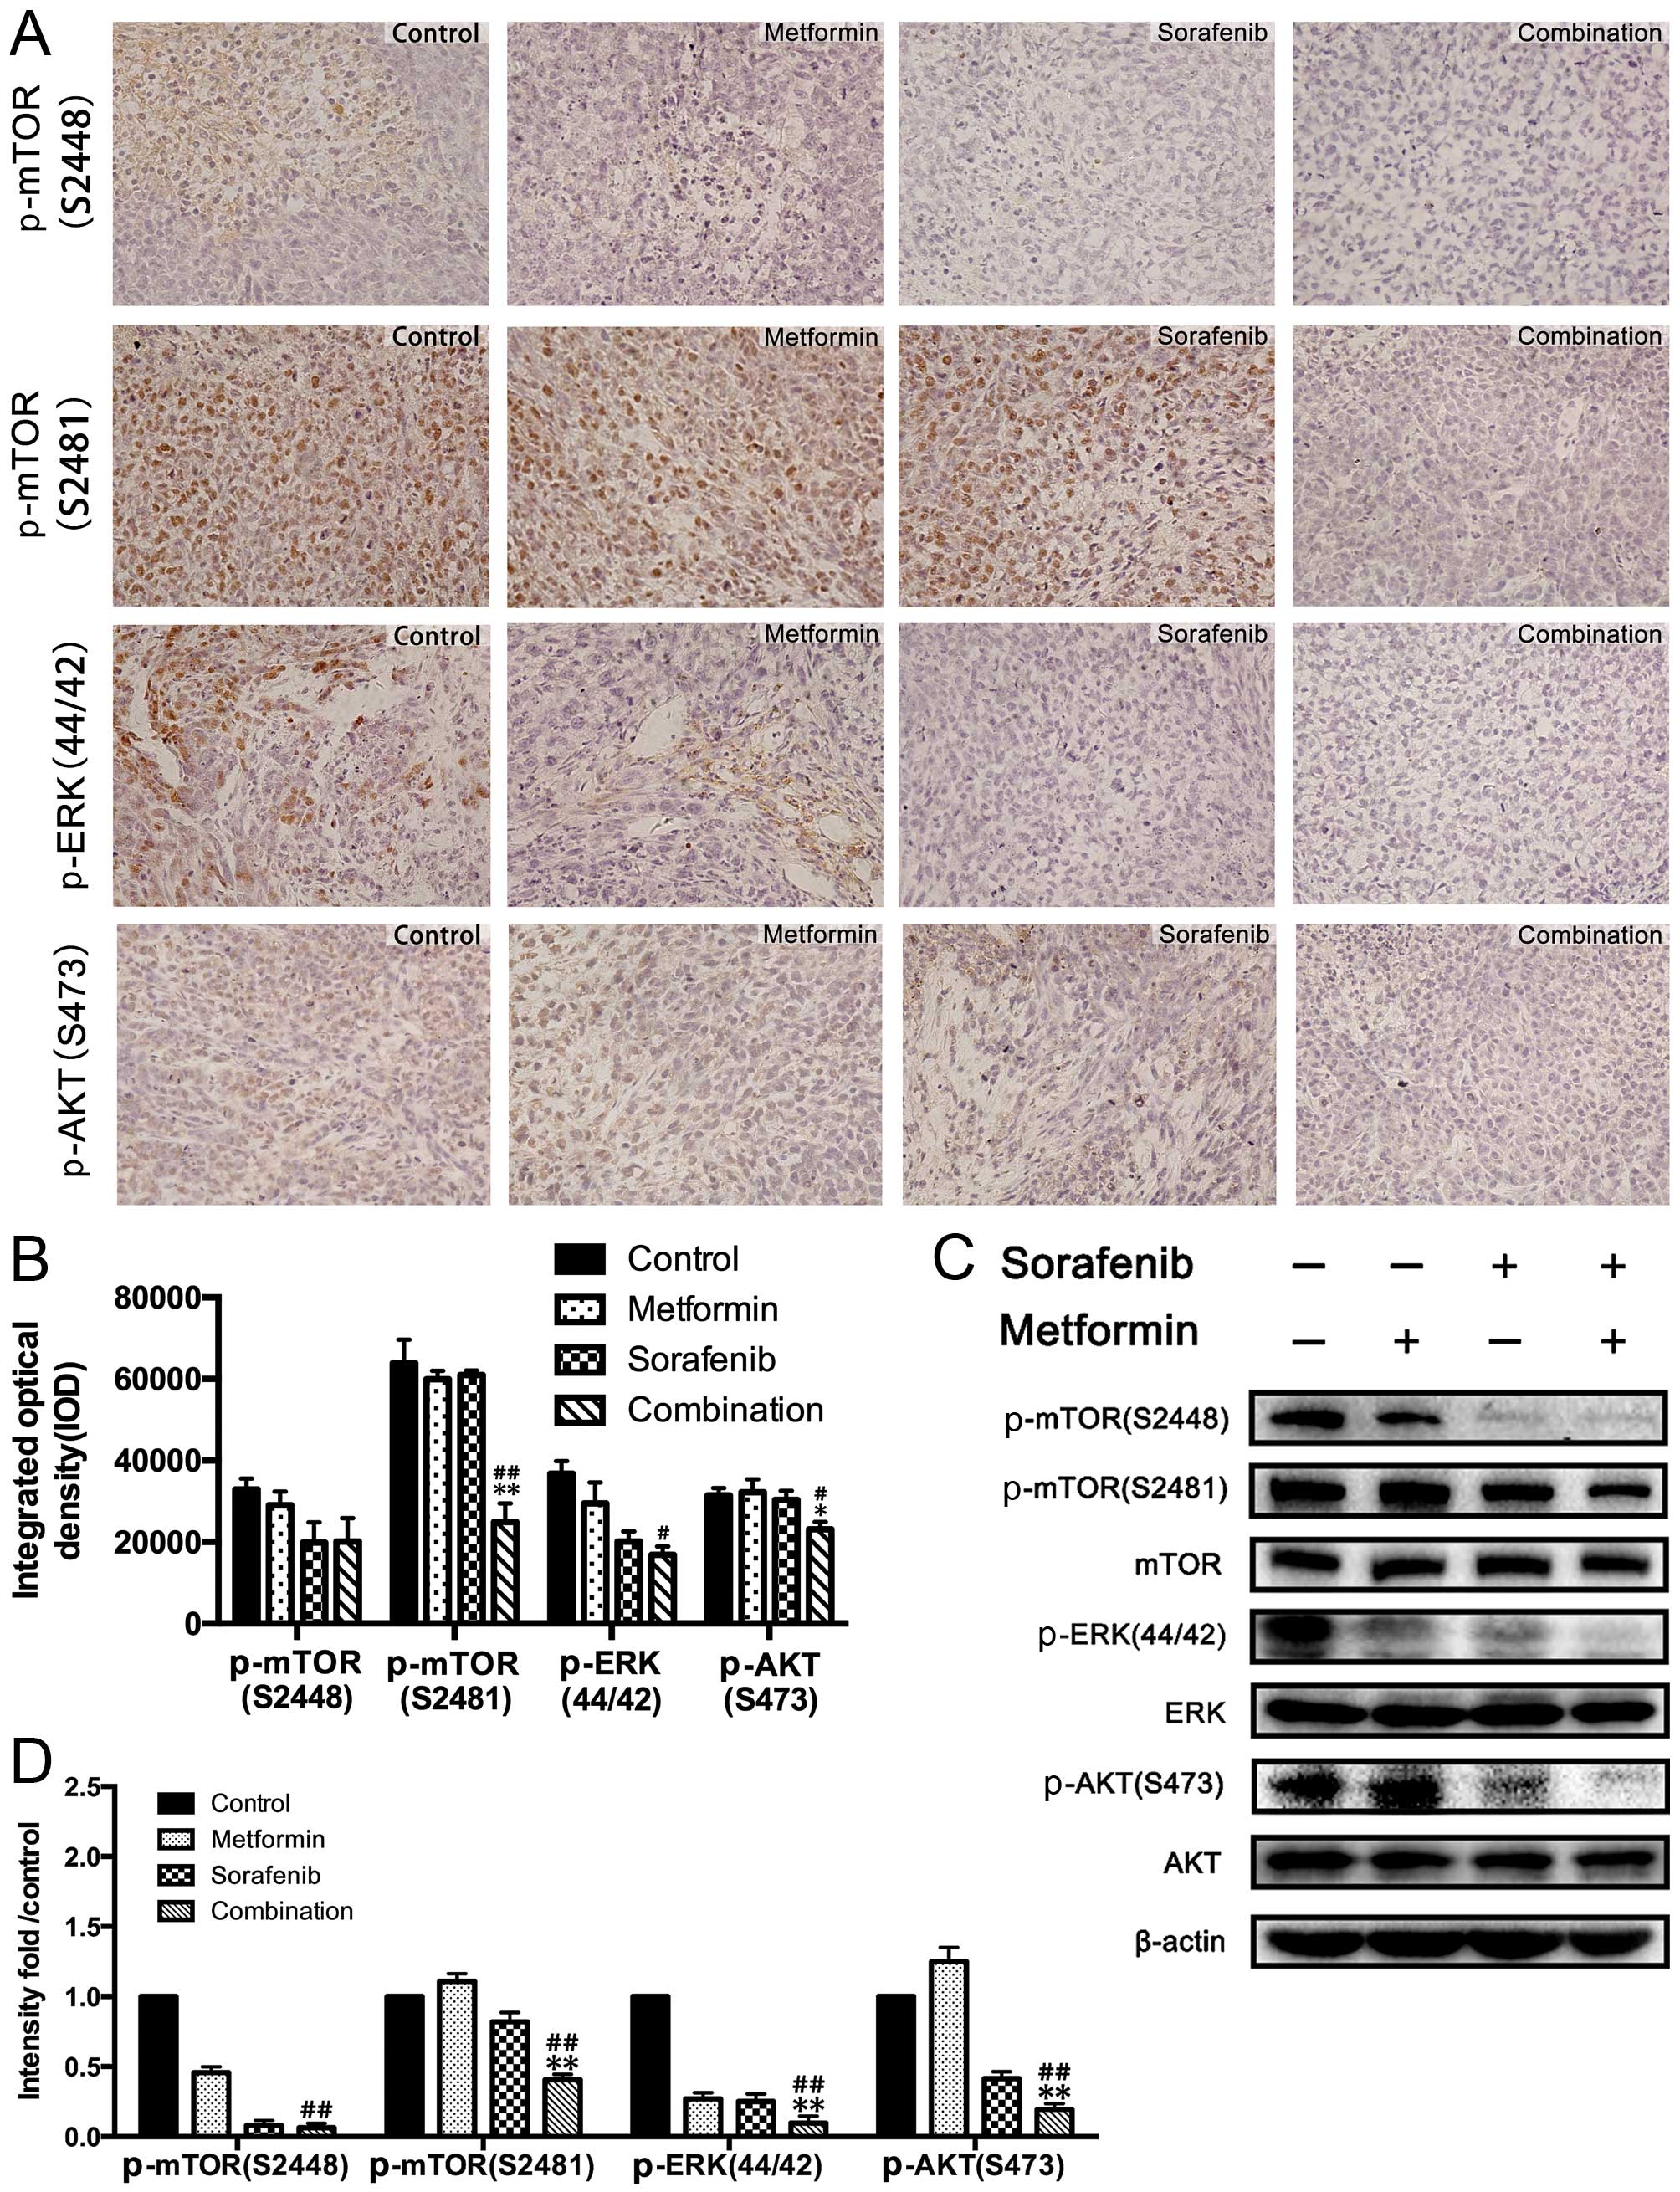
Combined treatment of metformin and
sorafenib suppressed active status for ERK and mTOR pathways in HCC
xenograft tumors
Immunohistochemistry and western blot analysis of
the xenograft tumors revealed that metformin and sorafenib
inhibited the activation of ERK in the in vivo xenograft
model as well (Fig. 6A–C).
Similarly, xenograft tumors were further examined for the status of
p-mTOR (Ser2448 and Ser2481) and p-AKT (Ser473) after treatment
with the control, metformin, sorafenib and their combination
(Fig. 6). Consistent with the
in vitro results, sorafenib significantly reversed the
activation status of mTORC2 and the combined treatment of metformin
and sorafenib synergistically abrogated activity of mTORC1.
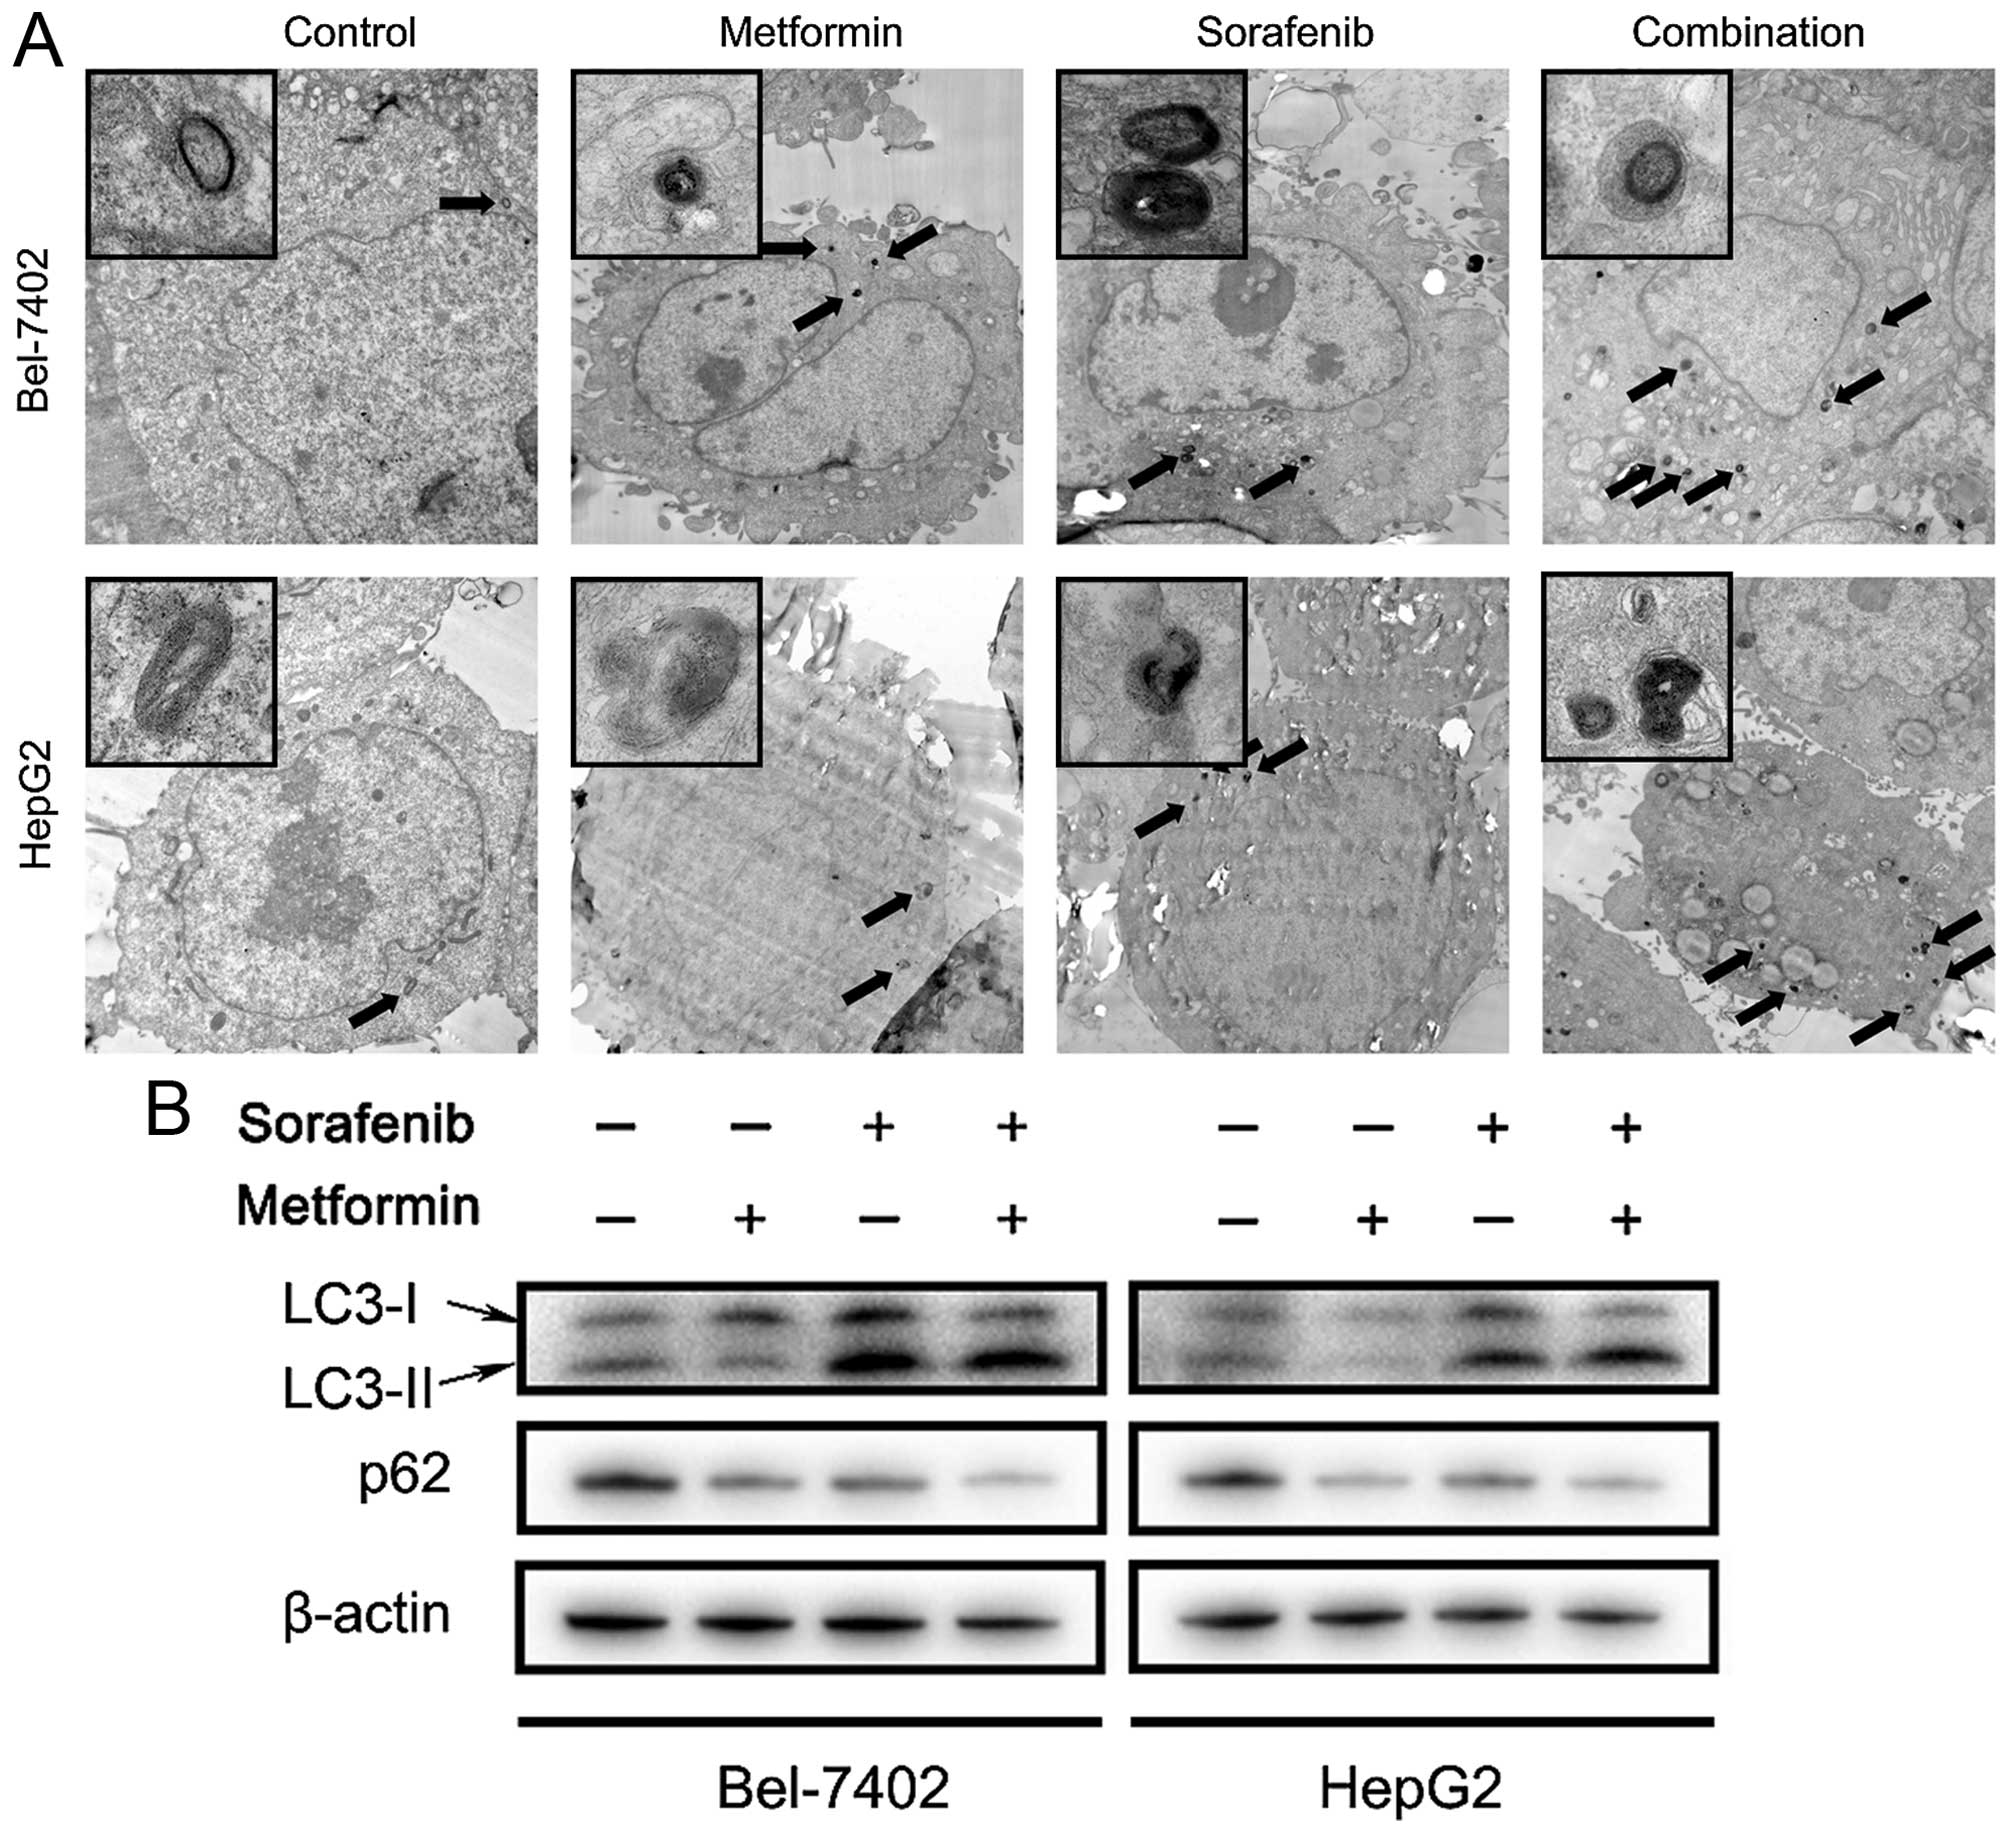
Inhibition of autophagy induced by
metformin and sorafenib combined treatment promotes apoptotic death
in HCC cells
Since combined treatment of metformin and sorafenib
profoundly inhibit the mTOR pathway, which is known to closely
regulate autophagy, the potent influences of both on HCC autophagy
was further determined. Transmission electron microscopy (TEM) and
western blot analysis were used to monitor the autophagic status in
HCC cells and clearly demonstrated that accelerated autophagy
occurs after 48 h treatment with metformin and sorafenib (Fig. 7A and B). The results of TEM
revealed increased autophagic vacuoles in HCC cells treated with
metformin and sorafenib combination compared to single drug or
control. Microtubule-associated protein light chain 3 (LC3) is a
specific marker for autophagy initiation. When autophagy occurred,
the cytoplasmic form of LC3 (LC3-I) converted to the
pre-autophagosomal and autophagosomal membrane-bound form of LC3
(LC3-II) and p62 was degraded (14). However, two autophagy inhibitors CQ
and 3MA could both promote apoptotic death induced by metformin and
sorafenib in HCC cells (Fig.
7C–E). CQ could prevent fusion of endosomes and lysosomes and
inhibit the formation of autophagosomes. Thus, accumulated LC3-II
and p62 could be detected by western blot analysis (Fig. 7B and E) The 3MA is a
phosphoinositide 3-kinase inhibitor that inhibits autophagy before
the formation of autophagosomes. In conclusion, these results
revealed that combined treatment of metformin and sorafenib
triggered autophagy in HCC cells, which may be cytoprotective as
inhibition of autophagy by CQ or 3MA could promote metformin and
sorafenib induced apoptotic cell death. Especially, for the LC3-II
band intensity in Fig. 7E, we
found that when the cells were treated with CQ, LC3-II displayed
strong increase compared to the other groups. The band intensity
would be overtested in group with CQ if the other groups could be
displayed as in Fig. 7B. So, the
bands in the other groups were too weak for accurate
quantification.
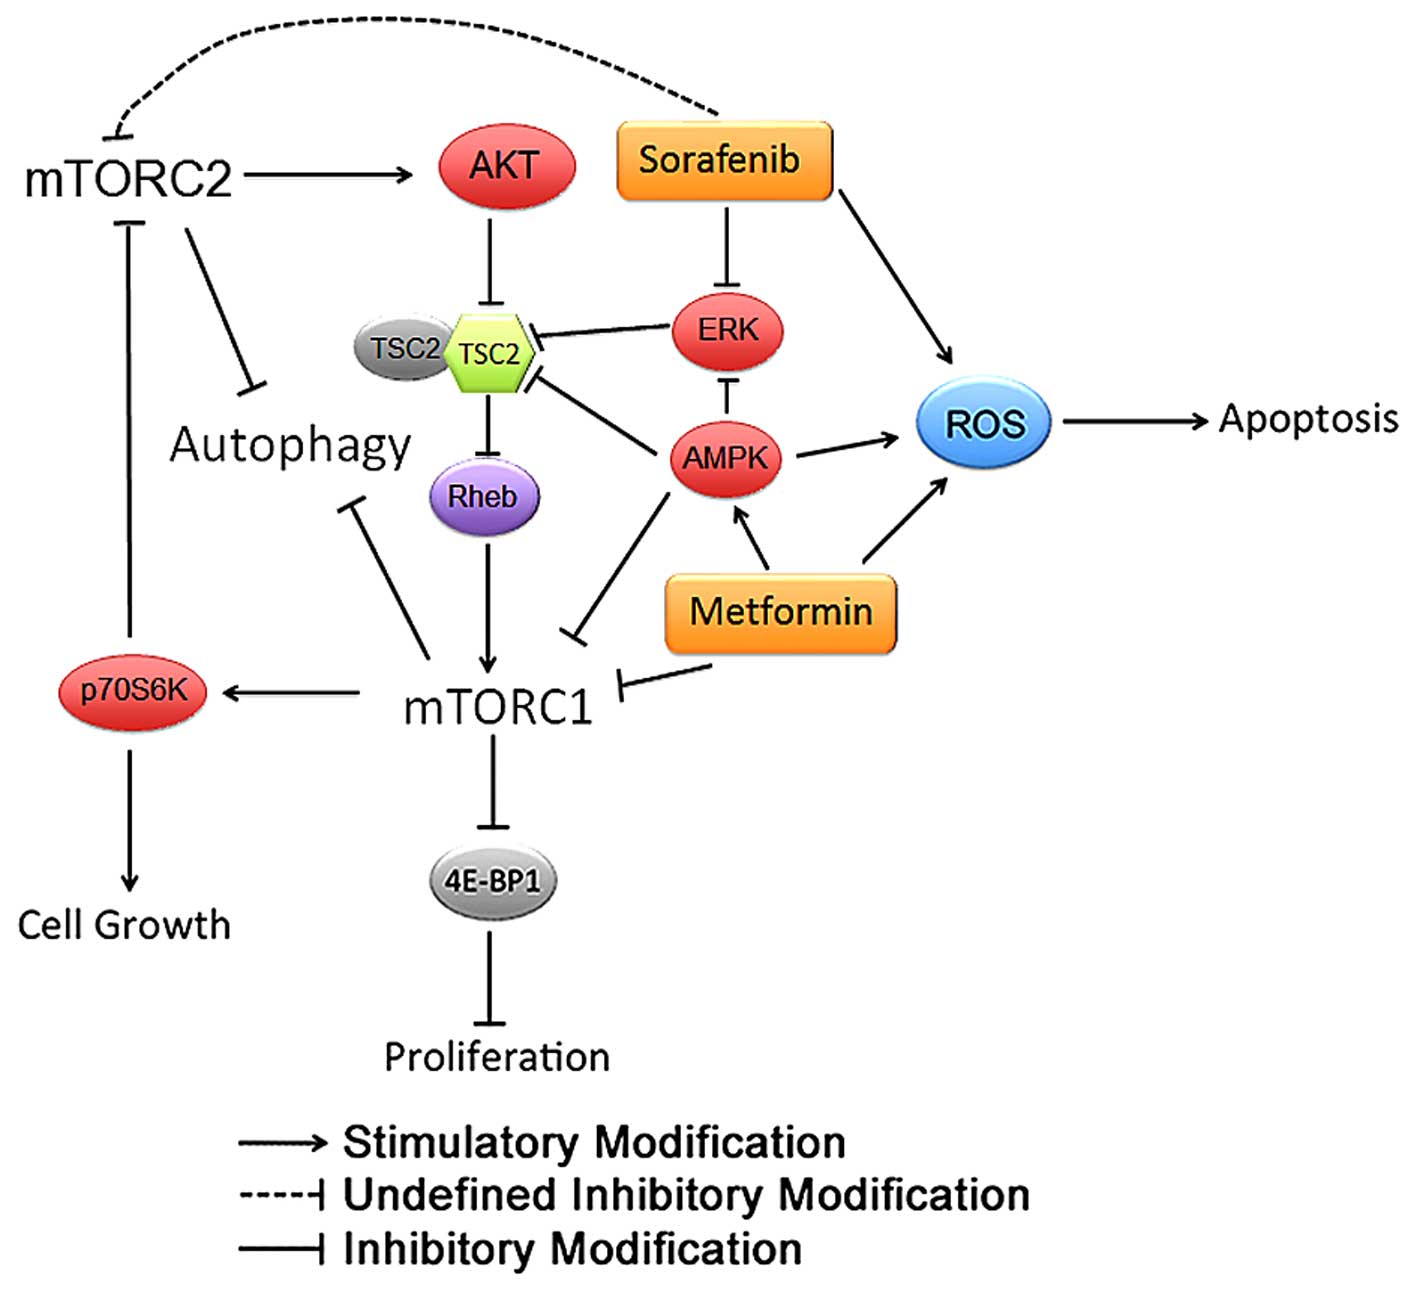
Collectively, we propose a potential molecular
mechanism where metformin and sorafenib inhibit HCC development via
modulating AMPK and the mTOR1/2 pathway (Fig. 8).
Discussion
HCC is a complex tumor type with multiple genetic
aberrations. Many signaling pathways are activated during HCC
initiation and progression. The multi-kinase inhibitor sorafenib is
administered to patients with unresectable/non-abla-table or
advanced-stage HCC. However, sorafenib only improves median overall
survival by ~3 months (4,6). Thus, single-agent therapy is
insufficient for HCC treatment. The multi-targeting-based approach
is of particular significance in HCC treatment. In the present
study, the combination of sorafenib with metformin, a recently
described antitumor agent, was tested for antitumor effects in the
HCC cell lines HepG2 and Bel-7402.
The HCC proliferation data were identical to those
from our previous study in intrahepatic cholangiocarcinoma cells
(11), in which metformin plus
sorafenib effectively inhibited the proliferation of HCC cells
compared to the single-agent treatment as shown by the CCK-8 assay,
cell cycle determination, the colony formation assay and a
xenograft model in nude mice. These results are consistent with
some recent studies (15,16). Moreover, according to the results
of cellular and xenograft apoptosis and activated PARP and
caspase-3, metformin effectively facilitates the proapoptotic
effects of sorafenib on HCC cells through the promotion of reactive
oxygen species (ROS) production induced by sorafenib.
The treatment doses we used in the present study,
were consulted from previous reports (15,16).
Considering the doses used in the clinical setting, a recent study
has reviewed the in vitro and in vivo studies of
anticancer research by metformin and concluded that doses of
metformin used in mice, which showed anticancer effect, was much
less than commonly used in clinical practice (17). For sorafenib, as it is approved by
Food and Drug Administration (FDA) for advanced HCC, the
concentration we used in mice (30 µg/kg/day) was much less
than commonly used in HCC patients (400 mg/day) (http://www.accessdata.fda.gov/drug-satfda_docs/label/2013/021923s016lbl.pdf).
Thus, the doses we used in the present study were comparable and
acceptable in cancer related studies.
Additional signaling analysis suggested that the
underlying molecular mechanism was associated with the MAPK and
mTOR pathways. We discovered that metformin as well as sorafenib
would greatly suppress ERK1/2 activation, and a stronger effect was
observed for the combined treatment. Metformin-mediated HCC growth
arrest is associated with the AMPK and mTORC1 pathways. Indeed, the
activation of AMPK, a well-known metformin effector, suppresses
ERK1/2 activation (18-20) and shuts down cell cycle
progression. We observed that metformin activated AMPK, which would
in turn suppress ERK1/2 activation. The sorafenib-induced reduction
in ERK1/2 phosphorylation could be directly explained by the
universal inhibitory effects of a multi-kinase acting on ERK1/2.
However, it is quite interesting that we also observed sorafenib
having similar effects to metformin in regulating mTORC1 activity,
as well as AMPK activation, indicating that sorafenib may have
other mechanisms of controlling ERK activation. Although the
molecular mechanisms of metformin and sorafenib in controlling HCC
growth are complex or interactive, the combination of both would
further enhance AMPK activation and inhibit the active status of
mTORC1 and ERK1/2, with a more profound HCC growth suppression
effect than any single treatment.
The serine/threonine kinase mTOR forms two
multi-protein complexes, mTOR complex 1 (mTORC1) and mTORC2
(21). mTORC1 consists of proteins
such as the regulatory-associated protein of mTOR (Raptor) and the
mammalian lethal with SEC13 protein 8 (mLST8), and regulates cell
growth and proliferation through modifying its substrates
eIF4E-binding protein 1 (4E-BP1) and p70 ribosomal subunit S6
kinase (p70S6k) (21). p70S6k
phosphorylates rapamycin-insensitive companion of mTOR (Rictor),
the core component of the mTORC2 complex, and negatively regulates
mTORC2 (22). Conversely, mTORC2
regulates mTORC1 by activating AKT as part of a negative feedback
mechanism (22,23). Thus, there is a negative feedback
loop mechanism between mTORC1/mTORC2. The feedback between mTORC1
and mTORC2 and cross-talk between the PI3K/AKT/mTOR pathway and the
Ras/Raf/MAPK pathway may be partly responsible for the resistance
or failure of single-agent administration (24,25).
We asked whether the anti-proliferative properties of a combined
treatment with metformin and sorafenib are dependent on disruption
of the mTORC1 and mTORC2, inhibition of the PI3K/AKT/mTOR pathway
or the Ras/Raf/MAPK pathway. Consistent with a recent study
(26), we found that metformin may
activate mTORC2/AKT through the mTORC1/mTORC2 feedback loop. We
further observed that sorafenib amplifies suppression effect of
metformin on HCC both in vitro and in vivo. Sorafenib
abrogates the activation of mTORC2/AKT induced by metformin while
synergistically inactivating mTORC1 with metformin, which may
partly account for the potential mechanisms. Interestingly, a
single sorafenib treatment inhibits both mTORC1 and mTORC2
signaling, which is contradictory to results in other HCC cell
lines (27) or other malignancies
(28). This contradiction implies
that the effects of sorafenib in cancer may be cell line- and
tissue-specific. It will be valuable to explore the molecular
explanation of the discrepant effects on mTORC2 of sorafenib in our
further studies.
However, a recent clinical study found that the
concomitant use of sorafenib and metformin was associated with a
poorer prognosis compared to sorafenib alone in patients with
advanced HCC (29). In this study,
the authors speculated that chronic treatment of metformin may
impel HCC cells to intrinsic resistance to metformin, and also to
sorafenib. Thus, in the present study, we further evaluated the
autophagic status of HCC cells treated with metformin and
sorafanib, as autophagy always mediates the drug-resistant effect
of tumor cells. The mTOR pathway, a promising regulator for
autophagy (30), may effectively
regulate the potential cell death mechanism and chemotherapy
response (31). Autophagy is able
to either inhibit or promote cancer cell growth in different
cellular contexts (32). Combined
treatment of metformin and sorafenib triggered higher levels of
autophagy compared to single or no drug treatment in HCC cells.
Pharmacological inhibition of autophagy sensitized HCC cells to
metformin and sorefenib-induced apoptotic cell death, which implies
that metformin and sorafenib-mediated autophagy is an
anti-apoptotic death mechanism rather than a cell death mechanism.
Mechanically, the anti-autophagy treatment should be considered in
metformin and sorafenib as well as mTOR inhibitor-based treatments
in HCC cells. Moreover, a recent basic study described that
metformin promoted anti-metastasis effect of sorafenib in HCC
(33), which supported the
combination treatment of metformin and sorafenib in HCC. A phase II
study recruiting patients with advanced HCC for combined treatment
with sorafenib and metformin is proceeding (ClinicalTrials.gov identifier: NCT02672488), which may
help clear the value of metformin and sorafenib combination
treatment in advanced HCC patients.
Some shortages of the present study should be
discussed. Agents with different concentrations may exert different
biological effects, and a combination use of the two agents with
different concentrations needs to be conducted in future studies to
validate the molecular mechanism by treatment of metformin and
sorafenib in HCC. In addition, the function of mTORC2 is less
studied and mTORC2 may play significant role in cell migration and
energy metabolism. How sorafenib inactivates the mTORC2 should be
further explored.
In conclusion, our results proved that the
combination of metformin and sorafenib promotes apoptosis and
inhibits the proliferation of HCC in vitro and in
vivo. Activation of mTORC2 provides an escape mechanism for the
HCC cells from metformin treatment. Sorafenib effectively reverses
the activation status of mTORC2 induced by metformin and further
enhances the suppression of mTORC1 by metformin in HCC in
vitro and in vivo. Metformin and sorafenib cooperate to
promote apoptosis and autophagy in HCC cells. Inhibition of
autophagy profoundly enhances the apoptosis of HCC cells induced by
metformin and sorafenib. The anti-autophagy treatment should be
considered in metformin and sorafenib based treatments in HCC
cells. These results may help to ameliorate the strategies of
metformin- or sorafenib-based chemotherapeutic treatment of
patients with HCC in the clinical setting.
Acknowledgments
This study was supported by grants from the National
Natural Science Foundation of China (no. 81372328) and the Medical
and Health Science and Technology Program of Zhejiang province
(nos. 2015KYB062 and 201352853).
References
|
1
|
Siegel R, Ma J, Zou Z and Jemal A: Cancer
statistics, 2014. CA Cancer J Clin. 64:9–29. 2014. View Article : Google Scholar : PubMed/NCBI
|
|
2
|
Jemal A, Bray F, Center MM, Ferlay J, Ward
E and Forman D: Global cancer statistics. CA Cancer J Clin.
61:69–90. 2011. View Article : Google Scholar : PubMed/NCBI
|
|
3
|
Perz JF, Armstrong GL, Farrington LA,
Hutin YJ and Bell BP: The contributions of hepatitis B virus and
hepatitis C virus infections to cirrhosis and primary liver cancer
worldwide. J Hepatol. 45:529–538. 2006. View Article : Google Scholar : PubMed/NCBI
|
|
4
|
Llovet JM, Ricci S, Mazzaferro V, Hilgard
P, Gane E, Blanc JF, de Oliveira AC, Santoro A, Raoul JL, Forner A,
et al SHARP Investigators Study Group: Sorafenib in advanced
hepatocellular carcinoma. N Engl J Med. 359:378–390. 2008.
View Article : Google Scholar : PubMed/NCBI
|
|
5
|
Wilhelm SM, Adnane L, Newell P, Villanueva
A, Llovet JM and Lynch M: Preclinical overview of sorafenib, a
multikinase inhibitor that targets both Raf and VEGF and PDGF
receptor tyrosine kinase signaling. Mol Cancer Ther. 7:3129–3140.
2008. View Article : Google Scholar : PubMed/NCBI
|
|
6
|
Cheng AL, Kang YK, Chen Z, Tsao CJ, Qin S,
Kim JS, Luo R, Feng J, Ye S, Yang TS, et al: Efficacy and safety of
sorafenib in patients in the Asia-Pacific region with advanced
hepatocellular carcinoma: A phase III randomised, double-blind,
placebo-controlled trial. Lancet Oncol. 10:25–34. 2009. View Article : Google Scholar
|
|
7
|
Lee MS, Hsu CC, Wahlqvist ML, Tsai HN,
Chang YH and Huang YC: Type 2 diabetes increases and metformin
reduces total, colorectal, liver and pancreatic cancer incidences
in Taiwanese: A representative population prospective cohort study
of 800,000 individuals. BMC Cancer. 11:202011. View Article : Google Scholar : PubMed/NCBI
|
|
8
|
Chaiteerakij R, Yang JD, Harmsen WS,
Slettedahl SW, Mettler TA, Fredericksen ZS, Kim WR, Gores GJ,
Roberts RO, Olson JE, et al: Risk factors for intrahepatic
cholangiocarcinoma: Association between metformin use and reduced
cancer risk. Hepatology. 57:648–655. 2013. View Article : Google Scholar :
|
|
9
|
Jalving M, Gietema JA, Lefrandt JD, de
Jong S, Reyners AK, Gans RO and de Vries EG: Metformin: Taking away
the candy for cancer? Eur J Cancer. 46:2369–2380. 2010. View Article : Google Scholar : PubMed/NCBI
|
|
10
|
Donadon V, Balbi M, Mas MD, Casarin P and
Zanette G: Metformin and reduced risk of hepatocellular carcinoma
in diabetic patients with chronic liver disease. Liver Int.
30:750–758. 2010. View Article : Google Scholar : PubMed/NCBI
|
|
11
|
Ling S, Feng T, Ke Q, Fan N, Li L, Li Z,
Dong C, Wang C, Xu F, Li Y, et al: Metformin inhibits proliferation
and enhances chemosensitivity of intrahepatic cholangiocarcinoma
cell lines. Oncol Rep. 31:2611–2618. 2014.PubMed/NCBI
|
|
12
|
Ling S, Tian Y, Zhang H, Jia K, Feng T,
Sun D, Gao Z, Xu F, Hou Z, Li Y, et al: Metformin reverses
multidrug resistance in human hepatocellular carcinoma Bel 7402/5
fluorouracil cells. Mol Med Rep. 10:2891–2897. 2014.PubMed/NCBI
|
|
13
|
Chiou JF, Tai CJ, Wang YH, Liu TZ, Jen YM
and Shiau CY: Sorafenib induces preferential apoptotic killing of a
drug- and radio-resistant Hep G2 cells through a
mitochondria-dependent oxidative stress mechanism. Cancer Biol
Ther. 8:1904–1913. 2009. View Article : Google Scholar : PubMed/NCBI
|
|
14
|
Klionsky DJ, Abdelmohsen K, Abe A, Abedin
MJ, Abeliovich H, Acevedo Arozena A, Adachi H, Adams CM, Adams PD,
Adeli K, et al: Guidelines for the use and interpretation of assays
for monitoring autophagy (3rd edition). Autophagy. 12:1–222. 2016.
View Article : Google Scholar : PubMed/NCBI
|
|
15
|
Saito T, Chiba T, Yuki K, Zen Y, Oshima M,
Koide S, Motoyama T, Ogasawara S, Suzuki E, Ooka Y, et al:
Metformin, a diabetes drug, eliminates tumor-initiating
hepatocellular carcinoma cells. PLoS One. 8:e700102013. View Article : Google Scholar : PubMed/NCBI
|
|
16
|
Guo Z, Cao M, You A, Gao J, Zhou H, Li H,
Cui Y, Fang F, Zhang W, Song T, et al: Metformin inhibits the
pro-metastatic effect of Sorafenib in hepatocellular carcinoma by
upregulating the expression of TIP30. Cancer Sci. 107:507–513.
2016. View Article : Google Scholar : PubMed/NCBI
|
|
17
|
Anisimov VN: Metformin for cancer and
aging prevention: Is it a time to make the long story short?
Oncotarget. 6:39398–39407. 2015.PubMed/NCBI
|
|
18
|
Kim JG, Lee SJ, Chae YS, Kang BW, Lee YJ,
Oh SY, Kim MC, Kim KH and Kim SJ: Association between
phosphorylated AMP-activated protein kinase and MAPK3/1 expression
and prognosis for patients with gastric cancer. Oncology. 85:78–85.
2013. View Article : Google Scholar : PubMed/NCBI
|
|
19
|
Martin M and Marais R: Braking BRAF: AMPK
leaves ERK stranded in the desert. Mol Cell. 52:155–156. 2013.
View Article : Google Scholar : PubMed/NCBI
|
|
20
|
Baba Y, Nosho K, Shima K, Meyerhardt JA,
Chan AT, Engelman JA, Cantley LC, Loda M, Giovannucci E, Fuchs CS,
et al: Prognostic significance of AMP-activated protein kinase
expression and modifying effect of MAPK3/1 in colorectal cancer. Br
J Cancer. 103:1025–1033. 2010. View Article : Google Scholar : PubMed/NCBI
|
|
21
|
Bhat M, Sonenberg N and Gores GJ: The mTOR
pathway in hepatic malignancies. Hepatology. 58:810–818. 2013.
View Article : Google Scholar : PubMed/NCBI
|
|
22
|
Dibble CC, Asara JM and Manning BD:
Characterization of Rictor phosphorylation sites reveals direct
regulation of mTOR complex 2 by S6K1. Mol Cell Biol. 29:5657–5670.
2009. View Article : Google Scholar : PubMed/NCBI
|
|
23
|
Liu P, Gan W, Inuzuka H, Lazorchak AS, Gao
D, Arojo O, Liu D, Wan L, Zhai B, Yu Y, et al: Sin1 phosphorylation
impairs mTORC2 complex integrity and inhibits downstream Akt
signalling to suppress tumorigenesis. Nat Cell Biol. 15:1340–1350.
2013. View Article : Google Scholar : PubMed/NCBI
|
|
24
|
Li QL, Gu FM, Wang Z, Jiang JH, Yao LQ,
Tan CJ, Huang XY, Ke AW, Dai Z, Fan J, et al: Activation of
PI3K/AKT and MAPK pathway through a PDGFRβ-dependent feedback loop
is involved in rapamycin resistance in hepatocellular carcinoma.
PLoS One. 7:e333792012. View Article : Google Scholar
|
|
25
|
Wang C, Cigliano A, Delogu S, Armbruster
J, Dombrowski F, Evert M, Chen X and Calvisi DF: Functional
crosstalk between AKT/mTOR and Ras/MAPK pathways in
hepatocarcinogenesis: Implications for the treatment of human liver
cancer. Cell Cycle. 12:1999–2010. 2013. View Article : Google Scholar : PubMed/NCBI
|
|
26
|
Yang H, Peng YF, Ni HM, Li Y, Shi YH, Ding
WX and Fan J: Basal autophagy and feedback activation of Akt are
associated with resistance to metformin-induced inhibition of
hepatic tumor cell growth. PLoS One. 10:e01309532015. View Article : Google Scholar : PubMed/NCBI
|
|
27
|
Gedaly R, Angulo P, Hundley J, Daily MF,
Chen C, Koch A and Evers BM: PI-103 and sorafenib inhibit
hepatocellular carcinoma cell proliferation by blocking
Ras/Raf/MAPK and PI3K/AKT/mTOR pathways. Anticancer Res.
30:4951–4958. 2010.PubMed/NCBI
|
|
28
|
Pignochino Y, Dell'Aglio C, Basiricò M,
Capozzi F, Soster M, Marchiò S, Bruno S, Gammaitoni L, Sangiolo D,
Torchiaro E, et al: The combination of sorafenib and everolimus
abrogates mTORC1 and mTORC2 upregulation in osteosarcoma
preclinical models. Clin Cancer Res. 19:2117–2131. 2013. View Article : Google Scholar : PubMed/NCBI
|
|
29
|
Casadei Gardini A, Marisi G, Scarpi E,
Scartozzi M, Faloppi L, Silvestris N, Masi G, Vivaldi C, Brunetti
O, Tamberi S, et al: Effects of metformin on clinical outcome in
diabetic patients with advanced HCC receiving sorafenib. Expert
Opin Pharmacother. 16:2719–2725. 2015. View Article : Google Scholar : PubMed/NCBI
|
|
30
|
Nicoletti F, Fagone P, Meroni P, McCubrey
J and Bendtzen K: mTOR as a multifunctional therapeutic target in
HIV infection. Drug Discov Today. 16:715–721. 2011. View Article : Google Scholar : PubMed/NCBI
|
|
31
|
Jung CH, Ro SH, Cao J, Otto NM and Kim DH:
mTOR regulation of autophagy. FEBS Lett. 584:1287–1295. 2010.
View Article : Google Scholar : PubMed/NCBI
|
|
32
|
Sun K, Guo XL, Zhao QD, Jing YY, Kou XR,
Xie XQ, Zhou Y, Cai N, Gao L, Zhao X, et al: Paradoxical role of
autophagy in the dysplastic and tumor-forming stages of
hepatocarcinoma development in rats. Cell Death Dis. 4:e5012013.
View Article : Google Scholar : PubMed/NCBI
|
|
33
|
You A, Cao M, Guo Z, Zuo B, Gao J, Zhou H,
Li H, Cui Y, Fang F, Zhang W, et al: Metformin sensitizes sorafenib
to inhibit postoperative recurrence and metastasis of
hepatocellular carcinoma in orthotopic mouse models. J Hematol
Oncol. 9:202016. View Article : Google Scholar : PubMed/NCBI
|