Introduction
Although it is a rare bone tumor, the genetic
alterations of osteosarcoma (OS) have been studied extensively
(1–5). Nevertheless, the molecular cause of
OS still remains elusive. This occurs in part because the tumor is
relatively rare and it is composed of a heterogeneous population of
tumor cells with complex chromosomal changes (1,2). OS
is usually found in the metaphyseal region of the long bones
especially during the growth spurt in the second decade of
childhood (1,2). A second peak incidence of OS occurs
in those who are 50 years and older (2). However, the molecular defects may be
different in adults compared to children.
OS cells are generally undifferentiated (>80%)
and osteoblastic (50–80%), suggesting that some of the initial
genetic changes occur at the early stages of osteoblastogenesis
(1,2). In addition, many cells show a high
degree of chromosomal instability (CIN) including aneuploidy
ranging from haploidy to near-hexaploidy, as well as ring
chromosomes, and genomic amplification as seen by homozygously
staining regions (hsr), and double minutes (dmin) (1).
For better description of CIN in OS, comparative
genomic hybridization (CGH) has been widely used to date (1,6–13),
which confirmed the recurrent amplifications and deletions found by
conventional karyotyping such as amplification at 1q21-q22,
11p14-p15, 14p11-p13, 15p11-p13, and loss of chromosome 9, 10, 13
and 17. One limitation of the technique is that it is not able to
detect allele-specific chromosomal events like copy-neutral loss of
heterozygosity (CN-LOH) or uniparental disomy (UPD). Acquired UPD
are important chromosomal changes known to be strongly related to
cancer development (14). Allelic
homozygosity by LOH can lead to the selection of either
inactivating mutations of tumor suppressor genes (TSG) and/or
dominant negative mutations of oncogenes (14). In this study, we analyzed OS by SNP
array and successfully identified many hidden regions of UPD. Our
study provides valuable information that can lead to the better
understanding of the molecular mechanism of OS. Importantly, our
analysis led to the identification of two novel tumor suppressive
lncRNAs in this malignancy.
Materials and methods
Osteosarcoma samples and extraction of
genomic DNA
Fifty-eight human OS samples were obtained from
several sources: genomic DNA and total RNA from 40 primary OS
tumors and from matched normal tissues were obtained from Dr Marc
Hansen, and consent forms for molecular analyses were obtained.
Genomic DNA from 11 OS explants were from Dr Carl Miller, and 7 OS
cell lines (U2OS, G292, MG63, HT161, HOS, SAOS2, and SJSA). The
human osteoblastic cell line hFOB1.19 was used as a normal control.
All OS cell lines were maintained in DMEM medium (Mediatech Inc.,
Herndon, VA, USA) supplemented with 10% fetal bovine serum (Atlanta
Biological, Lawrenceville, GA, USA). hFOB1.19 was maintained in
DMEM/F12 medium without phenol red (Invitrogen, Carlsbad, CA, USA)
supplemented with 10% FBS (Atlanta Biological) and cultured at
33°C. All the cell lines were authenticated in April 2016, by short
tandem repeat analysis with the Geneprint 10 System kit (Promega,
Madison, WI, USA). Genomic DNA was isolated with DNeasy genomic DNA
purification kit (Qiagen, Valencia, CA, USA) according to the
manufacturer's protocol. Quality of DNA was assessed by
biophotometer (Eppendorf, Hambrug, Germany) and by gel
electrophoresis prior to use.
SNP array analysis
Genomic DNA from 58 human OS samples were analyzed
by GeneChip Human mapping single nucleotide polymorphism (SNP)
arrays (Affymetrix, Santa Clara, CA, USA) as described before
(15,16). 250K NspI SNP arrays were
used for analysis, except for 11 explants which were analyzed by
50K XbaI SNP array. Briefly, 50 ng of genomic DNA purified
from each sample was digested with either NspI for 250K
array or with XbaI for 50K SNP array. Digested DNAs were
ligated with adaptor and PCR amplified with LA Taq (Takara,
Otsu, Shiga, Japan). Following amplification, DNA fragments were
end-labeled with probes designed to differentiate SNP alleles and
hybridized to SNP arrays. GeneChip Fluidics Station 400 and
GeneChip scanner 3000 were used to produce raw data, which were
then processed and analyzed by CN analyzer for Affymetrix GeneChip
(CNAG 2.0) using allele-specific copy number analysis using
anonymous reference (AsCNAR) algorithm (14). All allele-specific CN changes were
automatically summarized by CNAG 2.0 using hidden-Markov model
(HMM). Physical locations of chromosomal changes in the output file
were based on UCSC genome browser. UPD from primary tumors with
normal cell contamination were manually integrated. Copy number
variants (CNV) were removed using genomic variants track in UCSC
genome browser.
Validation of UPD and CN changes detected
by SNP chip analysis in OS samples
Our SNP chip results were validated using genomic
quantitative real-time PCR (q-PCR) and direct sequencing.
Uniparental disomy (UPD) or copy-neutral loss of heterozygosity
(CN-LOH) represents the loss of one allele and the duplication of
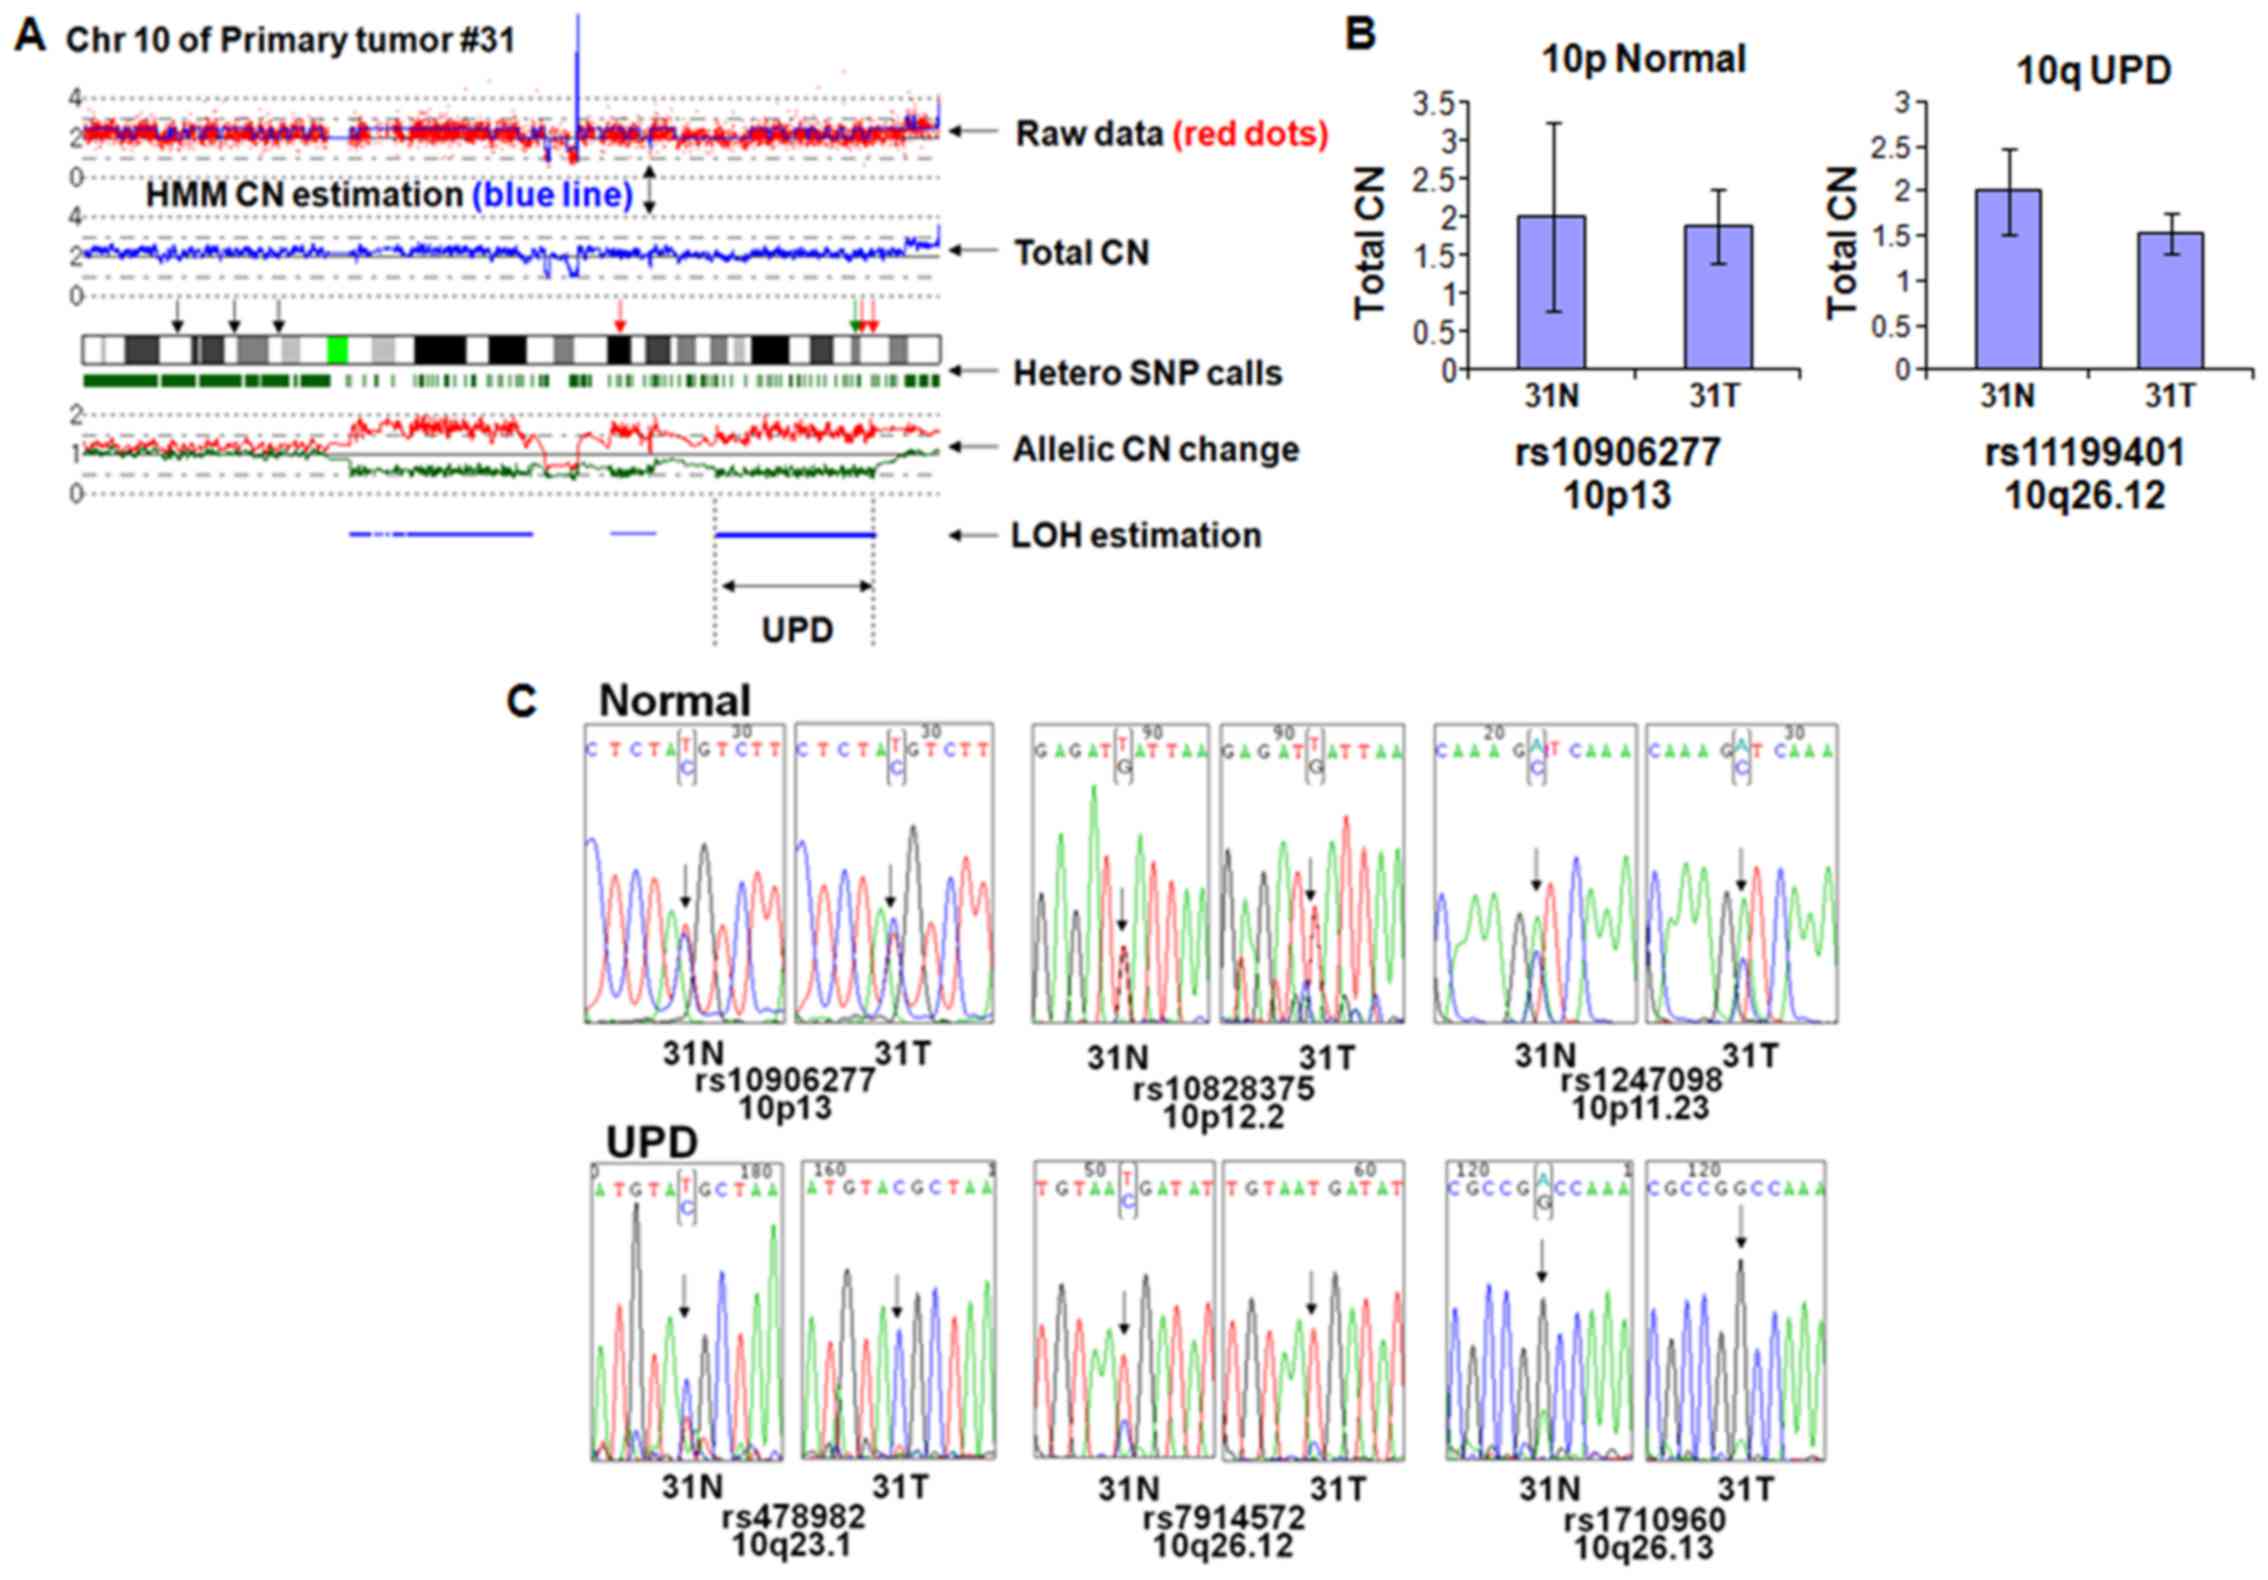
the other. Therefore, a region of UPD should retain normal CN and
have homozygosity at all SNP sites. As shown in Fig. 1A, chromosome 10 of primary tumor
#31 has normal CN in p-arm (10p) and UPD in q-arm (10q). To
minimize the effect of nucleotide composition on the genomic q-PCR
results, we chose rs10906277 and rs11199401 retaining same
nucleotide composition in both normal and tumor sample (data not
shown). Genomic q-PCR revealed that the CN of 10p and 10q regions
are almost the same between the tumor and matched normal,
suggesting that UPD region at 10q has normal CN (Fig. 1B).
Next, we checked if the UPD region showed loss of
heterozygosity by nucleotide sequencing. Three independent SNP
sites within the normal CN region in 10p (rs10906277, rs10828375,
and rs1247098) displayed heterozygosity (Fig. 1C, upper panels) in both the tumor
and matched normal sample. In contrast, 3 independent SNP sites of
the UPD region in 10q (rs478982, rs7914572 and rs1710960) showed
homozygosity (Fig. 1C, lower
panels) in the tumor sample but heterozygosity in the matched
normal sample, suggesting that the UPD region had LOH in the tumor
sample. Unequal ratio of the nucleotide signals in the UPD region
probably results from normal cell contamination.
For other chromosomal changes, we further extended
CN validation by genomic q-PCR. As shown in Fig. 2A, explant #2, #7, #10 and #12 had a
shared homozygous deletion of the CNTNAP2 gene at 7q35.
Genomic q-PCR analysis revealed that CN of the CNTNAP2 gene
of each of these explants were significantly lower than normal
genomic DNA sample (p<0.01) (Fig.
2B). In contrast, five OS cell lines including SAOS2, MG63,
G292 and H161 had amplification (total CN>4) and U2OS had
duplication of the EXT1 gene on 8q24.11 (Fig. 2C). Genomic q-PCR of these samples
showed that CN of the EXT1 gene was 26-fold (SAOS2), 15-fold
(MG63), 12-fold (G292), 21-fold (HT161), and 2-fold (U2OS) higher
than normal genomic DNA sample (Fig.
2D; p<0.01 and p<0.05). These results validated that the
chromosomal changes found by SNP chip are accurate and
reliable.
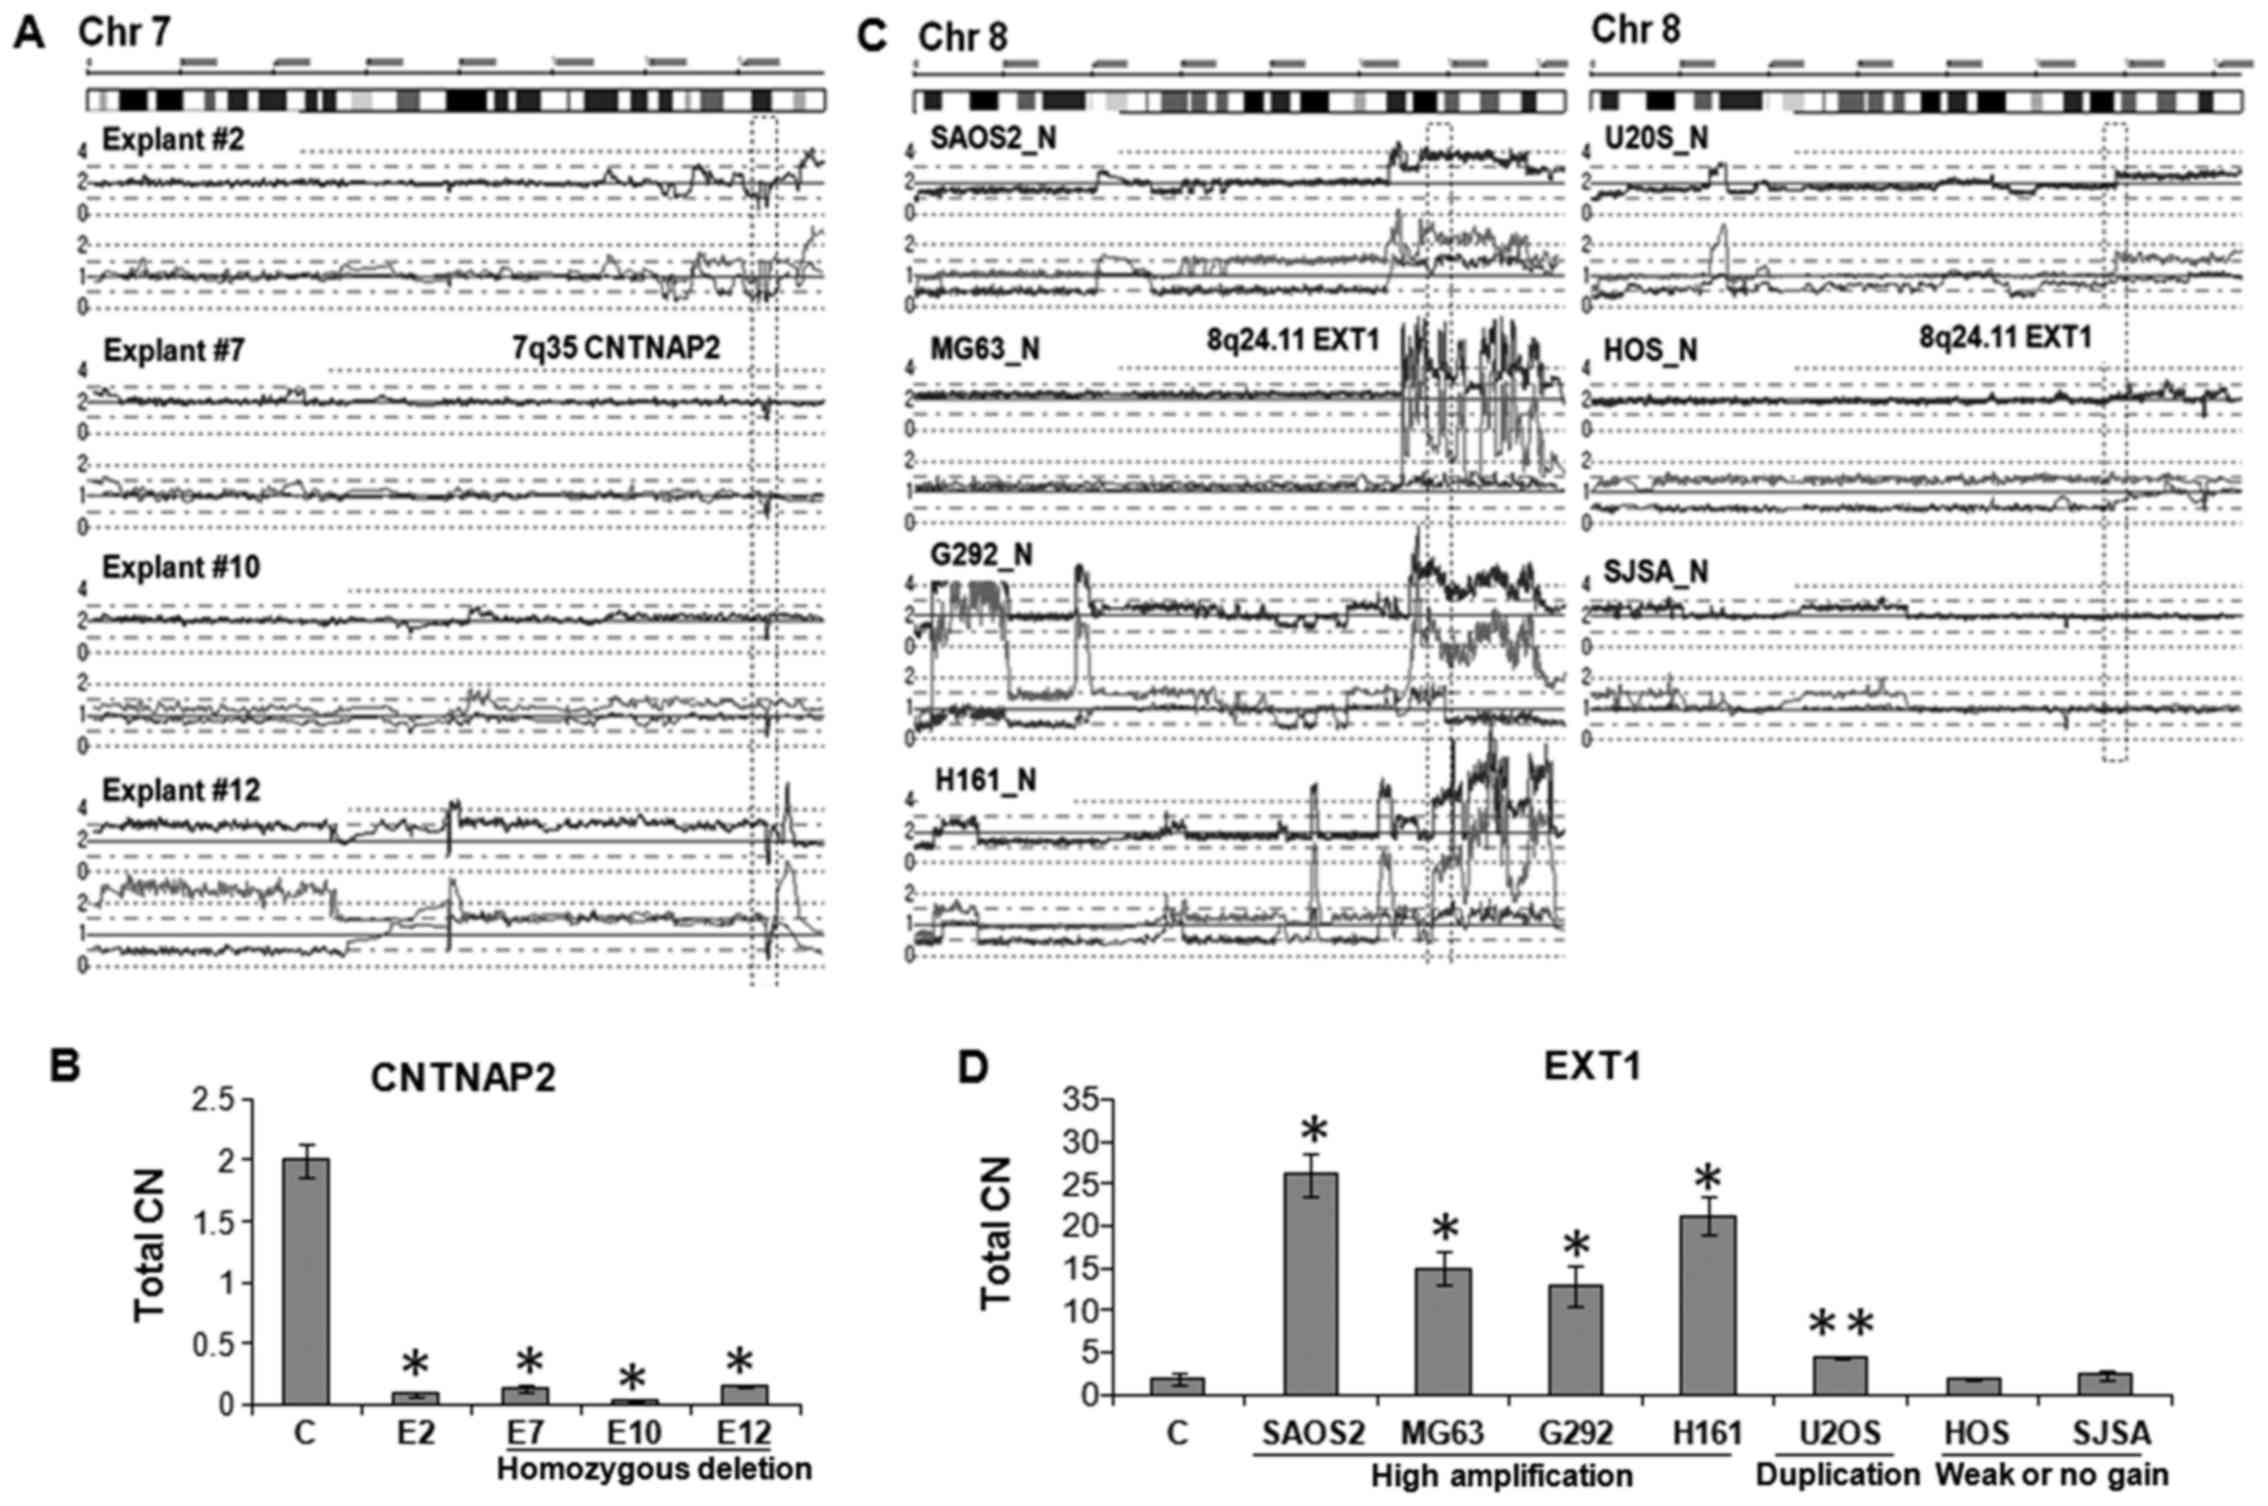 | Figure 2Validation of total CN changes. (A)
SNP array results of explant #2, #7, #10 and #12. Each has a
homozygous deletion (HD) of the internal region of CNTNAP2 gene at
7q35. (B) Total CN of the 7q35 HD region in explants #2, #7, #18
and #12 were ~10-fold lower than normal genomic DNA sample
(**p<0.01). C indicates normal genomic DNA control. Primer pair
specific for the HD region was used for quantitation. (C) SNP array
results of 7 OS cell lines on chromosome 8. OS cell lines, SAOS2,
MG63, G292 and HT161 showed high amplification; U2OS and HOS had
either duplication or weak allelic gain, respectively; and SJSA
showed normal CN at 8q23.3-q24 region. (D) Total CN of the 8q24.11
region was 26-fold (SAOS2), 15-fold (MG63), 12-fold (G292) and
21-fold (HT161) higher than that of normal genomic DNA
(**p<0.01). U2OS showed 2-fold increase (*p<0.05). HOS and
SJSA cells have almost same levels compared to normal genomic DNA.
Primer pair specific for EXT1 in 8q24.11 was used for
quantitation. |
Plasmids and transfection
The expression plasmid of LOC285194
(pCDH-LOC285194) was kindly provided by Dr Yin-Yuan Mo (University
of Mississippi Medical Center) (17). Recombinant lentiviral vectors and
packaging vectors were co-transfected into 293T cells using PEI
transfection reagent and supernatants containing lentivirus were
harvested 48 h after transfection as described before (18). HOS and SJSA cells were infected
with the lentiviruses and supplemented with 8 mg/ml Polybrene
(Sigma-Aldrich, St. Louis, MO, USA) and stable transfectants were
selected with 1 µg/ml puromycin. For BC040586, the
entire sequence was cloned and inserted into pCDNA3.1 vector. The
expression plasmid or the empty vector was transfected into HOS and
SJSA cells using BioT reagent (Bioland Scientific LLC, Paramount,
CA, USA) and stable transfectants were selected with G418 (400
ng/ml).
Cell growth analysis in vitro
Cell growth was determined by MTT (3-(4,
5-dimethylthiazol-2-yl)-2, 5-diphenyl tetrazolium bromide) assay
and cell colony formation assay. In MTT assay, cells were seeded
onto 96-well plates (2,000 cells per well) and cell viability was
assessed using MTT staining method at indicated time-points. Colony
formation assay was performed by plating cells onto 6-well plates
(500 cells per well). After 2 weeks, cells were fixed with methanol
and stained with crystal violet. The number of colonies was counted
and data are presented as mean ± SD from 3 independent experiments
in triplicate wells.
Borden chamber cell migration assay
Cells (1×10⁵) were seeded onto the top
chamber of a 24-well membrane with 8-µm pores (Thermo Fisher
Scientific, Waltham, MA, USA), and the bottom chamber was filled
with medium containing 10% fetal calf serum. The membranes were
fixed and stained with crystal violet 24 h after seeding, and
migrated cells were quantified by microscopically counting 5 random
fields at a magnification of ×200. Mean values were calculated from
data obtained from three separate chambers.
Wound-healing assay
In wound-healing assays, cells were plated and grown
to confluence for 24 h, then cells were starved in serum-free
medium for 12 h, and a scratch was made across the monolayer using
a sterile pipette tip. Wound closure result was imaged at 0 and 24
h with a microscope (×200).
Tumorigenesis experiment in nude
mice
In vivo tumorigenesis assay was performed as
described previously (19). In
brief, ten 6-week-old female nude mice were subcutaneously injected
with 2×10⁶ HOS cells (overexpression of indicated
lncRNA) on their dorsal flanks, with each mouse carrying four
explants. Tumor growth was monitored and tumor size was measured
every 3 days. Tumor volume was calculated using the formula, volume
= 1/2 (length × width2). After 20 days, the mice were
sacrificed and the tumors were removed and weighed. All animal
studies were conducted in accordance with NIH animal use guidelines
and were approved by the Institutional Animal Care and Use
Committee (IACUC) at Cedars-Sinai Medical Center.
Statistical analysis
Two-tailed Student's t-test was used to analyze the
potential statistical difference between two groups. Statistical
significance was set at p<0.05.
Results
Recurrent UPD regions in OS
Among thousands of recognizable chromosomal changes
in 59 OS samples, we found 950 LOH regions including 355 sites of
UPD (data available upon request). All samples had LOH. To our
surprise, 37% of LOH were in the form of UPD, highlighting its
prevalence in OS. Interestingly, a total of 98 LOH events spanned
the whole chromosome, among which, 53 LOH were monosomy and 45 LOH
were whole-chromosomal UPD. Monosomy occurred most frequently at
chromosomes 13 and 16 (7 cases each), no monosomy was identified at
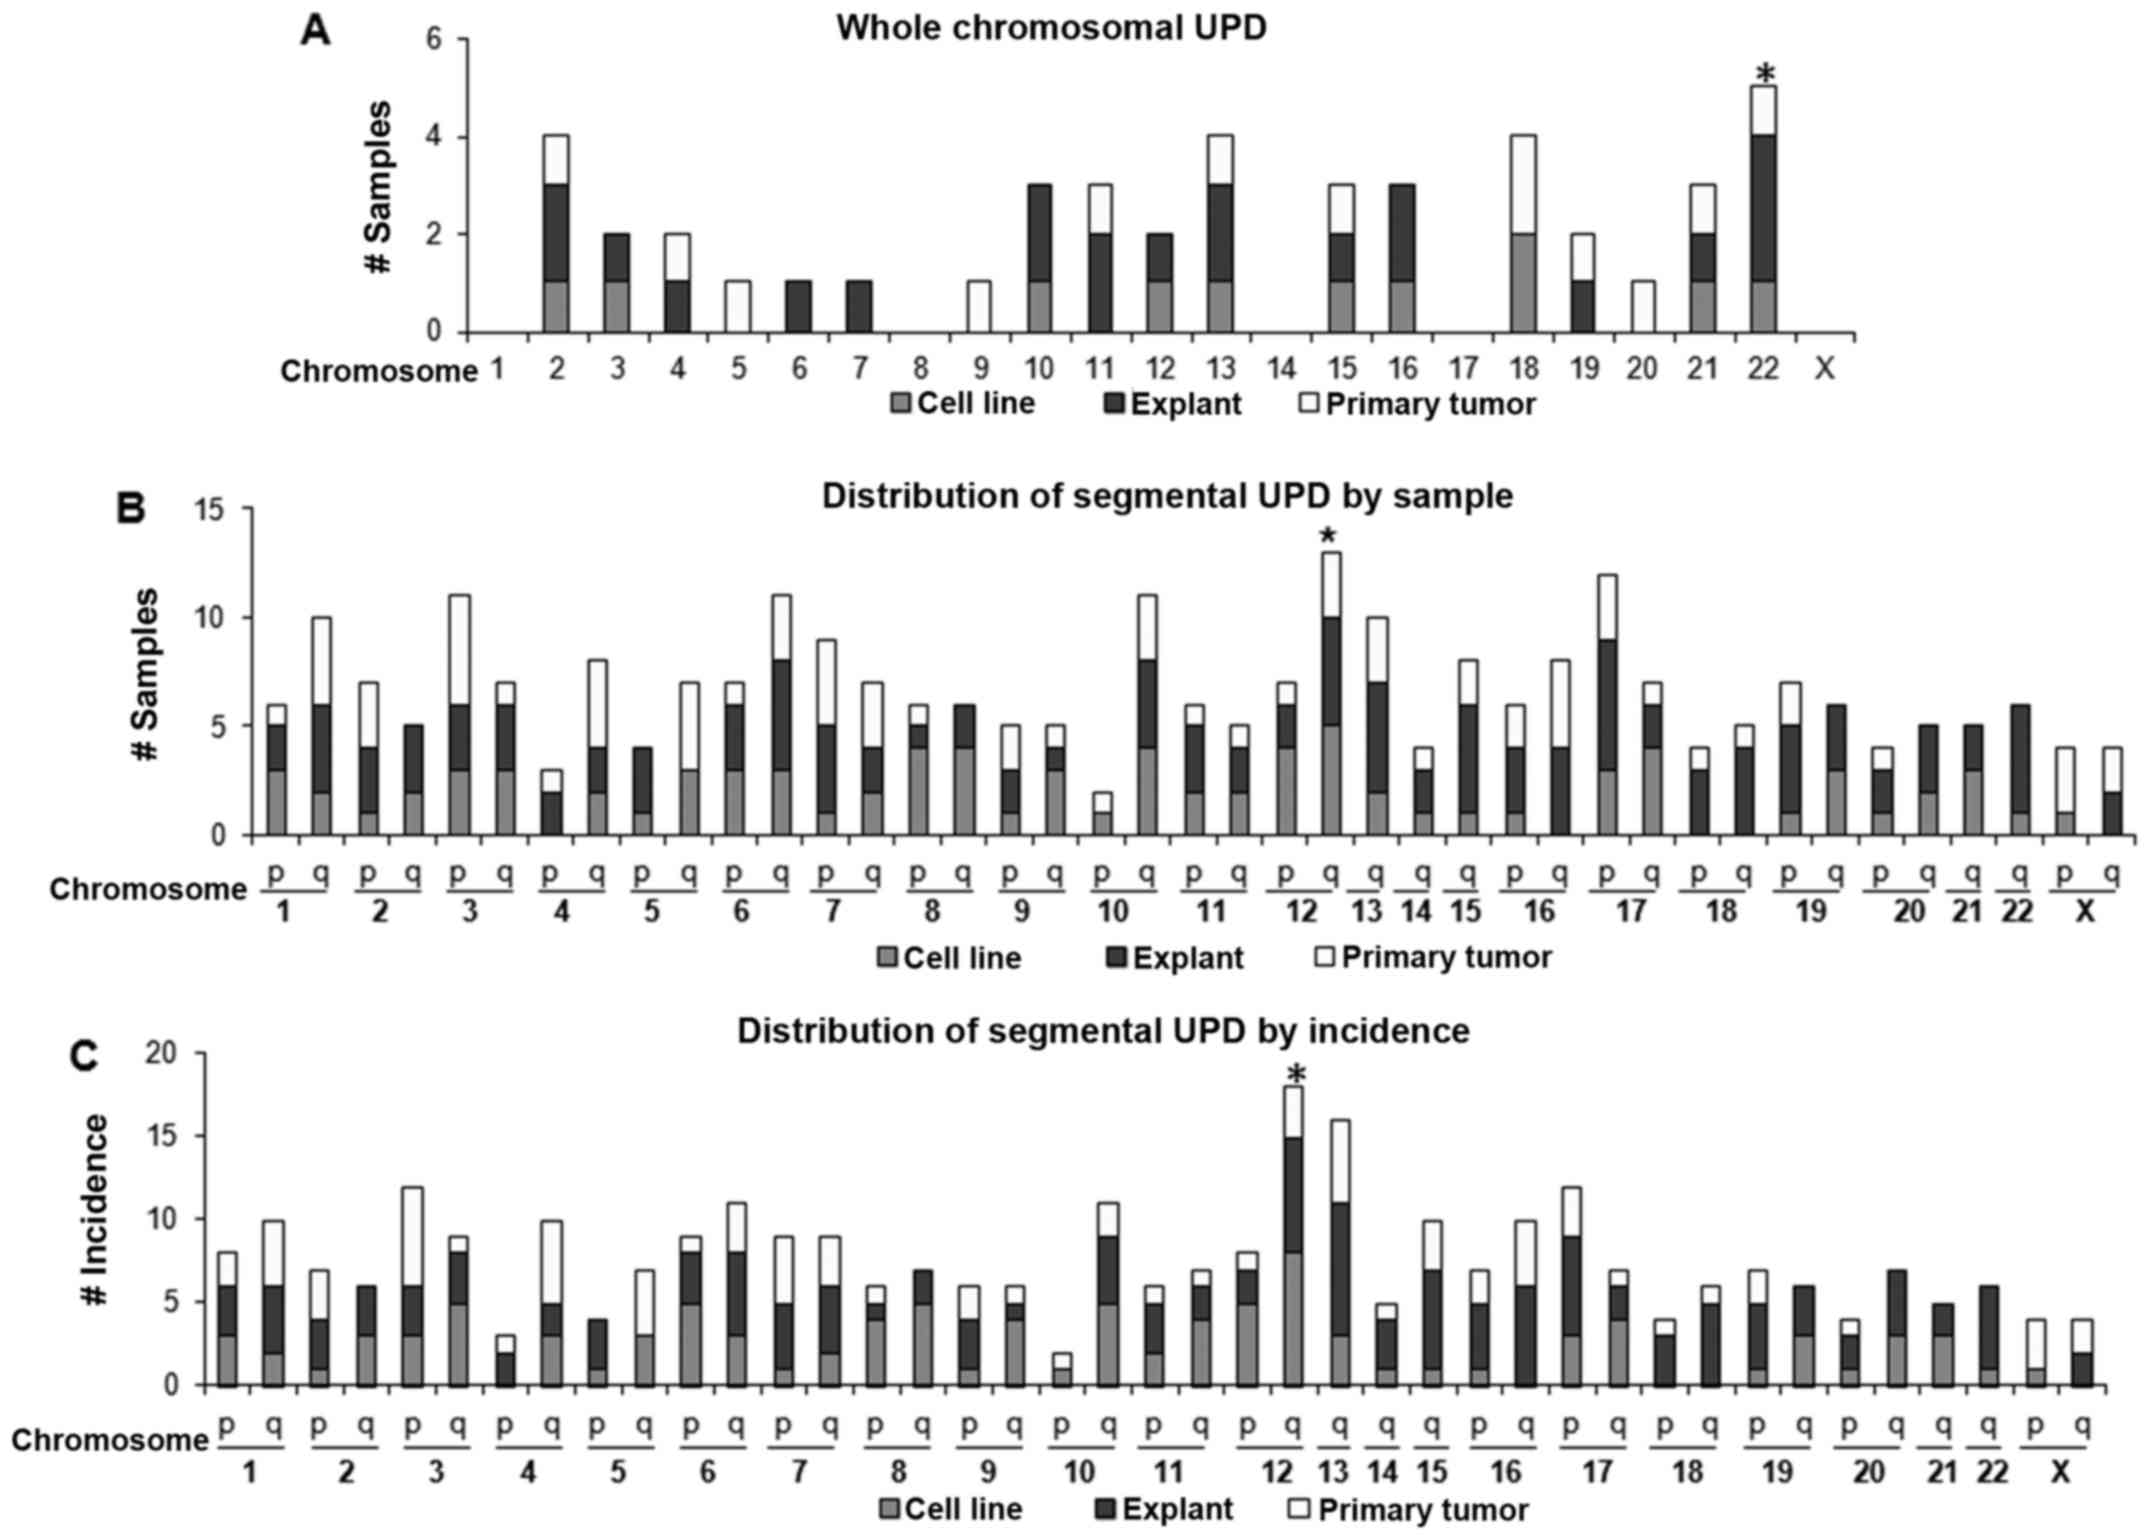
chromosomes 4, 5 and 7. Whole-chromosomal UPD (Fig. 3A) was most frequent at chromosome
22 (5 cases) followed by chromosomes 2, 13 and 18 (4 cases each).
No whole-chromosomal UPD was noted at either chromosome 1, 8, 14 or
17. Interestingly, chromosomes 1, 8, 14 and 17 had regions of
recurrent high amplification (discussed later).
Concerning segmental UPD (Figs. 1C and 3B), chromosome 12 q-arm (12q) UPD
occurred the most frequently in 13 samples (22%). The next most
common was 17q UPD found in 12 samples (20%); by incidence, 12q UPD
was also the most frequent (18 regions) followed by 13q UPD (16
regions).
Seventy percent of the primary samples had one or
more recurrent UPD regions, and 100% of cell lines and explants had
recurrent UPD regions. Regions of recurrent UPD appeared in various
sizes and chromosomal loci (Table
I). Excluding whole-chromosomal UPD, the median size of the UPD
regions was 11 Mb, ranging from 2 Mb (Xp22.12 and Xp22.12-p21.3) to
54 Mb (whole q-arm UPD of chromosome 16).
 | Table IRecurrent UPD regions in OS. |
Table I
Recurrent UPD regions in OS.
| Cytoband | UCSC May 2004
assembly
| Size (Mb) | Samples
| Known mutated gene
in OSa |
|---|
| StartPOS | EndPOS | Total no. | Total % |
|---|
| 1q31.1-q41 | 183188858 | 211490840 | 28 | 10 | 17 | |
| 2p24.1-p12 | 19495270 | 76950296 | 57 | 10 | 17 | |
| 2q24.2-q33.1 | 160740613 | 199983101 | 39 | 9 | 16 | |
| 3p22.3-p14.2 | 36726626 | 60749157 | 24 | 12 | 21 | |
| 3q11.2-q13.31 | 98705120 | 117729514 | 19 | 8 | 14 | |
| 4q34.1-qter | 172743172 | 191290799 | 19 | 8 | 14 | |
| 5q11.2-q14.1 | 55246197 | 80739073 | 25 | 6 | 10 | |
| 5q22.1-q31.3 | 109913296 | 141494150 | 32 | 6 | 10 | |
| 6q13-q14.1 | 72226093 | 79985449 | 8 | 9 | 16 | |
| 6q22.31-q24.2 | 121318426 | 143982816 | 23 | 9 | 16 | |
| 7p12.3-p11.1 | 47268854 | 57187722 | 10 | 9 | 16 | EGFR
(6%b) |
| 8p21.3-p12 | 21242912 | 30905027 | 10 | 4 | 7 | |
| 8q22.1-q22.3 | 96630283 | 104495421 | 8 | 4 | 7 | |
| 9p21.3-p12 | 22923651 | 44108554 | 21 | 6 | 10 | CDKN2A, 2B
(11%) |
| 9q33.1-qter | 115491394 | 135945601 | 20 | 7 | 12 | |
| 10q11.21-q22.1 | 44497840 | 70380364 | 26 | 9 | 16 | |
| 10q25.2-q26.12 | 114228361 | 122214789 | 8 | 8 | 14 | |
| 11pter-p13.1 | 1938894 | 30198901 | 28 | 8 | 14 | |
| 11q22.3-q23.3 | 103485551 | 114473112 | 11 | 8 | 14 | |
| 11q24.2-qter | 124730067 | 134437775 | 10 | 8 | 14 | |
| 12p13.2-p12.3 | 11980008 | 15490246 | 4 | 9 | 16 | |
| 12q11-q12 | 36391876 | 43990452 | 8 | 9 | 16 | |
|
12q24.31-q24.32 | 123828884 | 128205825 | 4 | 12 | 21 | |
| 13q11-q12.3 | 18209780 | 28993301 | 11 | 9 | 16 | |
| 13q14.11-q21.1 | 39159522 | 56979282 | 18 | 10 | 17 | RB1
(13%) |
| 14q21.3-q24.1 | 48497095 | 57242510 | 9 | 3 | 5 | |
| 15q21.3-q22.31 | 56990907 | 64239300 | 7 | 9 | 16 | |
| 16pter-p12.1 | 205160 | 22749097 | 23 | 9 | 16 | |
| 16q11.2-qter | 45226833 | 88666241 | 43 | 12 | 21 | |
| 17p13.2-p12 | 5999210 | 11680056 | 6 | 12 | 21 | TP53
(30%) |
|
18p11.22-p11.21 | 8617957 | 15073063 | 6 | 8 | 14 | |
| 18q11.2-q12.1 | 20243361 | 25176204 | 5 | 8 | 14 | |
| 19p13.2-p13.13 | 6909134 | 13445855 | 7 | 7 | 12 | |
|
19q13.11-q13.42 | 40074074 | 58908108 | 19 | 6 | 10 | |
|
20q11.21-q13.12 | 30491788 | 41744225 | 11 | 7 | 12 | |
| 20q13.2-q13.33 | 49983933 | 60249150 | 10 | 6 | 10 | |
| 21q22.12-qter | 34975513 | 46885639 | 12 | 6 | 10 | |
| 22q12.3 | 31598720 | 33627072 | 2 | 10 | 17 | |
| 22q12.3-q13.1 | 35390989 | 37641604 | 2 | 10 | 17 | |
| Xp22.12-p21.3 | 20242329 | 27726023 | 7 | 4 | 7 | |
| Xq27.2-qter | 141498847 | 154353200 | 13 | 5 | 9 | |
Moreover, recurrent UPD regions contained genes
known to be frequently mutated in OS (Table I). For example, RB1 and
TP53, two of the most commonly mutated genes in OS (1,2),
occurred in the recurrent UPD regions of chromosomes 13 and 17,
respectively. CDKN2A and CDKN2B, two well-known TSG,
were not only in a recurrent UPD region, but also showed recurrent
homozygous deletions (HD) in many samples (Table II). EGFR gene was also
found in the recurrent UPD region of chromosome 7. We have
extensively validated UPD and CN changes (shown below) through both
genomic q-PCR and direct sequencing (Materials and methods and
Figs. 1 and 2).
| Table IIRecurrent homozygous deletions in
OS. |
Table II
Recurrent homozygous deletions in
OS.
| Cytoband | UCSC May 2004
assembly
| Size (Mb) | Samples
| Genes and
miRNAsa within the region |
|---|
| StartPOS | EndPOS | Total no. | Total % |
|---|
| 2q22.1 | 141810352 | 141928225 | 0.1 | 3 | 5 | LRP1B |
| 3p13 | 71522662 | 77688970 | 6.1 | 3 | 5 | FOXP1,
ROBO2 |
| 3q13.31 | 117074192 | 118436759 | 9.2 | 9 | 16 | LSAMP, LOC285194
BC040587 |
| 7q21.11 | 77389932 | 77976116 | 0.6 | 2 | 3 | MAGI2 |
| 7q35-q36.3 | 146128574 | 146341779 | 0.2 | 5 | 9 | CNTNAP2 |
| 9p21.3 | 21801533 | 22203270 | 0.4 | 4 | 7 | CDKN2A,
2B |
| 11q14.1 | 82617545 | 84343329 | 1.7 | 2 | 3 | DLG2 |
| 13q14.2 | 47914064 | 47963566 | 0.05 | 2 | 3 | RB1 |
| 13q14.2 | 48209946 | 49643972 | 1.4 | 3 | 5 | DLEU1, mir15a,
mir16-1 |
| Xp22.33 | 3491918 | 3532609 | 4.1 | 4 | 7 | PRKX |
| Xp21.1 | 31891496 | 33362759 | 1.5 | 4 | 7 | DMD |
Recurrent amplifications and homozygous
deletions in OS
We analyzed total CN changes and identified common
regions of amplification showing CN estimation of 5 and 6
determined by HMM. Eleven regions were commonly amplified region in
OS cells (Table III). Common
amplifications at 1q21.1-1q24.1, 6p21.1-p12.1, 8q23.3-q24.3,
14q11.2-q12 and 17p12-p11 have been reported (1–13),
showing that these region are frequently amplified in OS cells.
Next, we identified homozygous deletions (HD) and found 196
recurrent HD in total (Table II).
Many HD occurred in the vicinity of genes located at common fragile
sites (CFS) e.g., LRP1B (FRA2F), CNTNAP2 (FRA7I),
MAGI2 (FRA7E), DLG2 (FRA11F) and DMD (FRAXC).
These genes are deleted in many cancers.
| Table IIIRecurrent high amplifications in
OS. |
Table III
Recurrent high amplifications in
OS.
| Cytoband | UCSC May 2004
assembly
| Size (Mb) | Samples
| Known
oncogenes |
|---|
| StartPOS | EndPOS | Total no. | Total % |
|---|
| 1p31.2-p21.1 | 68271671 | 102822954 | 35 | 5 | 9 | |
| 1q21.1-q24.1 | 142406039 | 163411899 | 21 | 8 | 14 | |
| 4q11-q12 | 52525819 | 65971362 | 13 | 6 | 10 | KIT |
| 5p13.1-q11.2 | 38854038 | 50857095 | 12 | 6 | 10 | |
| 6p21.1-p12.1 | 44140309 | 53601419 | 9 | 8 | 14 | |
| 8q23.3-q24.3 | 113293800 | 141257873 | 28 | 9 | 16 | MYC |
| 14q11.2-q12 | 19285288 | 30330681 | 11 | 10 | 17 | |
| 17p12-p11.2 | 12859705 | 22691152 | 10 | 9 | 16 | CRK |
| 17q23.2-q25.3 | 56600056 | 75827015 | 19 | 6 | 10 | |
| 19q12 | 32842516 | 36885229 | 4 | 8 | 14 | |
| Xp11.1-q12 | 57426758 | 65696889 | 8 | 5 | 9 | |
Importantly, homozygous deletion of 3q13.31 was the
most frequent HD (10 cases; 17% of the samples) in our cohort. This
region contained either a 5′-portion of LSAMP gene, lncRNAs
LOC285194 or BC040587, or all three, in agreement
with a recent report (20). In
many cases, deletion of LOC285194 and BC040587 (7
cases) was more frequent than deletion of LSAMP gene (3
cases), suggesting that these two lncRNAs might be biologically
relevant in OS cells.
Both LOC285194 and BC040587 play
important roles in the proliferation and migration of OS cells
Although LOC285194 has been implicated as a tumor
suppressor lncRNA in OS (20), its
function has not been studied extensively. Moreover, the biological
relevance of BC040587 remains unknown in the context of OS. To
address this, we next sought to characterize the functional roles
of both LOC285194 and BC040587 in OS cells.
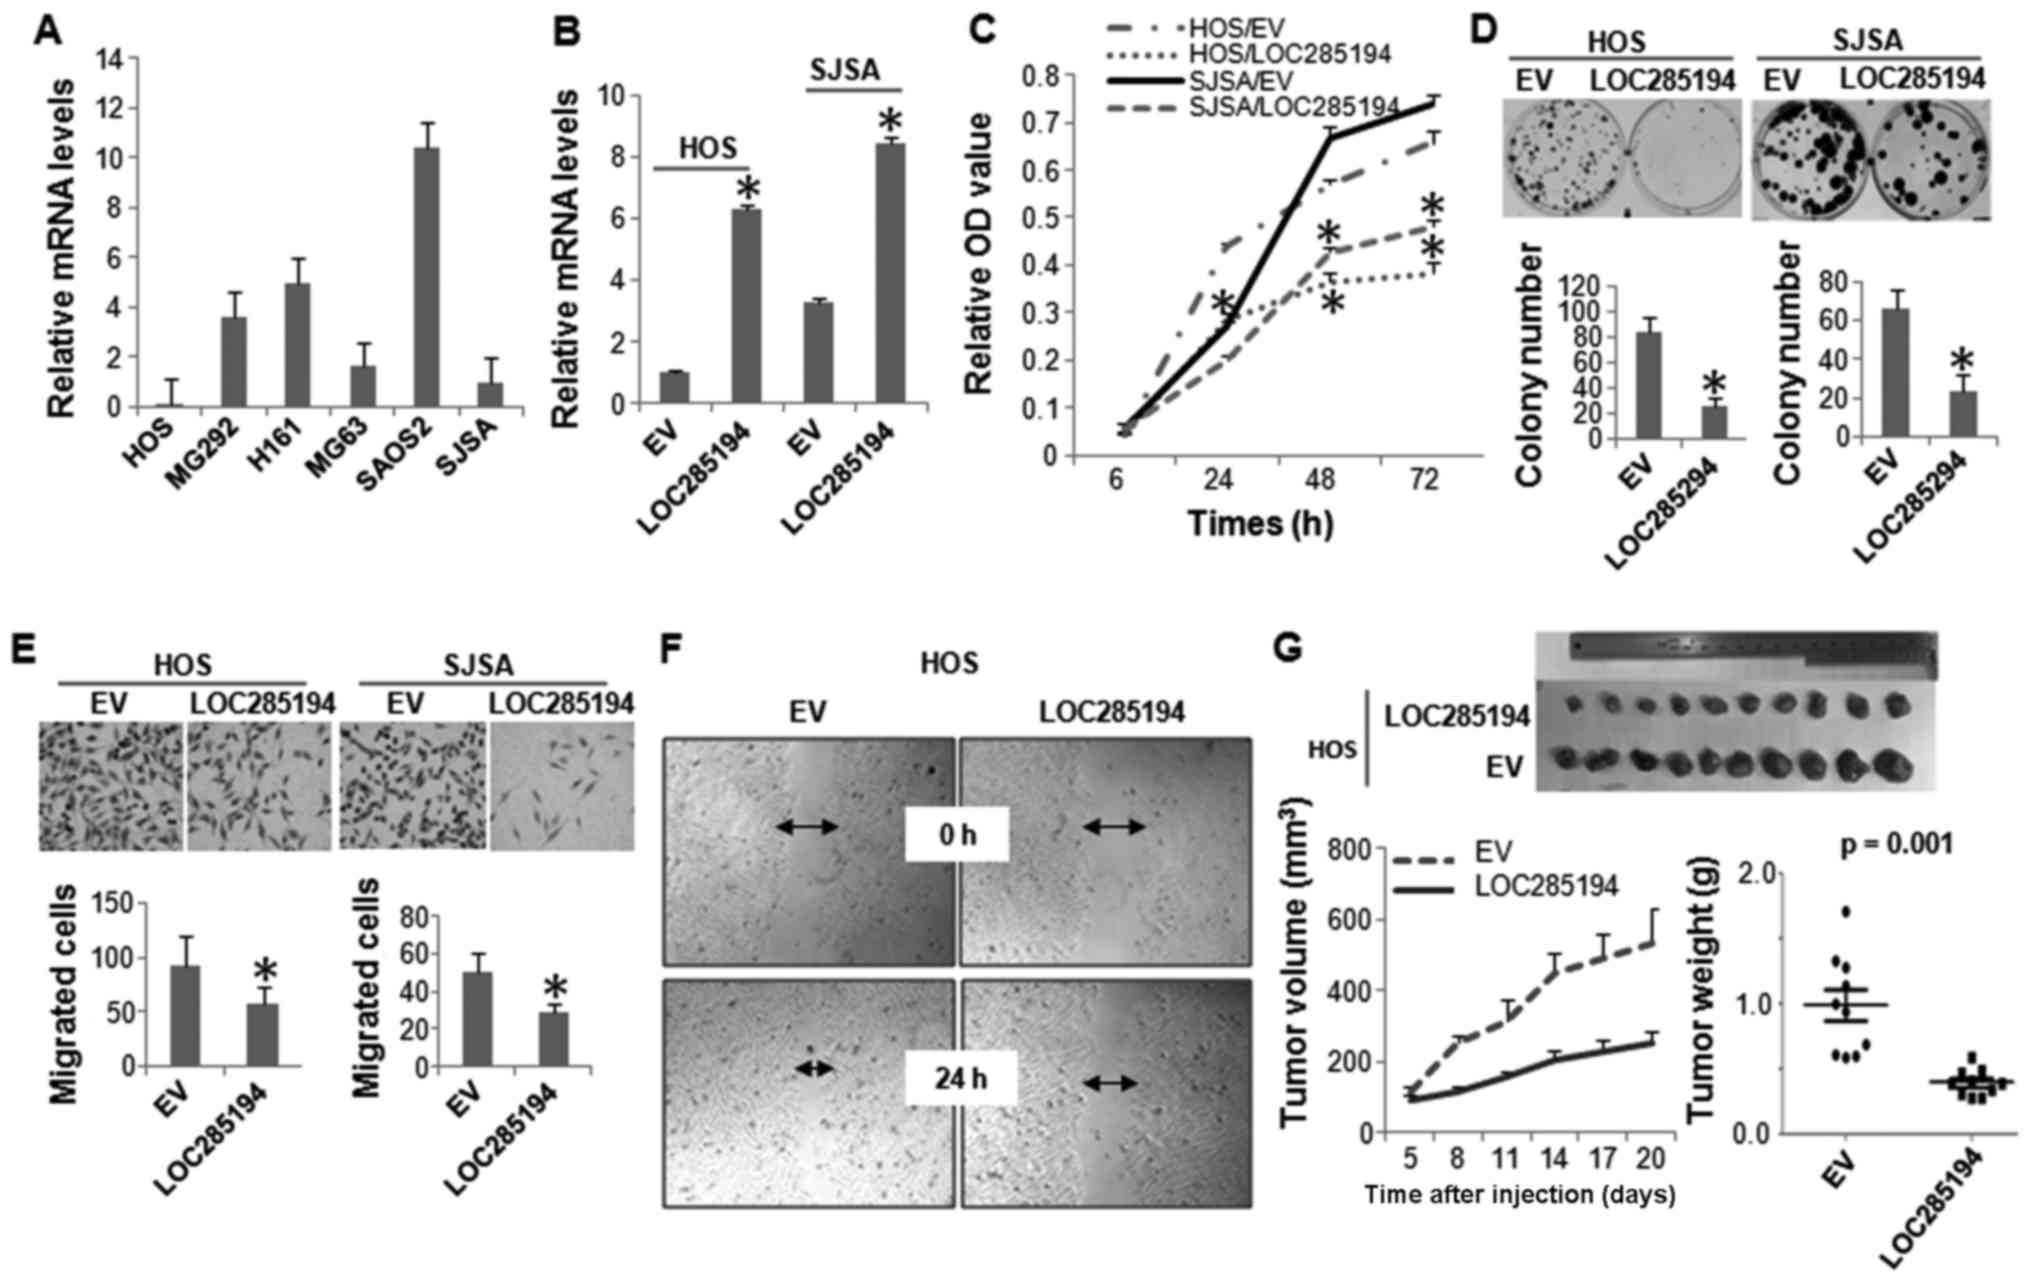
Expression level of LOC285194 was determined in a
panel of OS cell lines by qRT-PCR analysis. It was expressed at low
levels in all the OS cells lines evaluated. Not surprisingly,
LOC285194 was almost undetectable in HOS cells, which has HD at
this genomic locus (Fig. 4A). We
next ectopically expressed LOC285194 in both HOS and SJSA cells,
both displayed the lowest expression of this lncRNA (Fig. 4B). Both MTT and colony formation
assays showed that restoration of LOC285194 markedly attenuated the
proliferation of both HOS and SJSA cells (Fig. 4C and D). Moreover, Boyden chamber
migration assay and wound-healing assay revealed that LOC285194
expression resulted in a significantly decreased cell migration
(Fig. 4E and F). To determine
whether LOC285194 regulates xenograft growth of OS cells in
vivo, we injected either LOC285194-restored or control HOS
cells into the nude mice. Consistent with the effects of LOC285194
expression in vitro, LOC285194 potently inhibited xenograft
growth (Fig. 4G).
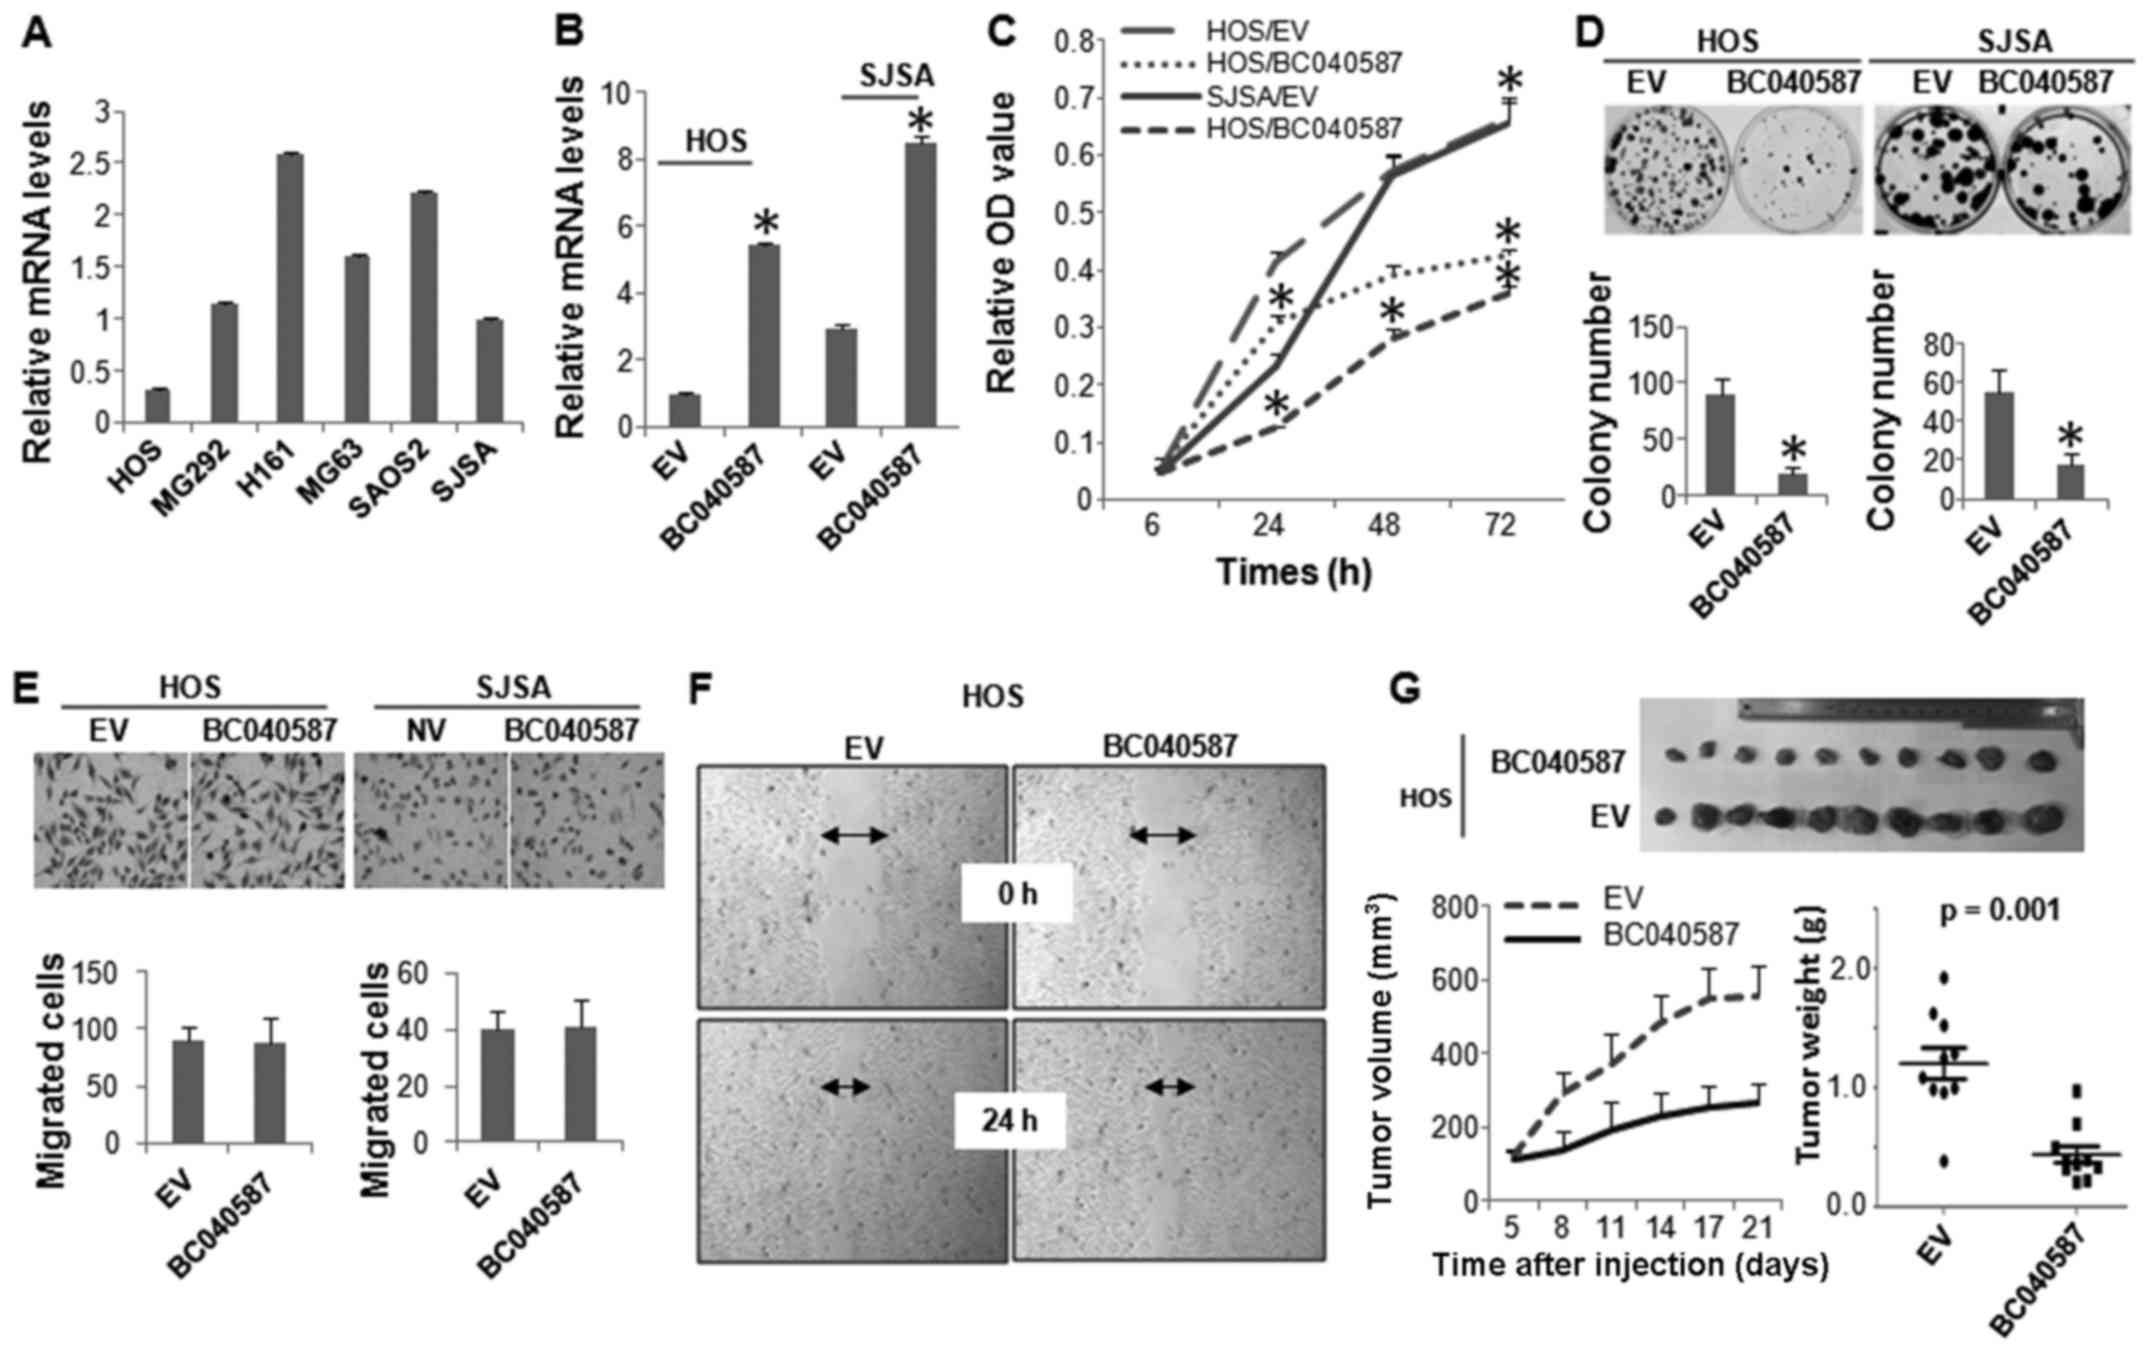
We next performed biological assays to determine the
functional role of the other lncRNA, BC040587, in OS cells. Similar
to LOC285194, HOS cells expressed the lowest level of BC040587,
followed by SJSA cells (Fig. 5A).
BC040587 was ectopically expressed in these two cell lines
(Fig. 5B), which markedly
inhibited their cellular proliferation (Fig. 5C and D). However, unlike
LOC285194, expression of BC040587 did not affect the
migration of the OS cells (Fig. 5E and
F). The tumor suppressive function of BC040587 was further
confirmed by in vivo xenograft assay (Fig. 5G).
Discussion
Unlike CGH studies which focused on primary tumors,
our study used OS from three different sources: 7 cell lines, 11
explants and 40 primary tumors. The cell lines and explants
maintained the chromosomal aberrations found in primary tumors. The
same phenomenon was observed in malignant melanoma where the
overall genomic profiles of 101 melanoma cell lines nearly matched
those of 70 primary melanomas (21). Similar concordness was noted
between 26 pancreatic cancer cell lines and primary pancreatic
cancers (22). Thus, combining the
results of all 59 samples into one analysis of common chromosomal
changes in OS is reasonable.
Our analysis particularly focused on the study of
LOH, especially UPD. Notably, almost 37% of the LOH were hidden as
UPD. Although surprising, esophageal cancer (23) and basal cell carcinoma (24) also had UPD, with 33% of the total
number of chromosomal changes and 42% of the total LOH,
respectively.
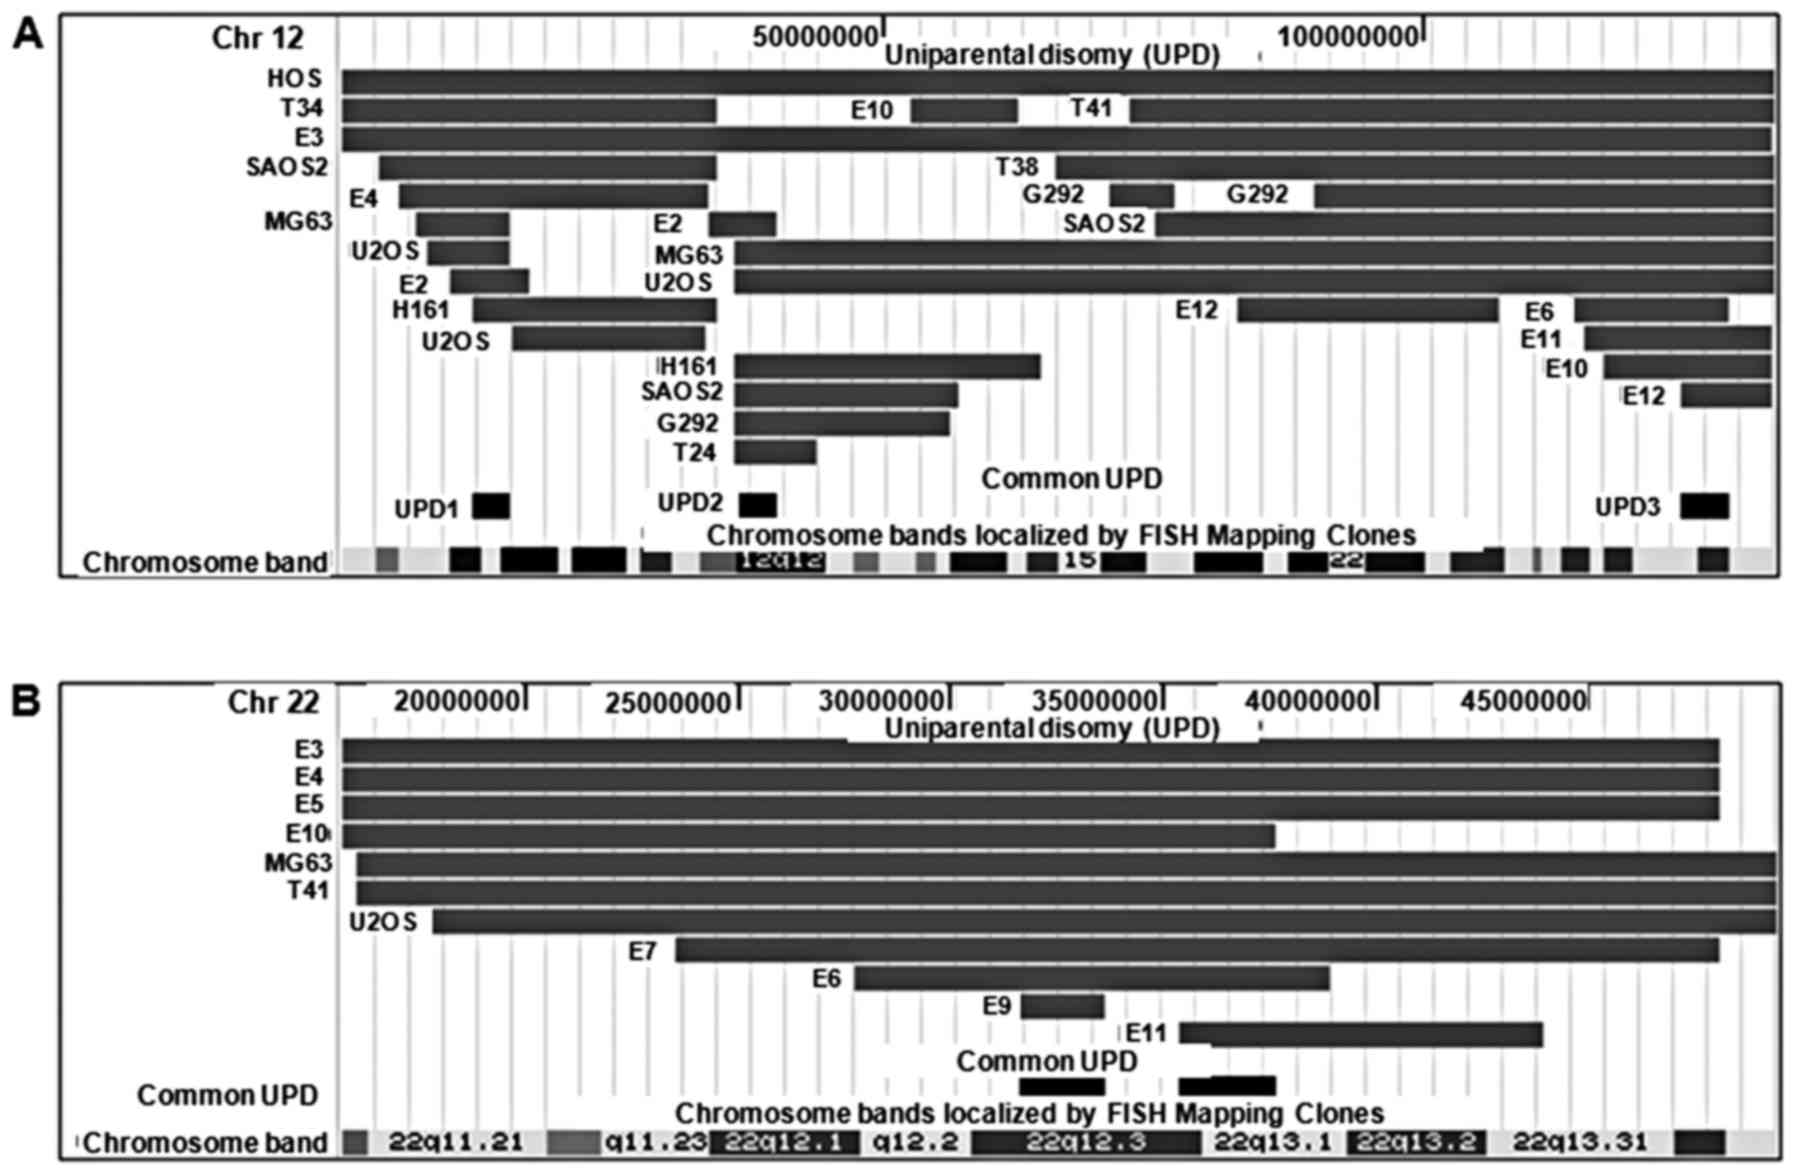
Among all UPD regions, 12q UPD occurred with the
highest frequency (18 events) affecting the highest number of
samples (13 samples, 23%). Two recurrent UPD regions were
identified on 12q: 12q11-q12 (UPD2) and 12q24.31-q24.32 (UPD3)
(Fig. 6A). Interestingly, the
location of the recurrent UPD regions, either centromeric (UPD2) or
telomeric (UPD3), suggests that these UPD regions were a result of
somatic recombination.
Although its incidence was relatively lower than
chromosome 12, chromosome 22 UPD was interesting in that nearly
half of the UPD (45%) (Fig. 6B),
involved the whole-chromosome suggesting that the mechanism of UPD
formation might be different from those of other UPD regions. Among
the genes in the region, CSNK1E gene is a potential target
because of its important role in canonical Wnt signaling
pathway and in circadian rhythm signaling pathway. Interestingly,
many genes in the recurrent UPD regions play major roles in the
Wnt signaling pathway, especially in the canonical
Wnt signaling pathway (data not shown). Previous research
shows that canonical Wnt signaling pathway is deregulated in
OS (25,26). For example, Ng et al
(27) checked the cellular
location of β-catenin in 545 mesenchymal tumors including 19
OS and found that OS showed an accumulation of β-catenin in
nucleus and/or in cytoplasm.
Frequent HD involving 3q13.31 region has been
observed in OS (20,28,29).
Among the genes located within the deleted region, LSAMP,
together with two lncRNAs LOC285194 and BC040587,
were highlighted. Variable levels of these two lncRNAs in different
osteosarcoma cell lines were observed. It is not surprising that
LOC285194 and BC040587 were expressed at their lowest level in HOS
cells, as this line has a homozygous deletion at this genomic
locus. Among the other cell lines, no appreciable copy number
changes were detected, and we reasoned that the different RNA
levels might result from epigenetic alterations, such as DNA
methylation or histone modification. Previous reports noted that
silencing LOC285194 promoted proliferation of normal osteoblasts,
and HD of LOC285194 or BC040587 was associated with a
poor survival of OS patients (17,20).
We show that restoration of either LOC285194 or BC040587 in OS cell
lines potently suppressed cell proliferation in vitro and
in vivo, consistent with the tumor suppressive roles of
these two lncRNAs. We also found that expression of LOC285194 but
not BC040587 inhibited the migration of OS cells. Continuing
research will be needed to elucidate the mode of action of these
two lncRNAs.
In conclusion, we discovered that OS has frequent
deletions and many of these represent chromosome region with
mutation of one allele of a target gene and its duplication with
less of the second normal allele. These target genes are usually
tumor suppressor genes. Hence, OS probably has numerous mutant
tumor suppressor genes.
Acknowledgments
This study was supported by the Singapore Ministry
of Health's National Medical Research Council (NMRC) under its
Singapore Translational Research (STaR) Investigator Award to
H.P.K., NMRC Individual Research Grant (NMRC/1311/2011) and the
NMRC Centre Grant awarded to National University Cancer Institute
of Singapore, the National Research Foundation Singapore and the
Singapore Ministry of Education under its Research Centres of
Excellence initiatives to H.P.K. D.-C.L. was supported by American
Society of Hematology Fellow Scholar Award, Donna and Jesse Garber
Awards for Cancer Research and National Center for Advancing
Translational Sciences UCLA CTSI Grant UL1TR000124. This study was
also supported by the Wendy Walk Foundation, Slifka Foundation and
the RNA Biology Center at the Cancer Science Institute of
Singapore, NUS, as part of funding under the Singapore Ministry of
Education's Tier 3 grants (grant no. MOE2014-T3-1-006).
References
|
1
|
Sandberg AA and Bridge JA: Updates on the
cytogenetics and molecular genetics of bone and soft tissue tumors:
Osteosarcoma and related tumors. Cancer Genet Cytogenet. 145:1–30.
2003. View Article : Google Scholar : PubMed/NCBI
|
|
2
|
Kansara M and Thomas DM: Molecular
pathogenesis of osteosarcoma. DNA Cell Biol. 26:1–18. 2007.
View Article : Google Scholar : PubMed/NCBI
|
|
3
|
Savage SA, Mirabello L, Wang Z,
Gastier-Foster JM, Gorlick R, Khanna C, Flanagan AM, Tirabosco R,
Andrulis IL, Wunder JS, et al: Genome-wide association study
identifies two susceptibility loci for osteosarcoma. Nat Genet.
45:799–803. 2013. View
Article : Google Scholar : PubMed/NCBI
|
|
4
|
Mirabello L, Koster R, Moriarity BS,
Spector LG, Meltzer PS, Gary J, Machiela MJ, Pankratz N, Panagiotou
OA, Largaespada D, et al: A genome-wide scan identifies variants in
NFIB associated with metastasis in patients with osteosarcoma.
Cancer Discov. 5:920–931. 2015. View Article : Google Scholar : PubMed/NCBI
|
|
5
|
Kovac M, Blattmann C, Ribi S, Smida J,
Mueller NS, Engert F, Castro-Giner F, Weischenfeldt J, Kovacova M,
Krieg A, et al: Exome sequencing of osteosarcoma reveals mutation
signatures reminiscent of BRCA deficiency. Nat Commun. 6:89402015.
View Article : Google Scholar : PubMed/NCBI
|
|
6
|
dos Santos Aguiar S, de Jesus Girotto
Zambaldi L, dos Santos AM, Pinto W Jr and Brandalise SR:
Comparative genomic hybridization analysis of abnormalities in
chromosome 21 in childhood osteosarcoma. Cancer Genet Cytogenet.
175:35–40. 2007. View Article : Google Scholar : PubMed/NCBI
|
|
7
|
Ohata N, Ito S, Yoshida A, Kunisada T,
Numoto K, Jitsumori Y, Kanzaki H, Ozaki T, Shimizu K and Ouchida M:
Highly frequent allelic loss of chromosome 6q16-23 in osteosarcoma:
Involvement of cyclin C in osteosarcoma. Int J Mol Med.
18:1153–1158. 2006.PubMed/NCBI
|
|
8
|
Atiye J, Wolf M, Kaur S, Monni O, Böhling
T, Kivioja A, Tas E, Serra M, Tarkkanen M and Knuutila S: Gene
amplifications in osteosarcoma-CGH microarray analysis. Genes
Chromosomes Cancer. 42:158–163. 2005. View Article : Google Scholar
|
|
9
|
Zielenska M, Marrano P, Thorner P, Pei J,
Beheshti B, Ho M, Bayani J, Liu Y, Sun BC, Squire JA, et al:
High-resolution cDNA microarray CGH mapping of genomic imbalances
in osteosarcoma using formalin-fixed paraffin-embedded tissue.
Cytogenet Genome Res. 107:77–82. 2004. View Article : Google Scholar : PubMed/NCBI
|
|
10
|
Man TK, Lu XY, Jaeweon K, Perlaky L,
Harris CP, Shah S, Ladanyi M, Gorlick R, Lau CC and Rao PH:
Genome-wide array comparative genomic hybridization analysis
reveals distinct amplifications in osteosarcoma. BMC Cancer.
4:452004. View Article : Google Scholar : PubMed/NCBI
|
|
11
|
Lau CC, Harris CP, Lu XY, Perlaky L,
Gogineni S, Chintagumpala M, Hicks J, Johnson ME, Davino NA, Huvos
AG, et al: Frequent amplification and rearrangement of chromosomal
bands 6p12-p21 and 17p11.2 in osteosarcoma. Genes Chromosomes
Cancer. 39:11–21. 2004. View Article : Google Scholar
|
|
12
|
Squire JA, Pei J, Marrano P, Beheshti B,
Bayani J, Lim G, Moldovan L and Zielenska M: High-resolution
mapping of amplifications and deletions in pediatric osteosarcoma
by use of CGH analysis of cDNA microarrays. Genes Chromosomes
Cancer. 38:215–225. 2003. View Article : Google Scholar : PubMed/NCBI
|
|
13
|
Overholtzer M, Rao PH, Favis R, Lu XY,
Elowitz MB, Barany F, Ladanyi M, Gorlick R and Levine AJ: The
presence of p53 mutations in human osteosarcomas correlates with
high levels of genomic instability. Proc Natl Acad Sci USA.
100:11547–11552. 2003. View Article : Google Scholar : PubMed/NCBI
|
|
14
|
Yamamoto G, Nannya Y, Kato M, Sanada M,
Levine RL, Kawamata N, Hangaishi A, Kurokawa M, Chiba S, Gilliland
DG, et al: Highly sensitive method for genomewide detection of
allelic composition in nonpaired, primary tumor specimens by use of
affymetrix single-nucleotide-polymorphism genotyping microarrays.
Am J Hum Genet. 81:114–126. 2007. View
Article : Google Scholar : PubMed/NCBI
|
|
15
|
Lin DC, Meng X, Hazawa M, Nagata Y, Varela
AM, Xu L, Sato Y, Liu LZ, Ding LW, Sharma A, et al: The genomic
landscape of nasopharyngeal carcinoma. Nat Genet. 46:866–871. 2014.
View Article : Google Scholar : PubMed/NCBI
|
|
16
|
Lin DC, Xu L, Ding LW, Sharma A, Liu LZ,
Yang H, Tan P, Vadgama J, Karlan BY, Lester J, et al: Genomic and
functional characterizations of phosphodiesterase subtype 4D in
human cancers. Proc Natl Acad Sci USA. 110:6109–6114. 2013.
View Article : Google Scholar : PubMed/NCBI
|
|
17
|
Liu Q, Huang J, Zhou N, Zhang Z, Zhang A,
Lu Z, Wu F and Mo YY: lncRNA loc285194 is a p53-regulated tumor
suppressor. Nucleic Acids Res. 41:4976–4987. 2013. View Article : Google Scholar : PubMed/NCBI
|
|
18
|
Lin DC, Xu L, Chen Y, Yan H, Hazawa M,
Doan N, Said JW, Ding LW, Liu LZ, Yang H, et al: Genomic and
functional analysis of the E3 ligase PARK2 in glioma. Cancer Res.
75:1815–1827. 2015. View Article : Google Scholar : PubMed/NCBI
|
|
19
|
Jiang YY, Lin DC, Mayakonda A, Hazawa M,
Ding LW, Chien WW, Xu L, Chen Y, Xiao JF, Senapedis W, et al:
Targeting super-enhancer-associated oncogenes in oesophageal
squamous cell carcinoma. Gut. May 10–2016.Epub ahead of print.
2016.PubMed/NCBI
|
|
20
|
Pasic I, Shlien A, Durbin AD, Stavropoulos
DJ, Baskin B, Ray PN, Novokmet A and Malkin D: Recurrent focal
copy-number changes and loss of heterozygosity implicate two
noncoding RNAs and one tumor suppressor gene at chromosome 3q13.31
in osteosarcoma. Cancer Res. 70:160–171. 2010. View Article : Google Scholar : PubMed/NCBI
|
|
21
|
Lin WM, Baker AC, Beroukhim R, Winckler W,
Feng W, Marmion JM, Laine E, Greulich H, Tseng H, Gates C, et al:
Modeling genomic diversity and tumor dependency in malignant
melanoma. Cancer Res. 68:664–673. 2008. View Article : Google Scholar : PubMed/NCBI
|
|
22
|
Calhoun ES, Hucl T, Gallmeier E, West KM,
Arking DE, Maitra A, Iacobuzio-Donahue CA, Chakravarti A, Hruban RH
and Kern SE: Identifying allelic loss and homozygous deletions in
pancreatic cancer without matched normals using high-density
single-nucleotide polymorphism arrays. Cancer Res. 66:7920–7928.
2006. View Article : Google Scholar : PubMed/NCBI
|
|
23
|
Nancarrow DJ, Handoko HY, Smithers BM,
Gotley DC, Drew PA, Watson DI, Clouston AD, Hayward NK and Whiteman
DC: Genome-wide copy number analysis in esophageal adenocarcinoma
using high-density single-nucleotide polymorphism arrays. Cancer
Res. 68:4163–4172. 2008. View Article : Google Scholar : PubMed/NCBI
|
|
24
|
Teh MT, Blaydon D, Chaplin T, Foot NJ,
Skoulakis S, Raghavan M, Harwood CA, Proby CM, Philpott MP, Young
BD, et al: Genomewide single nucleotide polymorphism microarray
mapping in basal cell carcinomas unveils uniparental disomy as a
key somatic event. Cancer Res. 65:8597–8603. 2005. View Article : Google Scholar : PubMed/NCBI
|
|
25
|
Xue YL, Meng XQ, Ma LJ and Yuan Z:
Plumbagin exhibits an anti-proliferative effect in human
osteosarcoma cells by downregulating FHL2 and interfering with
Wnt/β-catenin signalling. Oncol Lett. 12:1095–1100. 2016.PubMed/NCBI
|
|
26
|
Lv YF, Dai H, Yan GN, Meng G, Zhang X and
Guo QN: Downregulation of tumor suppressing STF cDNA 3 promotes
epithelial-mesenchymal transition and tumor metastasis of
osteosarcoma by the Wnt/GSK-3β/β-catenin/Snail signaling pathway.
Cancer Lett. 373:164–173. 2016. View Article : Google Scholar : PubMed/NCBI
|
|
27
|
Ng TL, Gown AM, Barry TS, Cheang MC, Chan
AK, Turbin DA, Hsu FD, West RB and Nielsen TO: Nuclear beta-catenin
in mesenchymal tumors. Mod Pathol. 18:68–74. 2005. View Article : Google Scholar
|
|
28
|
Yen CC, Chen WM, Chen TH, Chen WY, Chen
PC, Chiou HJ, Hung GY, Wu HT, Wei CJ, Shiau CY, et al:
Identification of chromosomal aberrations associated with disease
progression and a novel 3q13.31 deletion involving LSAMP gene in
osteosarcoma. Int J Oncol. 35:775–788. 2009.PubMed/NCBI
|
|
29
|
Kresse SH, Ohnstad HO, Paulsen EB,
Bjerkehagen B, Szuhai K, Serra M, Schaefer KL, Myklebost O and
Meza-Zepeda LA: LSAMP, a novel candidate tumor suppressor gene in
human osteosarcomas, identified by array comparative genomic
hybridization. Genes Chromosomes Cancer. 48:679–693. 2009.
View Article : Google Scholar : PubMed/NCBI
|