Introduction
Calorie restriction (CR) represents an effective
means of regulating aging by inducing a healthy lifespan, as
observed in various rodent and primate models (1). By contrast, obesity increases the
risk, incidence and mortality rate of patients with various
diseases, including breast and prostate cancer (2). Indeed, studies have examined the
effects of reducing food consumption by 20–40% of normal intake
(1). Intermittent CR (ICR) is
usually performed by restricting energy intake for 1–3 days/week,
followed by 'free' eating on non-restriction days. Given that ICR
is easier to carry out than traditional CR or continuous CR (CCR),
for which energy intake is limited every day, ICR has increased in
popularity (3). Moreover, ICR is
as effective as traditional CR in achieving weight loss, reducing
fat mass and in maintaining the acquired status (4,5).
Weight loss has been shown to decrease the risk of
cancer, and to inhibit disease progression and metastasis (6). Whereas traditional CR has been
effective in this sense, the anticancer effect of ICR has yet to be
proven (6,7). However, it has been proposed that
weight cycling, exemplified by CR-induced weight loss followed by
weight gain, may decrease the effectiveness of CR, and particularly
ICR, on cancer inhibition (7).
Fatty acids, which are found in various food
ingredients, influence a wide range of diseases, including
cardiovascular disorders, metabolic diseases, such as type-2
diabetes, inflammatory diseases and cancer (8). Evidence indicates that a high-fat
diet is associated with aggressive prostate cancer and that n-6
fatty acids enhance breast cancer invasion and metastasis (9). Trans fatty acids (TFAs) represent an
established risk factor for cardiovascular diseases, and have been
reported to increase the risk of certain types of cancers and to
promote cancer cell growth, invasion, anti-apoptotic survival and
metastasis (10). In an aim to
reduce the incidence of cardiovascular diseases, the United States
Food and Drug Administration has ruled that TFAs are not generally
recognized as safe for human consumption and must be removed from
prepared foods by June 2018 (11).
The overconsumption of saturated fatty acids or TFAs
has also been shown to increase the risk of hyperglycemia induced
by the enhancement of gluconeogenesis and insulin resistance
(12,13). The energy metabolism of cancer
cells exhibits a striking feature, referred to the Warburg effect,
in which energy production depends predominantly on glycolysis and
lactate fermentation, even under aerobic conditions (14,15).
The Warburg effect is enhanced by the glucose load and also by
hyperglycemia induced by high-fat diets or the overconsumption of
TFAs (16). As such, alterations
in blood sugar levels and energy metabolism in cancer cells
associated with ICR is an important subject of study (17). In this study, we therefore sought
to characterize the effects of ICR on cancer cells, particularly in
combination with a high-fat or high-TFA diet.
Materials and methods
Cells and reagents
The CT26 mouse colon cancer cell line was a kind
gift from Professor I.J. Fidler (MD Anderson Cancer Center,
Houston, TX, USA). The cells were cultured in Dulbecco's modified
Eagle's medium (DMEM; Wako Pure Chemical Industries, Ltd., Osaka,
Japan) supplemented with 10% fetal bovine serum (Sigma-Aldrich
Chemical Co., St. Louis, MO, USA).
DMEM containing 75 mg/dl of glucose or 150 mg/dl
glucose was generated by mixing glucose-free DMEM with high-glucose
DMEM (glucose, 450 mg/dl) (both from Wako Pure Chemical Industries,
Ltd.). The insulin-like growth factor-1 receptor (IGF-1R)
inhibitor, picropodophyllin (working concentration, 500 nM), and
the hypoxia-inducible factor-1α (HIF-1α) inhibitor, chrysin
(working concentration, 50 μM), were obtained from Santa
Cruz Biotechnology, Inc. (Dallas, TX, USA), while MitoXpress and
CellROX green were purchased from Luxcel Biosciences Ltd. (Cork,
Ireland) and Thermo Fisher Scientific (Waltham, MA, USA),
respectively.
For the measurement of oxygen consumption and
reactive oxygen species (ROS) levels, the cells were seeded into
96-well plates (2,000 cells/well) and cultured with regular medium
containing MitoXpress (10 μg/ml) overnight or CellROX green
(5 μM) for 30 min, respectively. After providing the cells
with fresh regular medium, the plates were evaluated using a
multimode plate reader (Perkin Elmer Japan, Tokyo, Japan) at
excitation wavelengths of 340 and 485 nm, and emission wavelengths
of 640 and 520 nm for MitoXpress and CellROX green,
respectively.
Animals
A total of 70 male BALB/c mice (4 weeks old, mean
body weight, 17.6±2.4 g) were purchased from SLC Japan (Shizuoka,
Japan). The animals were maintained in a pathogen-free animal
facility in a 12/12 h light/dark cycle in a temperature (22°C)- and
humidity-controlled environment, in accordance with the
institutional guidelines approved by the Committee for Animal
Experimentation of Nara Medical University, Kashihara, Japan
following current regulations and standards of the Japanese
Ministry of Health, Labor and Welfare (approval no. 9559).
Animal models
To establish a subcutaneous tumor model, CT26 cancer
cells (1×10⁷) were inoculated into the scapular
subcutaneous tissue of BALB/c mice. Mice were observed for 4 weeks
following inoculation. For ICR, the mice were starved for 24 h
(from 8 a.m. on the first day of the week to 8 a.m. on the second
day of the week); 4 mice were examined at each time-point. For CCR,
the mice were provided access to a low calorie (30% calorie
reduction) diet ad libitum.
The animals were then subjected to the following
diets: A control diet [CE-2 (containing 5% crude fat derived mainly
from soy bean oil; CLEA Japan, Inc., Tokyo, Japan)], a high-fat
diet [Quickfat (containing 14% crude fat derived mainly from beef
tallow; CLEA Japan, Inc.)], an elaidic acid (EA)-rich diet [CE-2 +
10% EA (Sigma-Aldrich Chemical Co.)], or a low calorie diet + 10%
EA [70% w/w CE-2 + 30% w/w cellulose (Wako Pure Chemical
Industries, Ltd.)]. In groups C and CI, mice were fed the CE-2
diet. In groups F and FI, mice were fed a high-fat diet. In groups
E, EI, E-CNT and E-ICR, mice were fed an EA-rich diet. In group
E-CCR, mice were fed a low calorie diet. In each group, 5 mice were
used. The subcutaneous tumors were excised from the euthanized mice
on day 28 to measure tumor weight and examine histologically.
For detecting lung metastasis, indocyanine
green-labeled (Dojindo Laboratories, Kumamoto, Japan) mouse
anti-epidermal growth factor receptor antibody (EGFR, 1005,
sc-03-G; Santa Cruz Biotechnology, Inc.) diluted in PBS (0.5
μg/200 μl) was injected into the caudal vein prior to
euthanasia at day 28. Excised lungs were observed using a Clairvivo
OPT in vivo imager (Shimadzu Corp., Kyoto, Japan) (18).
Reverse transcription-polymerase chain
reaction (RT-PCR)
In the weekly change studies, the blood was obtained
from caudal vein of mice (n=5) at 2 p.m. each day, repetitively. In
the energy metabolism experiment, the blood was obtained by cardiac
centesis from euthanized mice (n=5) on day 2 of the ICR model, at 6
h after re-feeding. Total RNA (1 μg) was isolated from the
blood samples using the PAX gene Blood RNA kit (Qiagen, Venlo, The
Netherlands). PCR products were separated on a 2% agarose gel,
visualized with ethidium bromide, and quantified using the
QuantiTect Primer assay (Qiagen), according to the manufacturer's
instructions. The following primer sets (Sigma Genosys, Ishikari,
Japan) were used for amplification: Mouse CD133 (Prom1,
accession no. BC028286.1) forward, 5′-gaa aag ttg ctc tgc gaa cc-3′
and reverse, 5′-tct caa gct gaa aag cag ca-3′; mouse nucleostemin
(NS) (Gln3, accession no. AY181025.1) forward, 5′-CAG GAT
GCT GAC GAT CAA GA-3′ and reverse, 5′-TTG ATT GCT CAG GTG ACA GC-3;
mouse β-actin (ActB, accession no. NM_007393.4) forward,
5′-agc cat gta cgt agc cat cc-3′ and reverse, 5′-ctc tca gct gtg
gtg gtg aa-3′. PCR conditions were set in accordance with the
manufacturer's instructions. The number of replicates was 30 cycles
(94°C/1 min-64°C/1 min-72°C/1 min).
Reverse transcription-quantitative PCR
(RT-qPCR)
The extraction of total RNA was carried out using an
RNeasy mini kit (Qiagen), and total RNA (1 μg) was
synthesized using the ReverTra Ace-α-RT kit (Toyobo, Osaka, Japan).
qPCR was performed using a StepOne Real-Time PCR system with Fast
SYBR®-Green Master Mix (Applied Biosystems, Life
Technologies, Carlsbad, CA, USA); a relative standard curve
quantification method was used for analysis (18,19).
PCR was carried out under the conditions recommended by the
manufacturer. Hif-1A RT-PCR primers were purchased from
Santa Cruz Biotechnology, Inc. ActB mRNA was amplified as an
internal control (GenBank Accession no. NM 001101). Each
amplification reaction was evaluated by melting curve analysis. PCR
products were visualized by agarose gel electrophoresis with
ethidium bromide staining.
Immunohistochemistry
Consecutive 4-μm-thick sections were
immunohistochemically stained via the immunoperoxidase technique,
as previously described (20).
Antibodies against mouse CD133 (18470-1-AP; Proteintech, Rosemont,
IL, USA), NS (clone E-8, sc-166460; Santa Cruz Biotechnology, Inc.)
and mindbomb E3 ubiquitin protein ligase 1 (M7240; MIB1; Ki-67
clone MIB1; Dako Corp., Carpinteria, CA, USA) were used at 0.5
μg/ml. Color development was achieved using
3-3′-diaminobenzidine (Dako Corp.). Specimens were counterstained
with Meyer's hematoxylin stain (Sigma-Aldrich Chemical Co.) for
visualization of the nuclei.
After immunostaining, the number of positively
stained nuclei was counted in all slides. To evaluate positivities,
1,000 cells were observed microscopically (BX43; Olympus
Lifescience Solution, Tokyo, Japan).
Immunoblot analysis
Whole cell lysates were prepared as previously
described (21). Lysates (50
μg) were separated by 12.5% sodium dodecyl
sulfate-polyacrylamide gel electrophoresis (SDS-PAGE) and
transferred onto nitrocellulose membranes. The membranes were then
incubated with primary antibodies specific to Nanog (ab80892;
Abcam, Cambridge, UK), Snail (clone C15D3, #3879; Cell Signaling
Technology Japan, Tokyo, Japan), E-cadherin (clone HECD-1, ab1416),
vimentin (ab24535) (both from Abcam), Stat3-phosphoTyr705 (clone
D3A7, #9145), or Stat3 (#9132) (Cell Signaling Technology Japan),
followed by peroxidase-conjugated IgG antibodies (#330 and #458;
MBL, Nagoya, Japan). Anti-tubulin antibody was used to assess the
levels of protein loaded per lane (clone DM1A, 05-829; Oncogene
Research Products, Cambridge, MA, USA). Immune complexes were
visualized using an ECL western blot detection system (Amersham,
Aylesbury, UK).
Measurement of blood sugar and lactate
levels
In the energy metabolism experiment, blood, obtained
by cardiac centesis from euthanized mice (n=5) on day 28 on 2 of
the ICR model, at 6 h after re-feeding was subjected to the
measurement of the sugar concentration. The sugar concentration was
determined using Medisafe Mini (CR-102; Terumo Corp., Tokyo, Japan)
according to the manufacturers' instructions. Lactate levels were
measured using the D-Lactate, assay kit (700520; Funakoshi, Tokyo,
Japan) according to the manufacturers' instructions.
Enzyme-linked immunosorbant assay
(ELISA)
The levels of IGF-1 and lactate in whole cell
lysates were measured using a mouse IGF1 ELISA kit (Abcam) and an
EnzyChrom glycolysis assay kit (BioAssay Systems, Hayward, CA,
USA), respectively, according to the manufacturers'
instructions.
Statistical analysis
Statistical significance was evaluated by a
two-tailed Fisher's exact, Chi-square and unpaired Student's
t-tests with Bonferroni correction using InStat software (GraphPad,
Los Angeles, CA, USA). Statistical significance was defined as a
two-sided P-value <0.05.
Results
Effect of a high-fat diet and
intermittent starvation on tumor growth and cancer stem cells
(CSCs)
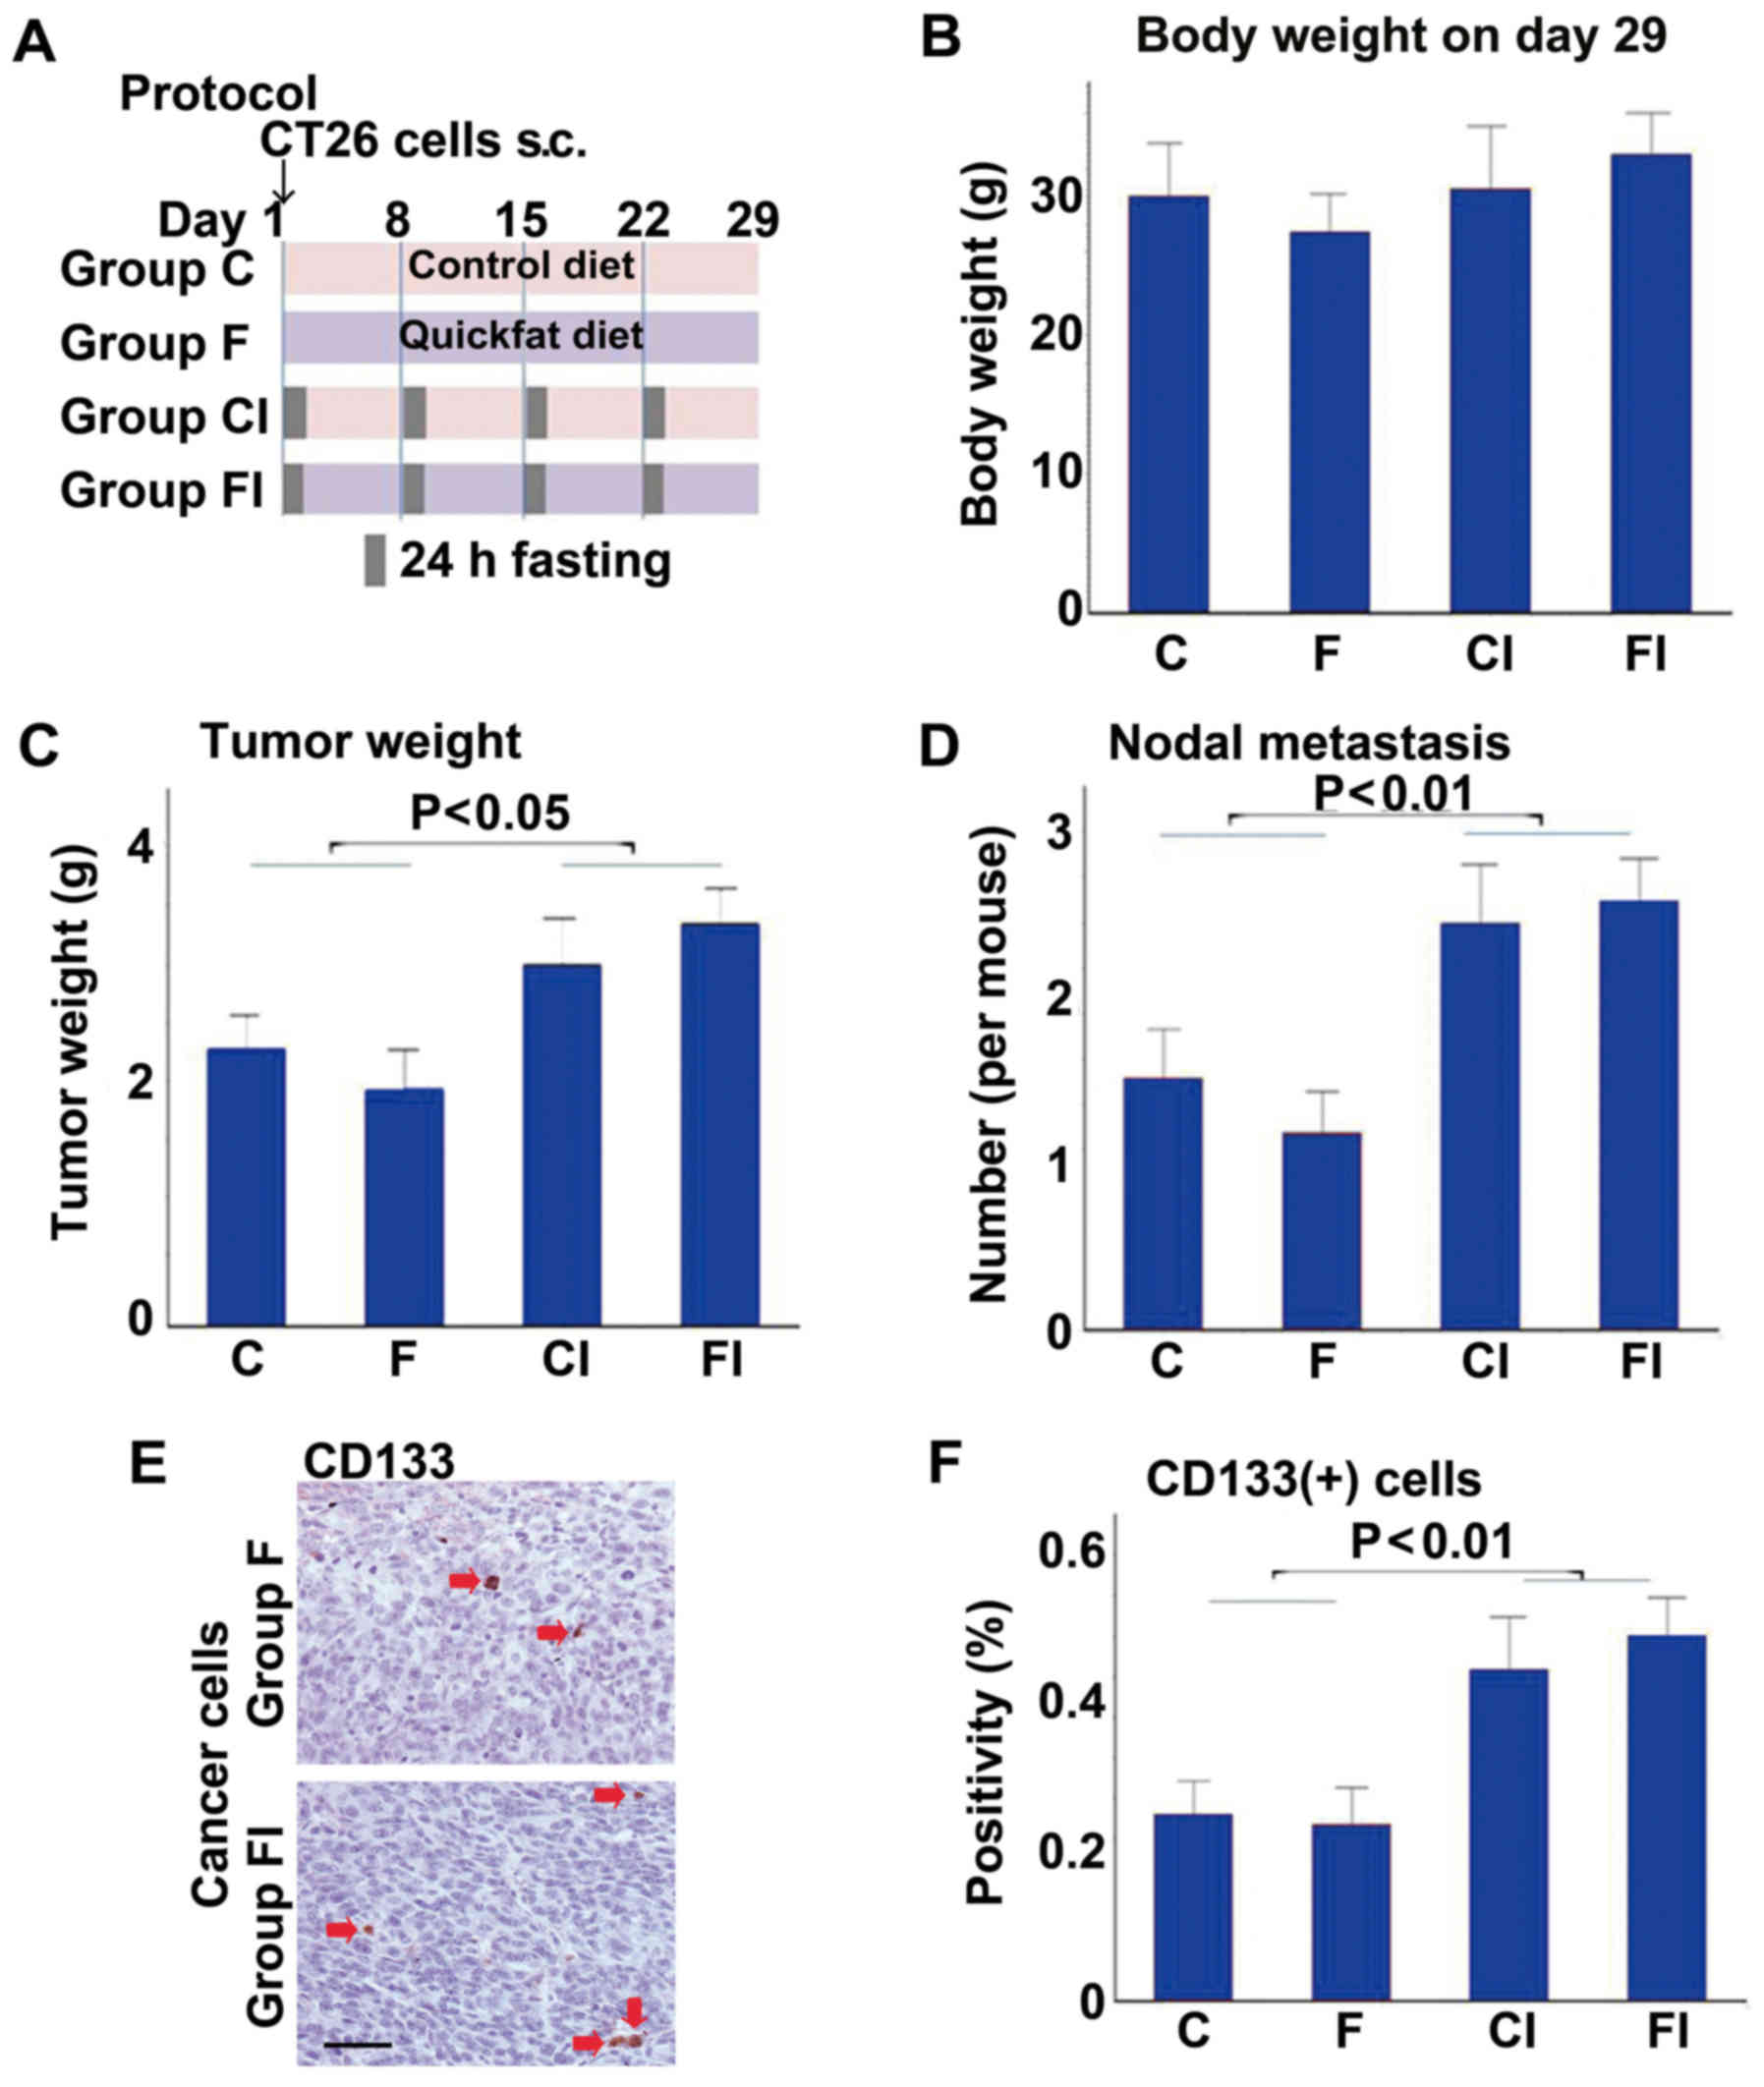
First, we assessed the effects of a high-fat
(Quickfat) diet on the growth of CT26 colon cell subcutaneous
tumors in BALB/c mice, with or without intermittent caloric
restriction (ICR) (Fig. 1). The
protocol is shown in Fig. 1A. No
differences in body weight were observed between the groups
(Fig. 1B); however, mice fed the
control or high-fat diet had heavier tumors and more nodal
metastases when subjected to ICR (groups CI and FI, respectively),
compared to the mice not subjected to ICR (groups C and F,
respectively) (Fig. 1C and D).
Likewise, the tumors of mice subjected to ICR (groups CI and FI)
contained significantly greater numbers of cells positive for
CD133, a marker of CSCs, than those in the non-ICR groups (groups C
and F) (Fig. 1E and F).
Effect of ICR on cancer cell
stemness
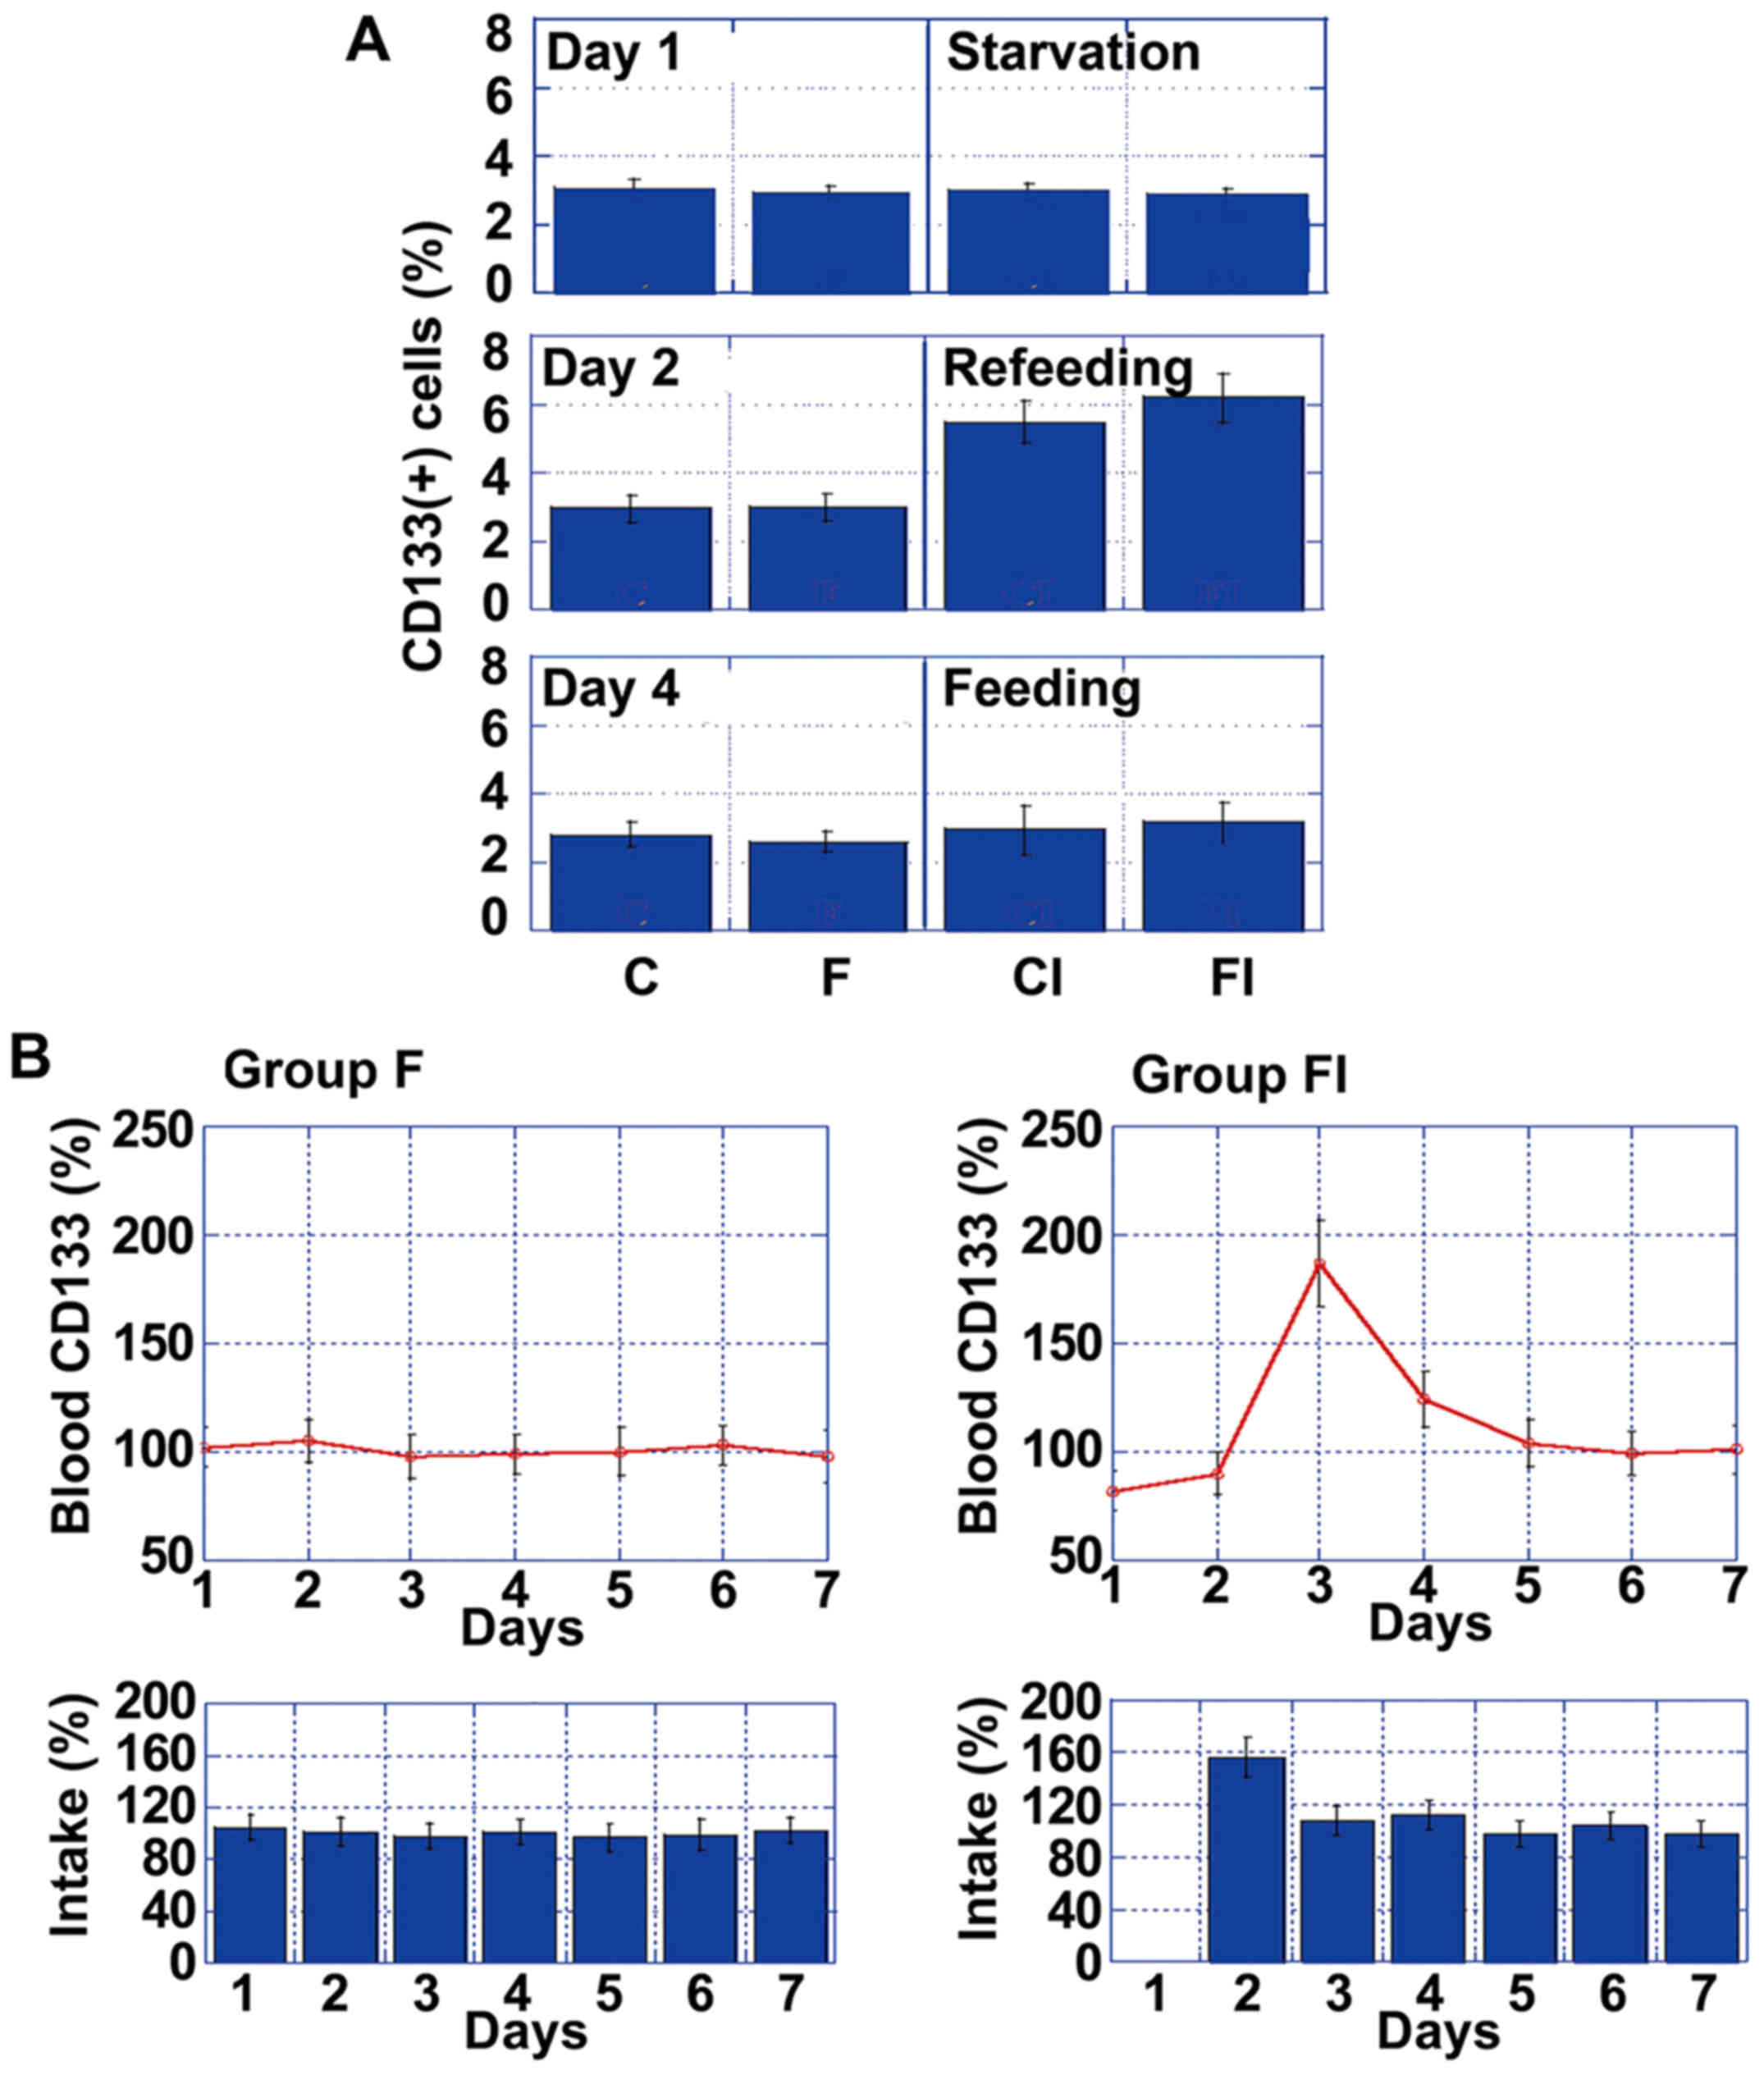
To assess the temporal effects of ICR on the number
of CD133+ cells in tumors, we compared CD133+
values on day 1 (fasting), day 2 (re-feeding) and day 4 (feeding)
in each of the 4 mouse groups (Fig.
2A). Notably, while there was no difference in the number of
CD133+ cells between the groups, by day 2, there was a
significant increase in the number of CD133+ cells in
the mice in groups CI and FI, compared to those in groups C and F.
However, the number of CD133+ cells in the mice in
groups CI and FI decreased to baseline levels by day 4.
To examine the effect of ICR, we focused on the
differences between group F and FI, which were markedly affected by
ICR. Via daily comparisons of CD133 mRNA levels, we determined that
only the mice in group FI exhibited a transient increase in CD133
expression levels on day 2, which then returned gradually to the
control levels (Fig. 2B). Thus,
increased CD133 mRNA blood levels might be affected by daily food
intake, particularly by over-intake.
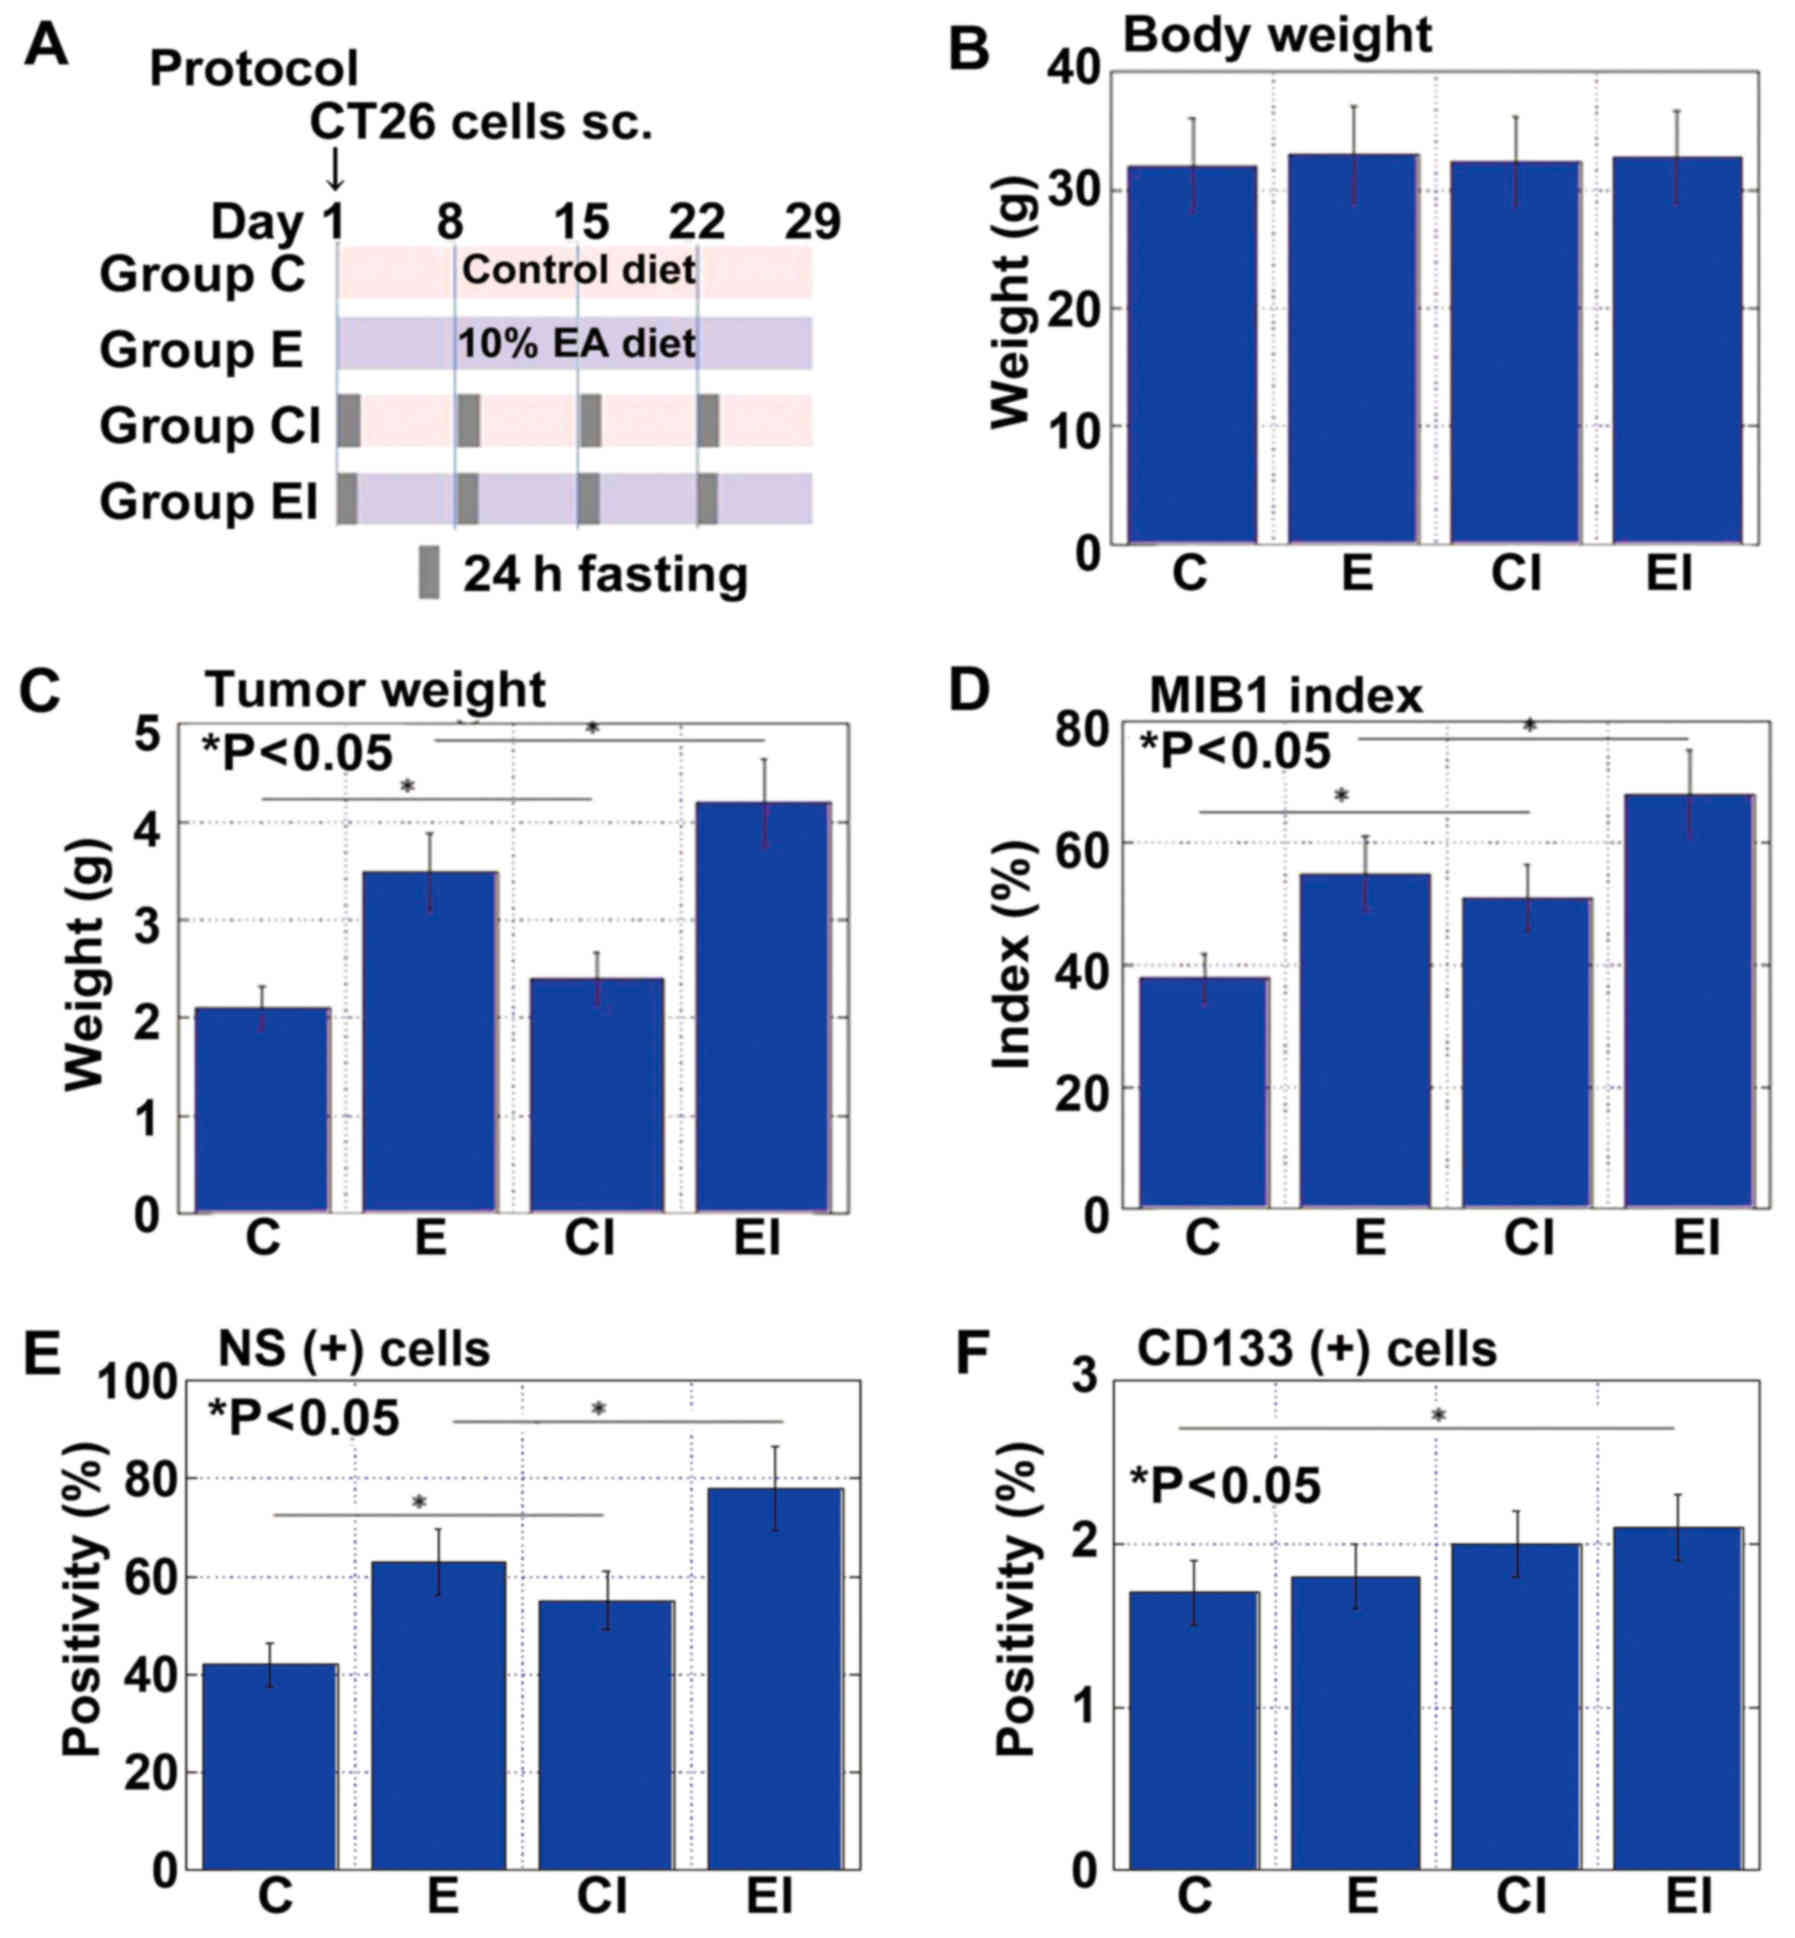
Effect of an EA-enriched diet with ICR on
tumor growth and CSCs
We previously reported that EA (C18:2, trans)
modulates CSCs and affects cancer metastability (22,23).
Accordingly, in this study, the effects of EA on tumor growth were
examined in the same mouse subcutaneous tumor model used above
(Fig. 3A). Body weight was
indistinguishable between the mice fed an EA-enriched diet with
(group EI) or without ICR (group E) or the control diet with (group
CI) or without ICR (group C) (Fig.
3B). Tumor weight and cell growth (MIB1 index) were most
pronounced in the mice in group EI, followed by those in group E
(Fig. 3C and D). Whereas the tumor
weight did not differ between the two control groups, the MIB1
index was higher in the mice in CI than in those in group C.
NS+ cells were also most abundant in mice in group EI,
followed by those in groups E and CI (Fig. 3E). By contrast, the
CD133+ cells were most frequent in mice in group EI,
followed by those in groups CI and E (Fig. 3F).
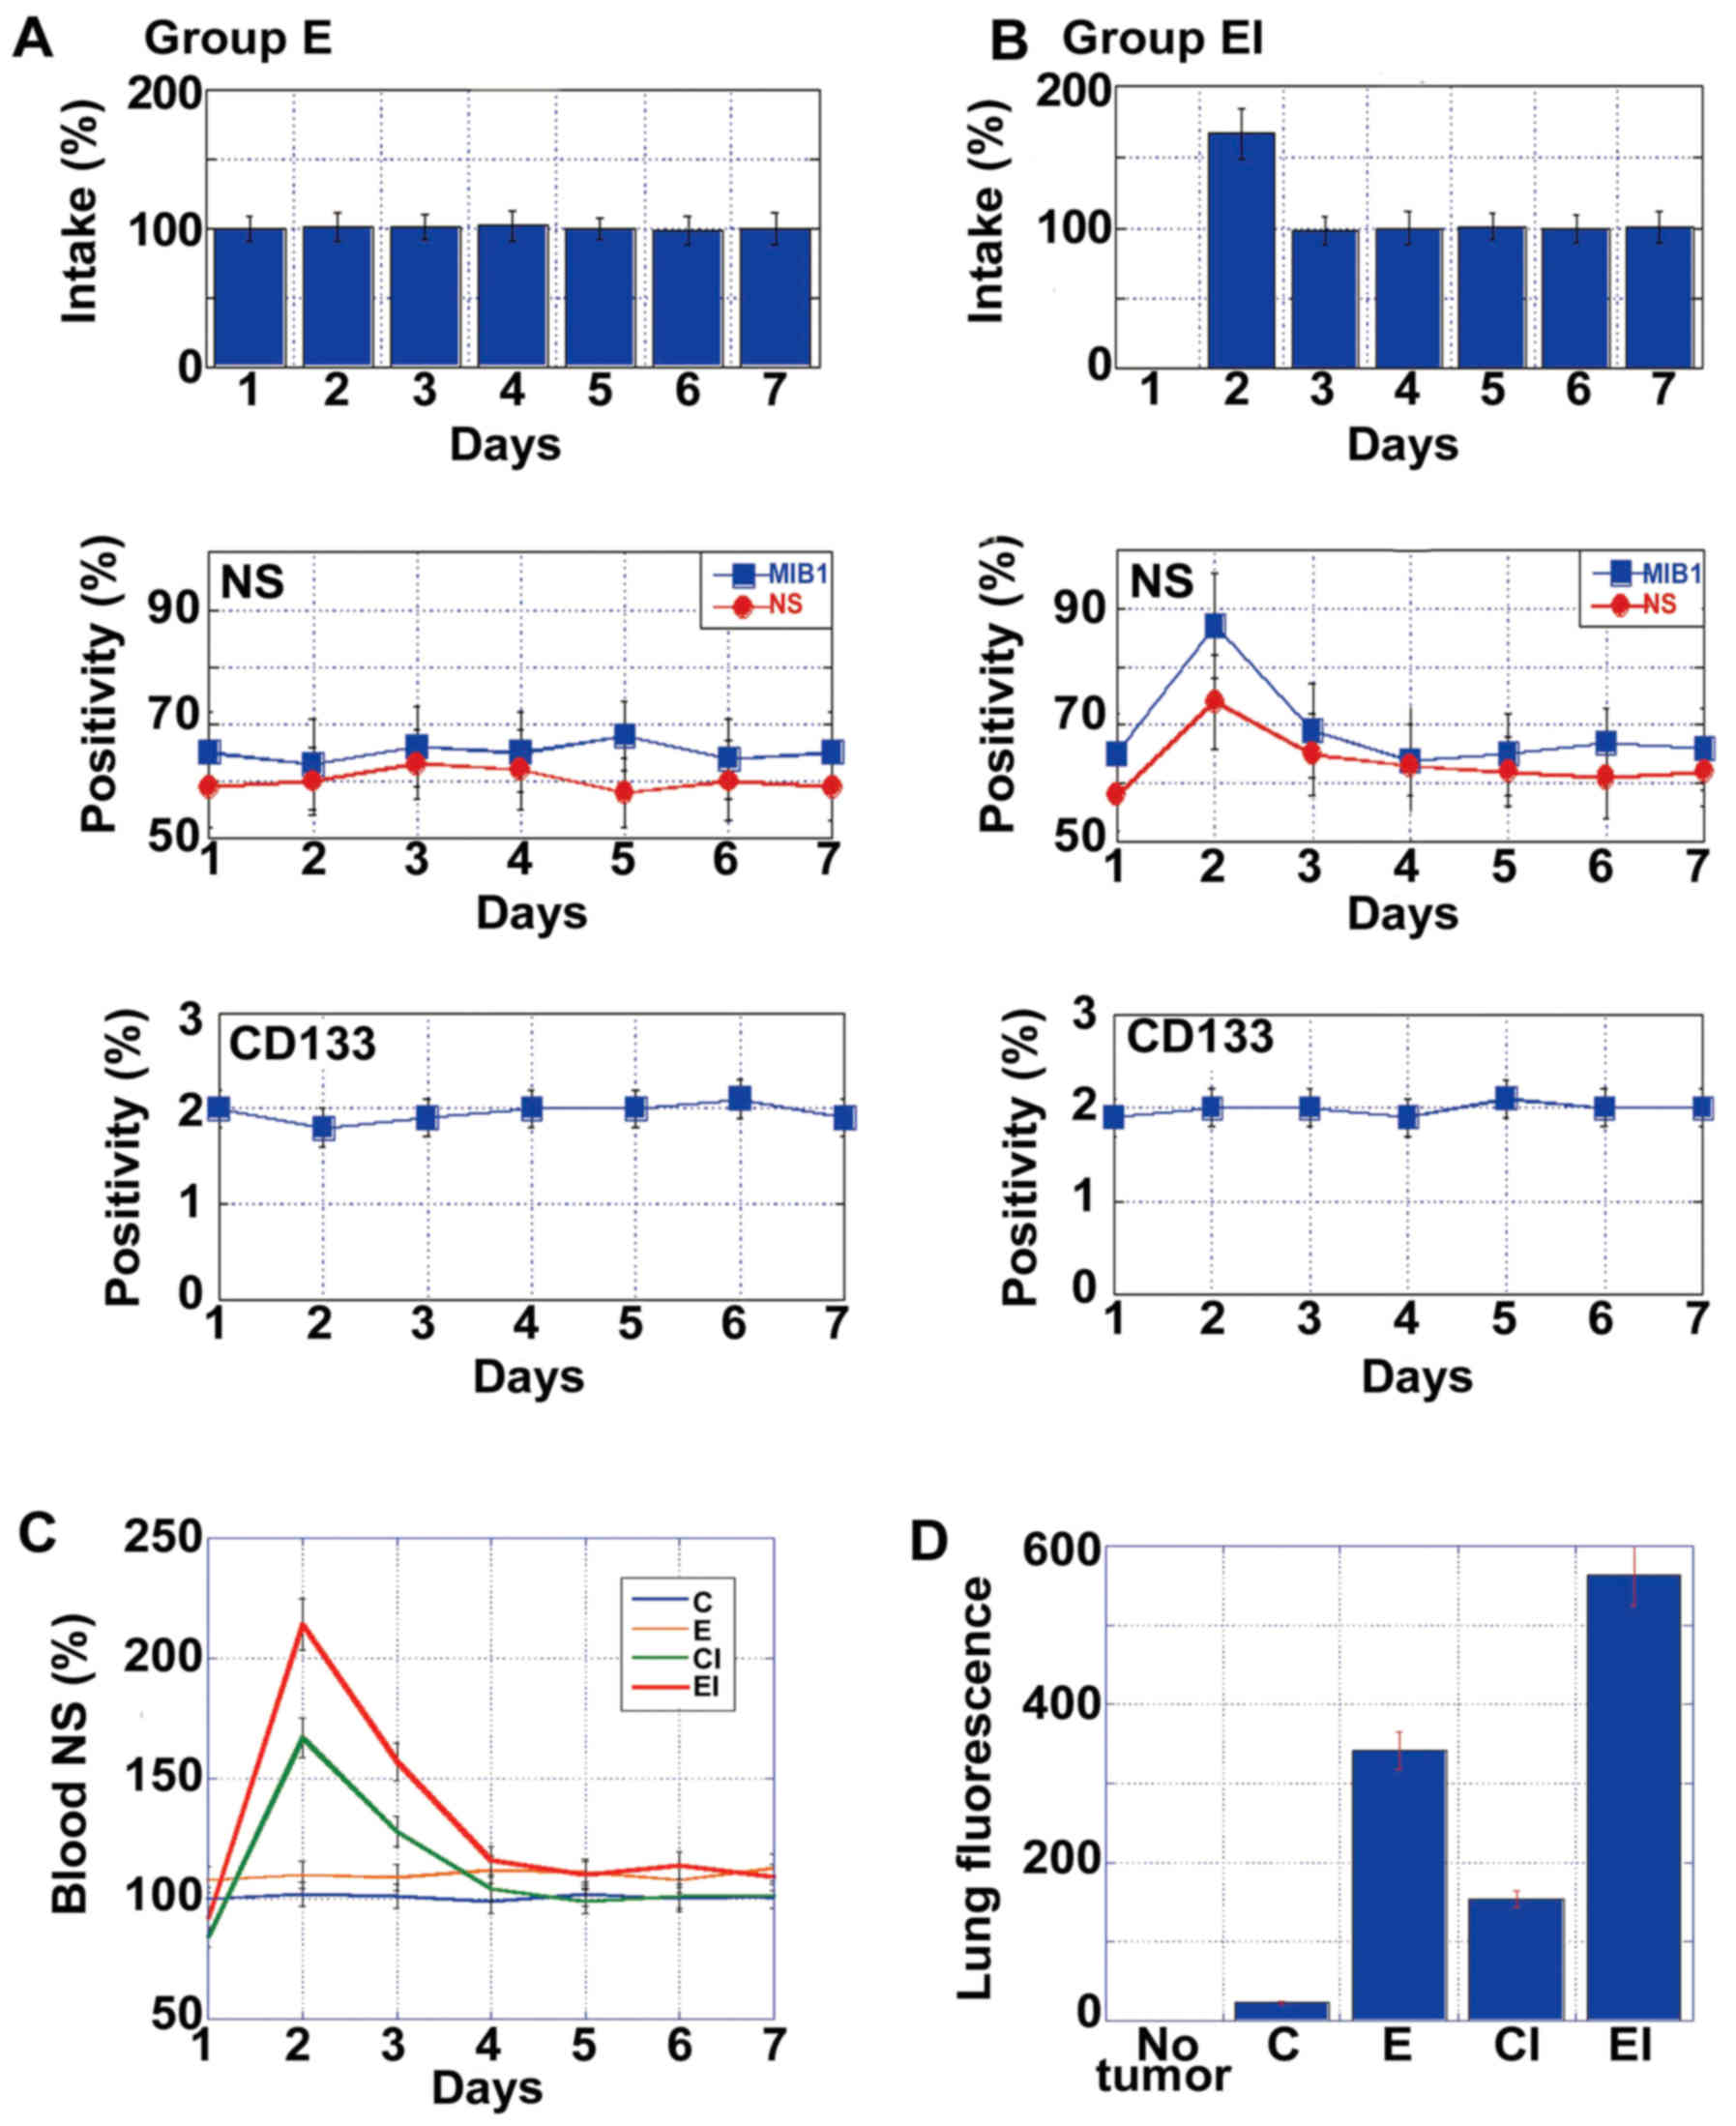
Effect of an EA-enriched diet with ICR on
metastasis
To examine the effects of an EA-enriched diet with
ICR on metastasis, mice in groups E and EI were starved on day 1
(Fig. 4A and B, respectively) and
then provided the appropriate diet for the remainder of the week
and for 4 weeks. Whereas no significant changes in metastasis were
observed in the mice in group E, those in group EI exhibited
increased numbers of NS+ cells and an increased MIB1
index on day 2. By contrast, there was no change in the numbers of
CD133+ cells in either group at this time-point. As
shown in Fig. 4C, the mice
subjected to ICR (groups CI and EI) exhibited a surge in NS mRNA
levels in the blood on the day after starvation. At 4 weeks after
inoculation, micrometa-static foci were detected in the lungs by
immunofluorescence using anti-EGFR antibody (18). The intensity of fluorescence
increased in the following order: C < CI < E < EI
(Fig. 4D). Specifically, the
intensities in CI and EI groups increased to levels 1.8- and 6-fold
greater than those observed in groups C and E, respectively.
Comparison of EA-associated pro-tumoral
effect between ICR and CCR
Subsequently, we examined the effects of ICR on the
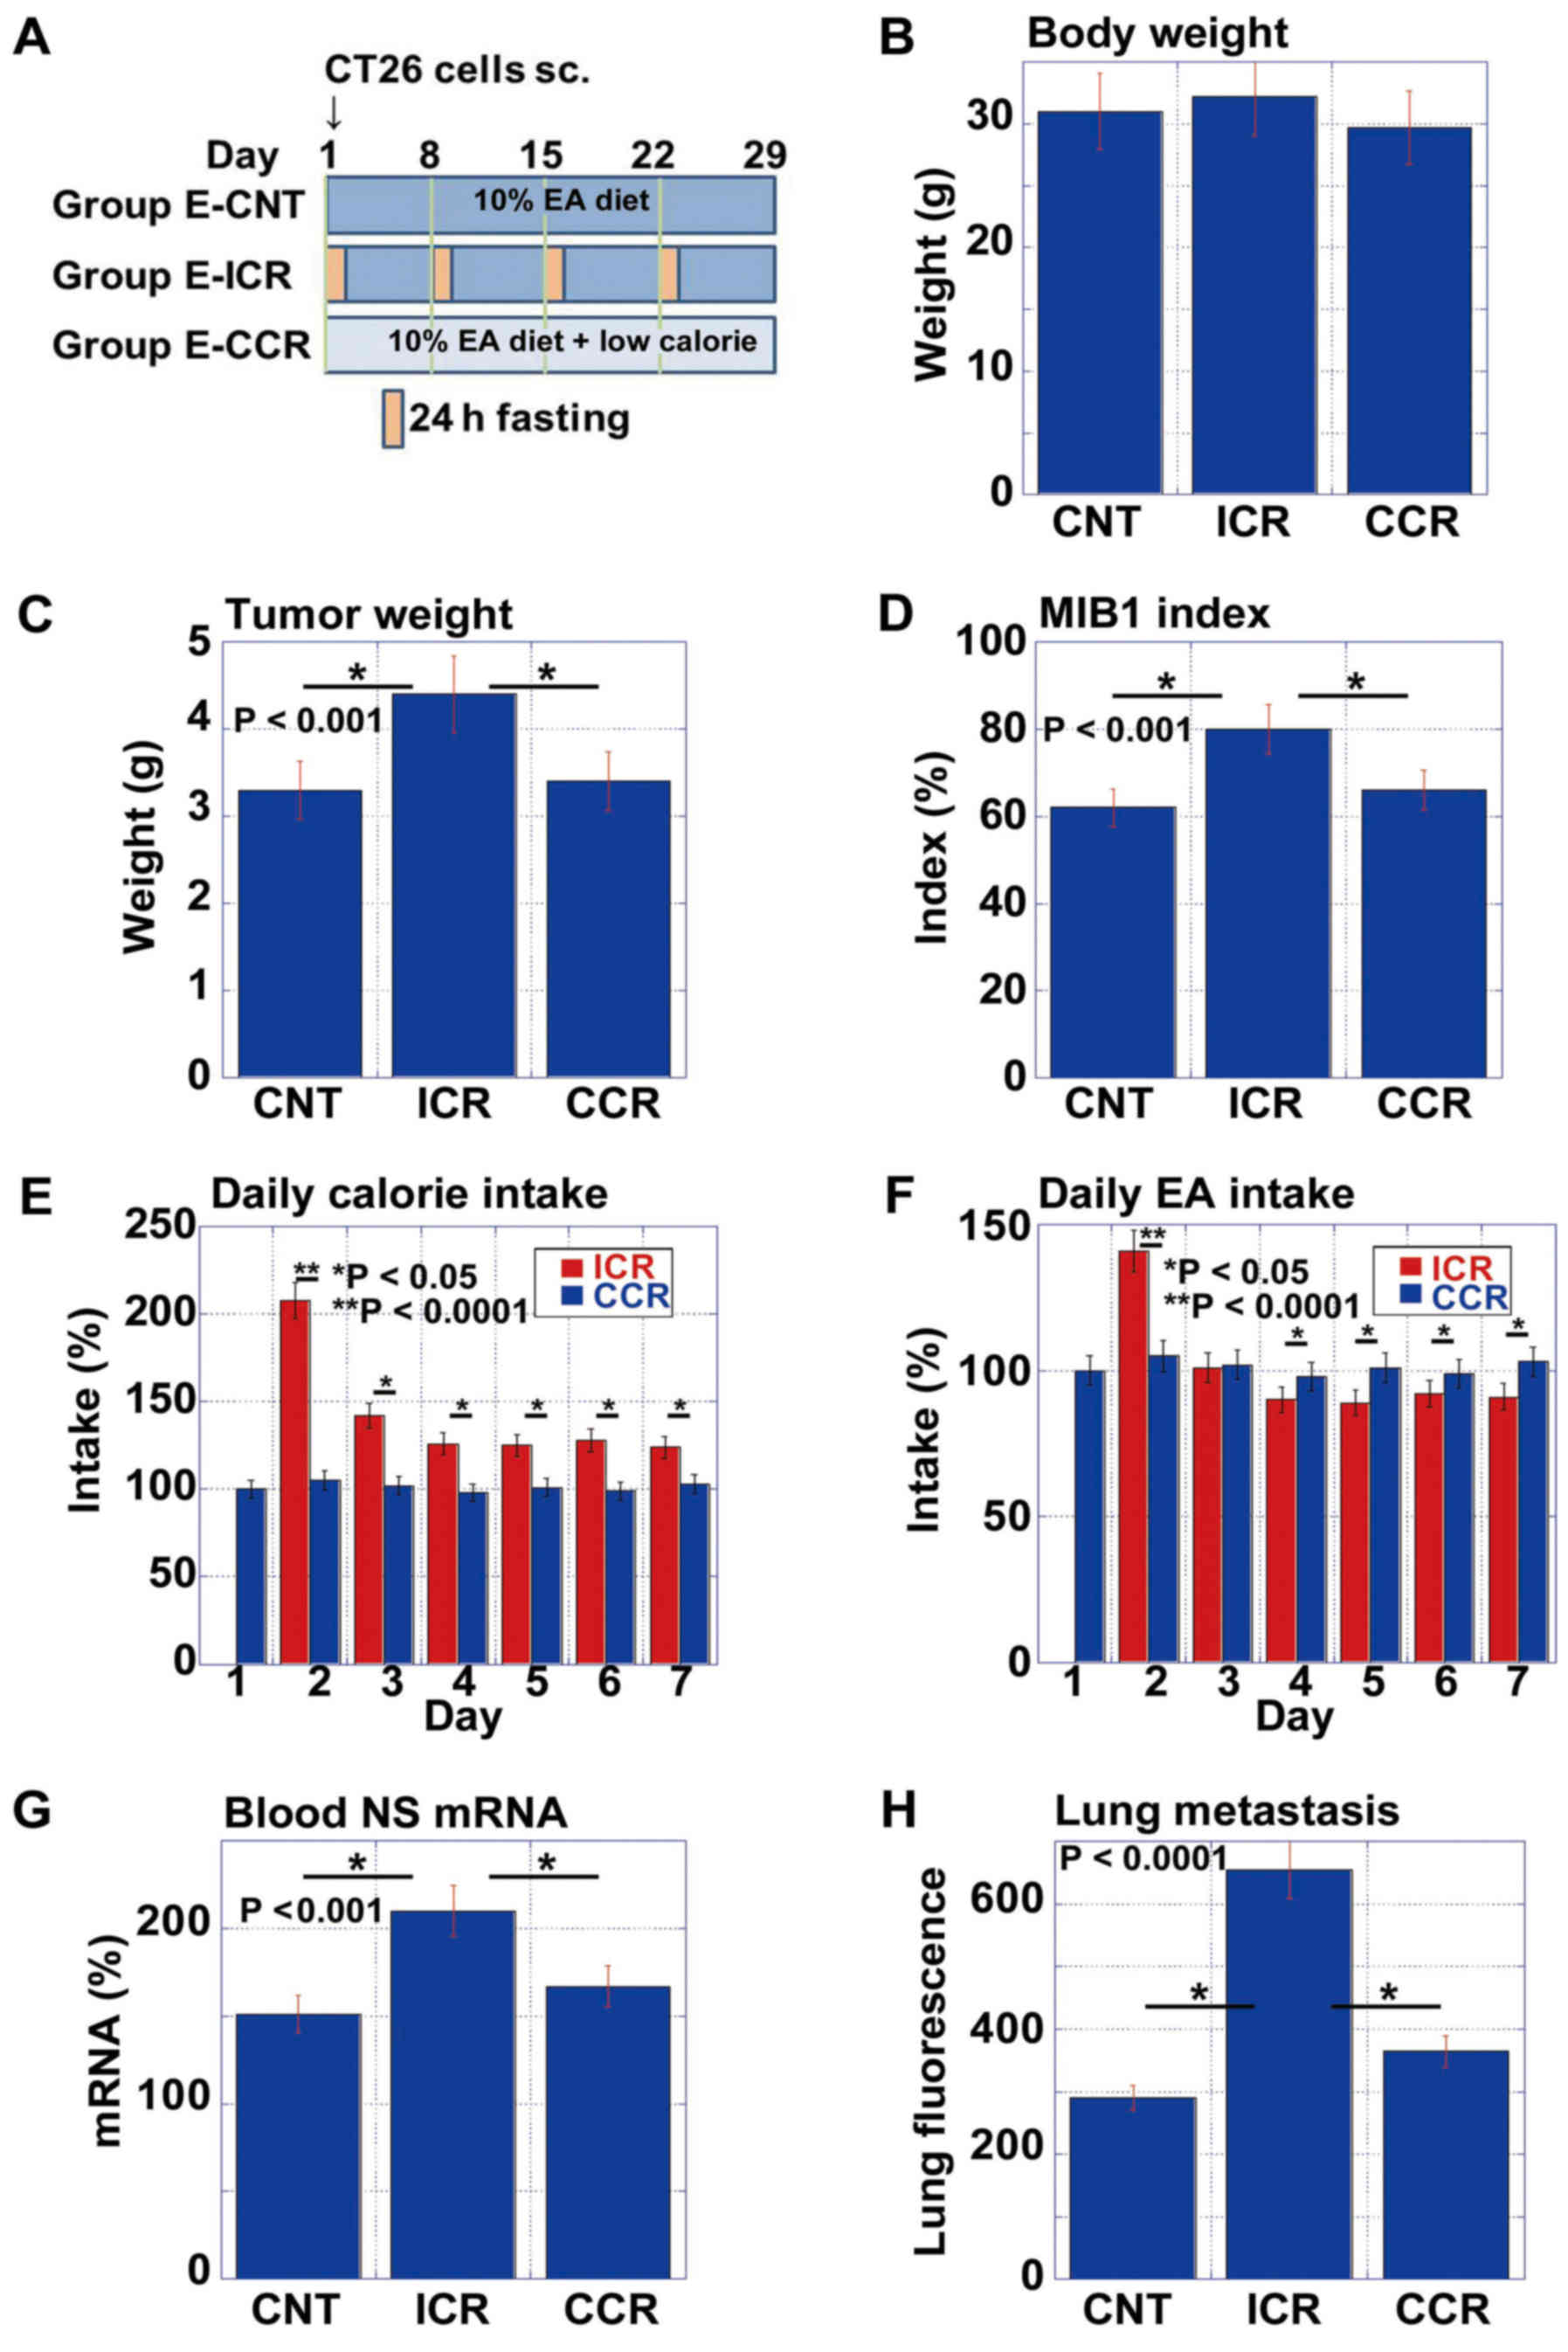
pro-tumoral effect of EA in comparison with CCR (Fig. 5). We prepared the low calorie diet
by mixing the standard diet (CE-2) with edible cellulose at a 7:1
ratio. This food therefore contained 70% of the calories of the
CE-2 diet. As shown in the protocol (Fig. 5A), the mice were divided into 3
groups as follows: the no calorie restriction with 10% EA (E-CNT),
ICR with 10% EA (E-ICR) and CCR with 10% EA (E-CCR) groups. While
there were no differences in body weight between the 3 groups on
day 29, the mice in the E-ICR group exhibited increased tumor
weights and MIB1 index scores, compared to those in the E-CNT or
E-CCR groups (Fig. 5C and D).
The examination of daily caloric intakes indicated
that mice in the E-CCR group ate a smaller volume of food to reach
80% of the calorie intake of mice in the E-ICR group on
non-starvation day (the expected calorie intake was 70% in E-CCR
group) (Fig. 5E). Specifically,
the mice in the E-CCR group consumed 83% of the calories as those
in the E-ICR group weekly. However, this over-intake of food
resulted in an enhanced EA intake (117%) in mice provided with
E-CCR (Fig. 5F), compared to those
provided the E-ICR diet.
To confirm the observed surge in stem cell marker
expression in the blood (Figs. 2
and 4), we measured the mRNA
expression levels of NS in the blood samples from each mouse on day
2 (Fig. 5G). Notably, the mice in
the E-ICR group, but not those in the E-CCR group, exhibited an
enhanced NS mRNA expression. Likewise, lung micrometastasis was
increased in mice provided the E-ICR diet, but not in those given
the E-CCR diet (Fig. 5H).
Effect of post-starvation overconsumption
on energy metabolism, stemness and the EMT phenotype in CT26
cells
To examine the energy metabolism and stemness
phenotypes of CT26 tumors in the post-starvation phase, tumors
harvested between the starvation and post-starvation phase were
compared in mice fed the control or 10% EA diet (Table I). In both groups, blood sugar
concentrations were elevated 2-fold in the post-starvation
(over-intake) phase, compared to the starvation phase. Likewise,
the levels of cell proliferation (MIB1) and stemness (NS) markers
were also increased in the post-starvation phase. Notably, while
energy was primarily produced via oxidative phosphorylation
(OXPHOS) during starvation, cells exhibited a switch to
glycolysis/lactate fermentation (GL/LF)-mediated energy production
during the post-starvation phase, which was accompanied by a
decrease in ROS production.
 | Table IComparison of tumors in starvation
phase with those in the post-starvation (over-intake) phase. |
Table I
Comparison of tumors in starvation
phase with those in the post-starvation (over-intake) phase.
| Control diet
| 10% EA diet
|
|---|
| Starvation | Over-intake | P-valuea | Starvation | Over-intake | P-valuea |
|---|
| Blood sugar
(mg/dl) | 78±8.2 | 148±16 | <0.0001 | 84±9.1 | 167±18.4 | <0.0001 |
| MIB1 positivity
(%) | 48±3.1 | 65±5.8 | <0.001 | 62±6.3 | 88±7.4 | <0.001 |
| NS positivity
(%) | 44±3.2 | 62±7.1 | <0.001 | 55±6.4 | 76±6.2 | <0.001 |
| O2
consumption (kpiu)b | 7.5±0.51 | 4.5±0.25 | <0.0001 | 8.9±0.59 | 4.2±0.18 | <0.0001 |
| Lactate (pM) | 2.1±0.31 | 7.2±0.60 | <0.0001 | 2.4±0.15 | 8.7±0.66 | <0.0001 |
| ROS (%)c | 100±12 | 57±7 | <0.0001 | 121±11 | 63±5 | <0.0001 |
To confirm the effects of sequential increases in
blood glucose concentrations on energy metabolism and stemness, the
CT26 cells were cultivated in medium containing 75 mg/dl glucose,
followed by medium containing 150 mg/dl glucose (Table II). These glucose concentrations
were selected to simulate those observed in the blood of mice, as
shown in Table I. The CT26 cells
cultured in the presence of 150 mg/dl glucose exhibited increased
cell proliferation, stemness and GL/LF, and decreased OXPHOS and
ROS production, compared to those cultivated in the presence of 75
mg/dl glucose.
| Table IIComparison of CT26 cells cultured
under hypoglycemic and normoglycemic conditions. |
Table II
Comparison of CT26 cells cultured
under hypoglycemic and normoglycemic conditions.
| Glucose
concentration (mg/dl)
|
|---|
| 75 | 150 | P-valuea |
|---|
| MIB1 positivity
(%) | 45±4.9 | 70±6.2 | <0.01 |
| NS positivity
(%) | 40±4.1 | 58±6.1 | <0.05 |
| O2
consumption (kpiu)b | 8.75±0.626 | 4.78±0.302 | <0.001 |
| Lactate (pM) | 1.9±0.22 | 8.1±0.71 | <0.001 |
| ROS (%)c | 100±9 | 62±7 | <0.01 |
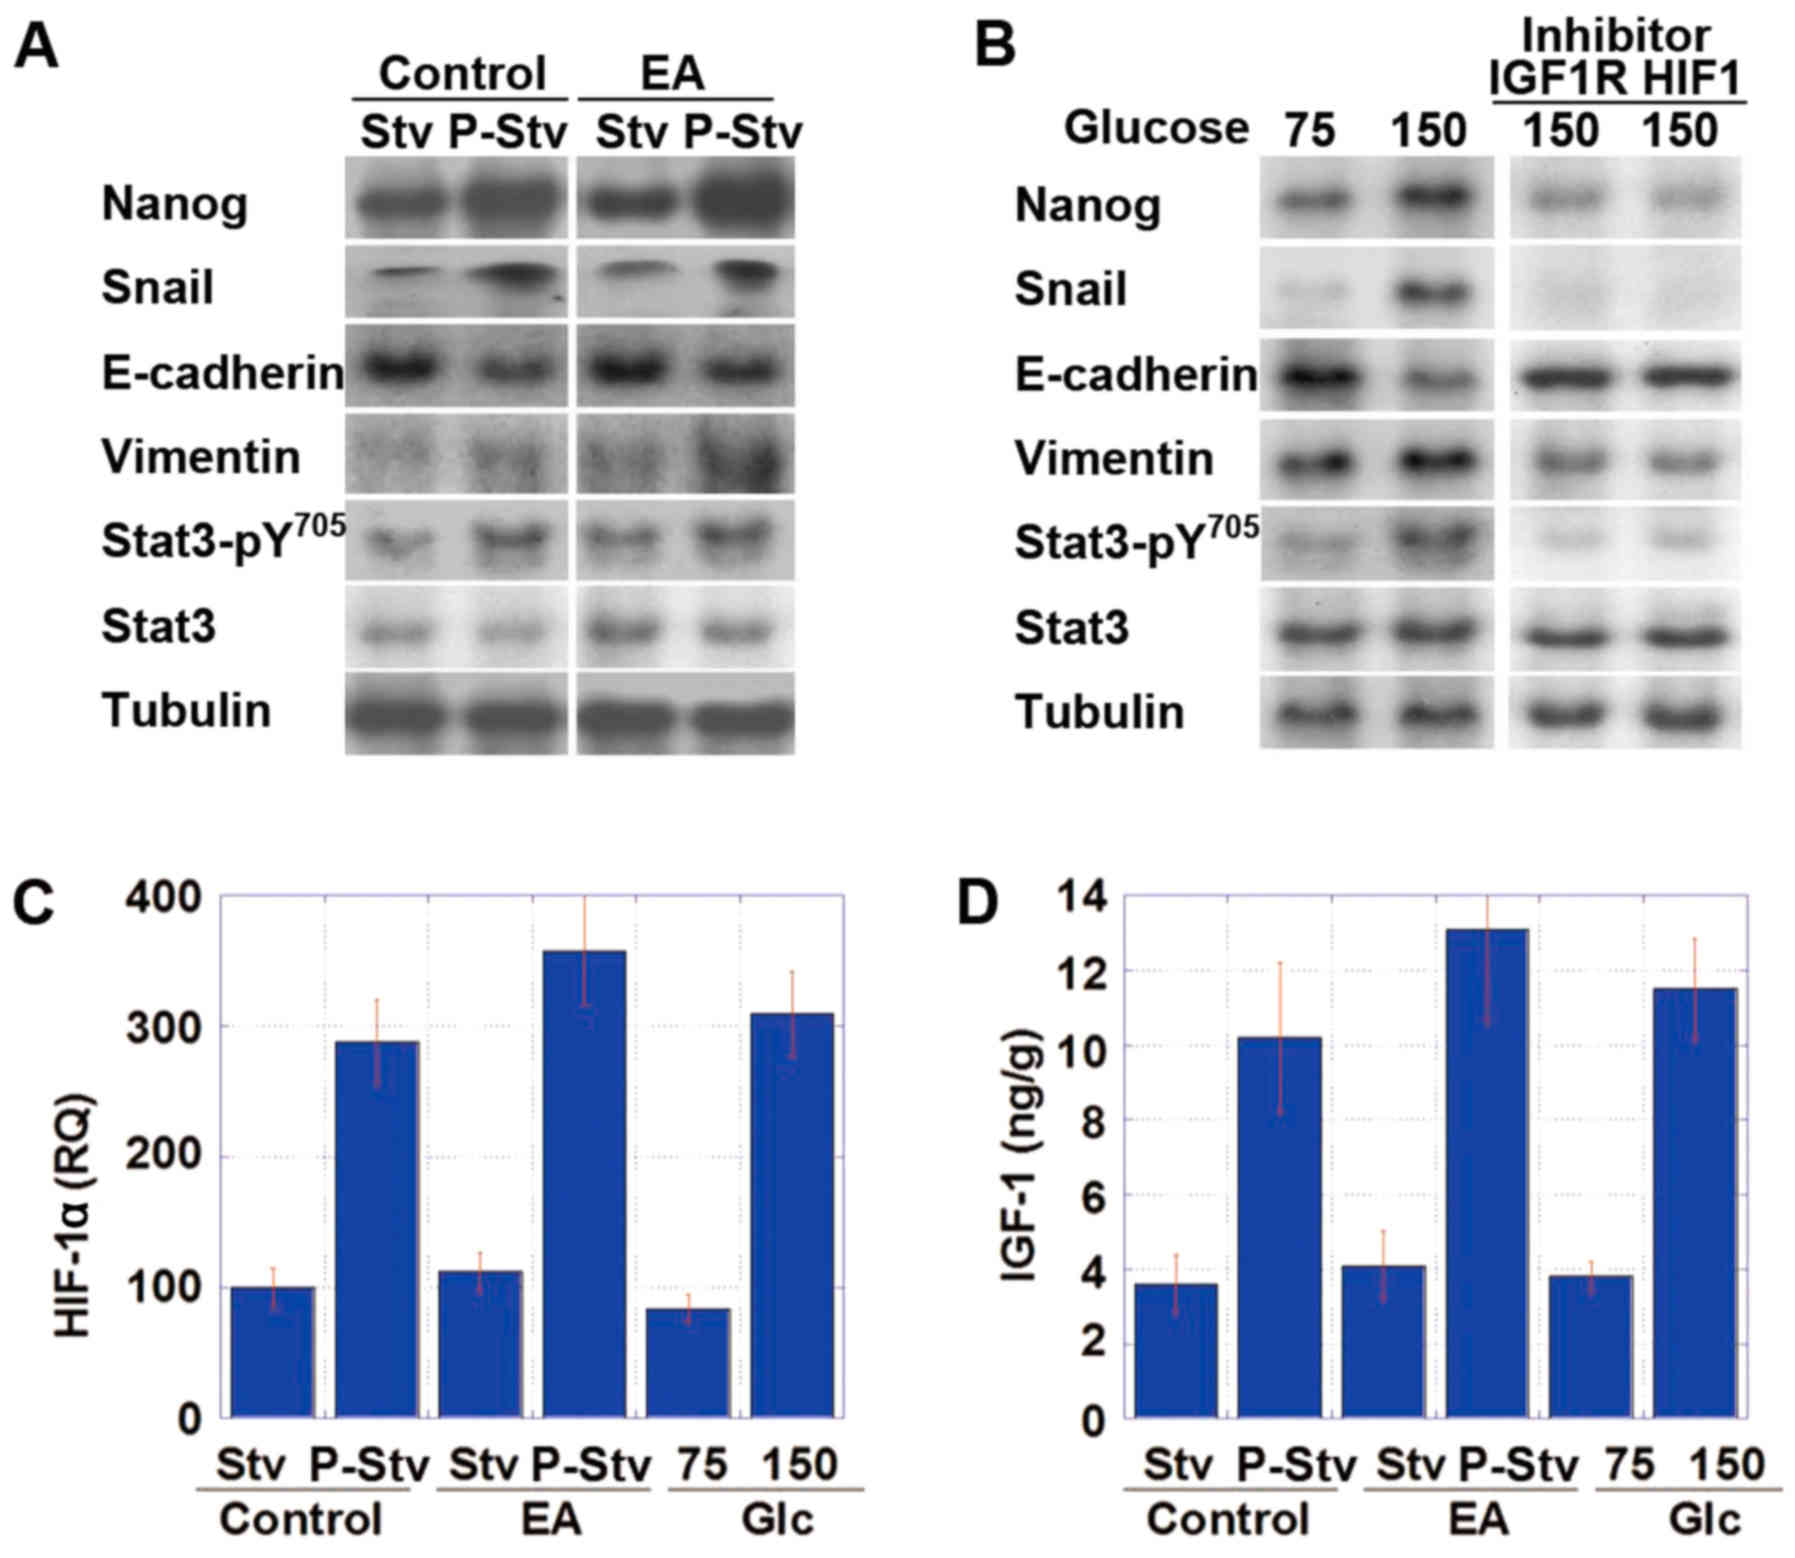
Subsequently, CT26 tumors in the animal model and
CT26 cells in in vitro treatment were subjected to
immu-noblot analysis to compare the expression levels of EMT- and
stemness-specific proteins between the starvation phase and
post-starvation phase and between cultivation with 75 and 150 mg/dl
glucose, respectively (Fig. 6A and
B). The tumors harvested during the post-starvation phase or
the cells after cultivation in medium containing 150 mg/dl glucose
exhibited increases in Nanog expression (stemness marker), and in
Snail and vimentin expression (EMT markers), as well as decreased
E-cadherin expression and increased phosphorylation of Stat3,
compared to the cells harvested during the fasting period or after
cultivation in the presence of 75 mg/dl glucose. Moreover, these
cells exhibited an increase in the mRNA expression of HIF-1α and
the protein expression of IGF-1 (Fig.
6C and D).
To examine the signaling pathway associated with the
alterations observed during the post-starvation phase, the CT26
cells were treated with inhibitors of IGF-1R or HIF-1α (Table III). Both treatments,
respectively, abrogated the effects observed in CT26 cells cultured
in medium containing 150 mg/dl glucose, following medium containing
75 mg/dl glucose.
| Table IIIEffects of the inhibitors of IGF-1R
and HIF-1α on energy metabolism in CT26 cells. |
Table III
Effects of the inhibitors of IGF-1R
and HIF-1α on energy metabolism in CT26 cells.
| Glucose
concentration (mg/dl) | 150 | 150 | P-valuea | 150 | P-valuea |
|---|
| Inhibitor | None | IGF-1R | | HIF-1α | |
| MIB1 positivity
(%) | 71±6.5 | 45±4 | <0.01 | 42±3.1 | <0.01 |
| NS positivity
(%) | 61±6.3 | 42±4.4 | <0.05 | 40±3.5 | <0.01 |
| O2
consumption (kpiu)b | 4.67±0.298 | 7.44±0.752 | <0.001 | 7.58±0.788 | <0.001 |
| Lactate (pM) | 7.9±0.84 | 2.2±0.24 | <0.001 | 2.0±0.25 | <0.001 |
| ROS (%)c | 64±7 | 99±10 | <0.01 | 103±11 | <0.01 |
Discussion
In this study, we examined the effects of ICR on
tumor growth using a mouse syngeneic subcutaneous tumor model. Our
findings demonstrated that instead of having a tumor suppressive
effect, ICR promoted tumor growth and increased the number of CSCs.
Such a pro-tumoral effect was suggested to depend on the induction
of a starvation-overeating cycle.
In designing the ICR experiments, starvation for 1
day/week was expected to decrease dietary calorie intake by 14%.
However, overeating after starvation abrogated CR, and dietary
calorie loss was only 1.5%. This was clearly confirmed by the lack
of any difference in body weight between the mice subjected to ICR
and those not subjected to ICR. Strictly speaking, our experimental
design therefore achieved dietary restriction, but not CR. Dietary
restriction is defined as intermittent fasting without CR (1) and has been shown to effectively
prolong lifespan with minimal adverse effects (1), as well as to ameliorate obesity and
type-2 diabetes (24,25).
We also compared our ICR mouse model with a CCR
mouse model. While CCR model achieved an ~80% loss in dietary
calorie intake each day, the mice in the CCR group exhibited no
suppression of tumor growth, compared with those receiving a normal
diet (group CNT). In the context of an EA-enriched diet, CCR may
therefore not be effective for tumor suppression; however, CCR did
not enhance tumor growth. The animals subjected to CCR also
exhibited no increase in lung micrometastasis in comparison to the
mice in the ICR group. These findings suggest that CCR may not
affect cancer growth or metastasis.
Mice receiving either an EA-enriched diet or the
control diet with ICR exhibited marked increases in lung
micrometastasis, compared to the control animals. Likewise, both
groups of mice exhibited surges in the mRNA expression of
stemness-associated genes within the blood. These findings suggest
that the release of CSCs into the blood may be associated with the
starvation-overeating cycle.
To assess the mechanisms underlying the effect of
post-starvation food overconsumption on metastasis, we compared
energy production, stemness and EMT phenotype in CT26 cells both
in vivo and in vitro. From the starvation phase to
the post-starvation phase, blood sugar concentrations were
increased 2-fold in mouse tumors in vivo. The transition
from the low- to high-glucose conditions altered the primary energy
production pathway from the OXPHOS pathway to GL/LF, which is
compatible with the Crabtree effect. The Crabtree effect (26) is associated with an increase in
stemness and acquisition of the EMT phenotype through the
IGF-1/HIF1-α/Nanog/Stat3 signaling pathway, and HIF-1α expression
is upregulated by hyperglycemia (27). IGF-1 and AKT are known as the
non-hypoxic HIF-1α induction pathway (28). In particular, the
hypoglycemic-hyperglycemic transition promotes IGF-1 expression
(29,30), and AKT is located downstream of
IGF-1 in this pathway (31).
Moreover, HIF-1α is a key factor necessary for switching the energy
production pathway from OXPHOS to GL/LF through the activation of
pyruvate dehydrogenase (32,33).
This switching induces higher levels of side population, and
promotes the expression of Nanog and Oct3/4 (34), which in turn activates stat3,
resulting in the induction of Snail and a subsequent EMT phenotype
(35,36). Thus, the Crabtree effect, a
temporal increment of the Warburg effect, may be closely associated
with the acquisition of metastatic potential in cancer cells.
EA is a main component of industrial dietary TFAs,
which play an important role in the progression and metastasis of
cancer, as well as in cardiovascular diseases (8,37).
The consumption of TFAs is associated with overeating behaviors
(38), which may result in a
preference for fast food or snacks containing TFAs (39). In this study, we focused on the
intake of EA under conditions of ICR. Such conditions can be
generalized to the intake of cancer-promoting compounds accompanied
by intermittent overeating.
Our data indicated that ICR led to a
starvation-overeating cycle. Intermittent feeding increases the
expression of orexigenic neurotransmitters, agouti-related peptide
and neuropeptide Y. In addition, ICR inhibits the expression of
pro-opiomelanocortin in the hypothalamus of rodents, even on
feeding days, thus explaining the overeating pattern observed in
this study (40,41). Feeding uncertainty may induce 'food
addiction', particularly to fat- and sugar-rich diets (42). This conclusion is supported by the
weight loss exhibited by the control diet group subjected to ICR,
but not by the high-fat and EA diet groups subjected to ICR in this
study.
In conclusion, overeating associated with ICR
abrogated CR and weight reduction in our models. Moreover,
overeating after ICR induced the Crabtree effect in cancer cells,
resulting in increased numbers of CSCs and cancer cells circulating
within the blood. The Warburg effect or glycolytic energy
production is linked closely with malignant phenotypes, such as
metastasis (43,44). Our data on ICR are compatible with
the mechanism. We also demonstrated that dietary EA was associated
with an increment in the metastatic potential of tumors by the
acquisition of the EMT phenotype. We have already previously
reported the mechanism of EA-induced EMT with the enhancement of
stemness (23).
Restriction-associated overeating may be the result of an
instinctive behavior. Our observations suggest that an irregular
dietary intake evoking the starvation-overeating cycle may endow
cancer cells with metastatic ability.
Acknowledgments
The authors would like to thank Ms. Tomomi Masutani
for her expert assistance with the preparation of this manuscript.
This study was supported by MEXT KAKENHI grant nos. 16H05164,
17K15648, 17K19923 and 16K19087.
References
|
1
|
Lee C and Longo V: Dietary restriction
with and without caloric restriction for healthy aging. F1000Res.
5:52016.
|
|
2
|
Allott EH and Hursting SD: Obesity and
cancer: Mechanistic insights from transdisciplinary studies. Endocr
Relat Cancer. 22:R365–R386. 2015. View Article : Google Scholar : PubMed/NCBI
|
|
3
|
Barnosky AR, Hoddy KK, Unterman TG and
Varady KA: Intermittent fasting vs daily calorie restriction for
type 2 diabetes prevention: A review of human findings. Transl Res.
164:302–311. 2014. View Article : Google Scholar : PubMed/NCBI
|
|
4
|
Varady KA: Intermittent versus daily
calorie restriction: Which diet regimen is more effective for
weight loss? Obes Rev. 12:e593–e601. 2011. View Article : Google Scholar : PubMed/NCBI
|
|
5
|
Johnstone A: Fasting for weight loss: An
effective strategy or latest dieting trend? Int J Obes. 39:727–733.
2015. View Article : Google Scholar
|
|
6
|
Lv M, Zhu X, Wang H, Wang F and Guan W:
Roles of caloric restriction, ketogenic diet and intermittent
fasting during initiation, progression and metastasis of cancer in
animal models: A systematic review and meta-analysis. PLoS One.
9:e1151472014. View Article : Google Scholar : PubMed/NCBI
|
|
7
|
Thompson HJ and McTiernan A: Weight
cycling and cancer: Weighing the evidence of intermittent caloric
restriction and cancer risk. Cancer Prev Res (Phila). 4:1736–1742.
2011. View Article : Google Scholar
|
|
8
|
Calder PC: Functional roles of fatty acids
and their effects on human health. JPEN J Parenter Enteral Nutr.
39(Suppl 1): 18S–32S. 2015. View Article : Google Scholar : PubMed/NCBI
|
|
9
|
Rose DP: Dietary fatty acids and cancer.
Am J Clin Nutr. 66(Suppl 4): 998S–1003S. 1997.PubMed/NCBI
|
|
10
|
Kuniyasu H, Ohmori H and Fujii K:
Significance of trans fatty acids in colorectal cancer. Current
Research in Cancer. 9. Sunitha M: Research Media; Kerala, India:
pp. 21–29. 2015
|
|
11
|
Food and Drug Administration: Final
Determination Regarding Partially Hydrogenated Oils. 2015
|
|
12
|
Cascio G, Schiera G and Di Liegro I:
Dietary fatty acids in metabolic syndrome, diabetes and
cardiovascular diseases. Curr Diabetes Rev. 8:2–17. 2012.
View Article : Google Scholar : PubMed/NCBI
|
|
13
|
Mozaffarian D, Aro A and Willett WC:
Health effects of trans-fatty acids: Experimental and observational
evidence. Eur J Clin Nutr. 63(Suppl 2): S5–S21. 2009. View Article : Google Scholar : PubMed/NCBI
|
|
14
|
Zong WX, Rabinowitz JD and White E:
Mitochondria and Cancer. Mol Cell. 61:667–676. 2016. View Article : Google Scholar : PubMed/NCBI
|
|
15
|
Warburg O: On respiratory impairment in
cancer cells. Science. 124:269–270. 1956.PubMed/NCBI
|
|
16
|
Kellenberger LD, Bruin JE, Greenaway J,
Campbell NE, Moorehead RA, Holloway AC and Petrik J: The role of
dysregulated glucose metabolism in epithelial ovarian cancer. J
Oncol. 2010:5143102010. View Article : Google Scholar : PubMed/NCBI
|
|
17
|
Dell' Antone P: Energy metabolism in
cancer cells: How to explain the Warburg and Crabtree effects? Med
Hypotheses. 79:388–392. 2012. View Article : Google Scholar : PubMed/NCBI
|
|
18
|
Kuwada M, Chihara Y, Luo Y, Li X,
Nishiguchi Y, Fujiwara R, Sasaki T, Fujii K, Ohmori H, Fujimoto K,
et al: Pro-chemotherapeutic effects of antibody against
extracellular domain of claudin-4 in bladder cancer. Cancer Lett.
369:212–221. 2015. View Article : Google Scholar : PubMed/NCBI
|
|
19
|
Livak KJ and Schmittgen TD: Analysis of
relative gene expression data using real-time quantitative PCR and
the 2(−Delta Delta C(T)) method. Methods. 25:402–408. 2001.
View Article : Google Scholar
|
|
20
|
Kuniyasu H, Yano S, Sasaki T, Sasahira T,
Sone S and Ohmori H: Colon cancer cell-derived high mobility group
1/amphoterin induces growth inhibition and apoptosis in
macrophages. Am J Pathol. 166:751–760. 2005. View Article : Google Scholar : PubMed/NCBI
|
|
21
|
Kuniyasu H, Oue N, Wakikawa A, Shigeishi
H, Matsutani N, Kuraoka K, Ito R, Yokozaki H and Yasui W:
Expression of receptors for advanced glycation end-products (RAGE)
is closely associated with the invasive and metastatic activity of
gastric cancer. J Pathol. 196:163–170. 2002. View Article : Google Scholar : PubMed/NCBI
|
|
22
|
Ohmori H, Fujii K, Kadochi Y, Mori S,
Nishiguchi Y, Fujiwara R, Kishi S, Sasaki T and Kuniyasu H: Elaidic
acid, a trans-fatty acid, enhances the metastasis of colorectal
cancer cells. Pathobiology. 84:144–151. 2017. View Article : Google Scholar
|
|
23
|
Fujii K, Luo Y, Fujiwara-Tani R, Kishi S,
He S, Yang S, Sasaki T, Ohmori H and Kuniyasu H: Pro-metastatic
intracellular signaling of the elaidic trans fatty acid. Int J
Oncol. 50:85–92. 2017. View Article : Google Scholar
|
|
24
|
Hatori M, Vollmers C, Zarrinpar A,
DiTacchio L, Bushong EA, Gill S, Leblanc M, Chaix A, Joens M,
Fitzpatrick JA, et al: Time-restricted feeding without reducing
caloric intake prevents metabolic diseases in mice fed a high-fat
diet. Cell Metab. 15:848–860. 2012. View Article : Google Scholar : PubMed/NCBI
|
|
25
|
Zarrinpar A, Chaix A and Panda S: Daily
eating patterns and their impact on health and disease. Trends
Endocrinol Metab. 27:69–83. 2016. View Article : Google Scholar :
|
|
26
|
Crabtree HG: Observations on the
carbohydrate metabolism of tumours. Biochem J. 23:536–545. 1929.
View Article : Google Scholar : PubMed/NCBI
|
|
27
|
Wang Y, Zhu YD, Gui Q, Wang XD and Zhu YX:
Glucagon-induced angiogenesis and tumor growth through the
HIF-1-VEGF-dependent pathway in hyperglycemic nude mice. Genet Mol
Res. 13:7173–7183. 2014. View Article : Google Scholar : PubMed/NCBI
|
|
28
|
Xu Q, Zhang Q, Ishida Y, Hajjar S, Tang X,
Shi H, Dang CV and Le AD: EGF induces epithelial-mesenchymal
transition and cancer stem-like cell properties in human oral
cancer cells via promoting Warburg effect. Oncotarget. 8:9557–9571.
2017.
|
|
29
|
Lee C and Longo VD: Fasting vs dietary
restriction in cellular protection and cancer treatment: From model
organisms to patients. Oncogene. 30:3305–3316. 2011. View Article : Google Scholar : PubMed/NCBI
|
|
30
|
Guimarães TA, Farias LC, Santos ES, de
Carvalho Fraga CA, Orsini LA, de Freitas Teles L, Feltenberger JD,
de Jesus SF, de Souza MG, Santos SH, et al: Metformin increases PDH
and suppresses HIF-1α under hypoxic conditions and induces cell
death in oral squamous cell carcinoma. Oncotarget. 7:55057–55068.
2016. View Article : Google Scholar
|
|
31
|
Klement RJ and Champ CE: Calories,
carbohydrates, and cancer therapy with radiation: Exploiting the
five R's through dietary manipulation. Cancer Metastasis Rev.
33:217–229. 2014. View Article : Google Scholar : PubMed/NCBI
|
|
32
|
Shaw RJ: Glucose metabolism and cancer.
Curr Opin Cell Biol. 18:598–608. 2006. View Article : Google Scholar : PubMed/NCBI
|
|
33
|
Garcia-Heredia JM and Carnero A: Decoding
Warburg's hypothesis: Tumor-related mutations in the mitochondrial
respiratory chain. Oncotarget. 6:41582–41599. 2015. View Article : Google Scholar : PubMed/NCBI
|
|
34
|
Zhong Y, Li X, Yu D, Li X, Li Y, Long Y,
Yuan Y, Ji Z, Zhang M, Wen JG, et al: Application of mitochondrial
pyruvate carrier blocker UK5099 creates metabolic reprogram and
greater stem-like properties in LnCap prostate cancer cells in
vitro. Oncotarget. 6:37758–37769. 2015. View Article : Google Scholar : PubMed/NCBI
|
|
35
|
Yin X, Zhang BH, Zheng SS, Gao DM, Qiu SJ,
Wu WZ and Ren ZG: Coexpression of gene Oct4 and Nanog initiates
stem cell characteristics in hepatocellular carcinoma and promotes
epithelial-mesenchymal transition through activation of Stat3-Snail
signaling. J Hematol Oncol. 8:232015. View Article : Google Scholar
|
|
36
|
Liu S, Sun J, Cai B, Xi X, Yang L, Zhang
Z, Feng Y and Sun Y: NANOG regulates epithelial-mesenchymal
transition and chemoresistance through activation of the STAT3
pathway in epithelial ovarian cancer. Tumour Biol. 37:9671–9680.
2016. View Article : Google Scholar : PubMed/NCBI
|
|
37
|
Ganguly R and Pierce GN: Trans fat
involvement in cardiovascular disease. Mol Nutr Food Res.
56:1090–1096. 2012. View Article : Google Scholar : PubMed/NCBI
|
|
38
|
Prentice AM: Overeating: The health risks.
Obes Res. 9(Suppl 4): 234S–238S. 2001. View Article : Google Scholar : PubMed/NCBI
|
|
39
|
Costa N, Cruz R, Graça P, Breda J and
Casal S: Trans fatty acids in the Portuguese food market. Food
Control. 64:128–134. 2016. View Article : Google Scholar : PubMed/NCBI
|
|
40
|
Chausse B, Solon C, Caldeira da Silva CC,
Masselli Dos Reis IG, Manchado-Gobatto FB, Gobatto CA, Velloso LA
and Kowaltowski AJ: Intermittent fasting induces hypothalamic
modifications resulting in low feeding efficiency, low body mass
and overeating. Endocrinology. 155:2456–2466. 2014. View Article : Google Scholar : PubMed/NCBI
|
|
41
|
Lauzurica N, García-García L, Pinto S,
Fuentes JA and Delgado M: Changes in NPY and POMC, but not
serotonin transporter, following a restricted feeding/repletion
protocol in rats. Brain Res. 1313:103–112. 2010. View Article : Google Scholar
|
|
42
|
Corwin RL: The face of uncertainty eats.
Curr Drug Abuse Rev. 4:174–181. 2011. View Article : Google Scholar : PubMed/NCBI
|
|
43
|
Zhao J, Huang X, Xu Z, Dai J, He H, Zhu Y
and Wang H: LDHA promotes tumor metastasis by facilitating
epithelial mesenchymal transition in renal cell carcinoma. Mol Med
Rep. 16:8335–8344. 2017.PubMed/NCBI
|
|
44
|
Morandi A, Taddei ML, Chiarugi P and
Giannoni E: Targeting the metabolic reprogramming that controls
epithelial-to-mesenchymal transition in aggressive tumors. Front
Oncol. 7:402017. View Article : Google Scholar : PubMed/NCBI
|