Introduction
Gastric cancer (GC) is the third leading cause of
cancer-related mortality in both sexes worldwide (723,000 deaths,
8.8% of the total). The highest estimated mortality rates are in
Eastern Asia, and the lowest in Northern America (1). The GSE series that we finally
screened out included 315 samples from China and only 69 samples
from Italy, indicating the high incidence of GC in Asian countries.
The cause of death in patients with GC is mostly due to late
diagnosis, rapid metastatic spread and the limited effectiveness of
available therapeutics (2). As
regards the diagnosis of GC, histopathological diagnosis remains
the gold standard thus far; however, contrast-enhanced ultrasound
is useful in the differential diagnosis of gastric subepithelial
lesions and can guide further management and follow-up (3–5).
Nevertheless, the identification of one or several genes as
biomarkers for application in the non-invasive tumor molecular
diagnosis of GC, and the better understanding of GC pathogenesis is
essential for the establishment of diagnostic markers, as well as
novel therapeutic methods. In the treatment of GC, surgery alone is
often not very effective (6), even
in patients with relatively early stages of the disease. In an
attempt to reduce systemic recurrence following surgery alone,
adjuvant chemotherapy has been used in trials (7); however, the effects are still limited
(8). We thus are eager to
establish more effective diagnostic and treatment strategies by
examining GC at the genetic level. As the pathogenesis of GC
involves the dysfunction of molecular signaling pathways, many
efforts have been undertaken in recent years to emphasize the
molecular heterogeneity responsible for the process of
carcinogenesis (9,10). Currently, some of these aberrant
molecular signaling pathways are utilized as targets of
interventions with novel therapeutic agents, some of which are
already used in the treatment of GC, while others remain in the
phase of clinical trials (11). In
this study, through our results of data analysis, we aimed to shed
light on the identification of potential diagnostic and therapeutic
markers for GC.
The high-throughput platforms for the analysis of
gene expression, such as expression profiling microarrays (12), are increasingly valued as promising
tools in medical oncology with great clinical applications
(13–15). During the analysis of whole genome
sequencing results from different laboratories, the statistical
power is increased and the predictive power is more accurate;
moreover, the bias of individual studies can be overcome. The aim
of this study was to identify potential significant biomarkers for
the diagnosis and treatment of GC. For this purpose, we analyzed
the genomic signature of human GC.
In the present study, we downloaded the original
data (GSE13911, GSE19826, GSE79973 and GSE29272) from Gene
Expression Omnibus (GEO), which is a database repository which
archives and serves as a hub for microarray data deposit and
retrieval (16). Subsequently, the
differentially expressed genes (DEGs) were screened using R
language. To better clarify the pathological mechanisms, we
performed functional analysis and pathway enrichment analysis, such
as Gene Ontology (GO) and Kyoto Encyclopedia of Genes and Genomes
(KEGG) pathway enrichment analysis for common DEGs screened from
the 4 datasets (17). We hope that
our findings will provide further insight into gastric
carcinogenesis at the molecular level and may aid in the
identification of novel potential candidate biomarkers for
diagnosis, prognosis and drug targets in GC.
Materials and methods
Microarray data preprocessing
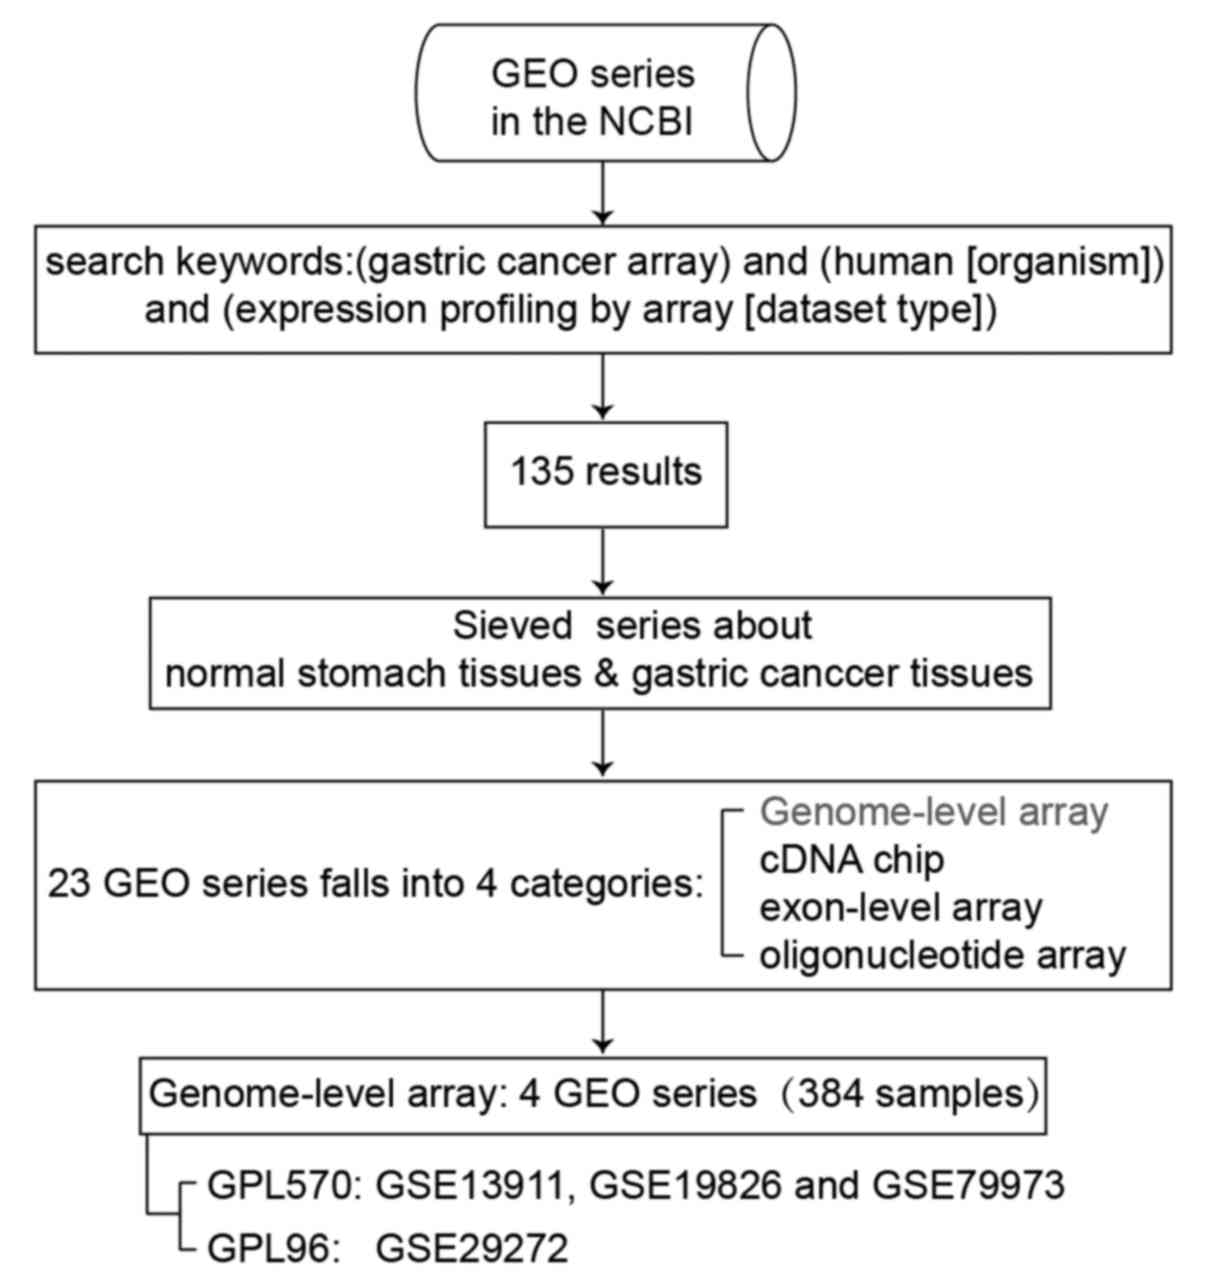
The microarray gene expression data were derived
from searches using 'astric cancer array' and 'human [organism]'
and 'expression profiling by array [dataset type]' as the keywords
in the GEO database of the National Center for Biotechnology
Information (http://www.ncbi.nlm.nih.gov/geo/). There are 135
results under this search condition. Among these, there are 4 types
of expression profiling arrays, including genome-wide expression
profiling, exon-level expression profiling, cDNA chip and
oligonucleotide microarray, which contain 23 GEO series comparing
differences between normal stomach tissues and GC tissues. The
classification and summary of the GEO series are presented in
Table I.
 | Table IA classification and summary was made
of the expression profiling array between the normal stomach and
gastric cancer in the GEO database. |
Table I
A classification and summary was made
of the expression profiling array between the normal stomach and
gastric cancer in the GEO database.
| Platforms | GEO accession
no. |
|---|
| Genome-wide
expression profiling | 2 | GSE13911,
GSE19826 |
| GSE79973,
GSE29272 |
| cDNA
microarrays | 5 | GSE2637,
GSE2669 |
| GSE17154,
GSE33429 |
| Exon level
expression profiling | 2 | GSE13195,
GSE27342 |
| GSE33335,
GSE33429 |
| GSE56807,
GSE63089 |
| GSE13195,
GSE30727 |
| Oligonucleotide
microarray | 7 | GSE20143,
GSE2685 |
| GSE49051,
GSE38932 |
| GSE33651,
GSE37023 |
| GSE38940 |
We conducted genome-wide analysis of gene expression
between normal stomach tissues and GC tissues shown as the first
row in Table I. Four independent
datasets from 2 platforms were used for analysis, which are
introduced in Table II. Three of
these (GSE13911, GSE19826 and GSE79973) were based on the GPL570
platform, which tested the expression values of 21,755 genes. Thus,
we merged the gene expression data of 116 patients from the 3
datasets based on the gene symbol to perform further analysis. A
4th dataset, GSE29272, based on the GPL96 platform was analyzed
separately; it tested the expression values of 13,102 genes. The
process of data filing is shown in Fig. 1.
| Table IIGenome-wide expression profiling
arrays which analyzed the differences between normal stomach and
gastric cancer (GC) tissues were introduced. |
Table II
Genome-wide expression profiling
arrays which analyzed the differences between normal stomach and
gastric cancer (GC) tissues were introduced.
| Expression
profiling array (Normal stomach and gastric cancer) | Platforms | GEO accession
no. | Samples |
|---|
| Genome | GPL570 | GSE13911 | 31 normal; 38
GC |
| GSE19826 | 15 normal; 12
GC |
| GSE79973 | 10 normal; 10
GC |
| GPL96 | GSE29272 | 134 normal; 134
GC |
Data preprocessing prior to difference
analysis
We utilized the robust multi-array average algorithm
of the affy package in R language to convert the raw data of 4 CEL
files into expression data. The expression levels of the probe sets
were converted into gene expression levels by the Bioconductor
annotation function of R language according to different platforms.
The expression values of multiple probes for a given gene were
averaged. With this, we obtained 4 tables containing the expression
values of different genes in different patients based on the 4 GEO
series. The function termed SameGene in R language was then used to
merge the gene expression data of 116 patients from the GSE13911,
GSE19826 and GSE79973 datasets according to the gene symbol as 1
table. In addition, we now had 2 tables, one from the GSE13911,
GSE19826 and GSE79973 datasets, and another from the GSE29272
dataset. Batch normalization was conducted on all expression
profiling data using ComBat algorithm in Surrogate Variable
Analysis package of R language. The normalization can eliminate the
systematic variations among studies.
Screening of DEGs
The candidate genes of GC tumors and normal stomach
tissues were analyzed using the linear models for microarray data
(Limma) package in Bioconductor (http://www.bioconductor.org/packages/release/bioc/html/limma.html).
Results with a |log2 fold change| (|log2 FC|)
>2 and an adjusted P-value <0.05 were considered
significant.
GO and KEGG pathway enrichment analysis
for DEGs
The Database for Annotation, Visualization and
Integrated Discovery (DAVID, http://david.abcc.ncifcrf.gov/) is characterized by
functional annotation and biological interpretation for
genome-scale datasets, which improve an integrated and high
throughput data mining environment. To evaluate the involvement of
DEGs in functional and metabolic pathways, DAVID was utilized to
perform GO and KEGG enrichment analysis for downregulated DEGs
(following the intersection of the DEGs screened from 2 sequencing
platforms) with a P-value <0.05 as a strict cut-off. The aim of
GO (http://www.geneontology.org/) is to
provide access to the biological annotation of genes, gene products
and sequences. GO terms consist of 3 categories: Biological process
(BP), cellular component (CC) and molecular function (MF). Our
analyses were focused predominantly on BP. A value of P<0.05 was
used as the cut-off criterion. KEGG (http://www.genome.ad.jp/kegg/) is a comprehensive
database resource, which consists of chemical information, genomic
information and systems information.
Venn diagram
We used the Venn diagram (http://bioinfogp.cnb.csic.es/tools/venny/) to screen
out the common DEGs in different experiments.
Oncomine database analysis and
Kaplan-Meier plotter analysis for DEGs
The expression levels of the common DEGs obtained
from the 2 sequencing platforms in GC were analyzed using the
Oncomine Cancer Profiling Database (https://www.oncomine.org) (18,19).
The mRNA expression fold in cancer tissue compared to normal tissue
was obtained and compared. For survival analyses, the prognostic
value of the selected DEGs in GC were analyzed using Kaplan-Meier
Plotter (http://kmplot.com/analysis/) and
tested for significance using log-rank tests (20,21).
The analysis was performed according to the manufacturer's
instructions [http://kmplot.com/analysis/index.php?p (21)].
Results
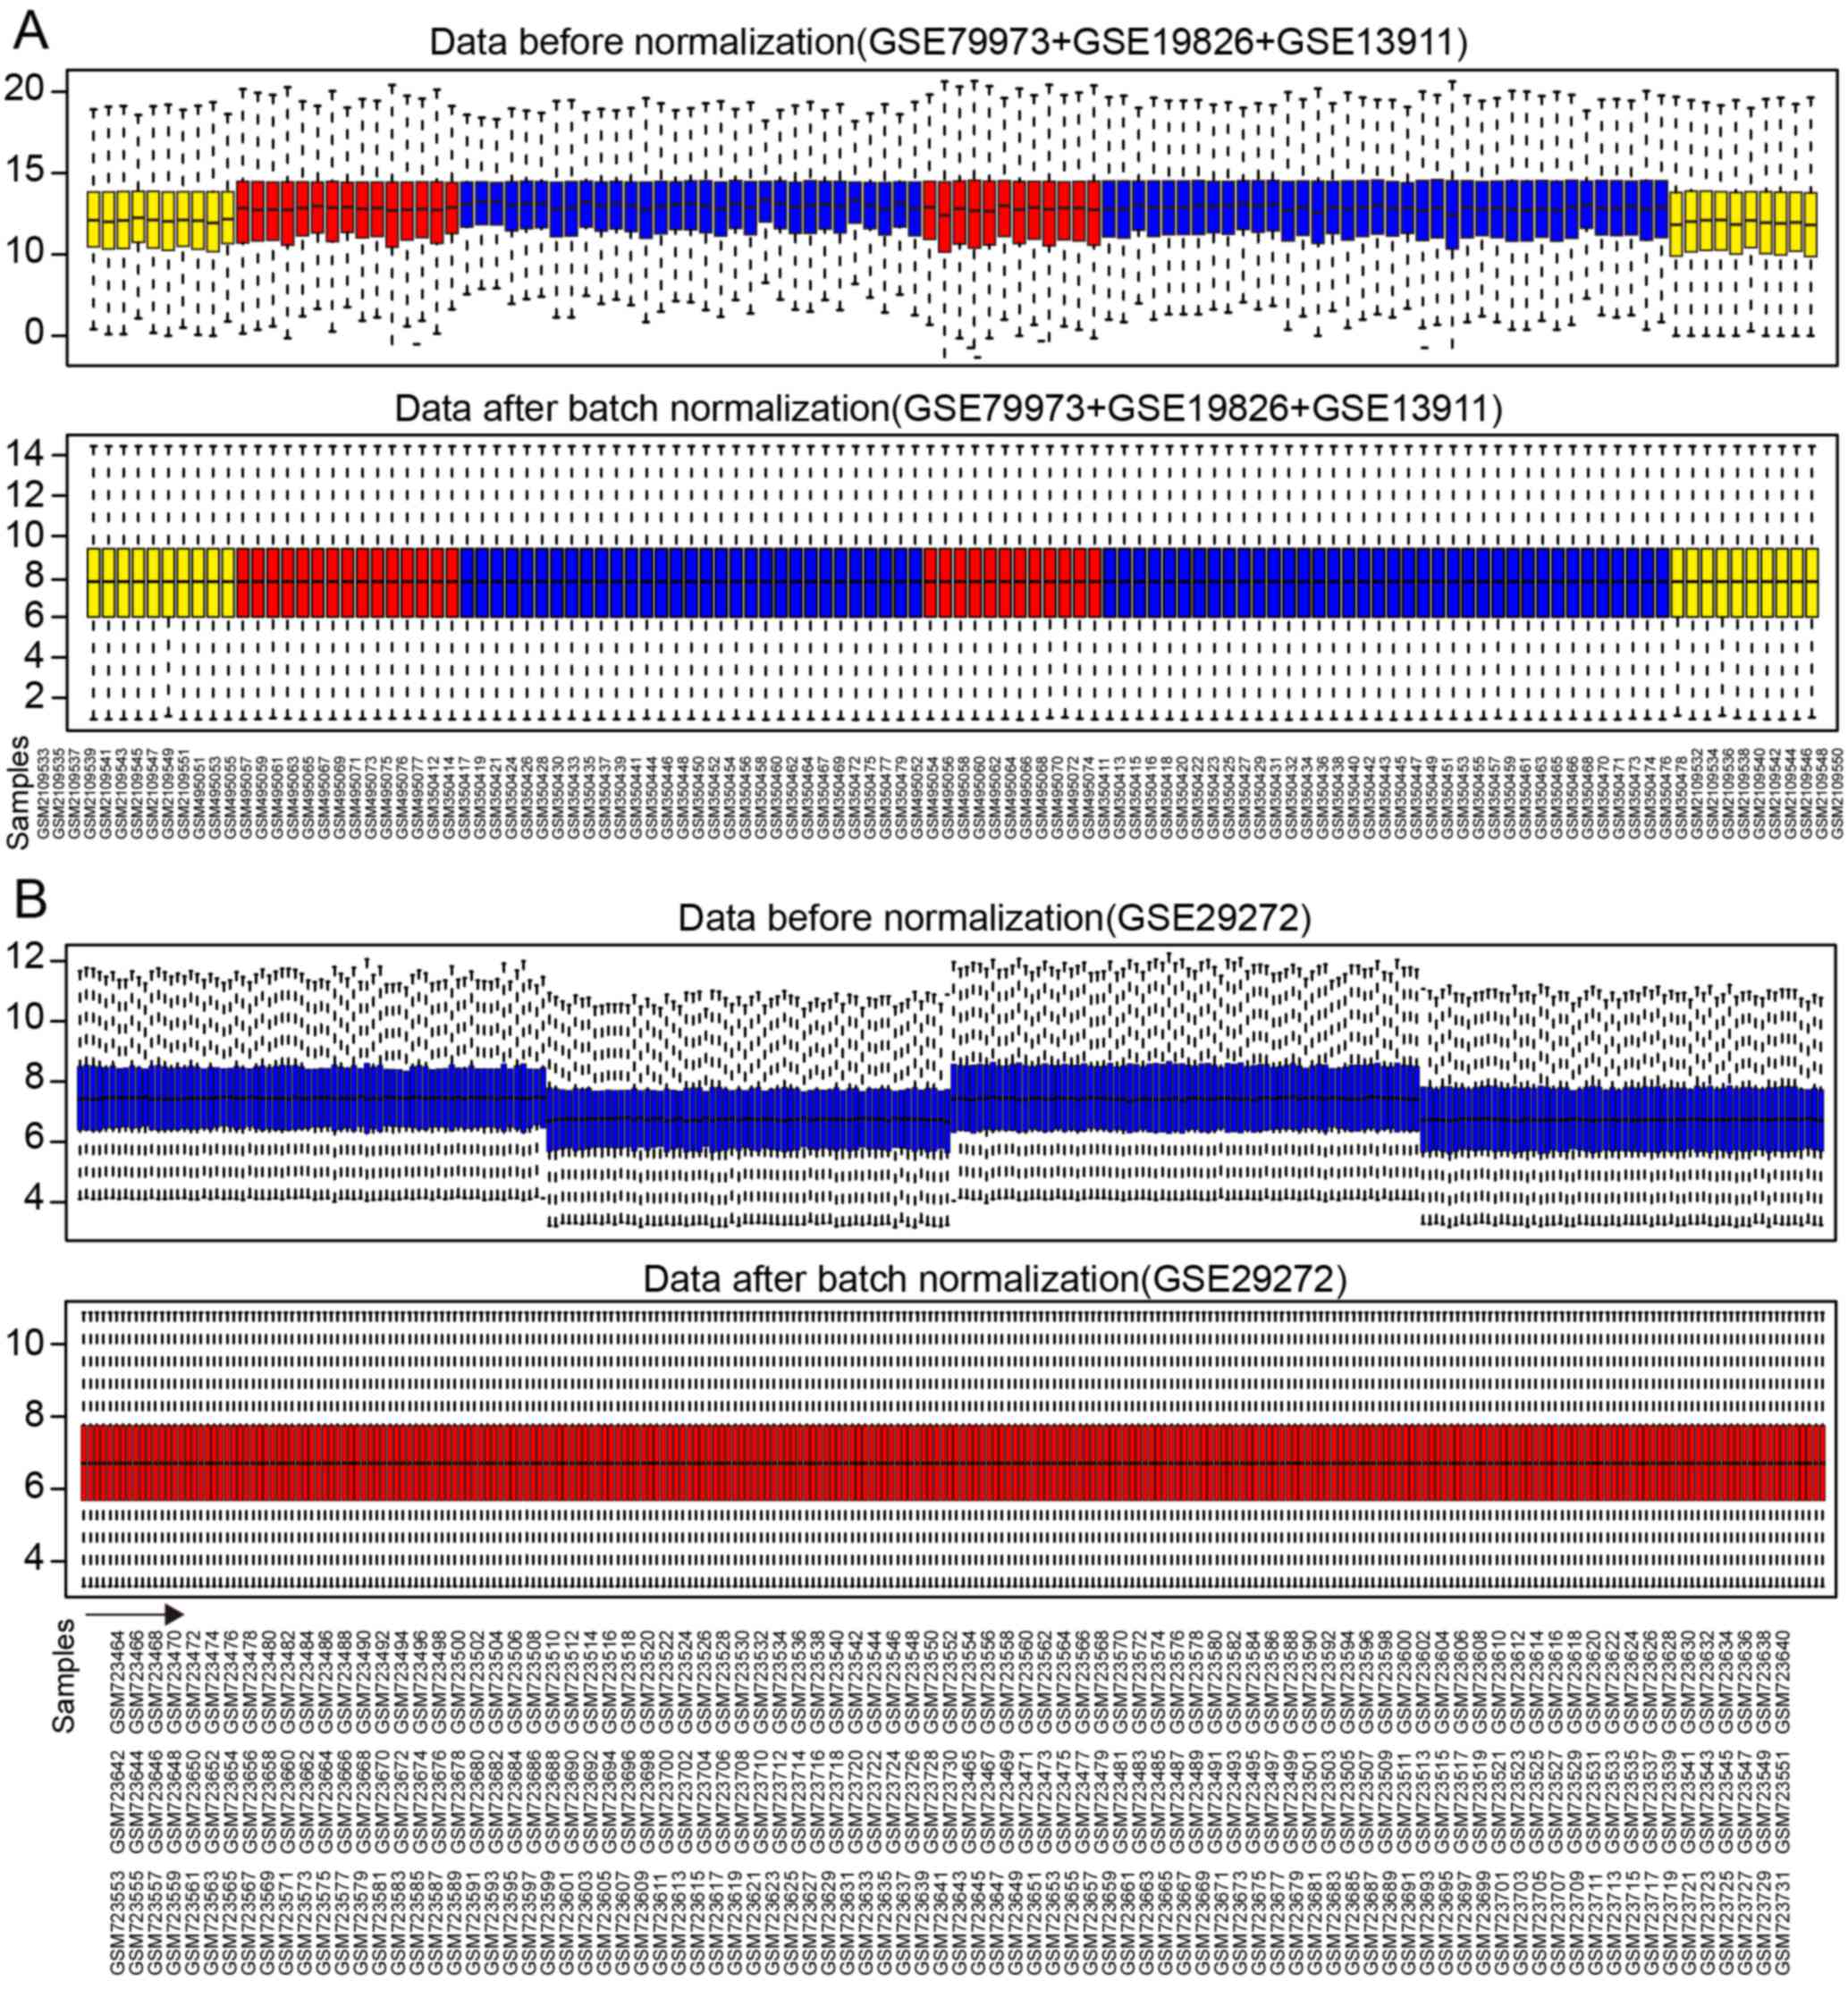
Normalization of gene expression
values
A total of 21,755 genes from 116 samples were
normalized with median method following batch normalization. The
results before and after normalization are shown by the top and
bottom box figures describing the expression values of the 116
samples in Fig. 2A. The horizontal
axis stands for sample names.
A total of 13,102 genes from 268 samples were
normalized in a similar manner. The results before and after
normalization are shown by the top and bottom box figures
describing the expression values of 268 samples in Fig. 2B. The horizontal axis stands for
sample names shown in Fig. 2B for
3 rows.
The vertical axis stands for gene expression values.
The black horizontal line represents the median of expression value
of the sample, which is almost on a straight line after batch
normalization, suggesting that normalized data were qualified.
Selection of DEGs
We used R Limma package software to analyze which
gene sets were deregulated in both comparisons with the threshold
of |log2 FC| >2 and P<0.05. The DEGs were
identified using the t-test statistical algorithm. The significant
genes lists were selected according to their fold changes in
expression values.
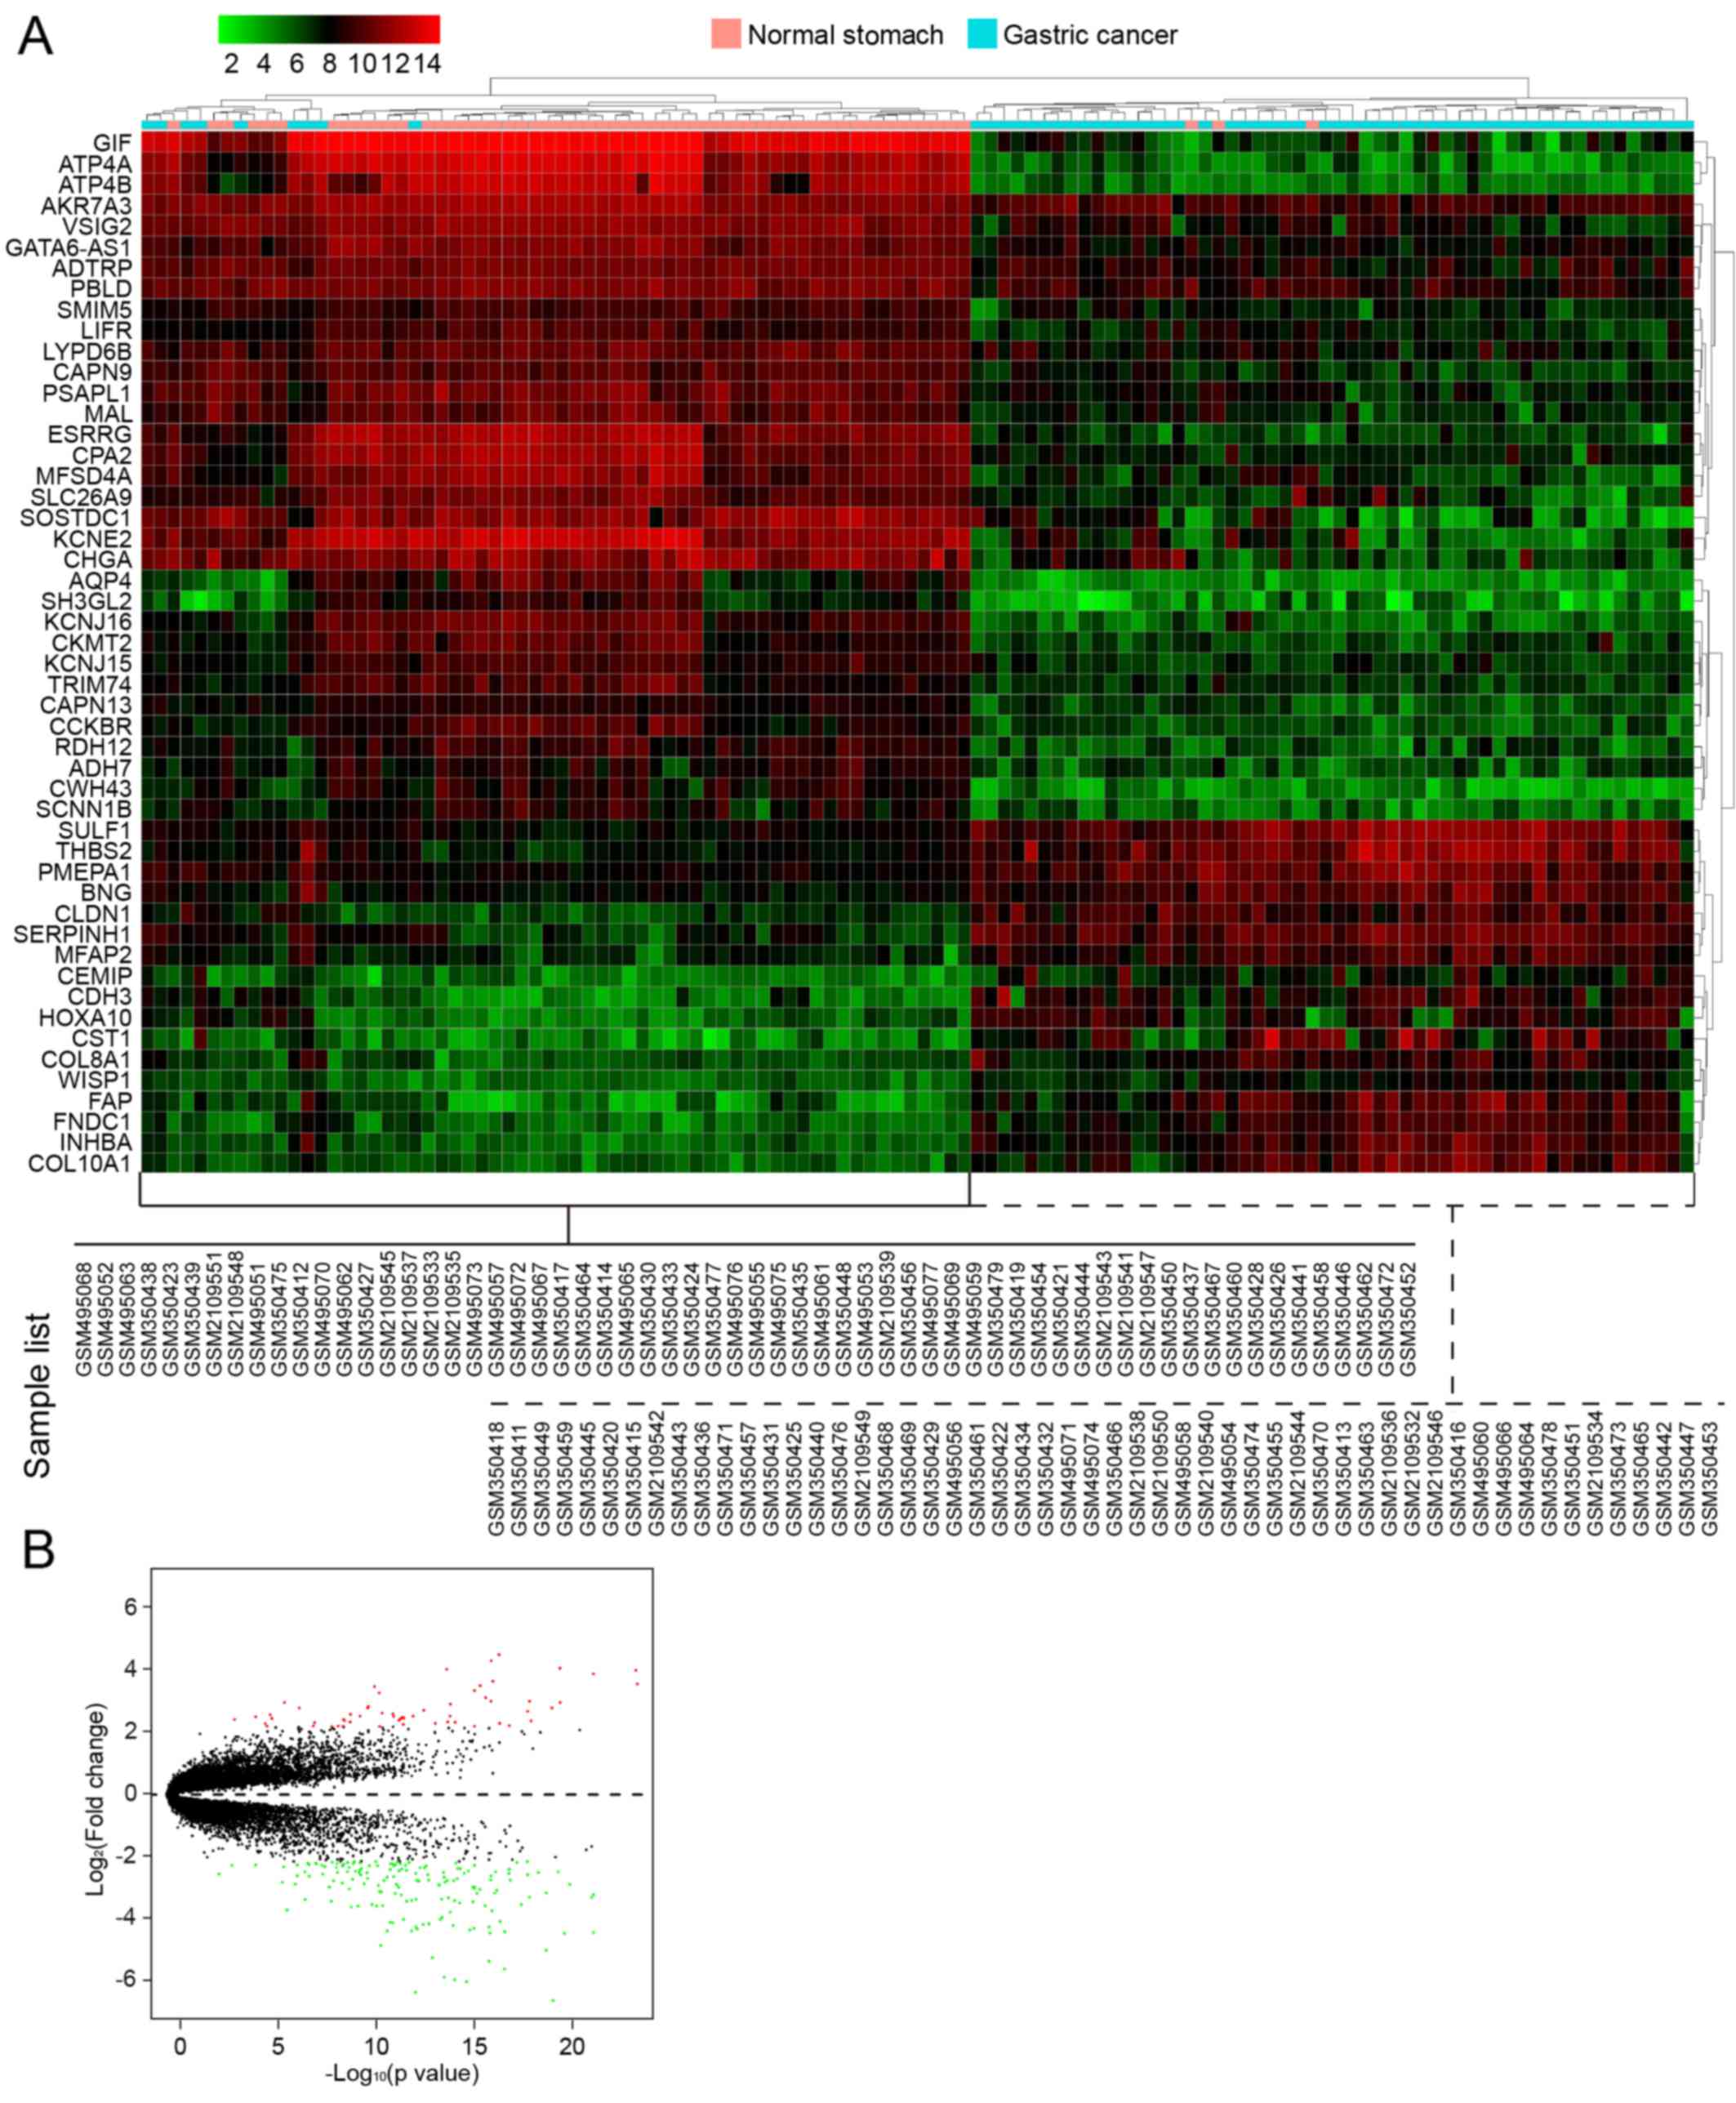
In the first group of data that contained 3 GEO
series from GPL570 (116 samples), a total of 224 DEGs between 60 GC
samples and 56 normal controls were screened, which included 59
upregulated genes and 165 downregulated genes. The number of
downregulated genes was higher than that of upregulated genes. In
Table III, we list the first 40
genes with the most obvious fold changes in expression values. A
heatmap of hierarchical clustering of the top 50 screened DEGs was
drawn according to the P-value (Fig.
3A). Fig. 3B shows a volcano
plot of gene expression differences between the GC tissues and
controls. The y-axis in the volcano plot represents the
distributions of fold change [(log2 (fold change)] and
the x-axis resprents the P-values [−log10
(P-value)].
| Table IIITop 40 DEGs, either up- and
downregulated in gastric cancer (GC), screened between
non-cancerous tissues and GC tissues from GSE13911, GSE19826 and
GSE79973. |
Table III
Top 40 DEGs, either up- and
downregulated in gastric cancer (GC), screened between
non-cancerous tissues and GC tissues from GSE13911, GSE19826 and
GSE79973.
| Gene | Log2
FC | P-value |
|---|
| Upregulated
genes | | |
| CST1 | 4.136321 | 5.63E-17 |
| FNDC1 | 3.952541 | 1.32E-16 |
| CDH3 | 3.731233 | 5.88E-20 |
| COL11A1 | 3.704572 | 2.03E-14 |
| INHBA | 3.670232 | 1.10E-23 |
| FAP | 3.564285 | 1.32E-21 |
| COL10A1 | 3.343815 | 1.11E-16 |
| SERPINH1 | 3.270653 | 9.50E-24 |
| HOXA10 | 3.219003 | 4.59E-16 |
| ZIC2 | 3.189131 | 6.84E-11 |
| SPP1 | 3.0706 | 8.69E-16 |
| CLDN7 | 2.995307 | 4.00E-11 |
| THBS2 | 2.856412 | 2.44E-16 |
| CLDN1 | 2.756577 | 1.75E-18 |
| CEMIP | 2.756077 | 1.36E-16 |
| COL8A1 | 2.724625 | 5.75E-20 |
| MAGEA6 | 2.716267 | 1.71E-06 |
| FKBP10 | 2.667536 | 1.33E-14 |
| CXCL8 | 2.602867 | 1.36E-10 |
| LY6E | 2.556012 | 1.51E-10 |
| SULF1 | 2.555768 | 1.41E-19 |
| CLDN3 | 2.555489 | 3.26E-07 |
| HOXC6 | 2.484315 | 2.63E-13 |
| MFAP2 | 2.460753 | 2.18E-18 |
| EPHX4 | 2.404839 | 2.86E-11 |
| KRT80 | 2.378706 | 8.59E-12 |
| S100A2 | 2.367957 | 1.03E-09 |
| PLA2G2A | 2.353902 | 8.66E-06 |
| SFRP4 | 2.316553 | 8.92E-13 |
| FOXM1 | 2.309926 | 3.46E-10 |
| CTHRC1 | 2.309915 | 1.36E-14 |
| EFNA3 | 2.306238 | 7.89E-12 |
| CLRN3 | 2.296356 | 4.36E-05 |
| RARRES1 | 2.281905 | 2.83E-12 |
| DUXAP10 | 2.249024 | 2.43E-12 |
| HCAR3 | 2.24534 | 7.20E-06 |
| HOXA13 | 2.240626 | 3.54E-12 |
| CLDN2 | 2.215066 | 2.20E-09 |
| CDH17 | 2.214023 | 0.0004725 |
| CDCA5 | 2.190493 | 4.38E-12 |
| Downregulated
genes | | |
| ATP4A | −6.71606 | 2.73E-20 |
| GIF | −6.67442 | 1.12E-19 |
| ATP4B | −6.08217 | 1.24E-19 |
| GKN1 | −5.83921 | 6.77E-13 |
| PGA4 | −5.53179 | 2.10E-15 |
| LIPF | −5.47762 | 8.17E-15 |
| GKN2 | −5.40202 | 2.64E-14 |
| KCNE2 | −5.16124 | 3.00E-17 |
| SOSTDC1 | −4.92959 | 1.71E-16 |
| CHIA | −4.82975 | 1.01E-13 |
| ESRRG | −4.60677 | 2.72E-19 |
| LTF | −4.46097 | 3.29E-11 |
| KCNJ16 | −4.1163 | 3.48E-20 |
| CHGA | −4.09923 | 1.51E-16 |
| CWH43 | −4.08608 | 1.32E-21 |
| AQP4 | −4.06294 | 2.90E-17 |
| PGC | −4.03877 | 1.64E-11 |
| PSCA | −4.03647 | 1.06E-12 |
| C16orf89 | −4.01438 | 1.50E-15 |
| SCGB2A1 | −3.98484 | 5.57E-13 |
| FUT9 | −3.95876 | 9.17E-16 |
| SH3GL2 | −3.9198 | 1.71E-16 |
| LINC00261 | −3.9137 | 6.26E-13 |
| DPCR1 | −3.88239 | 9.90E-15 |
| SST | −3.84699 | 2.84E-13 |
| ETNPPL | −3.82884 | 1.47E-13 |
| CXCL17 | −3.80482 | 8.66E-12 |
| TMED6 | −3.78841 | 1.16E-11 |
| MFSD4A | −3.76152 | 4.91E-17 |
| FBP2 | −3.70113 | 4.23E-14 |
| PDILT | −3.69747 | 2.57E-12 |
| VSIG1 | −3.64013 | 3.35E-14 |
| MAP7D2 | −3.49454 | 1.36E-14 |
| CPA2 | −3.44653 | 1.20E-16 |
| MSMB | −3.42457 | 1.25E-06 |
| FAM3B | −3.33335 | 9.35E-10 |
| ANXA10 | −3.31144 | 5.34E-11 |
| KRT20 | −3.30519 | 4.26E-10 |
| GC | −3.30434 | 2.69E-11 |
| SLC26A9 | −3.30012 | 2.61E-16 |
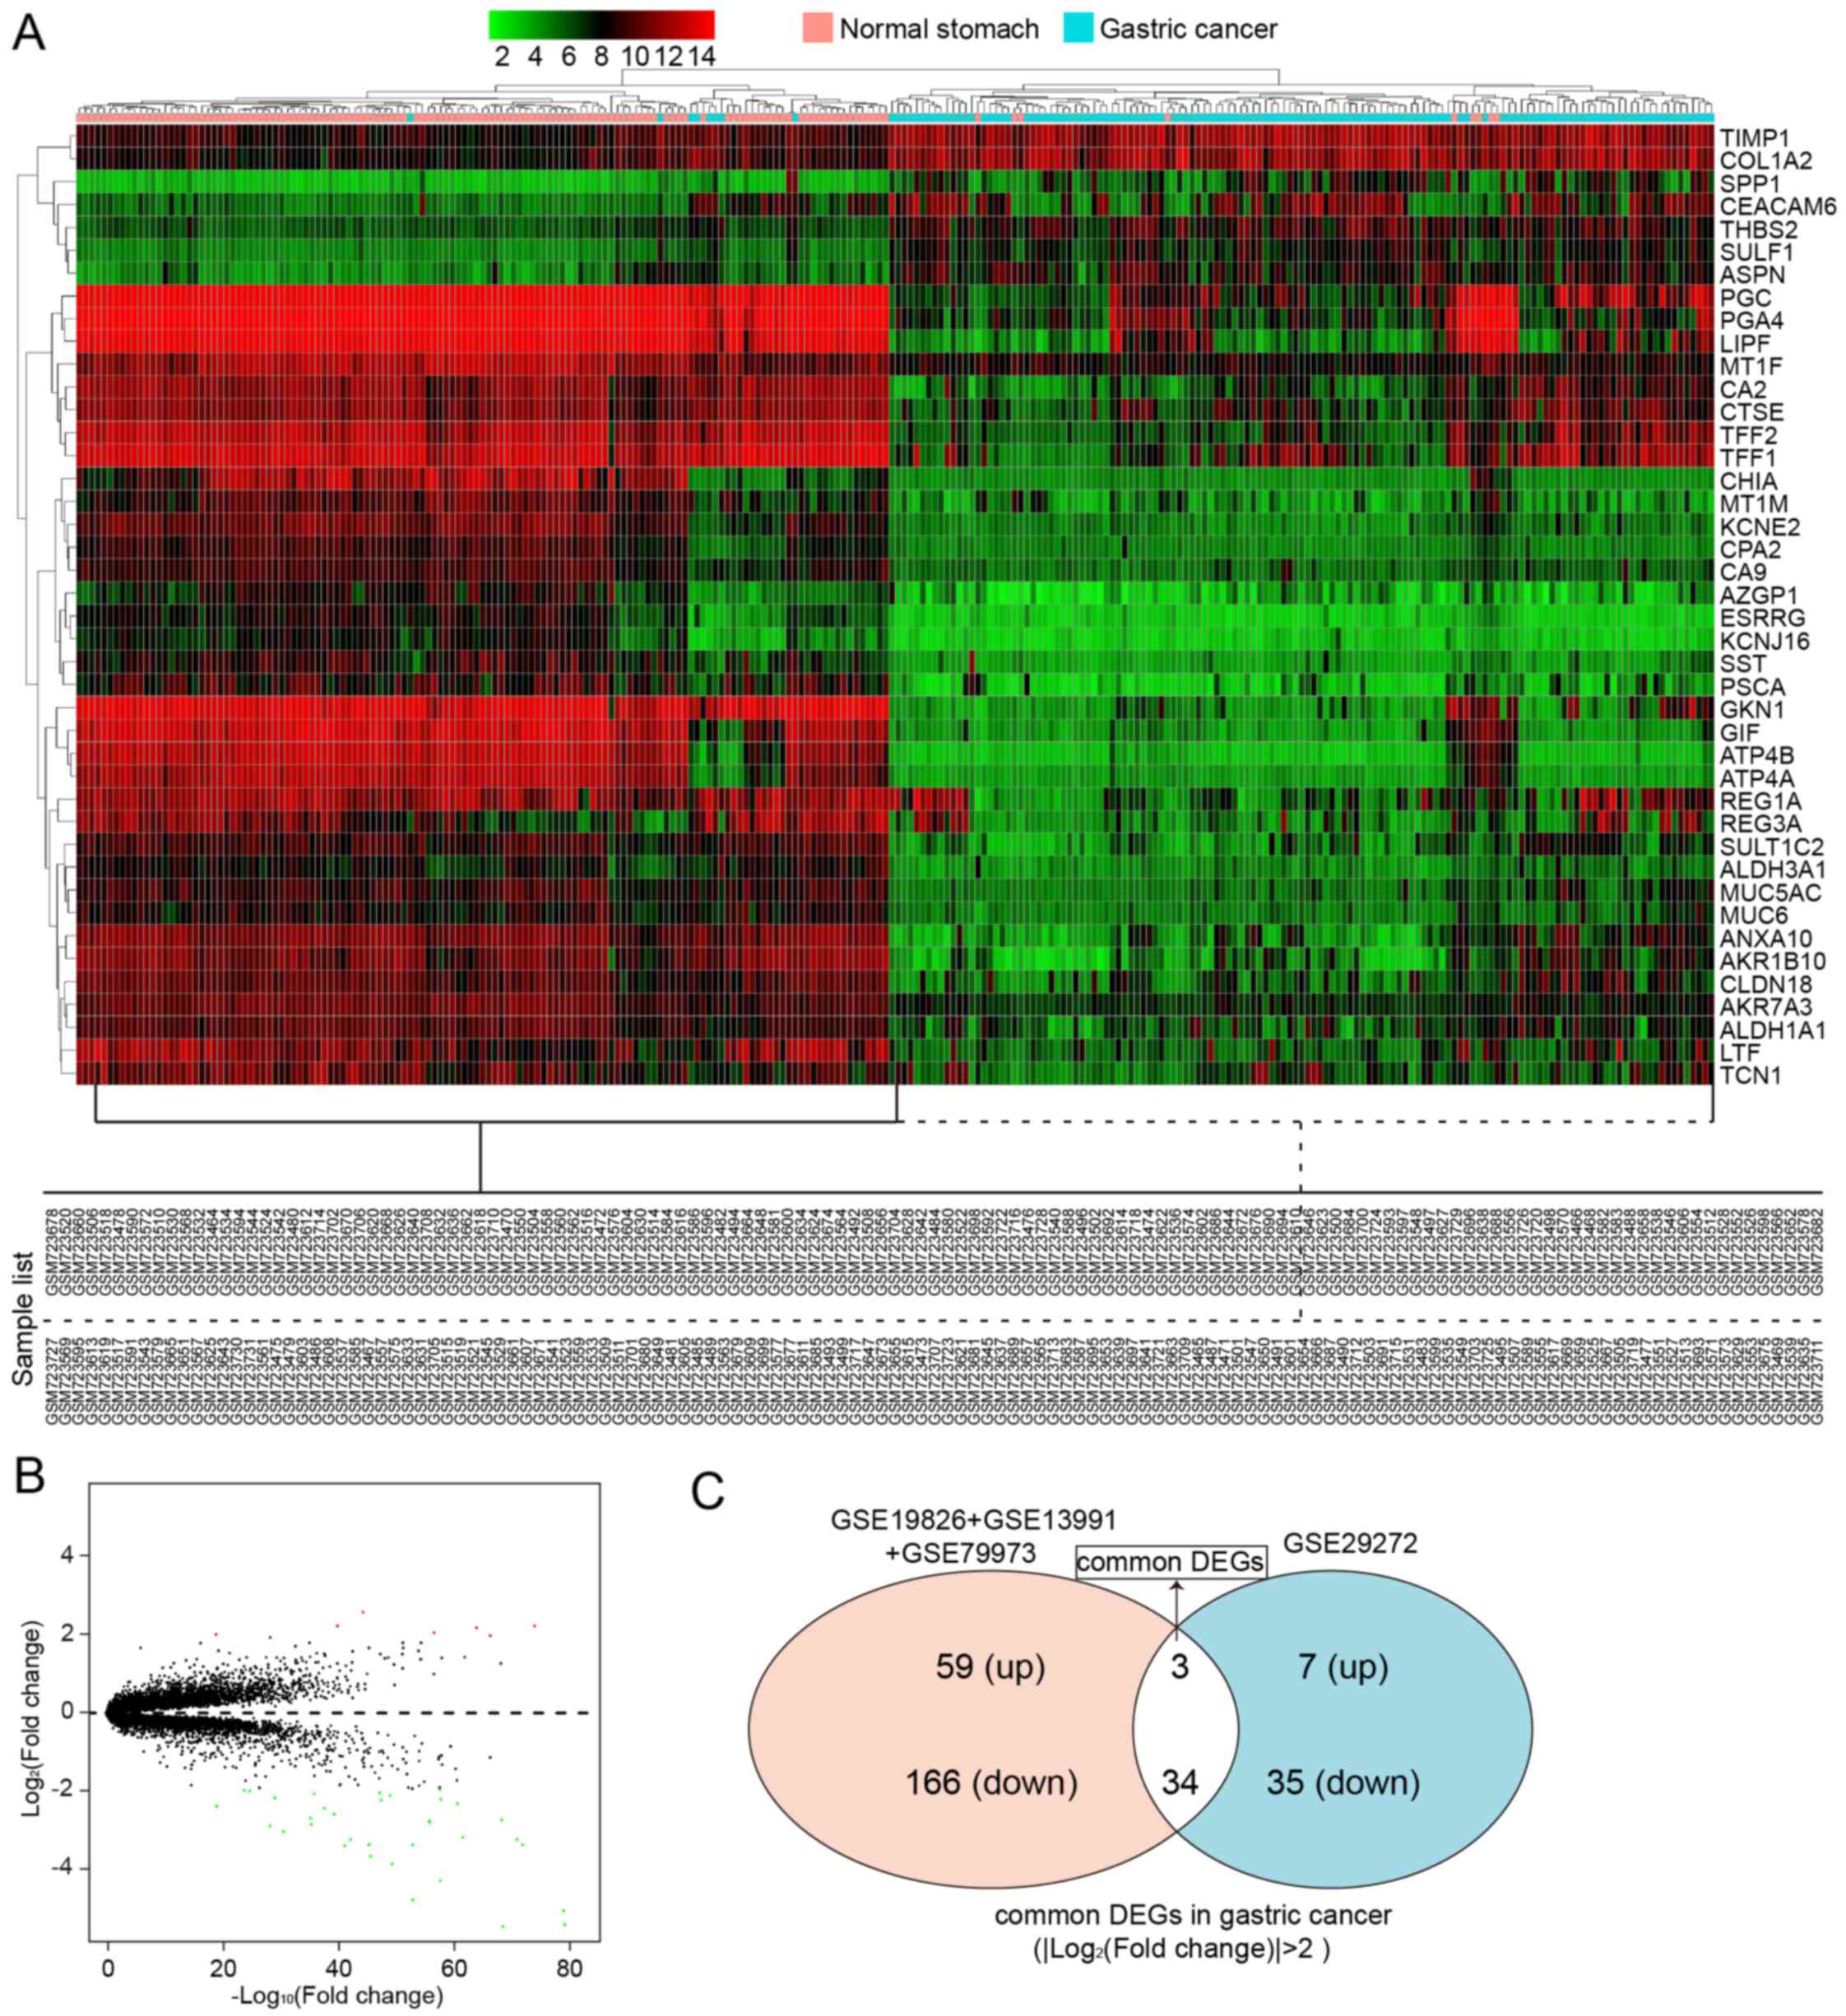
In another group of data that contained 1 GEO series
from GPL96 (268 samples), a total of 37 DEGs between 134 GC samples
and 134 normal controls were screened, which included 7 upregulated
genes and 35 downregulated genes. All these are listed in Table IV. A heatmap of hierarchical
clustering of all the screened DEGs was drawn according to the
P-value (Fig. 4A). Fig. 4B depicts the volcano plot of gene
expression differences between the GC tissues and controls. The
y-axis in the volcano plot represents the distributions of fold
change [(log2 (fold change)] and the x-axis represents
the P-values [−log10 (P-value)] (Fig. 4B).
| Table IVAll DEGs, either up- or downregulated
in GC, screened between non-cancerous tissues and gastric cancer
tissues from GSE29272. |
Table IV
All DEGs, either up- or downregulated
in GC, screened between non-cancerous tissues and gastric cancer
tissues from GSE29272.
| Gene | LogFC | P-value |
|---|
| Upregulated
genes | | |
| SULF1 | 2.270592 | 1.28E-73 |
| TIMP1 | 2.007688 | 5.00E-66 |
| COL1A2 | 2.221719 | 1.03E-63 |
| THBS2 | 2.088207 | 1.70E-56 |
| SPP1 | 2.626177 | 2.00E-44 |
| ASPN | 2.266153 | 4.61E-40 |
| CEACAM6 | 2.044841 | 1.95E-19 |
| Downregulated
genes | | |
| ATP4B | −5.99851 | 7.26E-82 |
| GKN1 | −5.59055 | 3.39E-68 |
| GIF | −5.54724 | 1.00E-78 |
| ATP4A | −5.17913 | 1.71E-78 |
| LIPF | −4.90329 | 7.02E-53 |
| PGA4 | −4.39449 | 1.46E-57 |
| CHIA | −3.95282 | 2.18E-49 |
| PGC | −3.76167 | 1.13E-45 |
| AKR1B10 | −3.48351 | 2.40E-41 |
| PSCA | −3.46225 | 7.66E-53 |
| KCNE2 | −3.45857 | 1.46E-71 |
| ANXA10 | −3.45231 | 1.85E-45 |
| TFF2 | −3.31672 | 2.60E-42 |
| ESRRG | −3.31647 | 1.27E-70 |
| MT1M | −3.2643 | 2.29E-61 |
| TFF1 | −3.11946 | 6.46E-31 |
| REG1A | −2.96114 | 1.34E-28 |
| CA2 | −2.928 | 1.37E-35 |
| KCNJ16 | −2.85901 | 1.02E-55 |
| SST | −2.83779 | 1.11E-55 |
| CPA2 | −2.81823 | 5.12E-68 |
| LTF | −2.76326 | 1.75E-35 |
| AZGP1 | −2.65999 | 1.64E-39 |
| SULT1C2 | −2.50941 | 8.22E-38 |
| REG3A | −2.46262 | 1.61E-19 |
| CA9 | −2.37875 | 1.74E-60 |
| MUC5AC | −2.29526 | 1.62E-47 |
| MT1F | −2.27496 | 1.16E-57 |
| CLDN18 | −2.24552 | 1.79E-29 |
| ALDH3A1 | −2.17363 | 5.04E-49 |
| ALDH1A1 | −2.13538 | 4.11E-36 |
| MUC6 | −2.10319 | 3.06E-47 |
| CTSE | −2.04893 | 3.85E-25 |
| TCN1 | −2.03767 | 3.09E-24 |
| AKR7A3 | −2.01921 | 1.95E-57 |
The top 40 DEGs, either up- or downregulated DEGS,
screened between the normal stomach tissues and GC tissues from the
different sequencing platforms are shown in Tables III and IV, respectively.
We then wished to identify the common DEGs that were
screened out from the different sequencing platforms. Using the
Venn diagram (http://bioinfogp.cnb.csic.es/tools/venny/), we found
the intersection of the DEGs screened from two sequencing
platforms; there were 3 upregulated DEGs (Fig. 4C and Table V) and 34 downregulated DEGs
(Fig. 4C and Table VI) in GC. The number of
downregulated DEGs was higher than that of upregulated DEGs.
| Table VGene list and function of common
upregulated genes. |
Table V
Gene list and function of common
upregulated genes.
| Gene symbol | Gene function |
|---|
| SPP1 | Cytokine
activity/extracellular matrix binding/protein binding |
| THBS2 | Calcium ion
binding/heparin binding/protein binding |
| SULF1 |
N-acetylglucosamine-6-sulfatase
activity/N-acetylglucosamine-6-sulfatase
activity/arylsulfatase |
| Table VIGene list and function of common
downregulated genes. |
Table VI
Gene list and function of common
downregulated genes.
| Gene | Function |
|---|
| AKR1B10 | Aldo-keto reductase
(NADP) activity/geranylgeranyl reductase activity/indanol
dehydrogenase |
| AKR7A3 | Aldo-keto reductase
(NADP) activity/electron carrier activity/protein binding |
| ALDH1A1 | GTPase activator
activity/aldehyde dehydrogenase (NAD) activity/aldehyde
dehydrogenase (NAD) |
| ALDH3A1 | 3-Chloroallyl
aldehyde dehydrogenase activity/alcohol dehydrogenase
(NADP+) activity/aldehyde dehydrogenase |
| ANXA10 | Calcium ion
binding/calcium-dependent phospholipid binding/protein binding |
| ATP4A | ATP
binding/hydrogen:potassium-exchanging ATPase activity/magnesium ion
binding/sodium:potassium-exchanging ATPase activity |
| ATP4B |
Hydrogen:potassium-exchanging ATPase
activity/protein binding |
| AZGP1 | Antigen
binding/glycoprotein binding/peptide antigen binding/protein
binding/protein transmembrane |
| CA2 | Arylesterase
activity/carbonate dehydratase activity/carbonate dehydratase
activity/protein binding///zinc ion binding |
| CA9 | Carbonate
dehydratase activity/zinc ion binding |
| CHIA | Carbohydrate
binding/chitin binding/chitinase activity/chitinase
activity/chitinase activity/kinase |
| CLDN18 | Identical protein
binding/structural molecule activity |
| CPA2 | Carboxypeptidase
activity/metallocarboxypeptidase activity/zinc ion binding |
| CTSE | Aspartic-type
endopeptidase activity/protein homodimerization activity |
| ESRRG | AF-2 domain
binding/RNA polymerase II regulatory region sequence-specific DNA
binding/protein |
| GIF | Cobalamin
binding |
| GKN1 | Molecular
function |
| KCNE2 | Contributes to
delayed rectifier potassium channel activity/contributes_to inward
rectifier potassium channel |
| KCNJ16 | G-protein activated
inward rectifier potassium channel activity/inward rectifier
potassium channel |
| LIPF | Lipid
binding/malate dehydrogenase activity/triglyceride lipase
activity |
| LTF | DNA binding/heparin
binding/iron ion binding/protein binding/protein serine/threonine
kinase activator |
| MT1M | Zinc ion
binding |
| MUC5AC | Extracellular
matrix structural constituent |
| MUC6 | Extracellular
matrix structural constituent |
| PGA4 | Aspartic-type
endopeptidase activity/peptidase activity/aspartic-type
endopeptidase activity/peptidase |
| PGC | Aspartic-type
endopeptidase activity |
| PSCA | Isoform 2 of
Ly6/PLAUR domain-containing protein 1 |
| REG1A | Carbohydrate
binding/growth factor activity |
| REG3A | Carbohydrate
binding/protein binding |
| SST | Hormone
activity |
| SULT1C2 | Aryl
sulfotransferase activity/protein binding/sulfotransferase
activity/sulfotransferase activity |
| TCN1 | Cobalamin
binding |
| TFF1 | Growth factor
activity/protein binding |
| TFF2 | Protein
binding |
GO analysis and KEGG pathway analysis of
screened DEGs
Following the intersection of the DEGs which were
screened out from the two sequencing platforms, the number of
downregulated DEGs were greater than that of upregulated DEGs.
Thus, function analyses were performed on the downregulated DEGs.
For the downregulated DEGs, the enriched functions in the BP
category were enriched in the digestion process, cellular aldehyde
metabolic process, oxidation-reduction process, potassium ion
import and so on (Table
VII).
| Table VIIGene ontology analysis of
downregulated genes in gastric cancer. |
Table VII
Gene ontology analysis of
downregulated genes in gastric cancer.
| Category | Term | Count | % | P-value |
|---|
|
GOTERM_BP_DIRECT | Digestion | 9 | 26.5 | 1.60E-13 |
|
GOTERM_BP_DIRECT | Cellular aldehyde
metabolic process | 4 | 11.8 | 9.30E-07 |
|
GOTERM_BP_DIRECT | Potassium ion
import | 3 | 8.8 | 1.20E-03 |
|
GOTERM_BP_DIRECT | Protein catabolic
process | 3 | 8.8 | 2.50E-03 |
|
GOTERM_BP_DIRECT | Negative regulation
of osteoclast development | 2 | 5.9 | 9.20E-03 |
|
GOTERM_BP_DIRECT | Cobalt ion
transport | 2 | 5.9 | 9.20E-03 |
|
GOTERM_BP_DIRECT | Cobalamin
transport | 2 | 5.9 | 1.50E-02 |
|
GOTERM_BP_DIRECT | Secretion | 2 | 5.9 | 1.50E-02 |
|
GOTERM_BP_DIRECT | Maintenance of
gastrointestinal epithelium | 2 | 5.9 | 2.20E-02 |
|
GOTERM_BP_DIRECT | Morphogenesis of an
epithelium | 2 | 5.9 | 2.60E-02 |
|
GOTERM_BP_DIRECT | Cobalamin metabolic
process | 2 | 5.9 | 3.80E-02 |
|
GOTERM_BP_DIRECT | Response to steroid
hormone | 2 | 5.9 | 3.80E-02 |
|
GOTERM_BP_DIRECT | One-carbon
metabolic process | 2 | 5.9 | 5.40E-02 |
|
GOTERM_BP_DIRECT | Proteolysis | 4 | 11.8 | 5.80E-02 |
|
GOTERM_BP_DIRECT | Retina
homeostasis | 2 | 5.9 | 7.30E-02 |
|
GOTERM_BP_DIRECT | Bicarbonate
transport | 2 | 5.9 | 7.80E-02 |
|
GOTERM_BP_DIRECT | Oxidation-reduction
process | 4 | 11.8 | 9.40E-02 |
To better clarify the pathological mechanisms, we
performed KEGG enrichment analysis. According to the results of
KEGG pathway enrichment analysis, the downregulated genes were
significantly enriched in gastric acid secretion (P=8.8E-7),
collecting duct acid secretion (P=2.2E-3) and nitrogen metabolism
(P=4.3E-2) (Table VIII).
| Table VIIIKEGG pathway analysis of
downregulated genes in gastric cancer. |
Table VIII
KEGG pathway analysis of
downregulated genes in gastric cancer.
| Category | Term | Count | % | P-value |
|---|
| KEGG_PATHWAY | Gastric acid
secretion | 6 | 17.6 | 8.8E-7 |
| KEGG_PATHWAY | Collecting duct
acid secretion | 3 | 8.8 | 2.2E-3 |
| KEGG_PATHWAY | Nitrogen
metabolism | 2 | 5.9 | 4.3E-2 |
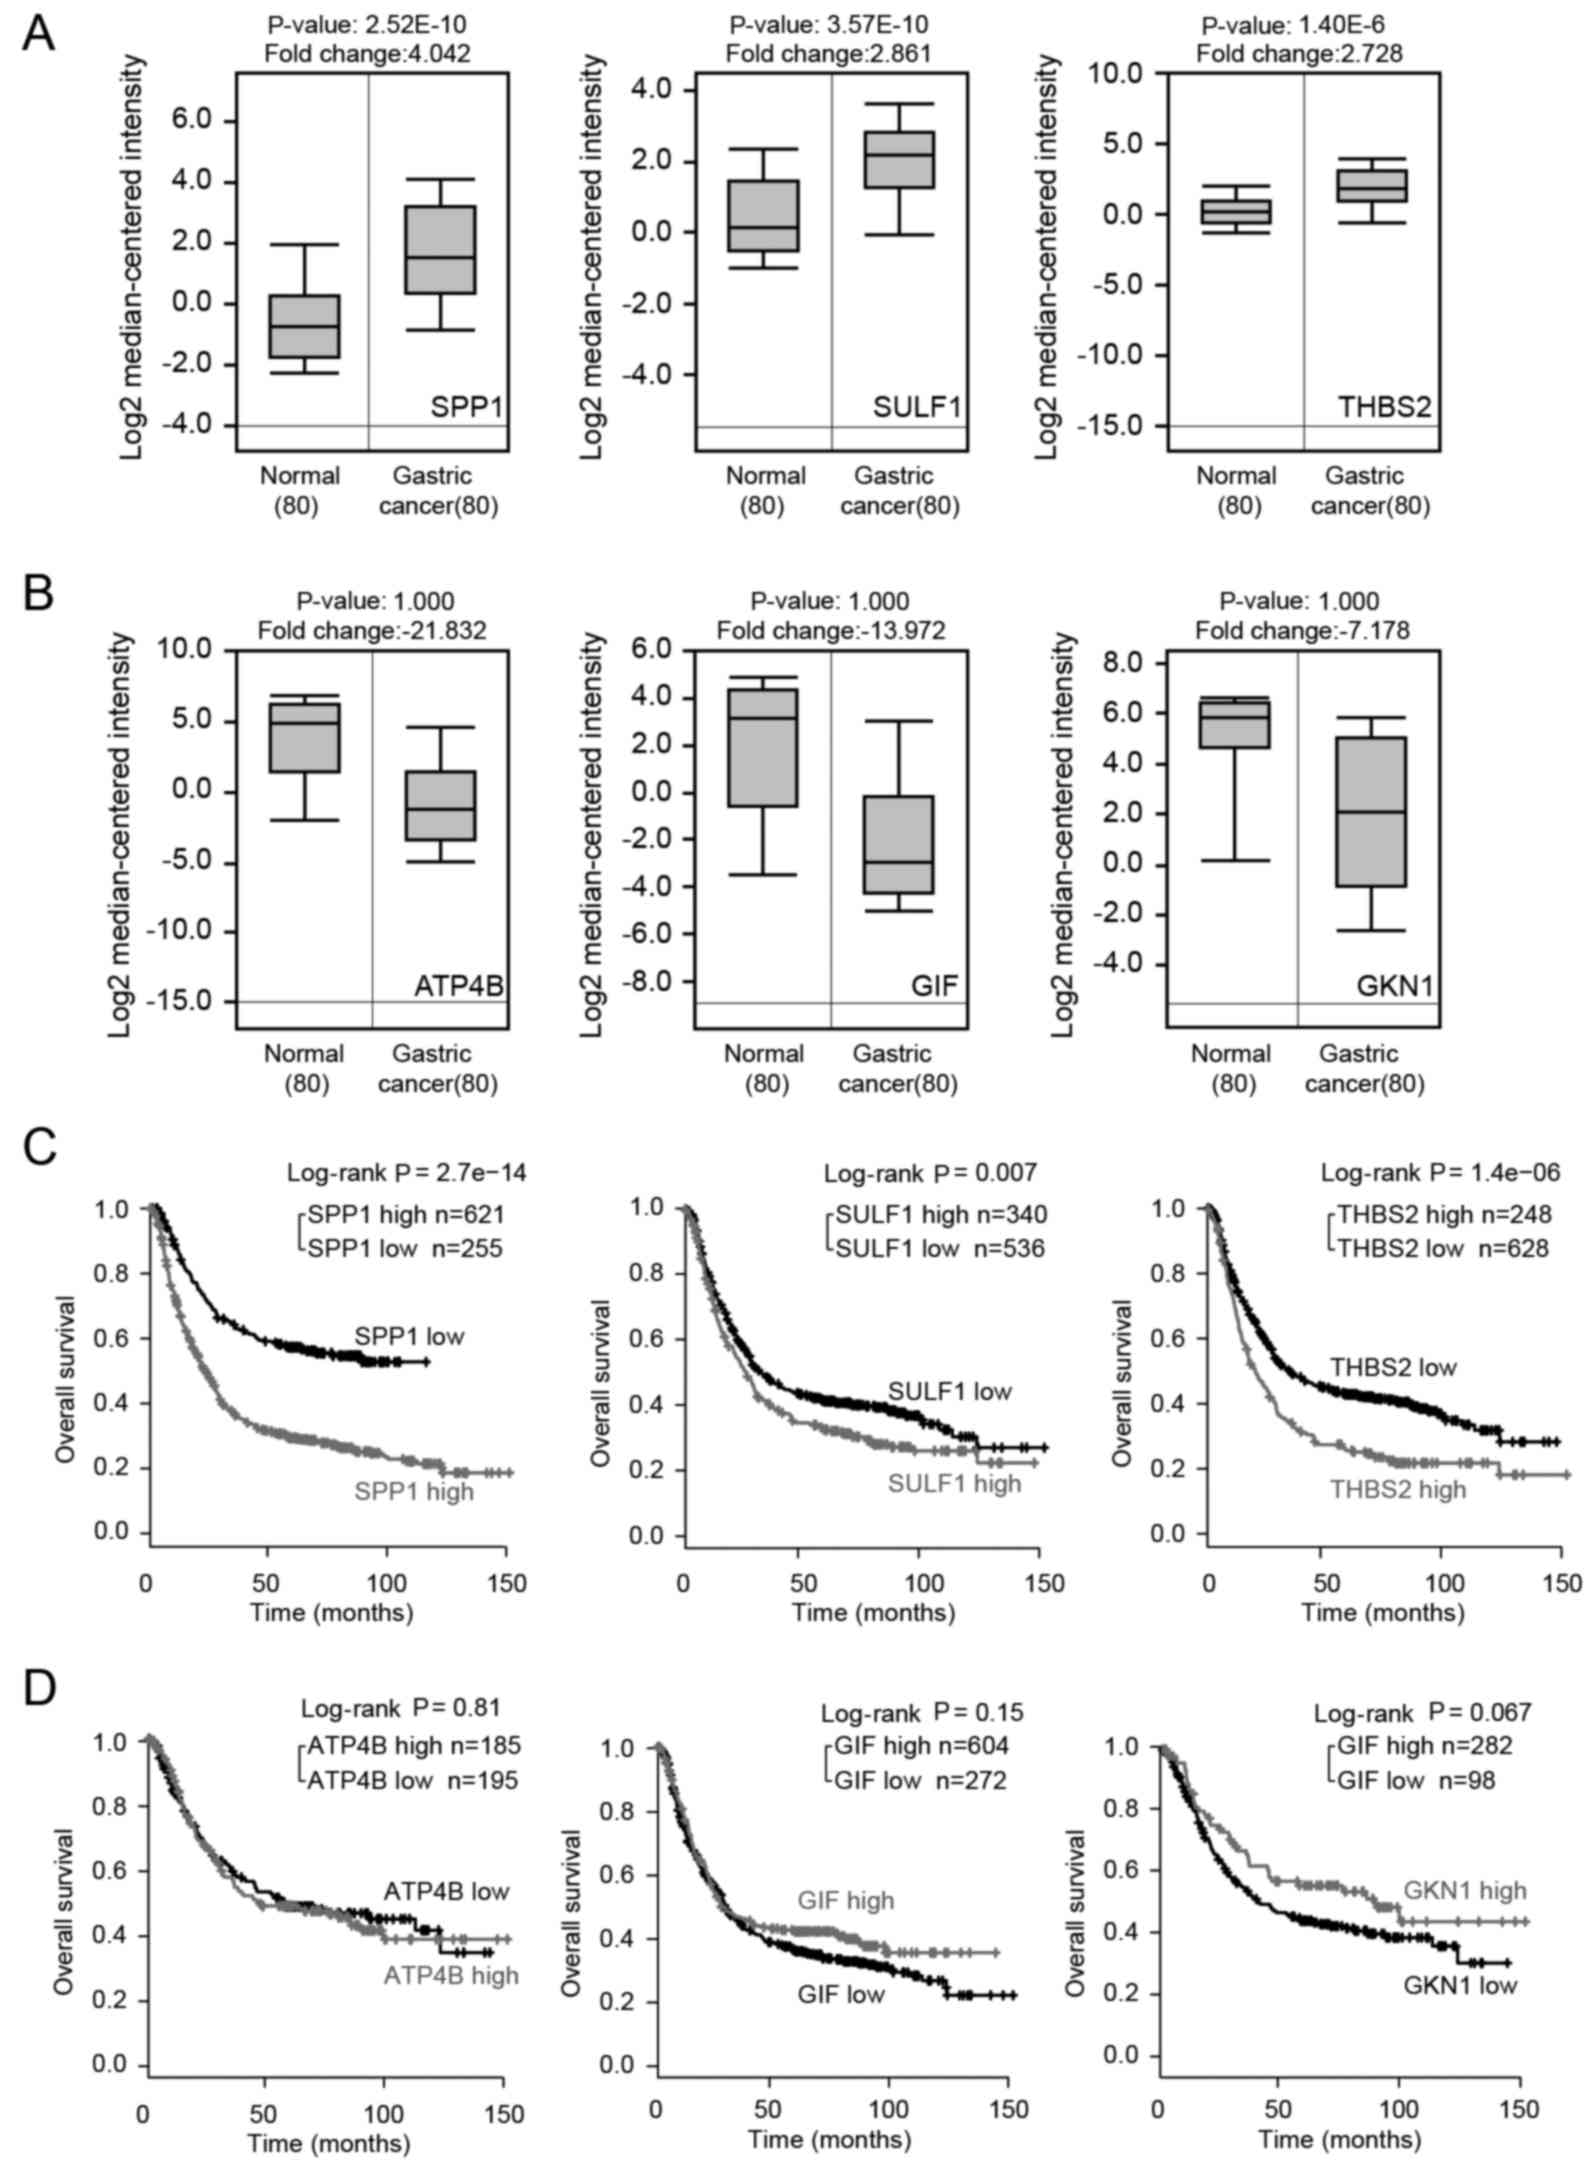
Overall survival (OS) analysis of common
DEGs
To clarify whether the expression value of the
common DEGs correlated with cancer progression, we first analyzed
the expression levels of the common DEGs with the cancer microarray
database, Oncomine. There were 37 common DEGs screened from two
sequencing platforms, 3 upregulated DEGs and 34 downregulated DEGs.
We selected 3 downregulated DEGs which had most evident fold
changes in expression values and 3 common upregulated DEGs to be
analyzed. The results revealed that common upregulated DEGs were
significantly upregulated in GC tissues (P<0.05) (Fig. 5A); however, the downregulation of
the 3 selected common downregulated DEGs in the GC tissues was not
so evident (P>0.05) (Fig. 5B).
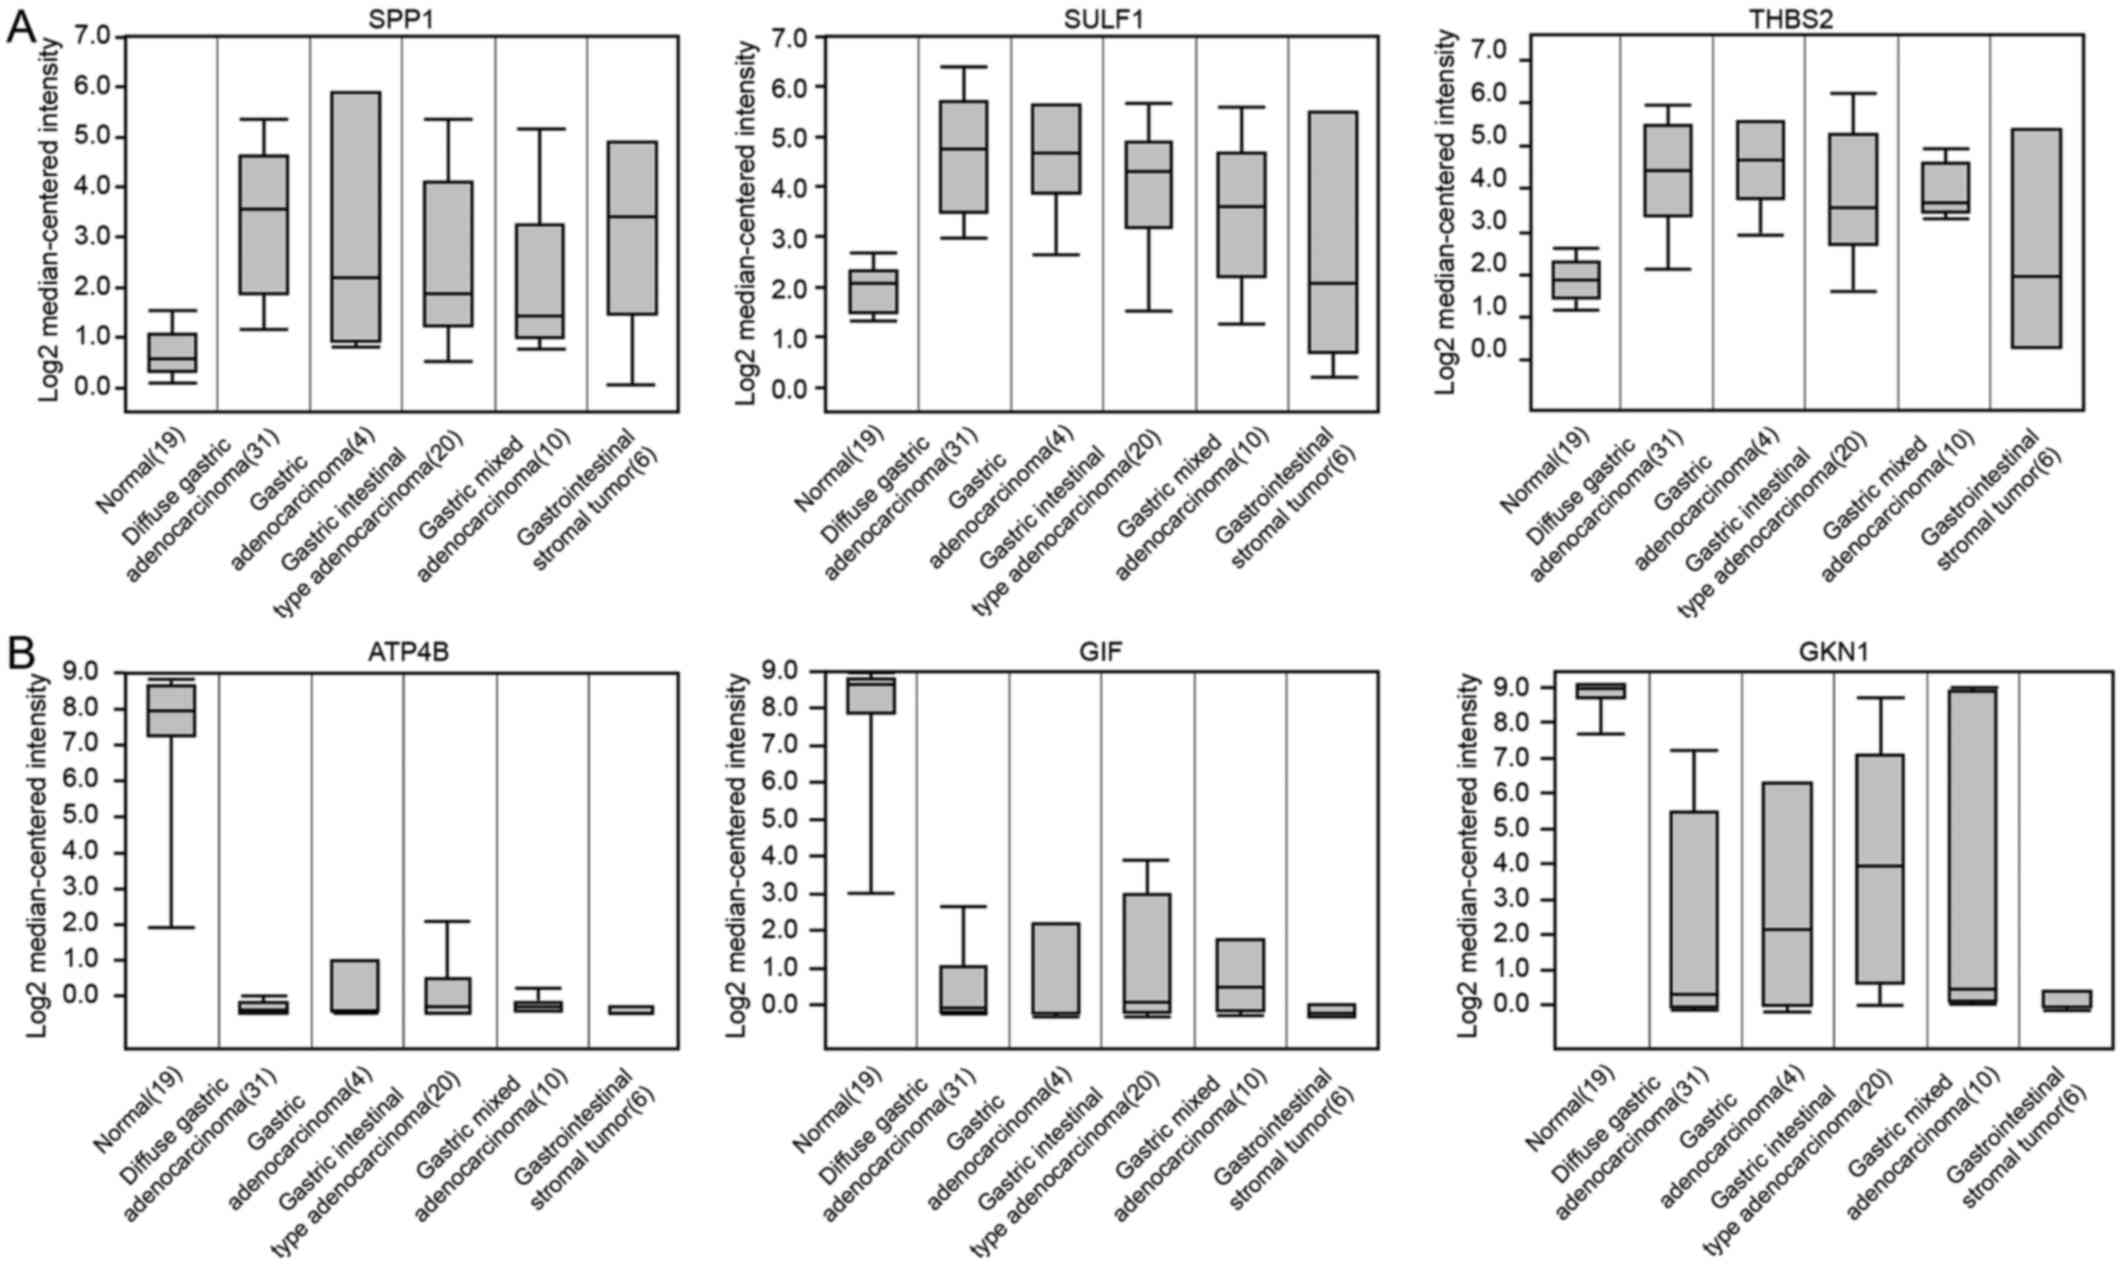
We then analyzed the expression of common DEGs using Kaplan-Meier
plotter analysis. The results revealed that the high expression
levels of 3 common upregulated DEGs were associated with a worse
prognosis (P<0.01) (Fig. 5C);
however, the association between the downregulated DEGs and OS was
not so evident (P>0.05) (Fig.
5D). The results of common DEGs expressed in the normal stomach
and different types of GCs are consistent with predicted results
based on GEO database in this study (Fig. 6).
The results reminded us that perhaps in GC, the
accumulated expression of certain oncogenes may play an important
role in the induction of gastric carcinogenesis, such as the
secreted phosphoprotein 1 (SPP1), sulfatase 1 (SULF1)
and thrombospondin 2 (THBS2) genes.
Discussion
GC is a product of cumulative genetic, epigenetic,
somatic and endocrine aberrations (22). Understanding the molecular
mechanisms of GC is of critical importance for diagnosis and
treatment. Since high throughput sequencing (23,24)
can reveal the expression levels of thousands of genes in the human
genome simultaneously, it has been widely used to predict the
potential therapeutic targets for GC (25). By taking into consideration the
analysis of whole genome sequencing results from different
laboratories, the statistical power can be increased and the
prediction may be more accurate; moreover, the bias of individual
studies can be overcome. In this study, the common DEGs that were
screened out from different sequencing platforms containing 384
samples were listed. There were 3 common upregulated DEGs and 34
common downregulated DEGs in GC with the threshold of
|log2 FC| >2 and P<0.05. Among these, the
expression values of ATPase H+/K+
transporting beta subunit (ATP4B), gastrokine 1
(GKN1), gastric intrinsic factor (GIF), ATPase
H+/K+ transporting alpha subunit
(ATP4A), lipase F, gastric type (LIPF) and pepsinogen
4, group I (pepsinogen A; PGA4) between the GC and normal
tissues were altered by >24 fold, and independent of
the platform, the fold change expression value of 6 genes was
ranked in the top 6. Raja et al found that the
downregulation of ATP4A and ATP4B involved DNA
methylation and methylated ATP4B DNA in plasma was a
potential biomarker for GC (26);
to the best of our knowledge, this was the only study to date which
investigated the association of ATP4B or ATP4A with
GC and these findings were consistent with our analysis.
GKN1 has convergent functions in terms of the modulation of
gastric mucosal homeostasis and inflammation, activity in
epithelial wound healing or repair, and anti-proliferative
activity, and there has been relatively more research on this gene
in gastric carcinogenesis (27–30).
GIF is a gastric intrinsic factor and LIPF encodes
gastric lipase; it is an enzyme involved in the digestion of
dietary triglycerides in the gastrointestinal tract, and is
responsible for 30% of fat digestion processes occurring in humans.
PGA4 encodes a protein precursor of the digestive enzyme
pepsin, a member of the peptidase A1 family of end peptidases. The
functional deficiency of these genes can lead to GC (31,32).
On the whole, it can be deduced that the DEGs we screened from GC
tissues and normal stomach may aid in the investigation of GC and
the discovery of novel drugs.
The GO term analysis revealed that the downregulated
DEGs were mainly involved in the digestion process, cellular
aldehyde metabolic process (33),
oxidation-reduction process, potassium ion import and so on
(34). Furthermore, the enriched
KEGG pathways of the downregulated DEGs included gastric acid
secretion, collecting duct acid secretion and Nnitrogen metabolism.
Di Mario and Goni reported that gastric acid secretion was strongly
associated with GC (35).
Decreased or increased gastric acid secretion can lead to various
diseases in the stomach, such as gastroesophageal reflux disease,
chronic atrophic gastritis and others (36). Some drugs based on acid secretion,
namely the H2-receptor antagonists (H2RAs)
and proton pump inhibitors (PPIs), allow for the effective and safe
treatment of peptic ulcers and other acid-related disorders
(37). The collecting duct is
responsible for the final secretion or re-absorption of protons and
bicarbonate, it mediates Na, K and water transport and intercalated
cells (ICs), which are specialized for acid-base transport
(38). To date, to the best of our
knowledge, there is no study available on collecting duct acid
secretion and GC; however, acid-base balance is often clinically
linked (39). The association
between collecting duct acid secretion and GC warrants further
investigation. Studies have suggested that the implementation of
effective nutritional support is crucial for improving the
post-operative nutrient consumption and improving prognosis, as
well as the quality of rehabilitation in patients with GC (40). Ishizuka et al (41) reported that the majority of
patients with advanced-stage GC experienced nutritional deficiency,
which, in combination with surgical trauma, can easily cause
post-operative immune dysfunction and malnutrition, imposing a
certain influence on recovery, and this has been validated by a
number of studies (42,43). Functional analyses can help us to
better understand the mechanisms of GC and may provide us with a
guide to GC prevention and treatment. These pathways may be
potential targets for improving the diagnosis and clinical effects
in patients with GC.
However, further molecular biological experiments
are required to confirm the function of the identified genes in GC
and further analyses of other aspects in gastric carcinogenesis,
such as epigenetic modification and single-nucleotide polymorphism
(SNP) mutations (44) are also
required. However, this study provides information for researchers
which may aid in the identification of possible candidate genes and
pathways which may be involved in GC. We provide further insight of
gastric carcinogenesis at the molecular level and information of
potential candidate biomarkers for the diagnosis, prognosis and
drug targets for GC.
In conclusion, the present study utilized the
analysis of whole genome sequencing results from different
laboratories, and screened out the common DEGs from different
sequencing platforms containing 384 samples. There were 3 common
upregulated DEGs and 34 common downregulated DEGs in GC with the
threshold of |log2 FC| >2 and P<0.05. Functional
analysis revealed that the downregulated DEGs were mainly involved
in the digestion process, cellular aldehyde metabolic process,
oxidation-reduction process, potassium ion imports and so on.
Furthermore, the enriched KEGG pathways of downregulated DEGs
included gastric acid secretion, collecting duct acid secretion and
nitrogen metabolism. Through the analysis of all GSE series
comparing GC cancer tissues and control in the GEO database, the
prediction is more accurate and the bias of individual studies can
be overcome. We also examined the association between the prognosis
values and the common DEGs screened from 4 laboratories, and found
that the common upregulated DEGs may play an important role in the
development of GC.
Glossary
Abbreviations
Abbreviations:
|
GC
|
gastric cancer
|
|
log2 FC
|
log2 fold change/logarithm
of fold change
|
|
DEGs
|
differentially expressed genes
|
|
BP
|
biological process
|
|
GO
|
gene ontology
|
|
KEGG
|
Kyoto Encyclopedia of Genes and
Genomes
|
|
OS
|
overall survival
|
Acknowledgments
The study was supported by the Doctoral Innovation
Fund Projects from Shanghai Jiao Tong University School of Medicine
(no. BXJ201404).
Notes
[1] Competing
interests
The authors declare that they have no competing
interests.
References
|
1
|
Lordick F and Terashima M: Gastric cancer
adjuvant therapy. Best Pract Res Clin Gastroenterol. 30:581–591.
2016. View Article : Google Scholar : PubMed/NCBI
|
|
2
|
Yoon H and Kim N: Diagnosis and management
of high risk group for gastric cancer. Gut Liver. 9:5–17. 2015.
View Article : Google Scholar :
|
|
3
|
Gong EJ and Kim DH: Endoscopic
ultrasonography in the diagnosis of gastric subepithelial lesions.
Clin Endosc. 49:425–433. 2016. View Article : Google Scholar : PubMed/NCBI
|
|
4
|
Xue H, Ge HY, Miao LY, Wang SM, Zhao B,
Wang JR and Cui LG: Differential diagnosis of gastric cancer and
gastritis: The role of contrast-enhanced ultrasound (CEUS). Abdom
Radiol (NY). 42:802–809. 2017. View Article : Google Scholar
|
|
5
|
Bass AJ, Thorsson V, Shmulevich I,
Reynolds SM, Miller M, Bernard B, Hinoue T, Laird PW, Curtis C,
Shen H, et al Cancer Genome Atlas Research Network: Comprehensive
molecular characterization of gastric adenocarcinoma. Nature.
513:202–209. 2014. View Article : Google Scholar :
|
|
6
|
Badgwell B: Multimodality therapy of
localized gastric adenocarcinoma. J Natl Compr Canc Netw.
14:1321–1327. 2016. View Article : Google Scholar : PubMed/NCBI
|
|
7
|
Ghadyalpatil NS, Supriya C, Prachi P,
Ashwin D and Avanish S: Gastrointestinal cancers in India:
Treatment perspective. South Asian J Cancer. 5:126–136. 2016.
View Article : Google Scholar : PubMed/NCBI
|
|
8
|
Pasechnikov V, Chukov S, Fedorov E,
Kikuste I and Leja M: Gastric cancer: Prevention, screening and
early diagnosis. World J Gastroenterol. 20:13842–13862. 2014.
View Article : Google Scholar : PubMed/NCBI
|
|
9
|
Lazăr DC, Tăban S, Cornianu M, Faur A and
Goldiş A: New advances in targeted gastric cancer treatment. World
J Gastroenterol. 22:6776–6799. 2016. View Article : Google Scholar
|
|
10
|
Riquelme I, Saavedra K, Espinoza JA, Weber
H, García P, Nervi B, Garrido M, Corvalán AH, Roa JC and Bizama C:
Molecular classification of gastric cancer: Towards a
pathway-driven targeted therapy. Oncotarget. 6:24750–24779. 2015.
View Article : Google Scholar : PubMed/NCBI
|
|
11
|
Kothari N and Almhanna K: Current status
of novel agents in advanced gastroesophageal adenocarcinoma. J
Gastrointest Oncol. 6:60–74. 2015.PubMed/NCBI
|
|
12
|
Zhang J, Huang JY, Chen YN, Yuan F, Zhang
H, Yan FH, Wang MJ, Wang G, Su M, Lu G, et al: Erratum: Whole
genome and transcriptome sequencing of matched primary and
peritoneal metastatic gastric carcinoma. Sci Rep. 5:153092015.
View Article : Google Scholar : PubMed/NCBI
|
|
13
|
Hudler P: Challenges of deciphering
gastric cancer heterogeneity. World J Gastroenterol.
21:10510–10527. 2015. View Article : Google Scholar : PubMed/NCBI
|
|
14
|
DeRisi JL, Iyer VR and Brown PO: Exploring
the metabolic and genetic control of gene expression on a genomic
scale. Science. 278:680–686. 1997. View Article : Google Scholar : PubMed/NCBI
|
|
15
|
Golub TR, Slonim DK, Tamayo P, Huard C,
Gaasenbeek M, Mesirov JP, Coller H, Loh ML, Downing JR, Caligiuri
MA, et al: Molecular classification of cancer: Class discovery and
class prediction by gene expression monitoring. Science.
286:531–537. 1999. View Article : Google Scholar : PubMed/NCBI
|
|
16
|
Barrett T, Wilhite SE, Ledoux P,
Evangelista C, Kim IF, Tomashevsky M, Marshall KA, Phillippy KH,
Sherman PM, Holko M, et al: NCBI GEO: Archive for functional
genomics data sets - update. Nucleic Acids Res. 41:D991–D995. 2013.
View Article : Google Scholar
|
|
17
|
Ogata H, Goto S, Sato K, Fujibuchi W, Bono
H and Kanehisa M: KEGG: Kyoto Encyclopedia of Genes and Genomes.
Nucleic Acids Res. 27:29–34. 1999. View Article : Google Scholar
|
|
18
|
Rhodes DR, Yu J, Shanker K, Deshpande N,
Varambally R, Ghosh D, Barrette T, Pandey A and Chinnaiyan AM:
ONCOMINE: A cancer microarray database and integrated data-mining
platform. Neoplasia. 6:1–6. 2004. View Article : Google Scholar : PubMed/NCBI
|
|
19
|
Rhodes DR, Kalyana-Sundaram S, Mahavisno
V, Varambally R, Yu J, Briggs BB, Barrette TR, Anstet MJ,
Kincead-Beal C, Kulkarni P, et al: Oncomine 3.0: Genes, pathways,
and networks in a collection of 18,000 cancer gene expression
profiles. Neoplasia. 9:166–180. 2007. View Article : Google Scholar : PubMed/NCBI
|
|
20
|
Gyorffy B, Lánczky A and Szállási Z:
Implementing an online tool for genome-wide validation of
survival-associated biomarkers in ovarian-cancer using microarray
data from 1287 patients. Endocr Relat Cancer. 19:197–208. 2012.
View Article : Google Scholar : PubMed/NCBI
|
|
21
|
Györffy B, Lanczky A, Eklund AC, Denkert
C, Budczies J, Li Q and Szallasi Z: An online survival analysis
tool to rapidly assess the effect of 22,277 genes on breast cancer
prognosis using microarray data of 1,809 patients. Breast Cancer
Res Treat. 123:725–731. 2010. View Article : Google Scholar
|
|
22
|
Correa P: A human model of gastric
carcinogenesis. Cancer Res. 48:3554–3560. 1988.PubMed/NCBI
|
|
23
|
Holbrook JD, Parker JS, Gallagher KT,
Halsey WS, Hughes AM, Weigman VJ, Lebowitz PF and Kumar R: Deep
sequencing of gastric carcinoma reveals somatic mutations relevant
to personalized medicine. J Transl Med. 9:1192011. View Article : Google Scholar : PubMed/NCBI
|
|
24
|
Lim B, Kim JH, Kim M and Kim SY: Genomic
and epigenomic heterogeneity in molecular subtypes of gastric
cancer. World J Gastroenterol. 22:1190–1201. 2016. View Article : Google Scholar : PubMed/NCBI
|
|
25
|
Pfeifer SP: From next-generation
resequencing reads to a high-quality variant data set. Hered Edinb.
118:111–124. 2017. View Article : Google Scholar
|
|
26
|
Raja UM, Gopal G and Rajkumar T:
Intragenic DNA methylation concomitant with repression of ATP4B and
ATP4A gene expression in gastric cancer is a potential serum
biomarker. Asian Pac J Cancer Prev. 13:5563–5568. 2012. View Article : Google Scholar
|
|
27
|
Yang M, Jiang N, Cao QW, Ma MQ and Sun Q:
The E3 ligase UBR5 regulates gastric cancer cell growth by
destabilizing the tumor suppressor GKN1. Biochem Biophys Res
Commun. 478:1624–1629. 2016. View Article : Google Scholar : PubMed/NCBI
|
|
28
|
Yoon JH, Choi WS, Kim O, Choi BJ, Nam SW,
Lee JY and Park WS: Gastrokine 1 inhibits gastric cancer cell
migration and invasion by downregulating RhoA expression. Gastric
Cancer. 20:274–285. 2017. View Article : Google Scholar
|
|
29
|
Kim O, Yoon JH, Choi WS, Ashktorab H,
Smoot DT, Nam SW, Lee JY and Park WS: Gastrokine 1 inhibits
gastrin-induced cell proliferation. Gastric Cancer. 19:381–391.
2016. View Article : Google Scholar
|
|
30
|
Xing R, Cui JT, Xia N and Lu YY: GKN1
inhibits cell invasion in gastric cancer by inactivating the
NF-kappaB pathway. Discov Med. 19:65–71. 2015.PubMed/NCBI
|
|
31
|
Wu W, Juan WC, Liang CR, Yeoh KG, So J and
Chung MC: S100A9, GIF and AAT as potential combinatorial biomarkers
in gastric cancer diagnosis and prognosis. Proteomics Clin Appl.
6:152–162. 2012. View Article : Google Scholar : PubMed/NCBI
|
|
32
|
Kong Y, Zheng Y, Jia Y, Li P and Wang Y:
Decreased LIPF expression is correlated with DGKA and predicts poor
outcome of gastric cancer. Oncol Rep. 36:1852–1860. 2016.
View Article : Google Scholar : PubMed/NCBI
|
|
33
|
Wang D, Yu X and Wang X: High/positive
expression of 5-fluorouracil metabolic enzymes predicts better
response to S-1 in patients with gastric cancer: A meta-analysis.
Int J Biol Markers. 31:e101–e109. 2016. View Article : Google Scholar : PubMed/NCBI
|
|
34
|
Hunt RH, Camilleri M, Crowe SE, El-Omar
EM, Fox JG, Kuipers EJ, Malfertheiner P, McColl KE, Pritchard DM,
Rugge M, et al: The stomach in health and disease. Gut.
64:1650–1668. 2015. View Article : Google Scholar : PubMed/NCBI
|
|
35
|
Di Mario F and Goni E: Gastric acid
secretion: Changes during a century. Best Pract Res Clin
Gastroenterol. 28:953–965. 2014. View Article : Google Scholar : PubMed/NCBI
|
|
36
|
Martinsen TC, Bergh K and Waldum HL:
Gastric juice: A barrier against infectious diseases. Basic Clin
Pharmacol Toxicol. 96:94–102. 2005. View Article : Google Scholar : PubMed/NCBI
|
|
37
|
Modlin IM, Sachs G, Wright N and Kidd M:
Edkins and a century of acid suppression. Digestion. 72:129–145.
2005. View Article : Google Scholar : PubMed/NCBI
|
|
38
|
Wagner CA and Geibel JP: Acid-base
transport in the collecting duct. J Nephrol. 15(Suppl 5):
S112–S127. 2002.PubMed/NCBI
|
|
39
|
Alper SL: Genetic diseases of acid-base
transporters. Annu Rev Physiol. 64:899–923. 2002. View Article : Google Scholar : PubMed/NCBI
|
|
40
|
Li JH, Han L, Du TP and Guo MJ: The effect
of low-nitrogen and low-calorie parenteral nutrition combined with
enteral nutrition on inflammatory cytokines and immune functions in
patients with gastric cancer: A double blind placebo trial. Eur Rev
Med Pharmacol Sci. 19:1345–1350. 2015.PubMed/NCBI
|
|
41
|
Ishizuka M, Oyama Y, Abe A, Tago K, Tanaka
G and Kubota K: Prognostic nutritional index is associated with
survival after total gastrectomy for patients with gastric cancer.
Anticancer Res. 34:4223–4229. 2014.PubMed/NCBI
|
|
42
|
Tegels JJ, De Maat MF, Hulsewé KW,
Hoofwijk AG and Stoot JH: Improving the outcomes in gastric cancer
surgery. World J Gastroenterol. 20:13692–13704. 2014. View Article : Google Scholar : PubMed/NCBI
|
|
43
|
Sun K, Chen S, Xu J, Li G and He Y: The
prognostic significance of the prognostic nutritional index in
cancer: A systematic review and meta-analysis. J Cancer Res Clin
Oncol. 140:1537–1549. 2014. View Article : Google Scholar : PubMed/NCBI
|
|
44
|
Kang C, Song JJ, Lee J and Kim MY:
Epigenetics: An emerging player in gastric cancer. World J
Gastroenterol. 20:6433–6447. 2014. View Article : Google Scholar : PubMed/NCBI
|